Embed Size (px)
Citation preview

Journal of Psychological Type Volume 40, 1997
Copyright © 1997 by Thomas G. Carskadon, Editor /Publisher
Applications of Psychological Type Thomas G. Carskadon, Editor
A new, separate Journal section is coming; articles and review board candidates are sought. . . page 2
An MBTI Model of Entrepreneurism and Bureaucracy: The Psychological Types of Business Entrepreneurs Compared to Business Managers and Executives
James H. Reynierse A theory of en trepreneurism and bureaucracy
is presented and confirmed that identifies the J-p preference as primary, and other preferences as subordinate: P is associated with entrepreneurism, and J with bureaucracy. . page 3
Rebelliousness and Psychological Distress In a Sample of Introverted Veterans
Gerald D. Otis John L. Louks
INTP and ISTP veterans appear to be more rebellious, less affected by phobic symptoms, and more likely to be diagnosed with combat-related post-traumatic stress disorder; ISFJ veterans show the least rebelliousness, and ISFPs seem to experience the most psychological distress and phobic symptoms. page 20
Relationships Between the MBTI and Selected Aspects of Tinto's Model for College Attrition
K. Terry Schurr Virgil Ruble Catherine Palomba Brian Pickerill Deborah Moore
A thorough and fascinating study of a major university entering class shows how type relates to degree completion directly, and how type relates to other variables known to impact degree completion, including a look at how different types are drawn to different campus environments and subcultures, and what effects these have; many results confirm various theories, but there are also some surprises.
.. .. ..
Index of All Articles, Journal of Psychological Type Volumes 2-40 Special Offers on Back Issues, Complete Sets, and Subscriptions
. page 31
page 43 page 48

Applications of Psychological Type
Tom Carskadon, Editor/Publisher Mississippi State University
A new, separate Journal section is coming; articles and review board candidates are sought.
Announcement and Invitation An Idea Whose Time Has Come. In recent
years, APT members and officers have expressed a desire for a journal of applications of psychological type; and each time, your Editor/Publisher has said that we already have an applications journal: the Journal of Psychological Type. Despite this fact, there continues to be a perception in the minds of some that the Journal exists for research, not applications. There is also the perception that our rigorous review process may be-or may appear to be--too daunting to authors not accustomed to writing for scholarly publications. Although these perceptions are for the most part inaccurate, they are so widespread and persistent that it seemed time to take bold action.
The Plan. The Editor/Publisher has proposed and the APT Board has accepted a plan to create a "journal within a journal," to be called Applications of Psychological Type. It will begin as a section of the Journal of Psychological Type. If volume warranted, Applications of Psychological Type could be published in separate issues, alternating with the Journal of Psychological Type. The total number of journal issues APT members receive would not change--i.e., there will still be four total each year. Applications of Psychological Type will have its own, separate, review board, review procedures, and publication priorities. These are being worked out in cooperation with APT.
Review Board Members Needed. We will need a review board consisting of leading practitioners of psychological type, with the requisite practical experience, academic credentials, and knowledge of psychological type to serve as review board members. You must be willing to provide careful, prompt reviews of articles submitted to Applications of Psychological Type. If you would like to volunteer to be considered for appointment to this editorial review board, please send a vita along with a short statement of your interest and qualifications to: Dr. Tom Carskadon, Editor/Publisher, Journal of Psychological Type, P.O. Box 6161, Mississippi State, MS 39762.
Page 2 Journal of Psychological Type, Vol. 40, 1997
Call for Articles. We have heard many times that there are people who would like to write about type applications, but do not have a suitable outlet for their work. Now there is such an outlet. Well written applications articles in any area of psychological type are welcomed for consideration. Please follow the Instructions to Authors on the inside back cover of this Journal. This is your chance to put your work and ideas in front of the entire type community; we would be delighted to showcase your article in a professional publication that will reach all 5,000-6,000 members of the Association for Psychological Type and will also appear in permanent bound volumes in libraries across the country and even internationally.
A New Award for Applications Articles. To help stimulate and recognize the submission of high quality applications articles, we are establishing a prestigious new award, the Journal of Psychological Type Award for Outstanding Applications of Psychological Type as described in a published article. The deadline for submissions has been extended to May 15, 1997, but it cannot be extended beyond that. The winner will be announced at the APT XII 1997 International Conference and will receive a $500 cash award and a handsome plaque to commemorate the occasion. (We reserve the right to cancel the award if insufficient meritorious entries are received.)
Where to Send Articles. All entries must be original articles and submitted for publication in the Applications of Psychological Type section of the Journal and must go through the review process to be established. Please submit applications articles to the Editor /Publisher, and if they are to be considered for the award as well as for publication, please specifically state this in your letter of submission. Send all article and/or award submissions to: Dr. Tom Carskadon, P.O. Box 6161, Mississippi State, MS 39762. If you have any questions or need any further assistance, please call us at (601) 325-7655. We hope that many of you will participate in this opportunity.

An MBTI Model of Entrepreneurism and Bureaucracy: The Psychological Types of Business Entrepreneurs Compared to Business Managers and Executives
James H. Reynierse James H. Reynierse & Associates, Inc.
A theory of entrepreneurism and bureaucracy is presented and confirmed that identifies the
J-p preference as primary, and other preferences as subordinate: P is associated with entrepreneurism, and J with bureaucracy.
Abstract
Two independent samples of 135 and 159 entrepreneurs were compared to samples of small business owners, business managers, and business executives. As predicted by theory, for every comparison, entrepreneurs had significantly higher levels of P and lower levels of J. In addition, entrepreneurs had consistently more entrepreneurial EPs, NPs, and TPs, but fewer bureaucratic IJs, SJs, and FJs. Most importantly, when compared to business executives, there were no differences on the S-N preference, but, as predicted, entrepreneurs had more NPs but fewer NJs. The results were interpreted as strong support for the presented theory of entrepreneurism and bureaucracy, whereas the alternative theory of entrepreneurs as NTs was rejected.
Although entrepreneurship is usually identified with the creation of new businesses (e.g., Gartner, 1988), many view this as too restrictive (e.g., Drucker, 1985; Herron, 1992; Pinchot, 1985; Sexton & BowmanUpton,1991). For business organizations, the issues were framed explicitly by Carland, Hoy, Boulton, and Carland (1984), Carland, Hoy, and Carland (1988), and Gartner (1988). Although each lamented the lack of uniformity and often vague definitions of entrepreneurship encountered in the entrepreneurial literature, Gartner argued that entrepreneurship is the creation of new organizations, and the entrepreneur is part of the complex process of new venture creation. Thus, Gartner was particularly critical of trait approaches to entrepreneurship.
In contrast, Carland et al. (1984), Carland et al. (1988), and Carland, Carland, Hoy, and Boulton (1988) viewed entrepreneurial ventures as characterized by profitability and growth goals and by innovative strategic practices. The Carlands argued that entrepreneurs are distinguishable by both type and conduct and that trait (or, broadly, personality) approaches have value for understanding entrepreneurship. Similarly, Ginn and Sexton (1990) identified strategic planning, particularly the founder's involvement in the planning process, as central to sustained growth in entrepreneurial
ventures. Sexton and Bowman-Upton (1991) saw entrepreneurship as "an approach to general management that is based on opportunity recognition and explOitation" (p. 12) as a means of achieving growth and change. It was their view that entrepreneurs exist in all walks of life and are the "movers and shakers" of many endeavors.
Drucker (1985) addressed the misconception that an entrepreneur is someone who starts his own new business, and argued instead for the entrepreneur as a broad-based change agent. For Drucker, the entrepreneur "creates something new, something different; they [sic] change or transmute values" (p. 22). He noted the historical context of the term entrepreneur, first as coined by the French economist J. B. Say, where it "was intended as a manifesto and as a declaration of dissent; the entrepreneur upsets and disorganizes" (p. 26), and second in Schumpeter's (1934) terms, where the entrepreneur's task is "creative destruction." Stevenson and Harmeling's (1990) view that entrepreneurism requires chaotic forces for change, that are fundamentally destabilizing, is also within this tradition.
The emphasis on strategic practices and strategic planning embraces such a change-based view of entrepreneurship. This approach includes not only the new business creator but also corporate intrapreneurs
Journal of Psychological Type, Vol. 40,1997 Page 3

(Herron, 1992; Kanter, 1983, 1989; Pinchot, 1985; Sexton & Bowman-Upton, 1991), inventors (Forsgren, 1990), or even different forms of business entrepreneurs (Vesper, 1980), and it is in sharp contrast to the limited view of entrepreneurship espoused by Gartner (1988).
Empirical Background. The Carlands (Carland & Carland, 1992; Carland, Carland et al., 1988) administered the MBTI and an independent innovation scale to samples of entrepreneurs, small business owners, and managers. They found that entrepreneurs scored higher on the innovation scale than small business owners did, and this was consistent with the NT temperament of entrepreneurs and SJ temperament of both small business owners and managers. Although the Carlands' discussion centered on entrepreneurs as innovative NTs, their empirical results pointed to an important role for the P dimension as well. Thus, Carland, Carland et al. found that entrepreneurs tended to be NTP, whereas small business owners tended toward SFJ. Using continuous scores, Carland and Carland found that although the J preference characterized each group, the manager and small business owner groups were more strongly J than were the entrepreneurs. Similarly, Ginn and Sexton (1988, 1990) found a relatively high percentage of Ps (46%) among entrepreneurial company founders. They also found that fast growth entrepreneurs showed significantly higher N, P, and NP orientations than slow growth founders or managers.
Recently, Reynierse (Reynierse, 1995; Reynierse & Harker, 1995) suggested that the MBTI is particularly useful for examining both entrepreneurism and bureaucracy. According to this view, the P preference is fundamental for initiating change (entrepreneurism), whereas the J preference characteristically promotes stability and resists change (bureaucracy). In other words, the P preference is linked to theories of chaos and change, whereas the J preference is linked to theories of stability and equilibrium (Stevenson & Harmeling, 1990).
Reynierse and Harker (1995) cited several studies (summarized in Table 1) that provide empirical support for this interpretation of the J-p preference and presented a new study in which there was a higher frequency of Ps among staff managers than line managers. Although such results are consistent with both theory and the roles of staff and line managers in large, bureaucratic companies, a more decisive test requires an analysis of business entrepreneurs compared to business managers and executives.
The present paper has two primary objectives: (1) to develop further and present a unified theoretical rationale for an MBTI-based interpretation of bureaucracy and entrepreneurship; (2) to make several highly specific predictions and comparisons from
Page 4 Journal of Psychological Type, Vol. 40,1997
such a theory for growth-oriented business entrepreneurs compared to small business owners, managers, and executives.
Theoretical Foundations. The theoretical basis for this research can be summarized in three propositions:
1. The J-p preference represents a broad continuum of bureaucracy and entrepreneurism in which the entrepreneurial P preference tends to initiate and promote change, whereas the bureaucratic J preference tends to encourage the established order and resist change.
This interpretation of the J-p preference and the empirical support for it were introduced by Reynierse (1995) and Reynierse and Harker (1995). Although the J-p preference is often viewed as subordinate to and derived from the perceptual (S-N) and judging (T -F) processes, this proposition explicitly assumes that the J-p dimension has independent status with properties of its own. This interpretation does not discount the role of J-p for determining the dominant process (Myers & McCaulley, 1985). Such a view is congruent with the descriptive scales of the EAR profile (Saunders, 1989) and the factor structure of MBTI scales (Johnson & Saunders, 1990; Tischler, 1994).
2a. To the extent that the entrepreneurial P preference is reflective of the perceptual process, either 5 or N, there should be two distinct classes of entrepreneurs, consisting of highly expedient 5P opportunists in relatively conventional, traditional ventures, and highly innovative or visionary NP opportunists who are on the cutting edge of their industry groups.
Although both SP and NP entrepreneurs take an adaptable, flexible approach that keeps options open, the SP entrepreneur focuses on immediate opportunity that contrasts with the more strategic, future orientation of NP entrepreneurs. In this context, the form of opportunity recognition distinguishes the SP and NP entrepreneurial types.
2b. To the extent that bureaucracy is the opposite of entrepreneurism, as a corollary there should be two distinct classes of bureaucrats: highly practical 5Js who are particularly attentive to operating detail; and innovative and visionary NJs who provide strategic leadership for their organizations.
This relationship is already established, as SJ predominates for lower levels of management in which day-to-day administrative or operational duties are primary, whereas NJ increases markedly and predominates at executive levels of management in which strategic issues become important (Reynierse, 1993; Roach, 1986).
3. Although the J-p preference is presumed to be primary for determining bureaucratic and entrepreneurial activity, it is enhanced or diminished by the other preferences: E, N, and T enhance entrepreneurial but diminish bureaucratic tendencies, whereas I, 5, and F enhance

Table 1. Comparison of Entrepreneurial and Bureaucratic Traits and Summary of Empirical Results for Each of the Four Preferences.
MBTI Entrepreneurial Bureaucratic Empirical Preferences Traits Traits Results References
E-I Outward-direct- Inwar- directed Entrepreneurs Fasiska (1992) ed focus toward focus toward the more extraverted new products, established orga- than managers. emerging mar- nization and its kets and oppor- practices, prod- Entrepreneurs Carland & tunities. ucts, and mar- more frequently Carland (1992)
kets. E than both man-agers and small business owners.
S-N Innovative strate- Practical opera- Entrepreneurs Fasiska (1992) gic focus empha- tional focus em- are highly inno-sizing future pos- phasizing present vative, whereas sibilities. circumstances. executives are
more functional.
Entrepreneurs Fasiska (1992) have better idea-generation and strategy develop-ment skills than executives.
Entrepreneurs Carland & more frequently Carland (1992) N than managers. Ginn & Sexton
(1990) Entrepreneurs more frequently Carland, N than small Carland, Hoy, & business owners. Boulton (1988)
Entrepreneurial Sexton & majors score high Bowman (1985) on a scale of in-novation.
T-F Tough-minded, Tender-minded, Entrepreneurs Carland & impersonal, non- personal, caring, and managers are Carland (1992) accommodating and accommo- more frequently approach to deci- dating approach Tthan small sion-making. to decision- business owners.
making. Entrepreneurs Sexton & have lower suc- Bowman (1984) corance scores Sexton & than managers. Bowman-Upton
(1986)
Journal of Psychological Type, Vol. 40, 1997 Page 5

T-F (continued)
J-p Unstructured, adaptable, rebellious toward authority, will break the rules, and tends to initiate change.
Structured, planful, respectful of authority, obeys the rules, and tends to resist change.
Page 6 Journal of Psychological Type, Vol. 40,1997
Management at all levels have high frequencies ofT.
Management at all levels have high frequencies of].
Executives are effective planners, whereas entrepreneurs are more option oriented.
Entrepreneurs have relatively high levels of P.
Creative individuals have high levels of P.
Traits such as order, autonomy, independence, change, rebelliousness, impulsiveness, and willingness to take direction reflect the joint effects of 5-N andJ-P.
Entrepreneurs score high on a scale of change
Entrepreneurs scores higher on a scale of change than managers.
Entrepreneurial majors score high on scales of autonomy and change but low on a scale of conformity.
Reynierse (1993) Roach (1986)
Reynierse (1993) Roach (1986)
Fasiska (1992)
Carland & Carland (1992); Carland, Carland, Hoy, & Boulton (1988); Ginn and Sexton (1988,1990)
Thorne & Gough (1991)
Thorne & Gough (1991); Myers & McCaulley (1985)
Sexton & Ginn (1996)
Sexton & Bowman-Upton (1986)
Sexton & Bowman (1985)

bureaucratic but diminish entrepreneurial tendencies (Reynierse, 1995). Therefore, entrepreneurs should be more frequently EP, NP, and TP and less frequently IJ, 5J, and FJ than non-entrepreneurs.
The rationale and empirical support for the various distinctions are summarized in Table 1. However, business management does not represent an ideal or pure form of bureaucracy, as business management in large American companies is characteristically high for both E and T (Reynierse, 1993), making comparisons for these preferences or pairs conservative tests of the broader theory.
In summary, within the theoretical framework outlined, the P preference is identified as the primary contributor to entrepreneurism in Proposition 1, the N preference receives secondary status in Proposition 2, whereas Proposition 3 endows the E and T preferences with equivalent, tertiary status. Similarly, the J preference is identified as the primary contributor to bureaucracy in Proposition 1, the 5 preference receives secondary status in Proposition 2, and the I and F preferences receive tertiary status in Proposition 3.
Method
Subjects. The subjects were independent samples of entrepreneurs and small business owners reported by Carland and Carland (1992), Carland, Carland et al. (1988), and Ginn and Sexton (1988, 1990). The Carland and Carland sample included 114 entrepreneurs and 348 small business owners, and Carland, Carland et al. included 21 entrepreneurs and 56 small business owners. Because both studies included the same rationale for distinguishing entrepreneurs from small business owners, they were combined into one sample of 135 entrepreneurs (the small firm sample) and 404 small business owners. Because the samples were collected through personal approaches, more than 80% of the approached individuals agreed to participate.
In contrast to the Carland's relatively small entrepreneurial companies as measured by both number of employees and annual sales, Ginn and Sexton (1988, 1990) provided a sample of 159 (25.8%) founders or cofounders from Inc. magazine'S 1986 list of the 500 fastest growing private companies in the United 5tates (the fast growth sample). Thus, although both samples operationalized the entrepreneur in terms of growth objectives, the Ginn and Sexton sample also incorporated elements of success and was based on measurable performance, whereas the Carlands' sample was based on the judgments of the raters.
The comparative samples consisted of three independent groups of managers or executives and included the Carland and Carland (1992) sample of 387
undifferentiated managers from large, publicly held organizations and the Reynierse (1993) multi-source sample of 1,024 lower-level managers and 479 executives.
Procedure. The subjects completed the MBTI, and their individual types were determined. The Carland samples (Carland & Carland, 1992; Carland, Carland et al., 1988) were based on the abbreviated version of the MBTI, Ginn and Sexton (1988, 1990) used Form G, and Reynierse (1993) used both Form F and Form G, depending on the circumstances and individual sample.
The principle data and analyses used were frequency and percentage of types, letter preferences, and pair preferences. Type distributions are provided as type tables with SRTT analyses (McCaulley, 1985). Chi-square values and SRTT comparisons were independent in that the distribution of type for various entrepreneurial, small business owner, and management groups were compared directly.
Analyses were completed in three parts. First, because Carland and Carland (1992) only provided an analysis of continuous scores for the four temperaments for each of their groups, SRTT analyses were completed for these groups. Second, because their manager group did not differentiate managers by levels, and this analysis makes differential predictions based on management level, 5RTT comparisons were made between the Carlands' entrepreneurs and small business owner groups and Reynierse's lower-level managers and executives. Third, because the Ginn and Sexton (1988, 1990) sample of fast growth, successful entrepreneurs is very different from the small firm entrepreneurs of Carland and Carland, 5RTT comparisons were made between Ginn and Sexton's entrepreneurs and Reynierse's lower-level managers and executives.
Results
Table 2 summarizes the dichotomous preferences for the small firm entrepreneurial, fast growth entrepreneurial, small business owner, and various management groups. Inspection of these data indicates several distinct trends. First, the two entrepreneurial groups are different for the E-I preference, with the Ginn and Sexton (1988, 1990) sample of fast growth entrepreneurs more introverted than any of the other groups. Second, the entrepreneurial groups show the highest levels of N, whereas the executive group is intermediate. Conversely, small business owners and the manager groups have the highest levels of the S preference. Third, the small firm entrepreneurs and small business owners have higher levels of F relative to the other groups and are clearly distinct from the fast growth entrepreneurs
Journal of Psychological Type, Vol. 40, 1997 Page 7

Table 2. Preferences for Carland and Carland (1992) and Ginn and Sexton (1988, 1990) Entrepreneurs, Small Business Owners, and Managers, and Reynierse (1993) Managers and Executives.
Preference Carland & Ginn & Carland & Carland Sexton Fast Carland Small Firm Growth Small Bus.
Entrepreneurs Owners n = 135 n = 159 n=404
E 71.8% 46.5% 60.6% I 28.2% 53.5% 39.4%
S 40.0% 40.2% 60.6% N 60.0% 59.8% 39.4%
T 68.9% 86.8% 55.7% F 31.1% 13.2% 44.3%
J 48.2% 54.1% 59.2% P 51.8% 45.9% 40.8%
and executives, who have very high levels of T. Fourth, the entrepreneurs have the highest levels of the P preference, followed by the small business owners. In contrast, managers and executives are consistently high on J.
Carland and Carland Comparisons. Frequency of letter preferences, preference pairs, and percentages for the Carlands' (Carland and Carland, 1992; Carland, Carland et al., 1988) small firm entrepreneurs compared to their small business owners and managers are presented in Table 3. Comparisons of their small business owners and managers are presented in Table 4. The type table for the small firm entrepreneurs is in Table 5.
The comparison of entrepreneurs and small business owners in Table 3 indicates that N, T, and P were overrepresented for entrepreneurs, whereas Sand F were underrepresented compared to the small business owners. Although only of casual interest for these comparisons, entrepreneurs were significantly overrepresented for the critical EP, NP, and TP pairs but significantly underrepresented for the bureaucratic II, SJ, and FJ pairs. Compared to managers, Es, Ns, and Ps were overrepresented for entrepreneurs, whereas Is, Ss, and Js were underrepresented. Entrepreneurs were significantly overrepresented for the critical EP, NP, and TP pairs, but significantly underrepresented for II and SJ.
Inspection of Table 5 indicates that 11 of 38 Is (29.0%) were INTPs, 4 of 54 Ss (7.4%) were ESTPs, and 20 of 42 Fs (47.6%) were ENFPs. E-TJ tended to predominate, as 22 of 54 S entrepreneurs (40.7%) were ES1}s.
The comparison of small business owners and
Page 8 Journal of Psychological Type, Vol. 40,1997
Carland & Reynierse Reynierse Carland
Lower-Level Managers Managers Executives n=387 n = 1,024 n=479
53.9% 60.4% 59.7% 46.1% 39.6% 40.3%
59.3% 65.8% 46.1% 40.7% 34.2% 53.9%
74.2% 80.0% 86.6% 25.8% 20.0% 13.4%
64.4% 76.9% 75.8% 35.6% 23.1% 24.2%
managers in Table 4 indicates that for small business owners, Fs were overrepresented, whereas Is and Ts were underrepresented compared to the managers. Although clearly differing on the T-F preference, the small business owner appears to be intermediate to the entrepreneurs and the managers.
Carland's Data Comparisons with Reynierse (1993). Frequency of type, letter preferences, preference pairs, and percentages for the Carlands' small firm entrepreneurs compared to Reynierse's (1993) lower-level managers are presented in Table 5. For the entrepreneurs, Es, Ns, Fs, and Ps were overrepresented, whereas Ss and J s were underrepresented. Again, the critical EP, NP, and TP pairs were all significant and were overrepresented for entrepreneurs, but IJ and SJ were underrepresented for that group. Both ENFPs and ENTPs were overrepresented compared to lower-level managers.
Table 4 compares small business owners with lower-level managers. Small business owners were overrepresented for F and P but underrepresented for T and J compared to these lower-level managers. Almost all of the pairs were significant. The critical EP, NP, and TP pairs were significantly overrepresented, whereas the II and SJ pairs were underrepresented. FJ was significantly overrepresented among small business owners, reflecting the relatively large frequency of Fs (44.3%) among small business owners.
Table 6 compares the Carlands' small firm entrepreneurs with Reynierse's executive sample. For the entrepreneurs, Fs and Ps were overrepresented, whereas Is, Ts, and Js were underrepresented compared to executives. Again, the critical EP, NP,

Table 3. Significant Types of Carland and Carland (1992) Small Firm. Entrepreneurs and SRIT Comparisons with Carland and Carland Small Business Owners and Managers.
N=135 1 = Selection Ratio Index *p < .05 **p < .01 ***p < .001
Small Business Owners Managers INTP 1 = 3.67* ISTJ 1 = 0.23*
Dichotomous Preferences Dichotomous Preferences
E 97 (71.8%) 1 =1.17 E 97 (71.8%) **1 = 1.33 I 38 (28.2%) 1= 0.73 I 38 (28.2%) **1 = 0.60
5 54 (40.0%) **1 = 0.65 5 54 (40.0%) **1 = 0.68 N 81 (60.0%) ***1=1.56 N 81 (60.0%) ***1=1.45
T 93 (68.9%) *1=1.24 T 93 (68.9%) 1 = 0.92 F 42 (31.1%) *1=0.70 F 42 (31.1 %) 1 = 1.20
J 65 (48.2%) 1= 0.80 J 65 (48.2%) *1 = 0.75 P 70 (51.8%) *1 = 1.30 P 70 (51.8%) **1 = 1.43
Pairs and Temperaments Pairs and Temperaments
IJ 18 (13.3%) **1 = 0.53 IJ 18 (13.3%) ***1=0.41 IP 20 (14.8%) 1= 1.11 IP 20 (14.8%) 1 = 1.05 EP 50 (37.0%) *1 = 1.39 EP 50 (37.0%) ***1 = 1.67 EJ 47 (34.8%) 1=1.00 EJ 47 (34.8%) 1 = 1.09
ST 38 (28.1%) 1=0.79 ST 38 (28.1%) ***1 = 0.58 SF 16 (11.9%) **1= 0.46 SF 16 (11.9%) 1 = 1.07 NF 26 (19.3%) 1= 1.04 NF 26 (19.3%) 1= 1.30 NT 55 (40.7%) ***1 = 2.04 NT 55 (40.7%) **1= 1.53
SJ 40 (29.6%) **1 = 0.63 SJ 40 (29.6%) **1= 0.62 SP 14 (10.4%) 1= 0.70 SP 14 (10.4%) 1= 0.93 NP 56 (41.5%) ***1 = 1.65 NP 56 (41.5%) ***1 = 1.65 NJ 25 (18.5%) 1 = 1.39 NJ 25 (18.5%) 1 = 1.14
TJ 50 (37.0%) 1=1.09 TJ 50 (37.0%) *1 = 0.71 TP 43 (31.8%) **1 = 1.48 TP 43 (31.8%) *1 = 1.39 FP 27 (20.0%) 1 = 1.08 FP 27 (20.0%) *1 = 1.50 FJ 15 (11.1%) ***1=0.43 FJ 15 (11.1 %) 1 = 0.88
IN 20 (14.8%) 1 = 1.54 IN 20 (14.8%) 1 = 0.95 EN 61 (45.2%) ***1 = 1.56 EN 61 (45.2%) ***1 = 1.74 IS 18 (13.3%) ***1 = 0.46 IS 18 (13.3%) ***1 = 0.43 ES 36 (26.7%) 1 = 0.82 ES 36 (26.7%) 1 = 0.95
ET 63 (46.7%) *1 = 1.34 ET 63 (46.7%) 1 = 1.24 EF 34 (25.2%) 1 = 0.94 EF 34 (25.2%) *1 = 1.55 IF 8 ( 5.9%) **1 = 0.33 IF 8 ( 5.9%) 1 = 0.62 IT 30 (22.2%) 1 = 1.07 IT 30 (22.2%) **1 = 0.60
Note: Complete type tables and SRTT comparisons for the small business owner condition can be obtained by contacting the author.
Journal of Psychological Type, Vol. 40, 1997 Page 9

Table 4. Significant Types of Carland and Carland (1992) Small Business Owners and SRTT Comparisons with Carland and Carland Managers and Reynierse (1993) Lower-Level Managers.
(Note: Complete type tables and SR1T comparisons for the small business owner condition can be obtained by contacting the author.) N=135 [ = Selection Ratio Index *p < .05 **p < .01 ***p < .001
Carland & Carland Managers Reynierse Lower Managers ISFP [= 4.33*** ISFJ [= 2.50***
ESFJ [= 2.32*** INFP [= 3.80*** ENFP [= 2.36** ESTJ [= 0.47*** ESFJ [= 2.32* ......
Dichotomous Preferences Dichotomous Preferences
E 245 (60.6%) [ =1.12 E 245 (60.6%) [= 1.00
I 159 (39.4%) "'[=0.85 I 159 (39.4%) [= 0.99
S 245 (60.6%) [= 1.02 S 245 (60.6%) [= 0.92
N 159 (39.4%) [= 0.96 N 159 (39.4%) [= 1.15
T 225 (55.7%) ... * ... [ = 0.75 T 225 (55.7%) ......... [=0.70
F 179 (44.3%) ......... [ = 1.72 F 179 (44.3%) ......... [=2.21
J 239 (59.2%) [= 0.92 J 239 (59.2%) ... * ... [ = 0.77
P 165 (40.8%) [= 1.14 P 165 (40.8%) ......... [ = 1.77
Pairs and Temperaments Pairs and Temperaments
IJ 101 (25.0%) **[ = 0.76 IJ 101 (25.0%) "'[=0.81 IP 58 (14.4%) [= 1.05 IP 58 (14.4%) ***[ = 1.61 EP 107 (26.5%) [= 1.19 EP 107 (26.5%) ***[ = 1.84
EJ 138 (34.2%) [= 1.08 EJ 138 (34.2%) * ...... [ = 0.74
ST 142 (35.2%) ......... [ = 0.73 ST 142 (35.2%) ......... [ = 0.65
SF 103 (25.5%) ** ... [ = 2.19 SF 103 (25.5%) ......... [ = 2.24
NF 83 (20.5%) *1= 1.33 NF 83 (20.5%) ***1= 2.17 NT 76 (18.8%) *1= 0.77 NT 76 (18.8%) *1= 0.81
SJ 185 (45.8%) 1= 0.94 SJ 185 (45.8%) **1= 0.81 SP 60 (14.8%) *1= 1.33 SP 60 (14.8%) ***1= 1.58 NP 105 (26.0%) [= 1.05 NP 105 (26.0%) ***[ = 1.91
NJ 54 (13.4%) [= 0.83 NJ 54 (13.4%) * ... [ = 0.65
TJ 136 (33.7%) **"'[=0.65 TJ 136 (33.7%) * ...... [ = 0.52
TP 89 (22.0%) [= 0.96 TP 89 (22.0%) ...... *[ = 1.44
FP 76 (18.8%) -[= 1.46 FP 76 (18.8%) "'**[=2.45
FJ 103 (25.5%) ... **[ = 1.98 FJ 103 (25.5%) ***[ = 2.06
IN 42 (10.4%) *[= 0.69 IN 42 (10.4%) [= 0.93 EN 117 (29.0%) [= 1.13 EN 117 (29.0%) *[ = 1.26 IS 117 (29.0%) [= 0.92 IS 117 (29.0%) [= 1.02 ES 128 (31.7%) [= 1.12 ES 128 (31.7%) [= 0.85
ET 139 (34.4%) [= 0.90 ET 139 (34.4%) ***[ = 0.71 EF 106 (26.2%) **"'[=1.66 EF 106 (26.2%) ***[ = 2.21 IF 73 (18.1%) ***[=1.83 IF 73 (18.1 %) * ... *[ = 2.28 IT 86 (21.3%) **"'[=0.58 IT 86 (21.3%) ......... [ = 0.68
Page 10 Journal of Psychological Type, Vol. 40, 1997

Table 5. Type Distribution of Carland and Carland (1992) Small Firm Entrepreneurs and SRTT Comparisons with Reynierse (1993) Lower-Level Managers.
N = 135 + = 1 % of N 1 = Selection Ratio Index *p < .05 **p < .01 ***p < .001
ISTJ n=7 (5.2%) 1 = 0.26 +++++
ISTP n=5 (3.7%) 1 = 1.25 ++++
ESTP n=4 (3.0%) 1 = 0.80 +++
ESTJ n=22 (16.3%) 1 = 0.59 +++++ +++++ +++++ +
Jungian Types (E) n % Index
E-TJ 36 26.7 n.a E-FJ 11 8.2 n.a. ES-P 7 5.2 n.a. EN-P 43 31.8 n.a.
The Sixteen Complete Types
IS FJ n=4 (3.0%) 1= 0.80 +++
ISFP n=2 (1.5%) 1= 1.00 ++
ESFP n=3 (2.2%) 1 = 1.50 ++
ESFJ n=7 (5.2%) 1= 1.00 +++++
INFJ n=O (0.0%) 1 = 0.00
INFP n=2 (1.5%) 1 = 1.00 ++
ENFP n=20 (14.8%) 1 = 4.00*** +++++ +++++ +++++
ENFJ n=4 (3.0%) 1 = 1.33 +++
Jungian Types (I) Dominant Types n % Index n % Index
I-TP 16 11.8 n.a. Dt. T 52 38.5 n.a. I-FP 4 3.0 n.a. Dt. F 15 11.1 n.a. IS-J 11 8.2 n.a. Dt. S 18 13.3 n.a. IN-J 7 5.2 n.a. Dt. N 5037.0 n.a.
INTJ n=7 (5.2%) 1 = 1.00 +++++
INTP n = 11 (8.2%) 1 = 2.75 +++++ +++
ENTP n=23 (17.0%) 1 = 2.88*** +++++ +++++ +++++ ++
ENTJ n= 14 (10.4%) 1 = 0.93 +++++ +++++
Dichotomous Preferences
E I
97 (71.8%) 38 (28.2%)
*1=1.18 1=0.72
S N
54 (40.0%) ***1=0.61 81 (60.0%) ***1=1.76
T 93 (68.9%) 1=0.87 F 42 (31.1%) **1=1.50
J 65 (48.2%) ***1=0.63 P 70 (51.8%) ***1=2.19
Pairs and Temperaments
IJ IP EP EJ
18 (13.3%) 20 (14.8%) 50 (37.0%) 47 (34.8%)
ST 38 SF 16 NF 26 NT 55
(28.1%) (11.9%) (19.3%) (40.7%)
***1=0.44 *1=1.67
***1=2.50 1=0.76
***1=0.52 1=1.00
***1=2.17 ***1=1.62
S J 40 (29.6%) ***1=0.53 S P 14 (10.4%) 1=1.08 NP 56 (41.5%) ***1=2.95 NJ 25 (18.5%) 1=0.93
TJ TP FP
PI
IN EN IS ES
ET EF IF IT
50 (37.0%) 43 (31.8%) 27 (20.0%) 15 (11.1%)
20 (14.8%) 61 (45.2%) 18 (13.3%) 36 (26.7%)
63 (46.7%) 34 (25.2%) 8 (5.9%)
30 (22.2%)
***1=0.58 ***1=2.05 ***1=2.45
1=0.88
1=1.33 ***1=1.97 **1=0.47 *1=0.71
1=0.97 ***1=2.00
1=0.73 1=0.71
James H. Reynierse, An MBTI Model of
Entrepreneurism and Bureaucracy: The Psychological Types of Business Entrepreneurs
Compared to Business Managers and Executives.
Journal of Psychological Type, Vol. 40, 1997 Page 11

Table 6. Type Distribution of Carland and Carland (1992) Small Firm Entrepreneurs and SRTT Comparisons with Reynierse (1993) Executives.
N = 135 + = 1 % of N 1 = Selection Ratio Index *p < .05 **p < .01 ***p < .001
ISTJ n=7 (5.2%) 1= 0.33 +++++
ISTP n=5 (3.7%) 1 = 1.25 ++++
ESTP n=4 (3.0%) 1 = 1.33 +++
ESTJ n=22 (16.3%) 1 = 0.79 +++++ +++++ +++++ +
Jungian Types (E) n % Index
E-TJ 36 26.7 n.a. E-FJ 11 8.2 n.a. ES-P 7 5.2 n.a. EN-P 43 31.8 n.a.
The Sixteen Complete Types
ISFJ n=4 (3.0%) 1=4.00 +++
ISFP n=2 (1.5%) 1= 2.00 ++
ESFP n=3 (2.2%) 1= 3.00 ++
ESFJ n=7 (5.2%) 1= 1.75 +++++
Jungian Types (I) n % Index
I-TP 16 11.8 n.a. I-FP 4 3.0 n.a. IS-J 11 8.2 n.a. IN-J 7 5.2 n.a.
INFJ n=O (0.0%) 1=0.0
INFP n=2 (1.5%) 1 = 2.00 ++
ENFP n=20 (14.8%) 1 = 4.00*** +++++ +++++ +++++
ENFJ n=4 (3.0%) 1 = 1.33 +++
Dominant Types n % Index
Dt. T 52 38.5 n.a. Dt. F 15 11.1 n.a. Dt. 5 18 13.3 n.a. Dt. N 50 37.0 n.a.
Page 12 Journal of Psychological Type, Vol. 40,1997
INTJ n=7 (5.2%) 1 = 0.44 +++++
INTP n = 11 (8.2%) 1=1.38 +++++ +++
ENTP n=23 (17.0%) 1 = 2.88*** +++++ +++++ +++++ ++
ENTJ n = 14 (10.4%) 1 = 0.47 +++++ +++++
Dichotomous Preferences
E 97 (71.8%) 1=1.18 I 38 (28.2%) *1=0.72
5 54 (40.0%) 1=0.86 N 81 (60.0%) 1=1.13
T 93 (68.9%) *1=0.79 F 42 (31.1%) ***1=2.47
J 65 (48.2%) ***1=0.63 P 70 (51.8%) ***1=2.26
Pairs and Temperaments
IJ 18 (13.3%) ***1=0.46 IP 20 (14.8%) 1=1.43 EP 50 (37.0%) ***1=2.94 EJ 47 (34.8%) *1=0.72
ST 38 (28.1%) *1=0.68 SF 16 (11.9%) ***1=2.29 N F 26 (19.3%) ***1=2.60 N T 55 (40.7%) 1=0.89
5 J 40 (29.6%) 1=0.74 S P 14 (10.4%) 1=1.56 NP 56 (41.5%) ***1=2.55 NJ 25 (18.5%) ***1=0.50
TJ 50 (37.0%) ***1=0.53 TP 43 (31.8%) ***1=1.87 FP 27 (20.0%) ***1=3.38 FJ 15 (11.1%) *1=1.67
IN 20 (14.8%) EN 61 (45.2%) IS 18 (13.3%) ES 36 (26.7%)
1=0.77 *1=1.33 1=0.67 1=1.00
ET 63 (46.7%) 1=0.91 EF 34 (25.2%) ***1=2.62 IF 8 (5.9%) *1=2.00 IT 30 (22.2%) **1=0.61
James H. Reynierse, An MBTI Model of
Entrepreneurism and Bureaucracy; The Psychological Types of Business Entrepreneurs
Compared to Business Managers and Executives.

Table 7. Type Distribution of Ginn and Sexton (1988, 1990) Fast Growth Entrepreneurs and SRTT Comparisons with Reynierse (1993) Lower-Level Managers.
N = 159 + = 1 % of N 1 = Selection Ratio Index *p <.05 **p < .01 ***p < .001
ISTJ n=23 (14.5%) 1 = 0.72 +++++ +++++ +++++
ISTP n= 10 (6.3%) 1 = 2.00 +++++ +
ESTP n=9 (5.7%) 1 = 1.80 +++++ +
ESTJ n= 15 (9.4%) 1 = 0.34* +++++ ++++
The Sixteen Complete Types
ISFJ n=1 (0.6%) 1= 0.17 +
ISFP n=3 (1.9%) 1 = 1.00 ++
ESFP n=2 (1.3%) 1 = 0.67 +
ESFJ n=1 (0.6%) 1= 0.13 +
INFJ n=1 (0.6%) 1 = 0.33 +
INFP n=6 (3.8%) 1 = 3.00 ++++
ENFP n=2 (1.3%) 1 = 0.40 +
ENFJ n=5 (3.1%) 1 = 1.25 +++
Jungian Types (E) Jungian Types (I) Dominant Types n % Index n % Index n % Index
E-TJ 37 23.3 n.a. I-TP 33 20.8 n.a. Dt. T 7044.0 n.a. E-FJ 6 3.8 n.a. I-FP 9 5.7 n.a. Dt. F 15 9.4 n.a. ES-P 11 6.9 n.a. IS-J 24 15.1 n.a. Dt. S 35 22.0 n.a. EN-P 20 12.6 n.a. IN-J 19 12.0 n.a. Dt. N 3924.5 n.a.
INTJ n = 18 (11.3%) 1 = 2.25 +++++ +++++ +
INTP n=23 (14.5%) 1 = 4.60*** +++++ +++++ +++++
ENTP n = 18 (11.3%) 1 = 1.80 +++++ +++++ +
ENTJ n=22 (13.8%) 1 = 1.22 +++++ +++++ ++++
Dichotomous Preferences
E 74 (46.5%) *1=0.77 I 85 (53.5%) **1=1.35
S 64 (40.2%) ***1=0.61 N 95 (59.8%) ***1=1.76
T 138 (86.8%) F 21 (13.2%)
1=1.09 1=0.66
J 86 (54.1%) **1=0.70 P 73 (45.9%) ***1=1.97
Pairs and Temperaments
IJ IP EP EJ
43 (27.0%) 42 (26.4%) 31 (19.5%) 43 (27.0%)
ST 57 SF 7 NF 14 NT 81
(35.8%) ( 4.4%) ( 8.8%) (50.9%)
SJ SP NP NJ
TJ TP FP FJ
IN EN IS ES
ET EF IF IT
40 (25.2%) 24 (15.1%) 49 (30.8%) 46 (28.9%)
78 (49.1%) 60 (37.7%) 13 (8.2%) 8 (5.0%)
48 (30.2%) 47 (29.6%) 37 (23.3%) 27 (17.0%)
64 (40.2%) 10 (6.3%) 11 (6.9%) 74 (46.5%)
1=0.88 ***1=3.00
1=1.35 ***1=0.59
**1=0.66 **1=0.39
1=1.00 ***1=1.98
***1=0.44 *1=1.60
***1=2.23 *1=1.39
*1=0.76 ***1=2.50
1=1.08 **1=0.40
***1=2.67 1=1.27 1=0.82
***1=0.46
1=0.83 *1=0.53 1=0.84
***1=1.48
James H. Reynierse, An MBT! Model of
Entrepreneurism and Bureaucracy: The Psychological Types of Business Entrepreneurs
Compared to Business Managers and Executives.
Journal of Psychological Type, Vol. 40, 1997 Page 13

Table 8. Type Distribution of Ginn and Sexton (1988, 1990) Fast Growth Entrepreneurs and SRTT Comparisons with Reynierse (1993) Executives.
N = 159 + = 1 % of N I = Selection Ratio Index *p < .05 **p < .01 ***p < .001
ISTJ n=23 (14.5%) 1=0.96 +++++ +++++ +++++
ISTP n= 10 (6.3%) 1=2.50 +++++ +
ESTP n=9 (5.7%) 1=3.00 +++++ +
ESTJ n= 15 (9.4%) 1=0.45 +++++ ++++
The Sixteen Complete Types
IS FJ n=l (0.6%) 1= 1.00 +
ISFP n=3 (1.9%) 1= 1.50 ++
ESFP n=2 (1.3%) 1=2.00 +
ESFJ n=l (0.6%) 1=0.20 +
INFJ n=l (0.6%) 1=1.00 +
INFP n=6 (3.8%) 1=2.00 ++++
ENFP n=2 (1.3%) 1=0.33 +
ENFJ n=5 (3.1%) 1=1.67 +++
Jungian Types (E) Jungian Types (1) Dominant Types n % Index n % Index n % Index
E-TJ 37 23.3 n.a. I-TP 33 20.8 n.a. Dt. T 7044.0 n.a. E-FJ 6 3.8 n.a. I-FP 9 5.7 n.a. Dt. F 15 9.4 n.a. ES-P 11 6.9 n.a. IS-J 24 15.1 n.a. Dt.S 35 22.0 n.a. EN-P 20 12.6 n.a. IN-J 19 12.0 n.a. Dt. N 39 24.5 n.a.
Page 14 Journal of Psychological Type, Vol. 40, 1997
INTJ n = 18 (11.3%) 1=0.95 +++++ +++++ +
INTP n=23 (14.5%) 1=2.30 +++++ +++++ +++++
ENTP n= 18 (11.3%) 1=1.80 +++++ +++++ +
ENTJ n=22 (13.8%) 1=0.63 +++++ +++++ ++++
Dichotomous Preferences
E 74 (46.5%) *1=0.78 I 85 (53.5%) **1=1.33
S 64 (40.2%) 1=0.88 N 95 (59.8%) 1=1.10
T 138 (86.8%) F 21 (13.2%)
1=1.00 1=1.00
J 86 (54.1%) **1=0.71 P 73 (45.9%) ***1=1.92
Pairs and Temperaments
IJ 43 (27.0%) 1=0.96 IP 42 (26.4%) ***1=2.21 EP 31 (19.5%) *1=1.55 EJ 43 (27.0%) ***1=0.57
ST SF NF NT
SJ SP NP NJ
TJ TP FP
FJ
57 (35.8%) 7 (4.4%)
14 (8.8%) 81 (50.9%)
40 (25.2%) 24 (15.1%) 49 (30.8%) 46 (28.9%)
78 (49.1%) 60 (37.7%) 13 ( 8.2%) 8 (5.0%)
IN 48 (30.2%) EN 47 (29.6%) IS 37 (23.3%) ES 27 (17.0%)
ET 64 (40.2%) EF 10 (6.3%) IF 11 (6.9%) IT 74 (46.5%)
1=0.88 1=0.88 1=1.08 1=1.11
.... 1=0.63 ...... 1=2.40 ***1=1.69
1=0.81
**1=0.70 ***1=2.22
1=1.08 1=0.80
**1=1.50 1=0.89 1=1.16
*1=0.66
1=0.79 1=0.71 1=1.57
*1=1.30
James H. Reynierse, An MBT! Model of
Entrepreneurism and Bureaucracy: The Psychological Types of Business Entrepreneurs
Compared to Business Managers and Executives.

and TP pairs were all significantly overrepresented for entrepreneurs. The FJs' significant overrepresentation reflects the large number of Fs among the small firm entrepreneurs. Finally, both ENFPs and ENTPs were overrepresented compared to the executives.
Ginn and Sexton's Entrepreneurs. Frequency of types, letter preferences, preference pairs, and percentages for Ginn and Sexton's (1988, 1990) fast growth entrepreneurs compared to Reynierse's (1993) lower-level managers are presented in Table 7. For the entrepreneurs, Is, Ns, and Ps were significantly overrepresented, whereas Es, Ss, and Js were significantly underrepresented compared to the lower-level managers. Both NP and TP were overrepresented for entrepreneurs, and SJ and FJ were underrepresented. Inspection of Table 7 indicates that 23 of 85 Is (27.1 %) were INTPs, 9 of 64 Ss (14.1 %) were ESTPs, and 2 of 21 Fs (9.5%) were ENFPs. INTPs were significantly overrepresented for entrepreneurs.
Table 8 compares the fast growth entrepreneurs with the executives. For the fast growth entrepreneurs, Is and Ps were significantly overrepresented, whereas Es and Js were significantly underrepresented. Again, the critical EP, NP, and TP pairs were all significant and were overrepresented for entrepreneurs, whereas the SJ pair was underrepresented.
Finally, it is possible to examine the primary entrepreneurial P preference paired with the subordinate bureaucratic I, 5, and F preferences (i.e., the IP, SP, and FP pairs), as well as the primary bureaucratic J preference paired with the subordinate entrepreneurial E, N, and T preferences (i.e., the EJ, NJ, and TJ pairs). Although these are intermediate groups that are less sensitive and reliable tests of theory, the frequent finding throughout that entrepreneurs are generally overrepresented for IP, SP and FP but underrepresented for EJ, NJ, and 1J relative to business managers further supports the primacy of P for entrepreneurism and J for bureaucracy.
Discussion
The theoretical foundations of this research led to several testable hypotheses and predictions. For example, the hypothesis that there are higher levels of P and lower levels of J among business entrepreneurs compared to business managers was confirmed. For every comparison, whether it involved the Carlands' (Carland & Carland, 1992; Carland, Carland et al., 1988) small firm entrepreneurs or Ginn and Sexton's (1988, 1990) fast growth entrepreneurs, or whether it involved the Carland's sample of managers, Reynierse's (1993) lower-level managers, or Reynierse's executives, entrepreneurs were significantly higher for P but lower for J.
The hypothesis that business entrepreneurs will exhibit relatively high frequencies of E, N, T, and P received broad support with the Carlands' small firm entrepreneurs providing particularly striking confirmation. The overrepresentation of ENTPs (Table 5) is also supportive and is consistent with Fasiska's (1992) finding that the "start-up entrepreneur" is characteristically ENTP. Similarly, Ginn and Sexton's (1988, 1990) fast growth entrepreneurs had high levels of N and T, relatively high frequencies of P, but also showed a clear preference for I.
In addition, although there were a few exceptions related to the relatively high frequencies of Fs among the small firm entrepreneurs and the relatively high frequencies of Is among fast growth entrepreneurs, Es, Ns, and Ps tended to be overrepresented, whereas Is, Ss, and Js tended to be underrepresented when compared to samples of business managers. Again, this was the case regardless of business manager sample.
Predictions were also made based on the presumed contributions to entrepreneurism of each of the preferences. Collectively, these hypotheses stated that the primary P preference and any two of the subordinate contributors (E, N, or T) provide a sufficient type foundation for the expression of entrepreneurism.
The hypothesis that I entrepreneurs will tend to be NTP (INTP) received modest support, as both samples of business entrepreneurs had moderately high levels of INTP (27.1-29.0%), which was more frequent than in managerial samples. The significant overrepresentation of INTPs for fast growth entrepreneurs (Table 7) is also consistent with this prediction.
The hypothesis that 5 entrepreneurs will tend to be STP (ESTP) was disconfirmed, as little evidence was found for any form of SP entrepreneur. This hypotheSis was further weakened by the contrary finding that ESTJs tended to predominate (Table 4) among 5 entrepreneurs.
The hypothesis that F entrepreneurs will tend to be ENP (ENFP) received strong support for small firm entrepreneurs, which had an F bias, but not for fast growth entrepreneurs, where Ts predominated and Fs were infrequent. The significant overrepresentation of ENFPs for small firm entrepreneurs (Tables 5 & 6) is also consistent with this prediction.
It is interesting that F entrepreneurs are restricted to small entrepreneurial firms. This may reflect a more permissive, entrepreneurial spirit in small firms that is replaced by a more demanding TJ orientation in large, successful companies. Thus, Ginn and Sexton's (1988, 1990) successful, fast growth entrepreneurs are more strongly TJ than small firm entrepreneurs are. Similarly, although Fasiska's (1992) start-up entrepreneurs are ENTP, in entrepreneurial
Journal of Psychological Type, Vol. 40, 1997 Page 15
ventures that survive for at least 5 years, management has an ENTJ orientation (E. J. Fasiska, personal communication).
The present theory also makes specific predictions about the relationships of the subordinate contributors to entrepreneurism when paired with the primary P preference. The results for the critical entrepreneurial P pairs were unequivocal, as in every comparison, whether it involved the Carlands' (Carland & Carland, 1992; Carland, Carland et al., 1988) small firm entrepreneurs or Ginn and Sexton's (1988, 1990) fast growth entrepreneurs, or whether it involved the Carlands' sample of managers, Reynierse's lower-level managers, or Reynierse's executives, entrepreneurs were significantly higher for the entrepreneurial EP, NP, and TP pairs.
The corollary hypothesis emphasizes the relationships of the subordinate contributors to bureaucracy when paired with the primary J preference. Here bureaucracy is maximized for the IJ, SJ, and FJ pairs. As predicted for entrepreneurs, IJ and SJ were significantly underrepresented in almost every case, whereas FJ was significant only for the fast growth entrepreneurs compared to lower-level managers.
Empirical confirmation of these pair relationships is entirely consistent with the fundamental premises of this theory. Together, these pair relationships provide compelling empirical support for the primacy of P for entrepreneurism, the primacy of J for bureaucracy, and the subordinate nature of the other preferences.
In general, the predicted relationships apply regardless of level of managerial comparisons, and empirical confirmation for this is documented throughout. However, as a decisive exception to this, and taking into account the theoretical role of Nand P in entrepreneurism combined with the empirical fact that the frequency of N increases with management level in large, American companies (Reynierse, 1993; Roach, 1986)-i.e., both business entrepreneurs and business executives tend to be visionary Ns--this theory predicts that the effects for N should be attenuated when business entrepreneurs are compared to business executives. The combined effects of no significant differences for the S-N preference and the interactive effects for NP and NJ (Tables 6 and 8), in which entrepreneurs are overrepresented for NP but underrepresented for NJ only when compared to business executives (i.e., at the highest level of business management) provides maximum support for this hypothesis.
These predictions are particularly important, because they are clearly distinguished from alternative N or NT theories of entrepreneurism. The N and NT temperament theories predict differences for both N and NT, when in fact the results are otherwise, but are silent regarding the crucial (and predicted) NP
Page 16 Journal of Psychological Type, Vol. 40, 1997
and NJ differences. Although the present theory does not dispute the view that entrepreneurs are innovative NTs, it argues that this is subordinate to the primary P preference.
Note that within the current theoretical framework, N business executives are viewed as being more entrepreneurial than other forms of management. Perhaps acting and being entrepreneurial is advantageous within large, bureaucratic companies and contributes to managerial success and promotion to executive positions.
Within the entrepreneurial literature, entrepreneurism is distinguished from small business ownership. The results presented here clearly indicate that samples of entrepreneurs and samples of small business owners are different, and that these differences are meaningful within a theory of entrepreneurism. In general, small business owners tend to be intermediate compared to entrepreneurs and managers.
Finally, the pragmatic, expedient SP entrepreneur of Proposition 2 may be a special form of small business owner. The Significant overrepresentation of SP among small business owners (Table 4) is consistent with this hypothesis. Still, the absolute frequency of SPs ranged from only 10.4-15.1% among the various entrepreneurial and small business owner groups, percentages that are considerably less than expected. The prediction from theory is first a qualitative one in which SPs should predominate, and the present results do not pass this stricter, qualitative test.
The theory presented here identifies SPs, and particularly ESTPs, as a distinct form of entrepreneur, although the research presents scant evidence for it. The view of the SP entrepreneur is not new, as Bridges (1992) indicated that ESTP organizations have a somewhat entrepreneurial style, and Campbell (1994) cited a taxonomy in which ESTPs are identified as the ultimate entrepreneurs. Nevertheless, there appears to be a fundamental gap between the type communities' understanding of SPs and our empiricism. My experience is that SPs are reluctant participants in MBTI activities who only participate when completing MBTI materials is an imposed requirement. At best they are disinterested parties who tend to dismiss MBTI concepts. If my perception that SPs do not voluntarily participate in MBTI projects is accurate, then this raises potentially serious sampling error problems for any research that attributes theoretical Significance to SPs, for it is quite likely that they will be systematically underrepresented.
General Discussion
The theoretical framework and research presented here takes the view that entrepreneurs and bu-

reaucrats have fundamentally different mindsets that they bring to particular situations and that are not restricted to forming new business ventures or managing complex organizations. Rather, they represent the general case, with distinctive forms and applications in many situations. These mindsets reflect both distinctive qualities described by various MBTI preferences, combinations, and types, and some unique central nervous system organization that is peculiar to these preferences, combinations, and types (Lowen, 1982, 1984), which predisposes individuals to organize their perceptions and to behave in specific ways. As such, this approach provides the theoretical framework to address the inherent complexity of entrepreneurism and provides for different entrepreneurial typologies as suggested by Kao (1985).
The mindsets of business entrepreneurs and business managers are quite different and represent opposing perspectives of their worlds. Although these worlds are undoubtedly complex and comprise a large number of different entities and situations, each is still the source of the perceptions and impressions of people who interact with and are particularly knowledgeable about any particular world. Regardless of an entrepreneur's experiential domain, that set of personal experiences becomes the source for discovery, opportunity, and new directions. Thus, the entrepreneur has an external orientation that promotes opportunity recognition (E), tends to be innovative and can detect patterns and shifts (N), and is highly flexible, promoting an action orientation and responsiveness to change (P). By contrast, business managers in large bureaucratic organizations have an inward orientation toward their own practices (I), are particularly attentive to immediate events within their span of control and influence (S), and generally adhere to internal policies, structure, and plans, a commitment that is antagonistic to flexibility, action, and change (D. Such contrasting ways of perceiving, organizing, and making judgments about the world of everyday events reflects distinctions made between entrepreneurs and managers (e.g., Stevenson, 1985) and corresponds to the content areas that are addressed by the MBTI.
The inadequacy of conventional, mechanistic models of management and the need for alternatives is now well documented (e.g., Morgan, 1986). Peters (e.g., 1987, 1992) has been a frequent critic of traditional management practices and has argued for adaptability to fast-paced, changing business conditions and alternatives to the hierarchical structures of traditional, American business organizations. Reynierse and Harker (1995) discussed Peters' views and noted, "Using type terminology, these ideas represent an entrepreneurial P alternative to what has historically been a bureaucratic J enterprise" (p. 14).
Wheatley (1992) identified mechanistic models of
management with Newtonian models of science that emphasize deterministic, cause-and-effect relationships. As an alternative, she proposed a more freeflowing, participative or self-organizing, changebased management model reflective of the new science, i.e., quantum physics, chaos theory, etc. Again, using type terminology, it is the bureaucratic J model of management that is Newtonian and mechanistic. Wheatley exposed the illusion of control found in the hierarchical, Newtonian management practices that underlie bureaucracy and that strive to preserve stability in an environment characterized by disruption and perpetual change.
Wheatley (1992) called for managers to "stir the pot," to become "equilibrium busters." She noted, "No longer the caretakers of order, we become the facilitators of disorder. We stir things up and roil the pot, looking always for those disturbances that challenge and disrupt until, finally, things become so jumbled that we reorganize work at a new level of efficacy" (p. 116). This is the same entrepreneurial P behavior that leads to "Bonkers Organizations" or "Unglued Organizations" (Peters, 1992) when there is sympathetic top management, or to the cultural nonconformists and mavericks who have difficulty surviving and succeeding in conventional bureaucratic J organizations (Sathe, 1985).
Kao and Stevenson (1985) reminded us that "those who attempt to change existing paradigms test society's tolerance for the ambiguity that a paradigm shift entails. . .. So it may be with entrepreneurship" (p. 25). Although entrepreneurial P managers may be a source of discomfort within bureaucratic J organizations, in a business environment where change is perpetual and stability and control an illusion, they are probably essential for any organization to remain competitive.
References
Bridges, W. (1992). The character of organizations. Palo Alto, CA: Consulting Psychologists Press.
Campbell, S. (1994). Type, interpersonal needs, and European cultures. Bulletin of Psychological Type, 17(3),34-35.
Carland, J. c., & Carland, J. W. (1992). Managers, small business owners and entrepreneurs: The cognitive dimension. Journal of Business & Entrepreneurship, 4, 55-66.
Carland, J. W., Carland J. c., Hoy, P., & Boulton, W. R (1988). Distinctions between entrepreneurial and small business ventures. International Journal of Management, 5, 98-103.
Carland, J. W., Hoy, F., Boulton, W. R, & Carland, J. A. (1984). Differentiating entrepreneurs from small business owners: A conceptualization. Academy of Management Review, 9(2), 354-359.
Journal of Psychological Type, Vol. 40, 1997 Page 17

Carland, J. W., Hoy, F., & Carland, J. A. (1988). "Who is an entrepreneur?" is a question worth asking. American Journal of Small Business, 12(4), 33-39.
Drucker, P. F. (1985). Innovation and entrepreneurship. New York: Harper & Row.
Fasiska, E. J. (1992). Managerial type determination and its role in the development of an Entrepreneurial Quotient (EQ) instrument. International Journal of Value-Based Management,S, 17-37.
Forsgren, R A. (1990). Psychological types of casual inventors. Journal of Psychological Type,20,61-64.
Gartner, W. B. (1988). "Who is an entrepreneur?" is the wrong question. American Journal of Small Business, 12 (4), 11-32.
Ginn, C. W., & Sexton, D. L. (1988). Psychological types of Inc. 500 founders and their spouses. Journal of Psychological Type, 16, 3-12.
Ginn, C. W., & Sexton, D. L. (1990). A comparison of the personality type dimensions of the 1987 Inc. 500 company founders/CEOs with those of slower growth firms. Journal of Business Venturing, 5(3),313-326.
Herron, L. (1992). Cultivating corporate entrepreneurs. Human Resource Planning, 15,3-14.
Johnson, D. A., & Saunders, D. R (1990). Confirmatory factor analysis of the Myers-Briggs Type Indicator-Expanded Analysis Report. Educational and Psychological Measurement, 50, 561-571.
Kanter, R M. (1983). The change masters. New York: Simon and Schuster.
Kanter, RM. (1989). When giants learn to dance. New York: Simon and Schuster.
Kao, J. J. (1985). The corporate new wave: Entrepreneurism in transition. In J. J. Kao & H. H. Stevenson (Eds.), Entrepreneurism: What it is and how to teach it (pp. 76-88). Boston: Harvard Business School.
Kao, J. J., & Stevenson, H. H. (1985). The concept of entrepreneurism: An overview. In J. J. Kao & H. H. Stevenson (Eds.), Entrepreneurism: What is it and how to teach it (pp. 25-29). Boston: Harvard Business School.
Lowen, W. (1982). Dichotomies of the mind: A systems science model of the mind and personality. New York: John Wiley & Sons.
Lowen, W. (1984). Comments on Dichotomies of the mind: A systems science model of the mind and personality. Journal of Psychological Type, 7, 17-18.
McCaulley, M. H. (1985). The Selection Ratio Type Table: A research strategy for comparing type distributions. Journal of Psychological Type, 10,46-56.
Morgan, G. (1986). Images of organization. Beverly Hills, CA: Sage Publications.
Myers, I. B., & McCaulley, M. H. (1985). Manual: A guide to the development and use of the Myers-
Page 18 Journal of Psychological Type, Vol. 40, 1997
Briggs Type Indicator. Palo Alto, CA: Consulting Psychologists Press.
Peters, T. (1987). Thriving on chaos. New York: Alfred A. Knopf.
Peters, T. (1992). Liberation management. New York: Alfred A. Knopf.
Pinchot, G. (1985). Intrapreneuring. New York: Harper & Row.
Reynierse, J. H. (1993). The distribution and flow of managerial types through organizational levels in business and industry. Journal of Psychological Type,25,l1-23.
Reynierse, J. H. (1995). A comparative analysis of Japanese and American managerial types through organizational levels in business and industry. Journal of Psychological Type, 33, 19-32.
Reynierse, J. H., & Harker, J. B. (1995). The psychological types of line and staff management: Implications for the J-p preference. Journal of Psychological Type, 34, 8-16.
Roach, B. (1986). Organizational decision-makers: Different types for different levels. Journal of Psychological Type, 12, 16-24.
Sathe, V. (1985). Entrepreneurship and companyculture. In J. J. Kao & H. H. Stevenson (Eds.), Entrepreneurism: What it is and how to teach it (pp. 270-281). Boston: Harvard Business School.
Saunders, D. R. (1989). MBTI Expanded Analysis Report manual: A scoring system for Form J of the Myers-Briggs Type Indicator. Palo Alto, CA: Consulting Psychologists Press.
Schumpeter, J. A. (1934). The theory of economic development. Cambridge, MA: Harvard University Press.
Sexton, D. L., & Bowman, N. B. (1984). Personality inventory for potential entrepreneurs: Evaluation of a modified JPI/PRF-E test instrument. In J. A. Hornaday, F. Tarpley, J. A. Timmons, & K. Vesper (Eds.), Frontiers of entrepreneurship research (pp. 513-528). Wellesley, MA: Babson College.
Sexton, D. L., & Bowman, N. (1985). The entrepreneur: A capable executive and more. Journal of Business Venturing, 1, 129-140.
Sexton, D. 1., & Bowman-Upton, N. B. (1986). Validation of a personality index: Comparative psychological characteristics analysis of female entrepreneurs, managers, entrepreneurship students and business students. In R Ronstadt, J. A. Hornaday, R Peterson, & K. H. Vesper (Eds.), Frontiers of entrepreneurship research (pp. 40-51). Wellesley, MA: Babson College.
Sexton, D. L., & Bowman-Upton, N. B. (1991). Entrepreneurship: Creativity and growth. New York: Macmillan Publishing Co.
Sexton, D. L., & Ginn, C. W. (1990). The psychological aspects of rapid growth: Trait intensities of

the 1988 Inc. 500 founders and co-founders. In J. A. Hornaday, F. Tarpley, J. A. Timmons, & K. Vesper (Eds.), Frontiers of entrepreneurship research (pp. 17-18). Wellesley, MA: Babson College.
Stevenson, H. H. (1985). A new paradigm for entrepreneurial management. In J. J. Kao & H. H. Stevenson (Eds), Entrepreneurism: What it is and how to teach it (pp. 30-61). Boston: Harvard Business School.
Stevenson, H. H., & Harmeling, S. (1990). Entrepreneurial management's need for a more "chaotic" theory. Journal of Business Venturing, 5, 1-14.
Thome, A., & Gough, H. (1991). Portraits of type. Palo Alto, CA: Consulting Psychologists Press.
Tischler, 1. (1994). The MBTI factor structure. Journal of Psychological Type, 31, 24-31.
Vesper, K. H. (1980). New venture strategies. Englewood Cliffs, NJ: Prentice-Hall, Inc.
Wheatley, M. J. (1992). Leadership and the new sdence. San Francisco: Berrett-Koehler Publishers, Inc.
Acknowledgments
I would like to thank Jim and JoAnn Carland for graciously providing me with the entrepreneur and small business owner MBTI data from their research program. I would also like to thank John Harker for being a sounding board for most of the ideas presented here and for the many conversations related to type in organizations.
Contact
Dr. James H. Reynierse James H. Reynierse & Associates, Inc. P.O. Box 16069 Chesapeake, VA 23320
(804) 547-2416 [email protected]
... ... ...
Journal of Psychological Type, Vol. 40, 1997 Page 19

Rebelliousness and Psychological Distress In a Sample of Introverted Veterans
Gerald D. Otis Department of Veterans Mfairs Domiciliary, White City, Oregon
John L. Louks Department of Veterans Affairs Domiciliary, White City, Oregon
INTP and ISTP veterans appear to be more rebellious, less affected by phobic symptoms, and more
likely to be diagnosed with combat-related post-traumatic stress disorder; ISF] veterans show the least rebelliousness, and
ISFPs seem to experience the most psychological distress and phobic symptoms.
Abstract
Scores on the Wiggins Content Scales of the MMPI for 158 introverted male veterans electing to receive psychotherapy from the senior author were factor analyzed to yield two dimensions called "Rebelliousness" and "Psychological Distress." Factor scores on these dimensions were subjected to statistical analysis using Monte Carlo methods to assess the existence and magnitude of type effects. INTPs and ISTPs were both more likely to score higher than expected on the basis of random sampling on the Rebelliousness dimension, whereas ISF/s were more likely to score lower. I_TPs were also significantly more likely to be diagnosed with combat-related Post-Traumatic Stress Disorder (PTSD) on DSM Axis I and "antisocial" and "avoidant" personality disorders on Axis II, to have been arrested for a nonsubstance abuse-related crime, and to have trouble living within the behavioral constraints imposed by the treatment facility. In contrast, ISF/s were more likely to earn a diagnosis within the "dramatic" cluster on Axis II, had longer marriages and jobs, and were less likely to be arrested for a nonsubstance abuse-related crime. ISFPs were more likely to score higher on the Psychological Distress dimension than expected on the basis of random sampling, tended not to be labeled "antisocial" or "dramatic," and were not disposed to get into trouble during their treatment episodes. Clinical observations are generally consistent with these findings and support the idea that the form that psychopathology takes is related to psychological type. It is suggested that habits of mind that serve a combatant well on the battlefield may be a liability when trying to readjust to civilian life after the trauma of war.
With the publication of Basic Behavioral Science Research for Mental Health: Vulnerability and Resilience (Basic Behavioral Science Task Force, 1996) mainstream psychology has acknowledged the important role personality plays in explaining the variability in people's responses to life's vicissitudes. Millon (1981, 1986a, 1986b) had earlier maintained that personality disorders play an etiologic role in the occurrence, reoccurrence, and configuration of DSM Axis I disorders. (DSM is the American Psychiatric Association's Diagnostic and Statistical Manual, the standard system used by psychiatrists, psychologists, and others; editions of this manual are designated by Roman numerals, e.g. DSM-III, DSM-N, etc., as are axes within this system.) For example, Millon and Kotik (1985) marshaled considerable empirical evidence in support of personality disorder's role in depression. They suggested that personality characteristics may
Page 20 Journal of Psychological Type, Vol. 40,1997
be transformed into symptoms by creating a vulnerability to particular kinds of stressors: abandonment for the dependent personality; failure in achieving impossible goals for the obsessive-compulsive; loss of autonomy and dominance for the antisocial. The personality disorder might also have a high probability of precipitating interpersonal conflict and creating stress, as in the chaos of relationships that characterize the borderline personality'S life. Alternatively, the personality disorder could direct the expression of symptoms for secondary gains, as in the dramatic performances of the histrionic personality.
Jung's (1971) theory of psychological types seems to provide an elegant and coherent explanation of the connections between personality, personality disorders, and acute psychological disturbance. Jung himself was inclined to look past the many surface manifestations of clinical presentation and view

psychopathology as mainly a derivative of character. That is, he considered the potential for psychopathology in the course and context of life to be inherent in personality organization just as the potential for structural failure is inherent in the architecture of any created object within its surroundings. For example, a bridge is composed of a number of load-carrying members arranged in a particular fashion and designed to resist stresses from particular directions. If its builders use suitable materials, arrange the parts in proper fashion, and are careful in their construction, the bridge will function well for many years. However, cutting corners by installing shoddy materials, using poor construction practices, or failing to anticipate certain conditions can create latent weaknesses within the structure that may become evident only when there are unexpected loads, long periods of rain that undermine supports or accelerate deterioration, or sudden upheavals from deep within the earth that create forces exceeding the limits of the design. So, too, our "structural members" -our psychological functions--may, for a variety of reasons, lack the requisite substance (development) and construction (complementarity) among them, creating latent faults that only become apparent when psychosocial stresses are prolonged, are from unexpected directions, and/or are of such moment as to overwhelm the adaptability envisioned in our "typological blueprint."
Van der Hoop (1939) was apparently not so quick to dismiss the significance of the form of psychopathology as Jung was. Newman (1981) noted that Van der Hoop distinguished between manifestations of psychopathology that are relatively independent of the organization of personality and manifestations that are incorporated into the personality structure. In the first case, sets of ideas become inflexible and resistant to change because of emotional conflict during critical stages of childhood. These "complexes" occur in an otherwise intact personality and do not affect all areas of the person's functioning (e.g., in hysterical paralyses, compulsive rituals, or phobias). However, there may still be an association between "choice" of symptom and psychological type because different mental functions emerge at different times in development and because different types may react selectively to distinct kinds of conflict situations that occur in childhood. In the second case, the psychopathology has a more extensive effect on functioning because of an exaggeration of (usually) the individual's dominant mental function and relative neglect of other mental functions. In these cases, the afflicted person may appear as a caricature of his or her type, and the clinical picture should bear a close resemblance to the type itself.
According to Myers and Myers (1980), nondisordered type development requires (1) adequate but
unequal development of a judging process and a perceiving process and (2) adequate but unequal facility in using both the extraverted and introverted attitudes. That is, superior skill in one process or attitude must be supplemented by a skill that supports it (rather than competes with it) in the other. Without this complementarity, according to Quenk (1984,1985), various "disorders of type functioning" may occur. For example, there may be competition for precedence between the preferred perceiving function and the preferred judging function, resulting in a person who is unpredictable and vacillates from one approach to the other, lacking a cornerstone to his or her personality (i.e., a dominant function). Or, there may be a failure to "tune out" one of the opposites so that neither of them has a chance to become refined, resulting in, for example, the intrusion of distorted intuitions (e.g., paranoid ideas) into situations requiring sensing perception. Finally, there may be use of the auxiliary in the same attitude as that associated with the dominant, resulting in the extreme extravert who can't deal with his or her inner life and the extreme introvert who is unable to deal satisfactorily with the outer world.
Quenk (1985) viewed inadequate type differentiation as a source of stress in otherwise ordinary situations, rather than viewing it as being caused by stress. However, stress may lead to an exaggeration of type operating characteristics ("trying harder" with the same tools) and/or to their extension to inappropriate domains of problem solving (e.g., using feeling when buying a used car). Extreme and prolonged stress may invoke use of the inferior function (the function that is least refined and most unconscious), resulting in poor quality judgments in realms of activity foreign to areas the individual ordinarily prefers. Thus, an escalating process may occur with the poorly differentiated individual creating stress for himself or herself, with this stress leading to inflexible application of familiar strategies and creating more stress, eventually resulting in the person's being controlled by his or her inferior function, behaving quite inappropriately, and, upon return to an ordinary state, not knowing "what got into" him or her. During these later stages of the process, it is believed, the individual is likely to seek help while manifesting one of the DSM Axis I syndromes.
Thus, the trail of the argument connecting personality to psychopathology stretches from an array of different genetic precursors or personality through developmental influences (including stage by nascent type by event interactions) that result in an array of psychological type structures that are, selectively, more or less vulnerable or resistant to an array of different kinds of stresses and conflicts of living and may result in an array of coping strategies or failures to cope, some of which are considered psychopatho-
Journal of Psychological Type, Vol. 40, 1997 Page 21

logical. The interaction of these various array variables creates a vast territory for empirical investigation. Although there has been some research linking MBTI types to categories of psychopathology (Bisbee, Mullaly, & Osmond, 1982; Dalton, Aubuchon, Torn, Pederson, & McFarland, 1993; Dawes, 1991; Emanuel & Harsham, 1989; Hawkins, 1989; Komisin, 1992; Luzader, 1984), empirical mapping of this territory is still rather rudimentary. The present study is an additional contribution to that emerging knowledge base, using a popular psychopathology assessment device, a combination of statistical procedures, and clinical observation to elucidate some relationships between psychological type and psychological dysfunction.
Method
Subjects. The subjects were 185 male veterans admitted to one section of a 917-bed VA Domiciliary, who requested psychotherapy from the senior author. Patients corne to this ambulatory extended care facility, located in a small community in southern Oregon, with a variety of psychological, social, and medical impairments. Most are middle-aged, unemployed, homeless, divorced, and have a history of substance abuse. The mean age of the current sample was 46.9 (SD = 7.8), with a range from 30 to 70. Most subjects had more than one DSM-III-R or DSM-IV Axis I diagnosis. Primary Axis I diagnoses included major depression (26%), other depression (30%), Posttraumatic stress disorder (PTSD, 12%), anxiety disorder (10%), bipolar disorder (9%), schizophrenia (6%), and null (6%). Seventy percent had an additional diagnosis of some form of substance dependence or abuse. Axis II diagnoses included avoidant (24%), obsessive-compulsive (20%), narcissistic (12%), borderline (9%), dependent (5%), and antisocial (5%). In terms of the personality disorder clusters, the distribution was 6% Cluster A, 29% Cluster B, and 58% Cluster C.
Procedure
Basic Data. Shortly after admission to the Domiciliary, patients were administered the Shipley Institute of Living Scale (Zachary, 1992) and the original MMPI (Dahlstrom, Welsh, & Dahlstrom, 1972) as part of an intake assessment procedure that also included a clinical interview. Information from all of these sources was used to arrive at a DSM-III-R or DSM-IV diagnostic impression by the section psychologist. Within a few sessions after beginning psychotherapy, the patients were individually administered the MBTI. (One hundred eleven patients completed Form F, and 74 patients completed Form G.) Nearly all subjects affirmed the general accuracy of
Page 22 Journal of Psychological Type, Vol. 40, 1997
their type descriptions as given in the Introduction to Type (Myers, 1987) and in the relevant chapter in Life Types (Hirsh & Kummerow, 1989). Except for ENFPs, the sample did not adequately represent the extraverted types, so only data for introverted subjects were retained for subsequent analyses. Case records were inspected for values for the following variables: length of longest job, number of marriages, never married status, length of longest marriage, arrest for any offense that was not related to substance abuse, and "difficulty" living within the constraints of the Domiciliary (impulsive discharge, disciplinary discharge, major diSciplinary action). In about 5-10% of the cases, the records were not specific or clear with respect to some of these variables, so a judgment was made based on available information. Because this introduces error, the results for these variables should be viewed with caution.
Statistical Analyses. Raw score data from the 158 introverted cases for 11 of the Wiggins Content Scales (Wiggins, 1966) of the MMPI were subjected to Principal Components Factor Analysis with Varimax Rotation. In contrast to the other scales of the MMPI, these scales do not contain overlapping items and therefore do not create artificial correlations and "artifactors" (Coan, 1964) simply because they share identical content. Support for the validity of these scales may be found in Wiggins, Goldberg, and Appelbaum (1971), Jarnecke and Chambers (1977), and Mezzich, Damrin, and Erickson (1974). The REL (Religious Fundamentalism) and FEM (Feminine Interests) scales were omitted from the analysis because they shared little variance with the other scales. Because the factors removed half or less of the variance on some of the Wiggins scales, their residualized values (i.e., with the effects of the factors removed) were also retained in the data set.
Factor scores on the dimensions that emerged from the factor analysis, along with the residualized Wiggins scale scores (where appropriate), were first examined by three-way analyses of variance (S vs. N by T vs. F by J vs. P). They were then subjected to Salience Analysis and Effect Size Analysis using Random Sampler for Windows (Otis, 1996), a computer program that uses Monte Carlo methods to establish probabilities of specified results occurring "by chance" within a set of data.
Salience Analysis. In this procedure, the mean, median, mode, and variance for each given type are compared to the distribution of means, medians, modes, and variances obtained by taking a large number of random samples from the total pool of scores. The program first determines the number of cases (N) in the target subgroup. It then randomly selects N cases from all of the available cases and

computes the mean, median, mode, and variance for this one sample. This step was repeated 400 times in the present study. (The program limit is 30,000.) The proportion of these measures that fall above and below that which was actually found for the target subgroup are then tallied. These proportions represent the probability that, given the total distribution of scores, a value could be obtained by chance for the measure equal to or greater (or conversely, equal to or less) than the empirical result for the subgroup. (I.e., it is comparable to a significance level.) For example, if 95% of the means obtained by random sampling were less than the mean actually obtained for the subgroup, this mean value or a greater mean value might be expected to occur by chance only 5 times out of 100.
Effect Size Analysis. This procedure computes probabilities that a member of one group will be greater than, equal to, or less than members of each other group; it also computes the probability that a member of one group will be higher than, or lower than, members of all other groups. What the procedure does is to select randomly a case from each group to obtain one sample, i.e., the number of cases in the sample is equal to the number of groups being evaluated. The members of the sample are compared with each other in pairwise fashion to determine their relationship (>, =, <), and the member that is highest and the member that is lowest are also identified. Up to 30,000 samples are taken, and the proportion of them in which the scores of members of one group exceed the scores of members of another group are tallied. Similarly, the proportion that have scores that are equal to scores of the other group or that are less than the other group are tallied. The proportion of samples in which the target group value is highest or lowest is computed and compared to the proportions expected if the groups were equally likely to achieve ''highest'' or "lowest" status. These probabilities thus represent changes in uncertainty achieved by knowing an individual's group membership.
Results
Table 1 shows the distribution of MBTI types in the sample. Compared to the general population, it is clearly biased in the introverted direction. Considering only the introverted subset and using the CAPT Form G Databank (McCaulley, Macdaid, & Granade, 1993) for males as a standard to compute Selection Ratios (SRs), the overrepresented types are ISFP (SR = 3.5), INFP (SR = 2.8), and ISF} (SR = 2.1). Underrepresented types are INTJ (SR = .33) and IS1} (SR = .46). All of these ratios generate chi-square values significant beyond the .01 level.
Factor Analysis of MMPI Content Scales. The first factor extracted from the factor analysis of the Wiggins Content Scales, labeled Subjective Distress, accounted for 51 % of the common variance in the scales. The scales with high factor loadings were Depression, Organic Symptoms, Poor Morale, Health Concerns, Social Problems, and Phobic Symptoms. High scorers on this factor endorse items having to do with experiences of guilt, unworthiness, failure, worry and despair, lack of self-esteem and selfconfidence, embarrassment, and feelings of being misunderstood. They admit to numerous fears, are concerned about their health status, and may experience various psychomotor problems (e.g., in reading, concentration, motor control, and sensory experience). The second dimension, labeled Rebelliousness, accounted for 11 % of the variance shared among the scales and seems to reflect a rebellious attitude manifesting itself in distrust of persons in authority, cynicism regarding the motives of others, resentment of what appears to the respondent to be injustice, and a tendency to be irritable, argumentative, and hotheaded. They endorse self-reference items implying restlessness, hyperactivity, suspiciousness, and conflict in interpersonal and family relations. The scales with high factor loadings on this dimension were Authority Conflict, Hostility, Hypomania, Psychotic Symptoms, and Family Conflict. The two factors are correlated to a moderate degree with the two factors that Welsh extracted from the MMPI (see Dahlstrom et a!., 1972) but suggest a rotation of the axes by about 45 degrees.
Analysis of Variance of MMPI Factors. Because a significant (p = .0004) relationship between Rebelliousness scores and age was found (with increasing age, Rebelliousness scores decline), age was used as a covariate in the analysis of variance for these scores. The results yielded significant effects because of T versus F (p = .(03) and J versus P (p = .(07). None of the interactions was significant. In the analysis of variance for Subjective Distress scores, T versus F was significant at the p = .04 level, whereas S versus N had a p value of .06. Residualized scores for PHO (Phobic Symptoms) rendered a significant effect caused by T versus F (p = .04). The Shipley IQ estimate was not significantly related to any of the dependent variables in this report.
Salience Analysis of MMPI Factor Scores. On the Rebelliousness Dimension, the group means for two types, INTP and ISTP, were greater than means achieved by random sampling using Random Sampler for Windows 99-100% of the time, whereas the ISF} mean was always lower than the random sample means. The medians showed nearly the same pattern, and the mode and variance behaved in a similar
Journal of Psychological Type, Vol. 40, 1997 Page 23

Table 1. Type Distribution of the Patient Sample. N= 185 += l%ofN
The Sixteen Complete Types Dichotomous Preferences
ISTJ ISFJ INFJ INTJ E n= 27 (14.6%) n=25 n=23 n=7 n=8 I n= 158 (85.4%) (13.5%) (12.4%) (3.8%) (4.3%) +++++ +++++ ++++ ++++ S n= 98 (53.0%) +++++ +++++ N n= 87 (47.0%) ++++ ++
T n= 75 (40.5%) F n= 110 (59.5%)
J n= 75 (40.5%) P n= 110 (59.5%)
ISTP ISFP INFP INTP n= 14 n=23 n=37 n =21 Pairs and Temperaments (7.6%) (12.4%) (20.0%) (11.4%) +++++ +++++ +++++ +++++ IJ n= 63 (34.0%) +++ +++++ +++++ +++++ IP n= 95 (51.4%)
++ +++++ + EP n= 15 ( 8.1%) +++++ EJ n= 12 ( 6.5%)
ST n= 43 (23.2%) SF n= 55 (29.7%) NF n= 55 (29.7%)
ESTP ESFP ENFP ENTP NT n= 32 (17.3%) n=O n=4 n=9 n=2 (0.0%) (2.2%) (4.9%) (1.1%) S] n= 57 (30.8%)
++ +++++ + SP n= 41 (22.2%) NP n= 69 (37.3%) NJ n= 18 ( 9.7%)
TJ n= 38 (20.5%) TP n= 37 (20.0%) FP n= 73 (39.5%) FJ n= 37 (20.0%)
ESTJ ESFJ ENFJ ENTJ n=4 n=5 n=2 n=l IN n= 73 (39.5%) (2.2%) (2.7%) (1.1%) (0.5%) EN n= 14 ( 7.6%) ++ +++ + + IS n= 85 (45.9%)
ES n= 13 ( 7.0%)
ET n= 7 ( 3.8%) EF n= 20 (10.8%) IF n= 90 (48.6%) IT n= 68 (36.8%)
Jungian Types (E) Jungian Types (I) Dominant Types n % n % n %
E-TJ 5 2.7% I-TP 35 18.9% Dt.T 40 21.6% Gerald D. Otis and John L Louks, E-FJ 7 3.8% I-FP 60 32.4% Dt.F 67 36.2% Rebelliousness and Psychological Distress ES-P 4 2.2% IS-J 48 25.9% Dt.S 52 28.1% In a Sample of Introverted Veterans. EN-P 11 5.9% IN-J 15 8.1% Dt.N 26 14.1%
Page 24 Joumal of Psychological Type, Vol. 40, 1997

fashion for ISTPs. On the Subjective Distress dimension, the ISFP
mean, median, and mode were higher than the corresponding measures obtained by random sampling 99% of the time. The ISF] mode was higher than most modes obtained by random selection of cases, and its variance was less than most random variances obtained on that variable. The empirical INTP variance also reflected more homogeneity than occurred in 97% of the randomly generated samples.
The INTP mean and variance were less than the means and variances of nearly all the random samples generated using the residualized PHO scores. The results for ISTPs were in the same direction but not at a level where they "stood out" like the INTPs. The ISFP median, and to a large degree the mean, were higher than most random samples obtained from that score distribution. The ISF] median and variance tended to be higher than the corresponding randomly obtained measures. That is, they were inclined to score high, but there was a wide range of scores within the type.
Effect Size Analysis of MMPI Factor Scores. Effect Size Analysis for the two factors and the residualized PHO scores for the types that were significantly different from the others according to Salience Analysis gave the following results: On the Rebelliousness dimension (adjusted for age), INTPs and ISTPs showed a greater probability of having higher scores than each of the other types (except in relation to each other), whereas ISF]s were less likely than each of the other types to have the higher score. INTPs had the highest score 28% of the time, representing a gain of .16 in probability value over "chance" (125%), and ISTPs had the highest score 20% of the time, a .08 gain in probability (60%). ISF]s obtained the lowest score in the sample 19% of the time, for a gain of .07 in probability (56%).
On the Subjective Distress factor, ISFPs were more likely than each of the other types to have the highest score in the sample and actually had the highest score of all introverted types 26.5% of the time (a 112% gain in probability over what would be expected if types were equally likely to score highest).
On the residualized PHO scores (adjusted for level of Rebelliousness and Subjective Distress), INTPs and ISTPs were less likely to have the highest score when compared to each of the other types (except for each other), whereas ISFPs were more likely to have the highest score except when compared to INTJs and ISF]s. INTPs obtained the lowest score in the sample 25% of the time and ISTPs 16% of the time. ISFPs obtained the highest score on this scale 26% of the time but obtained the lowest score at a chance rate.
Type and Diagnosis. Because a Type by Axis I diagnosis matrix produces many cells with few cases in them, given the number of subjects in this study, and because most cases included multiple diagnoses, the approach taken to examining the relation between type and diagnosis was simplified to examination of three diagnostic features: presence or absence anywhere on Axis I of PTSD (combat-related), an anxiety disorder (other than combat-related PTSD), and major depression. The upper three rows of Table 2 show the results of Salience Analysis runs on these variables. For the PTSD dichotomy, the empirical mean, variance, and median for ISTPs and INTPs (combined group) were exceeded by only 0.5% of 400 random samples. The ISTP mean, variance, and median were above that of 96% of the random samples, but the comparable INTP measures were above only 72% of 400 random samples. For the anxiety disorder dichotomy, only the INFP mean, variance, and median were higher than the comparable values for 96% of 400 random samples. INTJ was the only type to stand out in terms of a major depression diagnosis: The mean, median, and mode for that type were exceeded by only 1 % of the random samples.
The bottom six rows of Table 2 show the results of Salience Analysis runs for Axis II diagnosis. Because of the small number of cases in some categories, the classifications are slightly different than those in DSM-IV: Antisocial personality disorder was separated out from Ouster B, and the remaining diagnoses within that cluster were collapsed into a "dramatic" group. Each category was treated as a dichotomous variable. The table indicates that INTPs and ISTPs were both more likely than chance to earn an "antisocial" or "avoidant" label and more likely not to be designated "obsessive-compulsive." INTPs were also not likely to be given any of the "dramatic" diagnoses, whereas INFJs and ISF]s were more likely than chance to win such a designation. "Obsessivecompulsive" was not likely to be applied to INFPs, and "avoidant" was an unlikely label for ISF]s. ISFPs were not likely to be considered either "antisocial" or any of the "dramatic" diagnoses. ISTJs were likely to be designated "obsessive-compulsive" on Axis II.
Salience Analysis of Case Record Variables. Table 3 summarizes the results of Salience Analysis runs on the variables extracted from case records. Because all of these variables were significantly correlated with age, the analyses were conducted on residualized scores. That is, the linear effects of age were removed by regression analysis. All 400 means and medians for longest job length obtained by random sampling were of longer duration than the INTP mean and median, whereas 99% of the random job length means were longer than the INF] mean. ISFJs had the longest jobs, with only 2.5% of the random
Journal of Psychological Type, Vol. 40, 1997 Page 25

Table 2. Psychological Type by Diagnosis Matrix.
Axis Diagnosis INFJ INFP INTJ INTP ISFJ ISFP ISTJ ISTP
I Anxiety Disorder +
I Major Depression +
I PTSD +
II Antisocial + +
II Avoidant + +
II Dramatic + +
II Obsessive +
II Dependent
II Odd
Note: Plus sign indicates that the type was more likely to have the diagnosis and minus sign indicates the type was less likely to have the diagnosis than in 400 random samples. The Dramatic cluster includes diagnoses of borderline, cyclothymic, histrionic, and narcissistic personality disorders. The Odd cluster includes diagnoses of paranoid, schizoid, and schizotypal personality disorder.
Table 3. Life History Variables and Psychological Type.
Variable INFJ INFP INTJ INTP ISFJ ISFP ISTJ ISTP
Job Length + +
Never Married +
Number of Marriages +
Length of Time Wed +
Crime + +
Domestic Trouble + +
Note: Plus signs indicate that the type mean was greater than expected and minus signs indicate that the type mean was lower than expected on the basis of random sampling distributions.
Page 26 Journal of Psychological Type, Vol. 40, 1997

means being longer than their mean duration. ISTJs were close to that, with only 7.5% of the random means exceeding their average length.
ISTPs were more likely never to have been married than expected by random sampling (p = .02), whereas INTPs were less likely to be in that marital status (p = .002), and ISFPs showed a tendency in that direction (p = .08). The mean number of marriages for INTPs was greater than all of the 400 randomly obtained means for that variable. IS1}s showed a tendency for fewer marriages than expected (p = .09). The average longest marriage for ISFJs was significantly longer than would be expected from random sampling (p = .02).
INTPs and ISTPs both were more likely to have been arrested for some crime unrelated to substance abuse than would be expected by chance (p = .06 and p = .002, respectively). However, ISFJs were less likely to be arrested for such a crime than would be expected by random sampling (p = .01).
In the Domiciliary, ISTPs were more likely to have disciplinary problems or to leave impulsively than would be expected based on random sampling (p < .0001), whereas INTPs showed a tendency (p = .09) for similar problems. ISFPs were less likely to have such difficulties than would be expected by chance (p = .04).
Discussion and Clinical Observations
The results of this study are consistent with the idea that different psychological types manifest psychological dysfunction in different ways when particular dimensions of dysfunction are examined, when life history data are investigated, and, to the degree to which it was possible to analyze it with this sample, when Axis I and Axis II diagnoses are considered. The findings for the IT types are particularly interesting. These subjects tended to score higher than other introverted types on the Rebelliousness Dimension and lower on the residualized Phobic Symptoms Scale; were more likely than chance to be labeled "antisocial" or "avoidant" personality disorder and less likely than chance to be considered "obsessivecompulsive" or "dramatic" (only in the INTP case); were more likely than other types to be diagnosed with combat-related PTSD; were more likely than other types to have problems in family and work settings; and they found it difficult to live within the constraints imposed by society and by the Domiciliary.
It should be noted that, even in non pathological samples, these types tend to value highly their own independence and autonomy and may bristle at having someone else's structure imposed on them. For the I_TP, the only legitimate authority is that based on superior knowledge or skill, and consequently t TPs
are unimpressed with popularity, propriety, or power and are inclined to be rebellious and nonconforming. Settings in which these operating characteristics may prove advantageous and gain favorable recognition include ones that are flexible, relatively unstructured, egalitarian, nonintrusive, and allow the individual to pursue his or her goals independently at his or her own pace, e.g., colleges and universities, research and development groups, company troubleshooters, and artistic enterprises. (See Salter, 1995.)
Needless to say, military organizations do not ordinarily meet any of these criteria, except perhaps in special circumstances such as fighting a guerrilla war. Several of the IT patients in this sample who were Vietnam combat veterans reported being in loosely organized units or associated with "renegade" outfits that disregarded most of the official rules and statuses, instead making up their own "code" appropriate to their circumstances as they saw them. Often they distinguished themselves as warriors, being awarded medals for their valor and accomplishments. Although these patients acknowledged feeling frightened most of the time in Vietnam, they often reported a conscious effort to control impulsive fear reactions so as not to let down their comrades or provoke mass panic. For example, one helicopter door gunner reported that he would consciously rehearse fear-producing situations, imagining himself becoming "The Trigger" so that he would not freeze up when the real things occurred. Another combat veteran would summon up the rage he felt at lost comrades, at his superiors, or at being in this God-forsaken land in order to feel strong, full of energy, and powerful (or bullet-proof in some instances). But often these men committed acts they later regretted and that continue to haunt them. Thus, ITs may have been able to function effectively in these groups but exposed themselves to a greater likelihood of trauma. (See Dalton et al., 1993.)
In this psychopathological sample of ITs, there is the clinical impression of an exaggerated clinging to the dominant function and/ or a stunting of development of the auxiliary (with occasional eruptions of the inferior). How did this rigid one-sidedness come about? In the case of combat veterans, type development may have been frozen in time because of frequent observation of orders that violated all logic and had disastrous consequences with much human suffering, i.e., a violation of one of the tTPs basic principles could have caused him to adhere to his own beliefs even more strongly, to take a "Never again ... " kind of vow. Observations of some of the loathsome aspects of human motivation might intensify the C TP' s interpersonal wariness. And finding such motives in one's self might upset the internal order that tTPs prefer, requiring repression, risk-taking excitement, or substance abuse to keep them from
Journal of Psychological Type, Vol. 40, 1997 Page 27

consciousness. Several I_TPs were personally subjected to arbitrary disciplinary action or observed it happening to others, resulting in a tremendous amount of resentment and resolve never to trust or give in to arbitrary authority. The double betrayal by the politicians who directed the war and the American public who did not support it was a source of frustration and chagrin, leading to distrust of and retreat from engagement with the community. (Of course, not all veterans with combat-related PTSD are t TPs, and the current research suggests that non-tTPs are likely to manifest their disorders in different ways. For example, four INTJs with PTSD all appeared to have chronic major depression as their outstanding symptom rather than any overt rebelliousness toward family or society, and one INFP patient managed his PTSD symptoms by leaving the country and living in the wilderness for a number of years.)
In the case of noncombat ITs, we must look elsewhere for an explanation of their extreme type inflexibility. Clinically, the culprit often appeared to be a family-of-origin-environment in which the tTP felt his needs and feelings were not valued or even considered, either through physical abuse, neglect, or special circumstances (being adopted or orphaned, having a neurotic mother who was wrapped up in her own problems, having older parents upon whom the child felt himself to be an intrusion, etc.). Some t TP combat veterans also had this kind of family background.
ITs usually sought help in order to control the latency and magnitude of their angry reactions and the depression (through unmerciful self-criticism) that resulted from the disruptions in their lives these reactions caused (e.g., lost jobs, failed marriages, lack of accomplishments, prison time). They would frequently maintain that their violent actions were justified on the basis of principles regarding proper interpersonal conduct (e.g. egalitarianism, fairness, respect for individuality and autonomy, lack of guile), hold violators of these principles in utter contempt and deserving of the most vile retribution, and feel obliged to give these individuals an "object lesson." It mattered little if the offense had direct consequences for the IT or for someone else seen as undeserving of the affront. When instances of their angry reactions were analyzed, they usually seemed to be quite right that these moral principles had been violated but erred in their perceptual construction of "the problem" and in their constricted list of factors considered in making a judgment about action. Both types seemed to operate with a restricted database about kinds of people and what motivates them (e.g., believing there are only "power hungry, control freaks," "the timid and gutless," and "people of honor and principle"), thereby using an oversimplified template to ascribe interpersonal roles and
Page 28 Journal of Psychological Type, Vol. 40, 1997
motivation to the other actors in the event as well as to themselves. Their own goals and values in the situation were usually quite clear to them, but their emotional reactions (other than anger) were hard to elicit. Intuitive types would often fail to check the facts, and sensing types had a hard time generating "other possibilities" to explain the actions of others. At the intense level of activation that was aroused by the time they made an action decision, they would "throw caution to the wind," "let the consequences be damned," and assume an icy indifference to the suffering their actions might cause the perpetrator. What mattered was the principle and little else.
What seemed to be beneficial in therapy was to examine representative instances of these transactions in the context of an analytical, "thinking" approach, but to interject queries that referenced the patient's perceptual and judgment processes. 'What kind of person was this that you were encountering?" "What was your role relationship?" "Did you ask him about his intentions?" 'What else might have caused him to do that?" 'What other information would you need to be sure about her sentiments toward you and how could you get it?" "Did the person seem to learn anything from the object lesson you wanted to teach him?" 'What other instructional methods might you have used?" 'What would it mean if you didn't do what you did?" 'Was the principle worth going to jail for?" 'What else should you have considered in deciding what to do?" Given that a therapeutic alliance has been established, ITs find it difficult to resist processing such queries, will engage in reflective thinking and recognize their informational deficits, and will pose queries of their own for the therapist that can lead to "sidebar" discussions that carry the therapeutic messages about perception and judgment. It is counterproductive to try to "sell" the CTP patient on any idea, but simply presenting it as an alternative and encouraging experimentation to see if it works for him or her is likely to meet with success. Trying to force an t TP to accept any idea will lead to nothing but resistance.
In this clinical sample, ISFJs distinguished themselves from other types by being low on the Rebelliousness Dimension (Le., being conforming and accepting of authority), having a high modal score on the Subjective Distress Dimension, tending toward a high median score on the residualized Phobic Symptoms Scale, and being likely (along with their intuitive cousins) to earn a personality disorder label in the "dramatic" cluster but being unlikely to be considered "avoidant." They tended to have good work histories and long marriages, seldom had trouble with the law, and appeared to put up easily with the intrusiveness and regulations of DOmiciliary life. ISFJ patients were often seen as "good patients" in the Domiciliary because of their tidiness, compliance
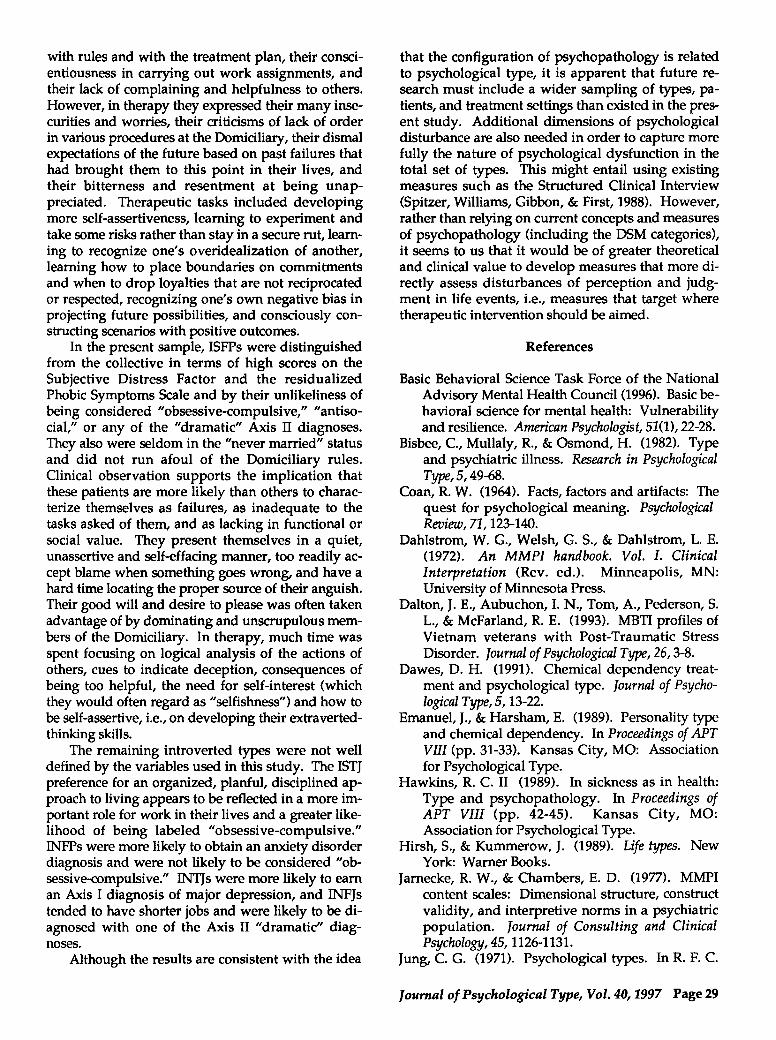
with rules and with the treatment plan, their conscientiousness in carrying out work assignments, and their lack of complaining and helpfulness to others. However, in therapy they expressed their many insecurities and worries, their criticisms of lack of order in various procedures at the Domiciliary, their dismal expectations of the future based on past failures that had brought them to this point in their lives, and their bitterness and resentment at being unappreciated. Therapeutic tasks included developing more self-assertiveness, learning to experiment and take some risks rather than stay in a secure rut, learning to recognize one's overidealization of another, learning how to place boundaries on commitments and when to drop loyalties that are not reciprocated or respected, recognizing one's own negative bias in projecting future possibilities, and consciously constructing scenarios with positive outcomes.
In the present sample, ISFPs were distinguished from the collective in terms of high scores on the Subjective Distress Factor and the residualized Phobic Symptoms Scale and by their unlikeliness of being considered "obsessive-compulsive," "antisocial," or any of the "dramatic" Axis II diagnoses. They also were seldom in the "never married" status and did not run afoul of the Domiciliary rules. Clinical observation supports the implication that these patients are more likely than others to characterize themselves as failures, as inadequate to the tasks asked of them, and as lacking in functional or social value. They present themselves in a quiet, unassertive and self-effacing manner, too readily accept blame when something goes wrong, and have a hard time locating the proper source of their anguish. Their good will and desire to please was often taken advantage of by dominating and unscrupulous members of the Domiciliary. In therapy, much time was spent focusing on logical analysis of the actions of others, cues to indicate deception, consequences of being too helpful, the need for self-interest (which they would often regard as "selfishness") and how to be self-assertive, i.e., on developing their extravertedthinking skills.
The remaining introverted types were not well defined by the variables used in this study. The ISTJ preference for an organized, planful, disciplined approach to living appears to be reflected in a more important role for work in their lives and a greater likelihood of being labeled "obsessive-compulsive." INFPs were more likely to obtain an anxiety disorder diagnosis and were not likely to be considered "obsessive-compulsive." INTJs were more likely to earn an Axis I diagnosis of major depression, and INFJs tended to have shorter jobs and were likely to be diagnosed with one of the Axis II "dramatic" diagnoses.
Although the results are consistent with the idea
that the configuration of psychopathology is related to psychological type, it is apparent that future research must include a wider sampling of types, patients, and treatment settings than existed in the present study. Additional dimensions of psychological disturbance are also needed in order to capture more fully the nature of psychological dysfunction in the total set of types. This might entail using existing measures such as the Structured Clinical Interview (Spitzer, Williams, Gibbon, & First, 1988). However, rather than relying on current concepts and measures of psychopathology (including the DSM categories), it seems to us that it would be of greater theoretical and clinical value to develop measures that more directly assess disturbances of perception and judgment in life events, i.e., measures that target where therapeutic intervention should be aimed.
References
Basic Behavioral Science Task Force of the National Advisory Mental Health Council (1996). Basic behavioral science for mental health: Vulnerability and resilience. American Psychologist, 51(1), 22-28.
Bisbee, c., Mullaly, R, & Osmond, H. (1982). Type and psychiatric illness. Research in Psychological Type, 5, 49-68.
Coan, R W. (1964). Facts, factors and artifacts: The quest for psychological meaning. Psychological Review,71,123-140.
Dahlstrom, W. G., Welsh, G. 5., & Dahlstrom, 1. E. (1972). An MMPI handbook. Vol. 1. Clinical Interpretation (Rev. ed.). Minneapolis, MN: University of Minnesota Press.
Dalton, J. E., Aubuchon, I. N., Tom, A., Pederson, S. 1., & Mcfarland, R E. (1993). MBTI profiles of Vietnam veterans with Post-Traumatic Stress Disorder. Journal of Psychological Type, 26, 3-8.
Dawes, D. H. (1991). Chemical dependency treatment and psychological type. Journal of Psychological Type, 5, 13-22.
Emanuel, J., & Harsham, E. (1989). Personality type and chemical dependency. In Proceedings of APT VIII (pp. 31-33). Kansas City, MO: Association for Psychological Type.
Hawkins, R C. II (1989). In sickness as in health: Type and psychopathology. In Proceedings of APT VIII (pp. 42-45). Kansas City, MO: Association for Psychological Type.
Hirsh,S., & Kummerow, J. (1989). Life types. New York: Warner Books.
Jarnecke, R W., & Chambers, E. D. (1977). MMPI content scales: Dimensional structure, construct validity, and interpretive norms in a psychiatric population. Journal of Consulting and Clinical Psychology, 45, 1126-1131.
Jung, c. G. (1971). Psychological types. In R F. C.
Journal of Psychological Type, Vol. 40, 1997 Page 29

Hull (Ed.) & H. G. Baynes (Trans.), The collected works of c.G. Jung (6, pp. 542-555). Princeton, NJ: Princeton University Press.
Komosin, L. (1992). Personality type and suicidal behavior in college students. Journal of Psychological Type, 24, 24-32.
Luzader, M. (1984). Chemical dependency and type. Journal of Psychological Type, 8,59-61.
McCaulley, M. H., Macdaid, G. P. & Granade, J. G. (1993). Interpreting and using EIR scores: An examination of the CAPT Expanded Interpretive Report data from the CAPT databank. Gainesville, FL: Center for Applications of Psychological Type.
Mezzich, J. E., Damarin, F. L., & Erickson, J. R. (1974). Comparative validity of strategies and indices for differential diagnosis of depressive states from other psychiatric conditions using the MMPI. Journal of Consulting and Clinical Psychology, 42, 691-698.
Millon, T. (1981). Disorders of Personality: DSM-III: Axis II. New York: John Wiley and Sons.
Millon, T. (1986a). A theoretical derivation of pathological personalities. In T. Millon & G. L. Klerman (Eds.), Contemporary directions in psychopathology (pp. 3-20). New York: Guilford.
Millon, T. (1986b). The MCMI and DSM-III: Further commentaries. Journal of Personality Assessment, 50(2), 205-207.
Millon, T., & Kotik, D. (1985). The relationship of depression to disorders of personality. In E. E. Beckman & W. R. Leber (Eds.), Handbook of depression (pp. 700-744). Homewood, IL: The Dorsey Press.
Myers, I. B. (1987). Introduction to type (Rev. ed.). Palo Alto, CA: Consulting Psychologists Press.
Myers, I. B., & Myers, P. B. (1980). Gifts differing. Palo Alto, CA: Consulting Psychologists Press.
Newman, J. (1981). Review of J. H. Van der Hoop, Conscious orientation: A study of personality types in relation to neurosis and psychosis. The San
Page 30 Journal of Psychological Type, Vol. 40, 1997
Francisco Jung Institute Library Journal, 9-14. Otis, G. D. (1996). Random sampler for Windows.
Medford, OR: Author. Quenk, N. (1984). The dynamics of type develop
ment. MBTI NEWS, 7(1), 1-17. Quenk, N. (1985). Conflicts in function develop
ment. MBTI NEWS, 7(2), 6-7. Salter, D. W. (1995). A Jungian view of the dimen
sions of behavioral environments. Journal of Psychological Type, 34, 24-28.
Spitzer, R L., Williams, J. B., GIbbon, M., & First, M. B. (1988). Instruction manual for the Structured Clinical Interview for DSM-Ill-R. Biometrics Research Department, New York State Psychiatric Institute, 722 West 168th St., New York, NY 10032.
Van der Hoop, J. H. (1939). Conscious orientation: A study of personality types in relation to neurosis and psychosis. Darby, P A: Darby Books.
Wiggins, J. S. (1966). Substantive dimensions of selfreport in the MMPI item pool. Psychological Monographs, 80 (22, Whole No. 630).
Wiggins, J. S., Goldberg, L. R, & Appelbaum, M. (1971). MMPI content scales: Interpretative norms and correlations with other scales. Journal of Consulting and Clinical Psychology, 37, 403-410.
Zachary, R A. (1992). Shipley Institute of Living Scale. Los Angeles: Western Psychological Services.
Dr. Gerald D. Otis 2632 Wilkshire Dr. Medford, OR 97504
Contact
(541) 826-2111, ext. 3280 or 3282 (work) (541) 770-2904 (home)
... ... ...

Relationships Between the MBTI and Selected Aspects of Tinto's Model for College Attrition
K. Terry Schurr Ball State University
Virgil Ruble Ball State University
Catherine Palomba Ball State University
Brian Pickerill Ball State University
Deborah Moore Ball State University
A thorough and fascinating study of a major university entering class shows how type relates to degree completion directly, and how
type relates to other variables known to impact degree completion, including a look at how different types are drawn to different
campus environments and subcultures, and what effects these have; many results confirm various theories, but there are also some surprises.
Abstract
This study involved a lO-year follow-up of an entering freshman class at a Midwestern university. The class had taken the MBTI during the summer before entering the university, and different kinds of data were collected about the class members while they were enrolled. The questionnaire used in the follow-up study provided a wide range of additional information about the class. For this study, the information of interest included campus activities and attitudes toward the students' fields of study and the institution. Path analysis was used to evaluate the influence of the MBTI preferences on academic preparation for college, campus activities, grade point average, and attitude variables, and the influence of the variables on degree completion. The Tinto college attrition model and the Clark and Trow campus subculture typology, along with MBTI theory, provided the study's theoretical basis. The most interesting findings centered on the indirect influence of type preferences on degree completion via their influence on other variables found to relate to degree completion.
The graduation rate of college freshman classes is a major concern at many institutions of higher education. Estimated average nationwide graduation rates of matriculates at 4-year institutions are around 50% (e.g., Benson, 1995). Because of their modest graduation rates, many institutions have evaluated their institutional programs and looked at a wide range of variables as potential causes for attrition (Pace, 1979; Pettit, 1991). The decline in the number of high school graduates and the public demand for account-
ability of higher education institutions have made the graduation of freshmen especially important (Morning, 1991).
Reviews of college attrition studies (e.g., Bean & Metzner, 1985; Pantages & Creedon, 1978; Tinto, 1987) have highlighted the difficulty in identifying causal variables for attrition. Low college grade point average (GPA) is universally a causal variable for attrition because of the potential for academic dismissal. However, a high percentage of students leave
Journal of Psychological Type, Vol. 40, 1997 Page 31

college for reasons other than low GPA (Tinto, 1975). Academic preparation, residence during college, participation in campus activities (Pascarella & Terenzini, 1991), and field of study are seen as causes of attrition. However, the effects of such variables seem dependent on the programs, objectives, admission standards, and climates (e.g., predominantly residential vs. predominantly commuter schools) of individual institutions. The differences in the collective characteristics of students enrolled at diverse institutions (e.g., academic preparation, gender, social/ economic status, and ethnicity) and the "fit" of student and institutional characteristics (Rootman, 1972) are additional sources of variation in institutional attrition rates (Kalsner, 1991).
Although few generalizations can be made about college student attrition, Tinto's (1975) "path analysis" model is widely recognized as a useful framework for studying the attrition problem (Kalsner, 1991). The model is comprised of four basic kinds of variables: the background characteristics of students enrolled at an institution, the integration levels of students into institutional academic environments, the integration levels of students into institutional social environments, and the influence of such variables on the ability and/or the decision of students to persist in attaining a degree. For example, the background characteristics in the model include personality variables, academic preparation, family socioeconomic status, and commitment to attaining a college degree. The academic integration concept includes such variables as student evaluations of an institution and its programs and the institution's evaluations of students via GP A. The social integration concept includes the social experiences of students: e.g., their involvement in formal, semiformal, and informal extracurricular activities and their interaction with the institution's faculty and staff.
Tinto's (1975) model implies that students' background characteristics affect their levels of integration into an institution's academic and social environments, and that along with these characteristics, the levels of integration are important in determining students' degree completion. Furthermore, Tinto proposed that high levels of a few of the background, academic integration, and social integration variables can offset lower levels of other variables in determining persistence.
Kalsbeek (1987) and Provost and Anchors (1987a) provided summaries of the main components of Tinto's (1975) model. They also highlighted the conceptual and empirical links of MBTI preferences with the components. Several studies have looked at relationships of MBTI preferences with measures of academic preparation of students for college (e.g., Kalsbeek, 1987; Schurr, Ruble, & Henriksen, 1988). One or more of the studies identified preferences for intro-
Page 32 Journal of Psychological Type, Vol. 40, 1997
version and for intuition as relating to higher academic aptitude test scores and higher levels of high school achievement. Judging preferences were identified with higher levels of high school achievement.
The link of the MBTI preferences with academic fields of study that students choose was summarized by Myers and McCaulley (1985), who reported consistent research indicating that people having an 5 preference are more likely to gravitate to applied fields than are people with an N preference. The linkage of MBTI preferences with student integration into the college environment was suggested by Provost and Anchors (1987a). Their research on the kinds of activities in which students participate identified relationships for the preferences in line with the general type descriptions developed by Isabel Myers. 5pecifically, the activity choices were: (a) E, action and interacting with groups, and I, individual activities and renewal through solitude; (b) 5, involvement in physical activities and established social structures, and N, using imagination and participating in activities outside of established channels; (c) T, mastering specialized skills, and F, focusing on interpersonal relationships; and (d) J, participating in structured activities and needing time to get academics done, and P, participating in unplanned activities and sometimes becoming overly involved.
The purpose of the present research was to examine the relationships of MBTI preferences with academic preparation for college, with an institution's evaluation of students, with student evaluations of an institution and its programs, with the integration of students into the institution's environments, and with whether or not students graduated from the institution. Apparent discrepancies in research findings for relationships of the MBTI preferences with college aptitude test scores, high school achievement, GP A, and college graduation rates were of special interest. In particular, some research pointed to higher graduation rates for student groups having the 5 preference than for student groups having the N preference (e.g., Anchors, Robbins, & Gershman, 1987; Roush, 1989; Schurr, Henriksen, & Ruble, 1990), whereas GPA values, academic aptitude test scores, and high school achievement were typically higher for Ns than for 5s. Furthermore, graduation rates were not higher for Is than for Es, but typically GP As, test scores, and high school achievement were higher for Is than for Es. Finally, the graduation rate was higher for Js than for Ps, although no difference existed in the college aptitude test scores for the two preferences.
Method
Study Participants. Two data sources were used: a database developed during a longitudinal study of a college freshman class, and the responses to a
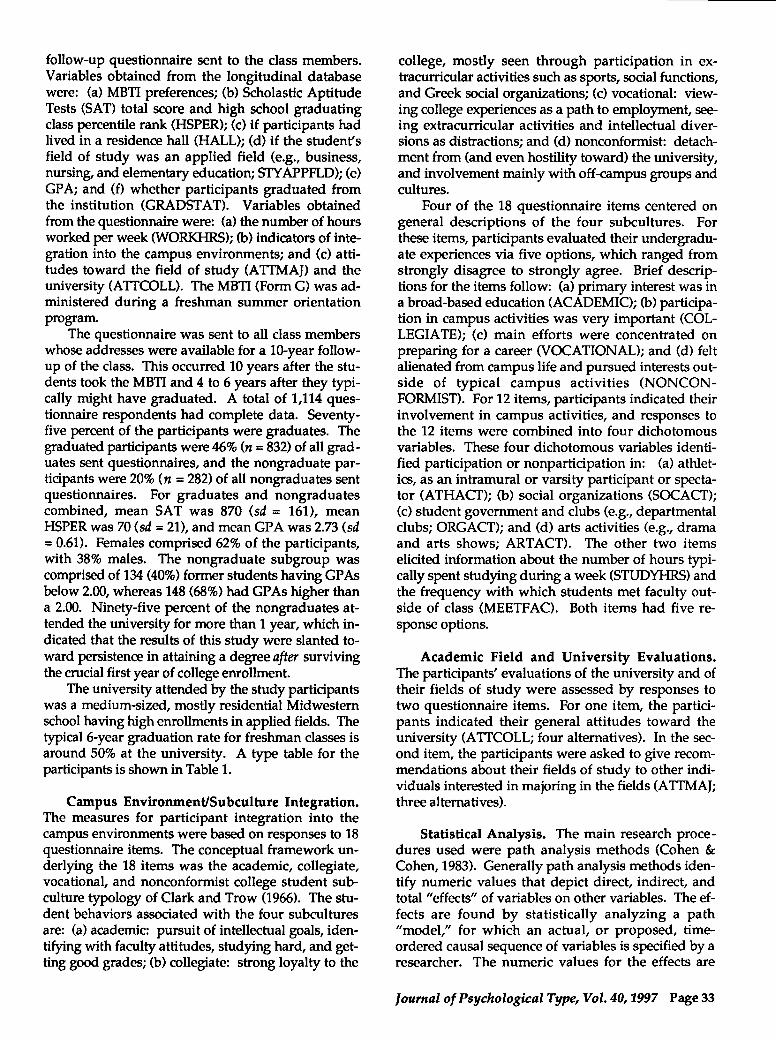
follow-up questionnaire sent to the class members. Variables obtained from the longitudinal database were: (a) MBTI preferences; (b) Scholastic Aptitude Tests (SAT) total score and high school graduating class percentile rank (HSPER); (c) if participants had lived in a residence hall (HALL); (d) if the student's field of study was an applied field (e.g., business, nursing, and elementary education; STY APPFLD); (e) GPA; and (f) whether participants graduated from the institution (GRADST AT). Variables obtained from the questionnaire were: (a) the number of hours worked per week (WORKHRS); (b) indicators of integration into the campus environments; and (c) attitudes toward the field of study (A TIMAJ) and the university (ATTCOLL). The MBTI (Form G) was administered during a freshman summer orientation program.
The questionnaire was sent to all class members whose addresses were available for a 10-year followup of the class. This occurred 10 years after the students took the MBTI and 4 to 6 years after they typically might have graduated. A total of 1,114 questionnaire respondents had complete data. Seventyfive percent of the participants were graduates. The graduated participants were 46% (n = 832) of all graduates sent questionnaires, and the nongraduate participants were 20% (n = 282) of all nongraduates sent questionnaires. For graduates and nongraduates combined, mean SAT was 870 (sd = 161), mean HSPER was 70 (sd = 21), and mean GP A was 2.73 (sd = 0.61). Females comprised 62% of the participants, with 38% males. The nongraduate subgroup was comprised of 134 (40%) former students having GPAs below 2.00, whereas 148 (68%) had GPAs higher than a 2.00. Ninety-five percent of the nongraduates attended the university for more than 1 year, which indicated that the results of this study were slanted toward persistence in attaining a degree after surviving the crucial first year of college enrollment.
The university attended by the study participants was a medium-sized, mostly residential Midwestern school having high enrollments in applied fields. The typical 6-year graduation rate for freshman classes is around 50% at the university. A type table for the participants is shown in Table 1.
Campus Environment/Subculture Integration. The measures for participant integration into the campus environments were based on responses to 18 questionnaire items. The conceptual framework underlying the 18 items was the academic, collegiate, vocational, and nonconformist college student subculture typology of Clark and Trow (1966). The student behaviors associated with the four subcultures are: (a) academic: pursuit of intellectual goals, identifying with faculty attitudes, studying hard, and getting good grades; (b) collegiate: strong loyalty to the
college, mostly seen through participation in extracurricular activities such as sports, social functions, and Greek social organizations; (c) vocational: viewing college experiences as a path to employment, seeing extracurricular activities and intellectual diversions as distractions; and (d) nonconformist: detachment from (and even hostility toward) the university, and involvement mainly with off-campus groups and cultures.
Four of the 18 questionnaire items centered on general descriptions of the four subcultures. For these items, participants evaluated their undergraduate experiences via five options, which ranged from strongly disagree to strongly agree. Brief descriptions for the items follow: (a) primary interest was in a broad-based education (ACADEMIC); (b) participation in campus activities was very important (COLLEGIATE); (c) main efforts were concentrated on preparing for a career (VOCATIONAL); and (d) felt alienated from campus life and pursued interests outside of typical campus activities (NONCONFORMIST). For 12 items, participants indicated their involvement in campus activities, and responses to the 12 items were combined into four dichotomous variables. These four dichotomous variables identified participation or nonparticipation in: (a) athletics, as an intramural or varsity participant or spectator (ATHACT); (b) social organizations (SOCACT); (c) student government and clubs (e.g., departmental clubs; ORGACT); and (d) arts activities (e.g., drama and arts shows; ARTACT). The other two items elicited information about the number of hours typically spent studying during a week (STUDYHRS) and the frequency with which students met faculty outside of class (MEETFAC). Both items had five response options.
Academic Field and University Evaluations. The participants' evaluations of the university and of their fields of study were assessed by responses to two questionnaire items. For one item, the participants indicated their general attitudes toward the university (A TTCOLL; four alternatives). In the second item, the participants were asked to give recommendations about their fields of study to other individuals interested in majoring in the fields (ATIMAJ; three alternatives).
Statistical Analysis. The main research procedures used were path analysis methods (Cohen & Cohen, 1983). Generally path analysis methods identify numeric values that depict direct, indirect, and total "effects" of variables on other variables. The effects are found by statistically analyzing a path "model," for which an actual, or proposed, timeordered causal sequence of variables is specified by a researcher. The numeric values for the effects are
Journal of Psychological Type, Vol. 40, 1997 Page 33
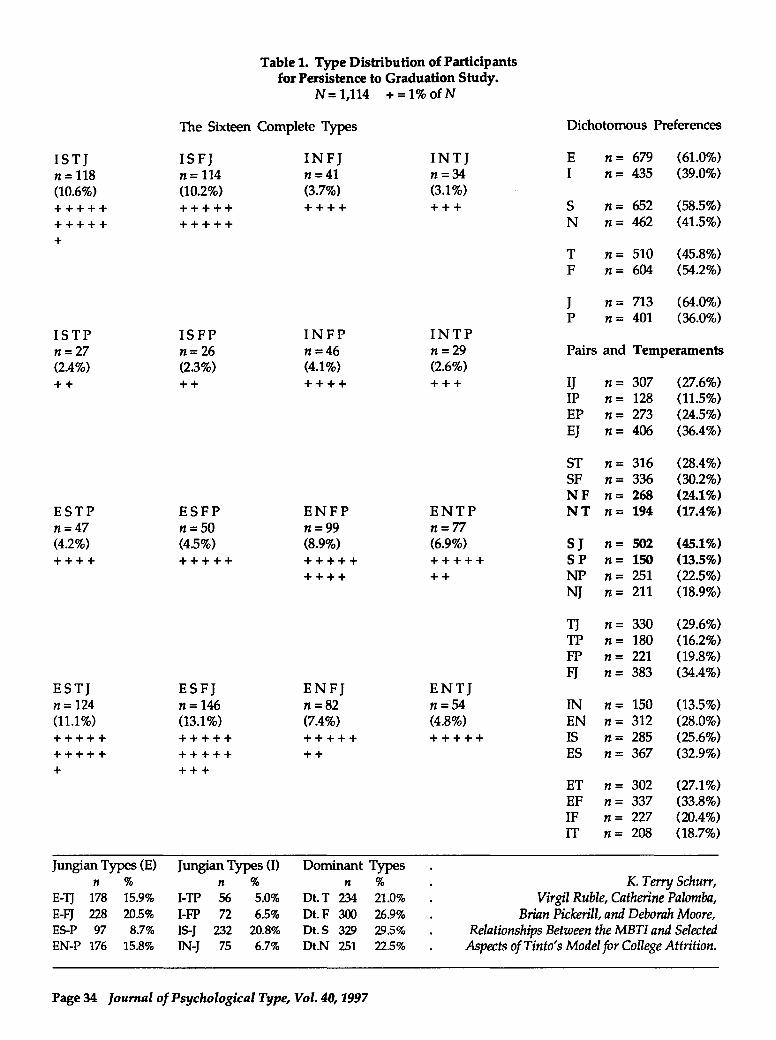
Table 1. Type Distribution of Participants for Persistence to Graduation Study.
N= 1,114 + = 1% of N
The Sixteen Complete Types Dichotomous Preferences
ISTJ ISFJ INFJ INTJ E n= 679 (61.0%)
n= 118 n= 114 n =41 n=34 I n= 435 (39.0%) (10.6%) (10.2%) (3.7%) (3.1%) +++++ +++++ ++++ +++ S n= 652 (58.5%)
+++++ +++++ N n= 462 (41.5%)
+ T n= 510 (45.8%) F n= 604 (54.2%)
J n= 713 (64.0%) P n= 401 (36.0%)
ISTP ISFP INFP INTP n=27 n=26 n=46 n=29 Pairs and Temperaments (2.4%) (2.3%) (4.1%) (2.6%) ++ ++ ++++ +++ IJ n= 307 (27.6%)
IP n= 128 (11.5%) EP n= 273 (24.5%) EJ n= 406 (36.4%)
ST n= 316 (28.4%) SF n= 336 (30.2%) NF n= 268 (24.1%)
ESTP ESFP ENFP ENTP NT n= 194 (17.4%) n=47 n=50 n=99 n=77 (4.2%) (4.5%) (8.9%) (6.9%) S} n= 502 (45.1%) ++++ +++++ +++++ +++++ SP n= 150 (13.5%)
++++ ++ NP n= 251 (22.5%)
NJ n= 211 (18.9%)
TJ n= 330 (29.6%) TP n= 180 (16.2%) FP n= 221 (19.8%)
FJ n= 383 (34.4%) ESTJ ESFJ ENFJ ENTJ n= 124 n= 146 n=82 n=54 IN n= 150 (13.5%) (11.1%) (13.1%) (7.4%) (4.8%) EN n= 312 (28.0%) +++++ +++++ +++++ +++++ IS n= 285 (25.6%) +++++ +++++ ++ ES n= 367 (32.9%) + +++
ET n= 302 (27.1%) EF n= 337 (33.8%) IF n= 227 (20.4%) IT n= 208 (18.7%)
Jungian Types (E) Jungian Types (I) Dominant Types n % n % n % K. Terry Schurr,
E-TJ 178 15.9% I-TP 56 5.0% Dt.T 234 21.0% Virgil Ruble, Catherine Palomba, E-FJ 228 20.5% I-FP 72 6.5% Dt.F 300 26.9% Brian Pickerill, and Deborah Moore, ES-P 97 8.7% IS-J 232 20.8% Dt.S 329 29.5% Relationships Between the MBT! and Selected EN-P 176 15.8% IN-J 75 6.7% Dt.N 251 22.5% Aspects of Tinto's Model for College Attrition.
Page 34 Journal of Psychological Type, Vol. 40, 1997

Abbreviation
ACADEMIC
ARTACT
ATHACT
ATTCOLL
ATTMAJ
COLLEGIATE
ES
GPA
GRADSTAT
HALL
HSPER
MEETFAC
NONCONFORMIST
ORGACT
SAT
SOCACT
STUDYHRS
STYAPPFLD
VOCATIONAL
WORKHRS
Questionnaire Items
ACADEMIC
COLLEGIATE
VOCATIONAL
NONCONFORMIST
ATHACT
SOCACT
OTHACT
ARTACT
MEETFAC
STUDYHRS
Glossary of Abbreviations (GLOSSABS)
Short Definition (See text for full explanation.)
Primary interest in a broad-based education.
Participation in arts activities.
Participation in athletics.
Attitude toward the university.
Attitude toward field of study.
Participation in campus activities was very important.
Effect size. (See text and notes in Tables 3 and 4.)
Grade Point Average.
Graduation from the university.
Living in a university residence hall.
High school graduating class percentile rank.
Frequency with which students met faculty outside of class.
Felt alienated from campus life/pursued interests outside typical campus activities.
Participation in student government and clubs.
Scholastic Aptitude Test total score.
Participation in social organizations.
Number of hours per week spent studying.
Student's field of study in an applied field.
Main efforts concentrated on preparing for a career.
Number of hours worked on jobs per week.
Table 2. Factor Loadings for the Campus Subculture Factors.
Factor 1 Factor 2
.03 .40
.63 .12
-.20 .12
-.78 .04
.60 .12
.70 .07
.18 .63
-.06 .60
.09 .68
.08 .44
Journal of Psychological Type, Vol. 40, 1997
Factor 3
-.62
-.47
.74
-.00
-.02
-.07
.02
-.19
.20
.54
Page 35

regression coefficients, and they indicate differences in one variable per one measurement unit for a second variable.
The direct effects yielded from path analysis procedures identify effects of proposed causal variables on other variables that are independent of the effects of all other proposed causal variables. Indirect effects identify effects of proposed causal variables on other variables that are mediated through other proposed causal variables (e.g., A is the cause of B, B is the cause of C, and, thus, A is an indirect cause of C, via B). Total effects are the arithmetic sum of the direct and indirect effects.
The LISREL 7 computer program (Joreskog & Sorbom, 1988) was used to compute the statistics for the path analysis model. The causal sequence for variables comprising the model was, from first to last: (a) the set of MBTI preferences; (b) the set of SAT, HSPER, HALL, and WORKHRS variables; (c) the set of student subculture and STY APPFLD variables; (d) the set of GPA, ATTMAJ, and ATTCOLL variables; and (e) GRADSTAT. In path analysis terminology, the MBTI preferences were exogenous variables; that is, no causes for the preferences were proposed. All other variables were endogenous variables, variables that were affected by variables specified earlier in the path sequence and that affected variables specified later in the sequence. Values for the SAT, HSPER, WORKHRS, GPA, ATTMAJ, ATTCOLL and student subculture variables were standardized (m = 0.0, sd = 1.00) for the analyses. The MBTI, HALL, and STY APPFLD variables were dichotomous.
Factor analysis was used to identify the student subculture variables and the levels of participant integration into the campus environment/subcultures. First, the underlying components for variables on the questionnaire used to identify the student subcultures were evaluated. Second, scores for the participants were computed from the result of a varimax rotation of the components. The criterion for the number of scores to be computed was the number of components having eigenvalues greater than 1.0. The factor analysis yielded uncorrelated values for participant levels of integration into all of the identified subcultures, as opposed to identifying the participants within a single subculture.
The LISREL 7 program provided statistics for the combined indirect effects, but it did not compute ttests for the indirect effects of variables on other variables via separate mediating variables. The t-tests obtained in this study for the indirect effect via separate variables were computed following Sobel's (1982) procedure. Partial effect size values (ES), or partial correlations (Cohen, 1988), were computed for all effects identified in the study. The ES values provided a common metric for evaluating the relative magnitude of the effects of variables on other
Page 36 Journal of Psychological Type, Vol. 40, 1997
variables. The ES values were computed using the procedure described by Rosenthal and Rosnow (1991) for converting t-test ratios to ES values.
Results
Campus Environment/Subcultures. The factor analysis of the campus environment/subculture questionnaire variables yielded three factors with eigenvalues larger than 1.0. Loadings for the rotated factors are shown in Table 2. The loadings on the first factor indicated high scores for participants with a combination of high levels of identification with the COLLEGIATE, ATHACT, and SOCACT variables, and low levels of identification with the NONCONFORMIST variable. The loadings on the second factor indicated high scores for a combination of high levels of identification with the ACADEMIC, ORGACT, ARTACT, STUDYHRS, and MEETFAC variables. The loadings for the third factor indicated high scores for a combination of high levels of identification with the VOCATIONAL and STUDYHRS variables and low levels of identification with the COLLEGIATE and ACADEMIC variables.
The factor loadings on the three factors indicated a fit with three of the Clark and Trow (1966) descriptions of college student subcultures: Factor I, their collegiate subculture; Factor 2, their academic subculture; and Factor 3, their vocational subculture. Consequently, the Clark and Trow names for the subcultures, and names used here for the subculture questionnaire items, were adopted for naming the three factors. The main difference between the Clark and Trow deSCriptions of the subcultures and the factor analysis results was that a separate factor was not found for their nonconformist subculture. Instead, the NONCONFORMIST subculture questionnaire item had a high negative loading on the factor labeled here as COLLEGIATE. That is, participants with high levels of identification with the collegiate subculture had low levels of identification with the nonconformist subculture, and vice versa.
A concept shared by the COLLEGIATE and ACADEMIC subculture factors was the level of participation in extracurricular activities: athletic and s0-
cial activities for the COLLEGIATE subculture factor and government and arts for the ACADEMIC subculture factor. Participation in extracurricular activities was not relevant for the VOCATIONAL subculture factor. A concept shared by the ACADEMIC and VOCATIONAL subculture factors was the number of hours typically spent studying during the week. The number of weekly hours spent studying was not relevant for the COLLEGIATE factor.
Total, Direct, and Combined Indirect MBTI Effects on GRADSTAT. The total, direct, and com-
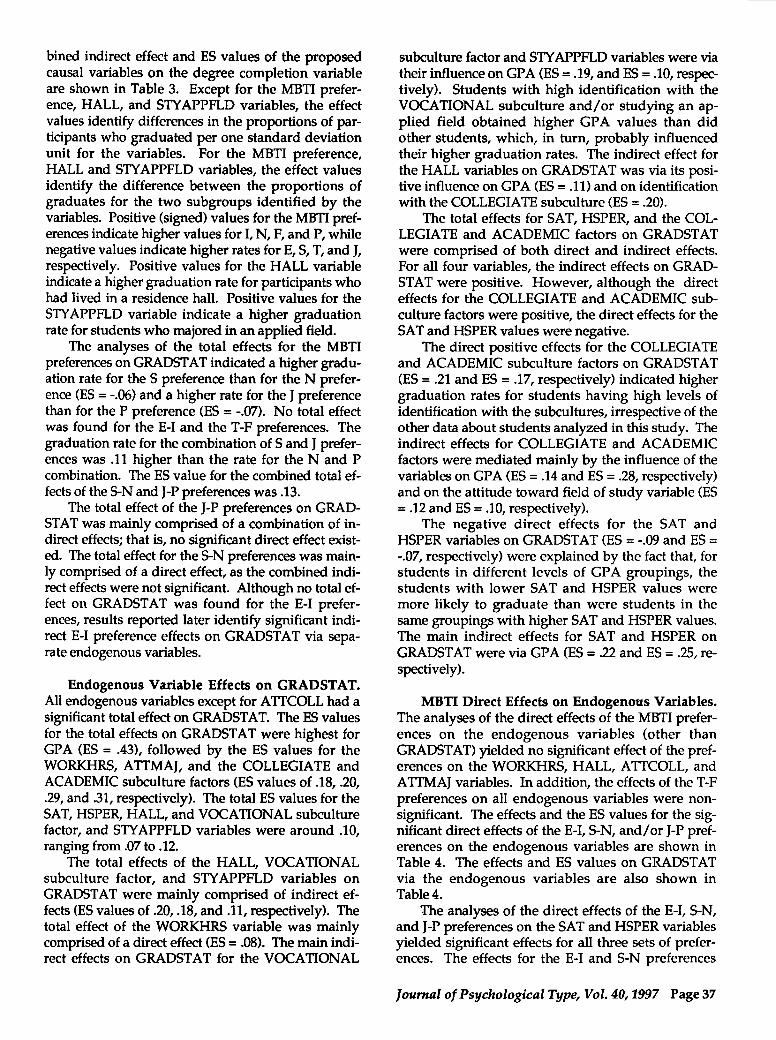
bined indirect effect and ES values of the proposed causal variables on the degree completion variable are shown in Table 3. Except for the MBTI preference, HALL, and STY APPFLD variables, the effect values identify differences in the proportions of participants who graduated per one standard deviation unit for the variables. For the MBTI preference, HALL and STY APPFLD variables, the effect values identify the difference between the proportions of graduates for the two subgroups identified by the variables. Positive (signed) values for the MBTI preferences indicate higher values for I, N, F, and P, while negative values indicate higher rates for E, S, T, and J, respectively. Positive values for the HALL variable indicate a higher graduation rate for participants who had lived in a residence hall. Positive values for the STY APPFLD variable indicate a higher graduation rate for students who majored in an applied field.
The analyses of the total effects for the MBTI preferences on GRADST AT indicated a higher graduation rate for the S preference than for the N preference (ES = -.06) and a higher rate for the J preference than for the P preference (ES = -.07). No total effect was found for the E-I and the T-F preferences. The graduation rate for the combination of Sand J preferences was .11 higher than the rate for the Nand P combination. The ES value for the combined total effects of the 5-N and J-p preferences was .13.
The total effect of the J-p preferences on GRADSTAT was mainly comprised of a combination of indirect effects; that is, no significant direct effect existed. The total effect for the 5-N preferences was mainly comprised of a direct effect, as the combined indirect effects were not significant. Although no total effect on GRADSTAT was found for the E-I preferences, results reported later identify significant indirect E-I preference effects on GRADST AT via separate endogenous variables.
Endogenous Variable Effects on GRADSTAT. All endogenous variables except for A TTCOLL had a significant total effect on GRADSTAT. The ES values for the total effects on GRADST A T were highest for GPA (ES = .43), followed by the ES values for the WORKHRS, ATTMAJ, and the COLLEGIATE and ACADEMIC subculture factors (ES values of .18, .20, .29, and .31, respectively). The total ES values for the SAT, HSPER, HALL, and VOCATIONAL subculture factor, and STYAPPFLD variables were around .10, ranging from .07 to .12.
The total effects of the HALL, VOCATIONAL subculture factor, and STY APPFLD variables on GRADST AT were mainly comprised of indirect effects (ES values of .20, .18, and .11, respectively). The total effect of the WORKHRS variable was mainly comprised of a direct effect (ES = .08). The main indirect effects on GRADSTAT for the VOCATIONAL
subculture factor and STY APPFLD variables were via their influence on GPA (ES = .19, and ES = .10, respectively). Students with high identification with the VOCATIONAL subculture and/or studying an applied field obtained higher GP A values than did other students, which, in turn, probably influenced their higher graduation rates. The indirect effect for the HALL variables on GRADSTAT was via its positive influence on GPA (ES = .11) and on identification with the COLLEGIATE subculture (ES = .20).
The total effects for SAT, HSPER, and the COLLEGIATE and ACADEMIC factors on GRADSTAT were comprised of both direct and indirect effects. For all four variables, the indirect effects on GRADSTAT were positive. However, although the direct effects for the COLLEGIATE and ACADEMIC subculture factors were positive, the direct effects for the SAT and HSPER values were negative.
The direct positive effects for the COLLEGIATE and ACADEMIC subculture factors on GRADSTAT (ES = .21 and ES = .17, respectively) indicated higher graduation rates for students having high levels of identification with the subcultures, irrespective of the other data about students analyzed in this study. The indirect effects for COLLEGIATE and ACADEMIC factors were mediated mainly by the influence of the variables on GPA (ES = .14 and ES = .28, respectively) and on the attitude toward field of study variable (ES = .12 and ES = .10, respectively).
The negative direct effects for the SAT and HSPER variables on GRADSTAT (ES = -.09 and ES = -.07, respectively) were explained by the fact that, for students in different levels of GP A groupings, the students with lower SAT and HSPER values were more likely to graduate than were students in the same groupings with higher SAT and HSPER values. The main indirect effects for SAT and HSPER on GRADSTATwere via GPA (ES = .22 and ES = .25, respectively).
MBTI Direct Effects on Endogenous Variables. The analyses of the direct effects of the MBTI preferences on the endogenous variables (other than GRADST AT) yielded no significant effect of the preferences on the WORKHRS, HALL, A TTCOLL, and ATTMAJ variables. In addition, the effects of the T-F preferences on all endogenous variables were nonsignificant. The effects and the ES values for the significant direct effects of the E-I, 5-N, and/or J-p preferences on the endogenous variables are shown in Table 4. The effects and ES values on GRADSTAT via the endogenous variables are also shown in Table 4.
The analyses of the direct effects of the E-I, 5-N, and J-p preferences on the SAT and HSPER variables yielded significant effects for all three sets of preferences. The effects for the E-I and S-N preferences
Journal of Psychological Type, Vol. 40, 1997 Page 37

Variables
E-I
5-N
T-F
J-p
SAT
HSPER
WORKHRS
HALL
COLLEGIATE
ACADEMIC
VOCATIONAL
STYAPPFLD
GPA
ATTCOLL
ATTMAJ
Table 3. Total, Direct, and Combined Indirect Effect and ES Values for the Variables on Graduation Status.
Effects
Total Direct Combined Total Indirect
Exogenous MBTI Preference Variables
-.02 -.01 -.01 -.02
-.05* -.07* .02 -.06*
-.03 -.02 -.01 -.03
-.06* .02 -.07* -.07*
Endogenous Variables Specified First in Path Model
.04* -.04* .07* .07*
.06* -.03* .09* .12*
.08* .08* .00 .18*
.13* -.03 .16* .10'"
Endogenous Variables Specified Second in Path Model
.12* .08* .04* .29*
.12* .06* .07* .31*
.04* .00 .04* .10'"
.05* .01 .04* .07*
Endogenous Variables Specified Third in Path Model
.21* .43*
.02 .04
.08* .20'"
ESValues
Direct Combined Indirect
-.01 -.02
-.09* .03
-.03 -.02
.02 -.12*
-.09* .22*
-.07* .25*
.22* .00
-.03 .20'"
.21* .17*
.17* .33*
.01 .18*
.01 .11*
Note: Except for the MBTI preference, HALL, and STY APPFLD variables, the effect values identify differences in proportions of study participants who graduated per one standard deviation unit for the variables. For the MBTI preference, HALL, and STY APPFLD variables, the effect values identify differences between proportions of graduates for the two subgroups identified by the variables. Total and direct effects are the same for the GP A, A TTCOLL, and A TTMAJ variables.
*p<.05
Page 38 Journal of Psychological Type, Vol. 40,1997

Table 4. Direct Effect and ES Values of the E-I, N-S, and J-p Preferences on Selected Endogenous Variables, and Indirect Effect and ES Values of the Preferences on Graduation Status via the Variables.
Endogenous Variables
SAT
HSPER
COLLEGIATE
ACADEMIC
VOCATIONAL
STYAPPFLD
GPA
Effects
E-I S-N J-p E-I
Direct Effect and ES Values on Endogenous Variables
.34* .61* .00 .18*
.24* .17* -.22* .13*
-.38* -.04 .02 -.20*
-.02 .17* -.15* -.01
.07 -.17* -.31* .04
.03 -.17* -.05 .03
.07 -.04 -.12* .04
Indirect Effect and ES Values on GRADST AT Via Endogenous Variables
SAT .01* .02* .00 .07*
HSPER .01* .01* -.01* .09*
COLLEGIATE -.04* -.01 .00 -.16*
ACADEMIC .00 .02* -.02* -.01
VOCATIONAL .00 -.01* -.01* .03
STYAPPFLD .00 -.01* .00 .03
GPA .01 -.01 -.03* .04
Combined -.01 .02 -.07* -.02
ES Values
S-N J-p
.30* .00
.09* -.12*
-.02 .01
.08* -.08*
-.08* -.15*
-.16* -.05
-.02 -.07*
.07* .00
.07* -.09*
-.02 .01
.08* -.07*
-.06* -.08*
-.07* -.04
-.02 -.08*
.03 -.12*
Note: Direct effect values for all variables except STY APPFLD are differences in the means for the variables, after standardization, for the MBTI preference dichotomies. The direct effect value for the STY APPFLD variable is the difference in proportions majoring and not majoring in an applied field for the dichotomies. The indirect effect values shown for the endogenous variables are differences in proportions of graduates for the MBTI preference dichotomies that are explained by the effect of the preferences on the variables.
*p< .05
Joumal of Psychological Type, Vol. 40, 1997 Page 39
indicated higher SAT and HSPER means for I than for E (ES = .18 and ES = .13, respectively) and higher SAT and HSPER means for N than for S (ES = .30 and .09, respectively). The significant effect for the J-p preferences was a higher HSPER mean for J than for P (ES = -.11).
The analyses for the direct effects of the E-I, 5-N, and J-p preferences on the subculture factors yielded significant effects for all three sets of preferences. For the E-I preferences, the level of identification with the COLLEGIATE subculture factor was higher for E than for I (ES = -.20). Both the 5-N and the J-p preferences had significant direct effects on the ACADEMIC and VOCATIONAL subculture factors. The level of identification with the ACADEMIC factor was higher for N than for S (ES = .08). In contrast, the level of identification with the VOCATIONAL factor for the 5-N preference was higher for S than for N (ES = -.08). Identification with both the ACADEMIC and VOCATIONAL factors was higher for J than for P (ES = -.08 and ES = -.15, respectively).
A significant direct effect was found for the MBTI preferences on each of the STY APPFLD and GP A variables. The effects were an S-N effect on STY APPFLD and a J-p effect on GP A. The 5-N effect for STY APPFLD indicated that a higher proportion of participants with S preferences than with N preferences studied applied fields (ES = -.16). The J-p effect for GP A indicated higher GPA values for participants having J preferences than for participants having P preferences (ES = -.07).
MBTI Indirect Effects on GRADSTAT via Separate Variables. The analyses for the indirect effects of the E-I, S-N, and J-p preferences on the GRADSTAT variable via separate endogenous variables yielded different patterns of effects for the sets of preferences. First, different endogenous variables were involved in the effects for different pairs of preferences. Second, the positive effects on GRADSTAT via the endogenous variables were not consistently associated with the same preference for a pair of preferences.
The pattern of indirect effects via the endogenous variables was simplest for the J-p preferences, as all significant effects pointed to a higher graduation rate for Js than for Ps. The significant effects pointing to a higher graduation rate for Js were via higher levels of high school achievement (HSPER, ES = -.09), identification with the ACADEMIC subculture (ES = -.07), identification with the VOCATIONAL subculture (ES = -.08), and GPA values (ES = -.08).
In contrast to the pattern of effects for the J-p preferences, some significant separate indirect effects on GRADSTAT for the 5-N preferences linked the S preference with a higher graduation rate, whereas other effects linked N with a higher rate. The indirect
Page 40 Journal of Psychological Type, Vol. 40, 1997
effects of the 5-N preferences via the SAT, HSPER, and ACADEMIC subculture variables pointed to a higher graduation rate for the study subgroup having an N preference (ES values of .07, .07, and .08, respectively). However, significant indirect effects via the VOCATIONAL subculture and STYAPPFLD variables for the S-N preferences pointed to a higher graduation rate for the subgroup having an S preference (ES = -.06 and ES = -.07, respectively). Combined, the net result for the S-N preference was a nonSignificant indirect effect.
The pattern of separate indirect effects for the E-I preferences on GRADSTAT was similar to the pattern for the 5-N preferences. Some significant effects linked E with a higher graduation rate, whereas others linked I with a higher rate. For the SAT and HSPER variables, the indirect effects pointed to a higher graduation rate for the study group having the I preference (ES = .07 and ES = .09, respectively). The indirect effect via identification with the COLLEGIATE subculture factor pointed to a higher graduation rate for the group having the E preference (ES = -.16).
Discussion and Conclusion
The findings in this study supported the Tinto (1975), Clark and Trow (1966), and MBTI (Myers & McCaulley, 1985) conceptual models that provided the framework for this study. The main support for Tinto's model was that levels of students' integration into their college environments, along with their levels of academic preparation, ostensibly affected their ability and/or inclination to persist in attaining a degree. The Clark and Trow student subculture typology was used for the conceptual framework in evaluating integration into the campus environments, and supporting data were found for the Clark and Trow collegiate, academic, and vocational subculture concepts. The findings for the MBTI preferences were consistent with previous research on student campus activities (Provost & Anchors, 1987a) and indicated that type preferences were related to behaviors associated with student involvement in different campus subcultures. In addition, the preferences were related to academic preparation for college, college GP A (e.g., Schurr & Ruble, 1986), and whether or not a degree was obtained (e.g., Anchors et al., 1987; Schurr et al.,1990).
The principal implication of the findings for the Tinto (1975) model was that high levels for some aspects of the total college experience can offset lower levels for other aspects in determining whether students will persist to graduation. Although GP A was the most important variable affecting persistence, it was clear that high levels of identification with the campus subcultures could offset the effects of lower

GP A levels in determining persistence (if the GP A was not so low that it caused academic disqualification).
The main implication of the findings for the Oark and Trow (1966) model was that different identifiable campus subcultures exist. Further, high levels of identification with any of their academic, collegiate, and vocational subcultures can positively contribute to students continuing to pursue a degree. Here, it is important to note that the high level of identification does not have to be with only the traditional campus collegiate or "social" subculture. High levels of identification with the "broad education" or academic subculture, or the job-oriented vocational subculture, can offset lower levels of involvement with campus activities traditionally identified with the collegiate subculture.
The findings for the MBTI E-I preferences were in line with both MBTI theory and the Tinto (1975) assertion that certain positive personal and environmental aspects can offset other aspects, which might be negative, in determining academic behavior. The higher levels of academic preparation for college for the participant subgroup having the I preference were seen as positively affecting their graduation rate. On the other hand, the higher level of identification of the subgroup having the E preference with the collegiate subculture contributed positively to their graduation rate. The net result of the disparate effects was a nonsignificant total relationship of the E-I preferences with degree attainment.
The findings for the J-p preferences suggested an advantageous ongoing "academic work ethic" held by students with the J preference. In particular, separate indirect effects on degree completion via variables implying such an ethic were found for the J-p preferences. The mean values (identified by the statistical "effects" yielded by the analyses) for the college GP A and high school achievement variables were higher for study participants with the J preference than for participants with the P preference. Furthermore, mean values (indicated by the effects) for participant identification with the academic and vocational subculture variables were higher for Js than for Ps. The latter findings for the two subcultures were interpreted as indicating a higher level of academic work ethic for Js, as "studying hard" was found to be a common element for defining high levels of identification with the two subcultures.
For the 5-N preferences, the higher levels of academic preparation for college of Ns were seen as positively contributing to their graduation rate via the indirect effects of academic preparation on degree completion. However, overall (Le., the total effect), a higher graduation rate was found for Ss than for Ns. Furthermore, although relationships of the E-I and J-p preferences with degree attainment could be ex-
plained via the effects of these pairs of preferences on other variables included in the study, the overall relationship of the 5-N preferences with degree attainment could not be explained via other variables. Essentially, the findings for 5-N preferences suggest an advantage in completing a degree for students typically having a tolerance for performing routine tasks for an extended period of time.
Although the statistical analyses yielded several significant direct and indirect effects of the MBTI preferences on degree attainment, the magnitude of the separate effect size values (i.e., ranging from .06 to .12) for the relationships was "small" according to Cohen's (1988) criteria for the magnitude of effect size values. However, considering that attrition studies typically find small if any relationships of variables with graduation/attrition after relationships for traditional predictors of graduation/attrition have been controlled, the relationships seem meaningful. In particular, the combined S-N and J-p total effects on degree completion indicated that the graduation rate for the SJ combination was .11 higher than the rate for the NP combination. An 11 % difference in graduation rates would attract the attention of university administrators, if such a difference were found for an experimental program designed to improve retention or for an admissions procedure designed to select students having a higher probability of graduating.
Finally, contributors to the Provost and Anchors (1987b) overview of applications of the MBTI in higher education settings reviewed a number of studies and made a wide range of suggestions for using the MBTI in such settings. The present study looked at the linkage of MBTI preferences with ideas about several areas provided in the overview: college academic preparation, field of study, GPA, campus activities, and degree completion. Although the results of this study supported the ideas about separate areas found in the overview, the main contribution of this study was to link empirically the MBTI preferences to the areas and to link the areas to each other within the context of a single study.
References
Anchors,S., Robbins, M., & Gershman, E. (1987). The relationship between Jungian types and persistence to graduation among college students. Journal of Psychological Type, 17, 20-25.
Bean, J. P., & Metzner, B. S. (1985). A conceptual model of nontraditional student attrition. Review of Educational Research, 55, 485-540.
Benson, S. (1995). NCAA Division I graduation-rates report. Overland Park, KS: National Collegiate Athletic Association.
Clark, B., & Trow, M. (1966). The organizational climate. In T. Newcomb & E. Wilson (Eds.), College
Journal of Psychological Type, Vol. 40, 1997 Page 41

peer groups (pp. 17-70). Chicago: Aldine Publishing Company.
Cohen, J. (1988). Statistical power analysis for the behavioral sciences. Hillsdale, NJ: Lawrence Erlbaum Associates.
Cohen, J., & Cohen, P. (1983). Applied multiple regression/correlation analysis for the behavioral sciences. Hillsdale, NJ: Lawrence Erlbaum Associates.
Joreskog, K., & Sorbom, D. (1988). LISREL VII: Analysis of linear structural relationships by maximum likelihood, instrumental variables, and least squares methods. Mooresville, IN: Scientific Software, Inc.
Kalsbeek, D. (1987). Campus retention: The MBTI in institutional self-studies. In J. Provost & S. Anchors (Eds.), Applications of the Myers-Briggs Type Indicator in higher education (pp.30-63). Palo Alto, CA: Consulting Psychologists Press.
Kalsner, L. (1991). Issues in college student retention. Higher Education Extension Review, 3, 1~.
Morning, C. (1991). Viewpoint. Higher Education Extension Review, 3, 7-8.
Myers, I. B., & McCaulley, M. H. (1985). Manual: A guide to the development and use of the MyersBriggs Type indicator. Palo Alto, CA: Consulting Psychologists Press.
Pace, C. R. (1979). Measuring the outcomes of college. San Francisco: Jossey-Bass.
Pantages, T. J., & Creedon, C. F. (1978). Studies of college attrition-1950-1975. Review of Educational Research, 48, 49-101.
Pascarella, E., & Terenzini, P. (1991). How college affects students: Findings and insights from twenty years of research. San Francisco: Jossey-Bass.
Pettit, J. (1991, Summer). Listening to your alumni: One way to assess academic outcomes. AIR Professional File, 41,1-10.
Provost, J., & Anchors, S. (1987a). Student involvement and activities. In J. Provost & S. Anchors (Eds.), Applications of the Myers-Briggs Type Indicator in higher education (pp. 90-106). Palo Alto, CA: Consulting Psychologists Press.
Provost, J., & Anchors, S. (1987b). Applications of the Myers-Briggs Type Indicator in higher education. Palo Alto, CA: Consulting Psychologists Press.
Rootman, I. (1972). Voluntary withdrawal from a total adult socializing organization: A model. Sociology of Education, 45, 258-270.
Rosenthal, R., & Rosnow, R. (1991). Essentials of behavioral research: Methods and data analysis. New York: McGraw-Hill Publishing Company.
Roush, P. (1989). MBTI type and voluntary attrition at the United States Naval Acrtdemy. Journal of Psychological Type, 18, 72-79.
Schurr, K. T., & Ruble, V. (1986). The Myers- Briggs Type Indicator and first-year college achieve-
Page 42 Journal of Psychological Type, Vol. 40,1997
ment: A look beyond aptitude test results. Journal of Psychological Type, 12,25-37.
Schurr, K. T., Henriksen, L., & Ruble, V. (1990). Effects of different university admission practices on the MBTI and gender composition of a student body, graduation rate, and enrollment in different departments. Journal of Psychological Type, 18,24-32.
Schurr, K. T., Ruble, V., & Henriksen, L. (1988). Relationships of Myers-Briggs Type Indicator characteristics and self-reported academic problems with Scholastic Aptitude Test Scores. Educational and Psychological Measurement, 48,187-196.
Sobel, M. (1982). Asymptotic confidence intervals for indirect effects in structural equation models. In S. Leinhardt (Ed.), Sociological methodology 1982 (pp.290-312). San Francisco: Jossey-Bass.
Tinto, V. (1975). Dropouts from higher education-A theoretical synthesiS of recent research. Review of Educational Research, 45, 89-125.
Tinto, V. (1987). Leaving college: Rethinking the causes and cures of student attrition. Chicago: University of Chicago Press.
Authors' Note
This study was conducted through the university's offices of Academic Assessment and Institutional Research, of which three authors are members. The office personnel conduct research for the Academic Affairs and Student Affairs areas of the university. One ongoing responsibility of the offices is to collect information about students before their entering college, during college, at graduation, as well as after graduation. The conceptual framework used for the study was consistent with research conducted within the offices, as well as in line with published studies that used the study participants' freshman class.
Editor's Note
The Glossary of Abbreviations was added by the Editor to facilitate comprehension of the text and provide a ready reference for readers.
Dr. K. Terry Schurr Computing Services
Contact
and Educational Psychology Ball State University Muncie, IN 47306
(317) 285-1317
... ... ...