Embed Size (px)
Citation preview
*Corresponding author, e-mail: [email protected]
GU J Sci 30(3): 63-77 (2017)
Gazi University
Journal of Science
http://dergipark.gov.tr/gujs
Experimental Investigation of Velocity and Turbulence Variations in
Inclined Jet in Cross-Flow
İbrahim KOÇ1,*
1Istanbul Gelisim University, School of Applied Sciences, Department of Aircraft Fuselage-Engine Maintenance, 34310 Avcilar, Istanbul,
Turkey
Article Info
Abstract
In this study, the changes of velocity and turbulence for an inclined jet in cross-flow are
investigated experimentally. Cylindrical and rectangular hole geometries are used in the
experiments. The blowing ratio is 1.75, and the injection angle with respect to the horizontal
plane is 30o. The injection holes in the models are in a single row. The diameters of holes,
which have a cylindrical cross section, are 8.5 mm. The rectangular cross section holes are 9
x 6.5 mm. The injection holes are inclined at 30o along the mainstream direction. The air is
injected at 57 oC and its blowing ratio is 1.75. The results show that turbulence intensity
changes with hole geometry. In this study, turbulence intensity is higher in the region close to
the wall because of the jet impact. The penetrations of the cylindrical jets into the main flow
are deeper than the penetrations of the rectangular jets, and turbulence intensities of the
cylindrical jets are larger than the penetrations of the rectangular jets.
Received: 16/05/2015
Accepted: 03/08/2017
Keywords
Inclined Jets,
Rectangular Jet,
Turbulence Intensity, Velocity Measurement.
1. INTRODUCTION
Cross-flow in jet flows, or cross jets, can be observed in several areas: Vertical take-off and landing of
aircraft (in aviation), environment (confluence of rivers to the sea), and industrial applications (cooling
of gas turbines, confluence of smoke released into the atmosphere). The vortex structures seen in a jet
in a cross-flow phenomenon have numerous applications and are obtained using the Reynolds Stress
Turbulence Model [1].
Hydrodynamic measurements of jets in cross-flow for gas turbine film cooling applications were
investigated [2].
Mixing processes in turbulent fluid motion are of fundamental value in many situations in engineering
practice, such as pollutant formation, heat and mass transfer, and chemical reactions. The large eddy
simulation (LES) methodology was used to investigate how turbulent mixing can be enhanced by
varying the angle between the jet and the oncoming cross-flow [3].
Numerical simulation of gas-solid flow was performed with an inclined jet, in a two-dimensional
fluidized bed. The mechanism of jet formation was analyzed using both numerical simulations and
experiments. The influences of jet velocity, nozzle diameter, nozzle inclination and jet position on jet
penetration length were obtained [4].
A three-dimensional numerical simulation of fluid flow and heat transfer characteristics of an inclined
jet, with cross-flow impinging on a heating plate, was presented [5]. The turbulent-governing equations
are solved by a control-volume-based finite-difference method with a power-law scheme, and the well-
known k– turbulence model and its associate wall function are used to describe the turbulent structure.
The velocity and pressure terms of momentum equations are solved by the SIMPLE method.
The reactants are generally injected into industrial furnaces by jets. An effective method to act on
combustion in such systems is to control the injection jets. The control of turbulent flames by the
deflection of jets in a natural gas–oxygen burner was studied[6]. Results show that control by inclined
jets has a considerable effect on dynamics and flame topology. Measurements showed that the deflection
favors the mixing and accelerates the fusion of jets, allowing flame stabilization.
64 İbrahim KOÇ / GU J Sci, 30(3):63-77(2017)
To improve the efficiency of gas turbine engines, the gas inlet temperature has to increase beyond the
failure temperature of the turbine blade and vane material. In other words, gas turbine blades have to be
protected from the hot gases using a thin fluid film wrapped around the blade. To achieve such a
protective layer, cooler air is injected through discrete holes on the blade surface. This problem has been
analyzed in several numerical and experimental studies [7-10]. The turbulent flow structure and vortex
dynamics of a jet-in-a-cross-flow (JICF) problem, which are related to gas turbine blade film cooling,
are investigated using the particle-image velocimetry (PIV) technique [11]. The results show a higher
mass-flux ratio to enlarge the size of the recirculation region, leading to a more pronounced entrainment
of hot outer fluid into the wake of the jet. The results of the experimental measurements are used to
validate the numerical findings. This comparison shows an excellent agreement for mean velocity and
higher moment velocity distributions.
The flow field of a radial wall jet, created by the impingement of a round synthetic jet normal to a flat
surface, was characterized using hot-wire anemometry [12]. The width of the outer layer of the synthetic
wall jets is observed to increase linearly with radial distance along the wall.
In this study, the changes of velocity and turbulence for an inclined jet in cross flow are investigated
experimentally. Cylindrical and rectangular hole geometries are used in the experiments. The effects of
the hole geometries on turbulence and velocity are compared. In addition, the penetration effects to the
main flow of inclined jets are investigated.
2. EXPERIMENTAL APPARATUS AND PROCEDURE
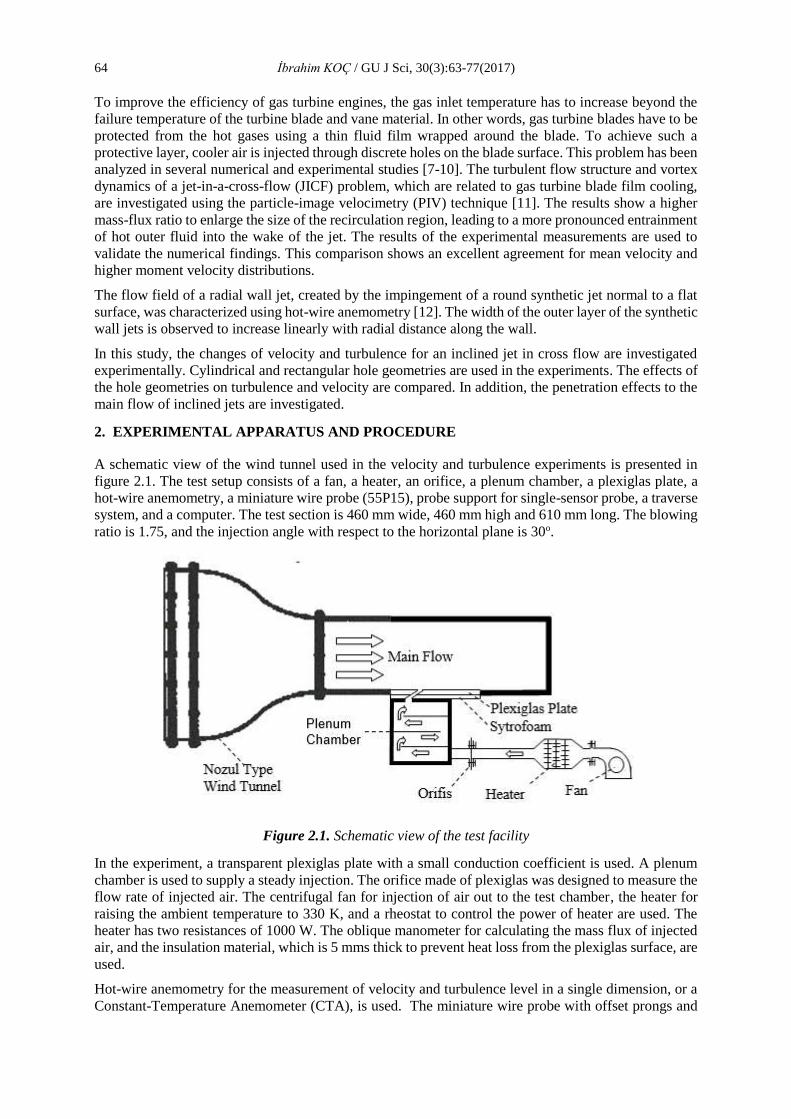
A schematic view of the wind tunnel used in the velocity and turbulence experiments is presented in
figure 2.1. The test setup consists of a fan, a heater, an orifice, a plenum chamber, a plexiglas plate, a
hot-wire anemometry, a miniature wire probe (55P15), probe support for single-sensor probe, a traverse
system, and a computer. The test section is 460 mm wide, 460 mm high and 610 mm long. The blowing
ratio is 1.75, and the injection angle with respect to the horizontal plane is 30o.
Figure 2.1. Schematic view of the test facility
In the experiment, a transparent plexiglas plate with a small conduction coefficient is used. A plenum
chamber is used to supply a steady injection. The orifice made of plexiglas was designed to measure the
flow rate of injected air. The centrifugal fan for injection of air out to the test chamber, the heater for
raising the ambient temperature to 330 K, and a rheostat to control the power of heater are used. The
heater has two resistances of 1000 W. The oblique manometer for calculating the mass flux of injected
air, and the insulation material, which is 5 mms thick to prevent heat loss from the plexiglas surface, are
used.
Hot-wire anemometry for the measurement of velocity and turbulence level in a single dimension, or a
Constant-Temperature Anemometer (CTA), is used. The miniature wire probe with offset prongs and
İbrahim KOÇ / GU J Sci, 30(3):63-77(2017) 65
a sensor perpendicular to the probe axis are used for velocity and turbulence measurements. This probe
is designed for boundary layers. The shape of the prongs permits measurements close to a solid wall
without disturbance from the probe body outside the boundary layer. Mounts with the probe axis are
parallel to the direction of flow. The measurement probe is calibrated in the wind tunnel before velocity
and turbulence are measured. The velocity values for calibration were 0, 5, 10, 15, 20, 25 and 30 m/s.
The traverse system is used to move the probe to a known point. The computer is used to analyze the
data obtained from hot wire anemometry.
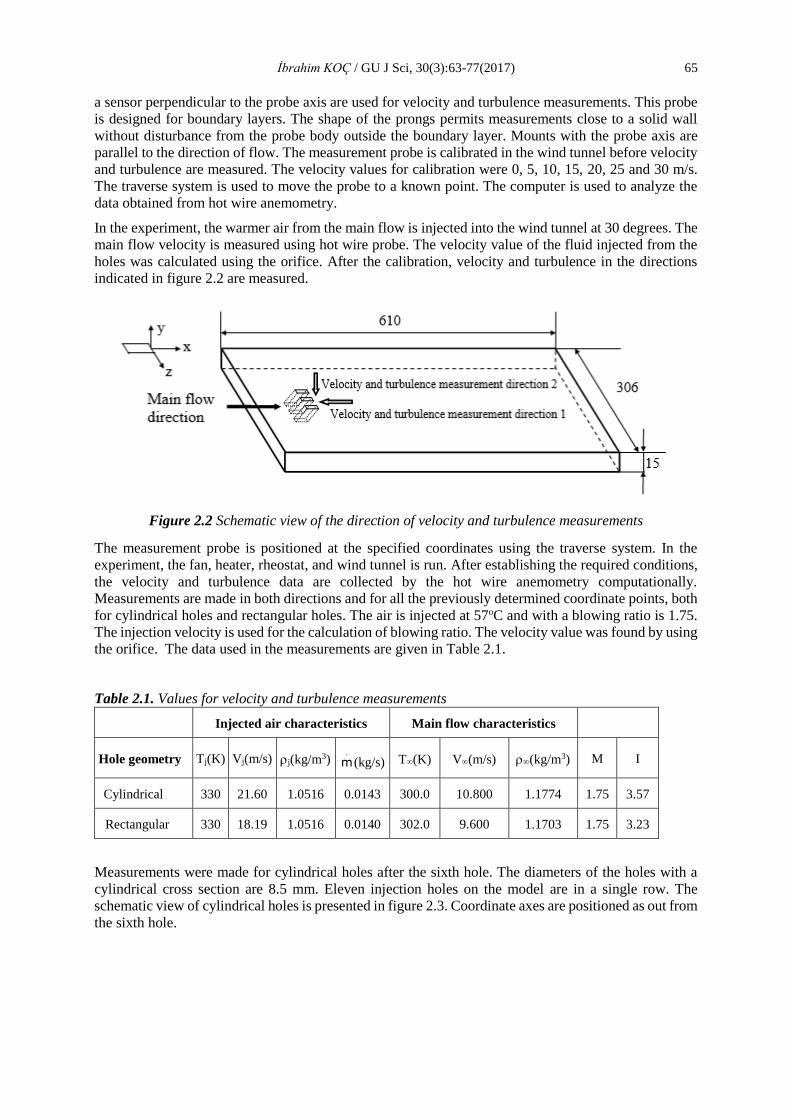
In the experiment, the warmer air from the main flow is injected into the wind tunnel at 30 degrees. The
main flow velocity is measured using hot wire probe. The velocity value of the fluid injected from the
holes was calculated using the orifice. After the calibration, velocity and turbulence in the directions
indicated in figure 2.2 are measured.
Figure 2.2 Schematic view of the direction of velocity and turbulence measurements
The measurement probe is positioned at the specified coordinates using the traverse system. In the
experiment, the fan, heater, rheostat, and wind tunnel is run. After establishing the required conditions,
the velocity and turbulence data are collected by the hot wire anemometry computationally.
Measurements are made in both directions and for all the previously determined coordinate points, both
for cylindrical holes and rectangular holes. The air is injected at 57oC and with a blowing ratio is 1.75.
The injection velocity is used for the calculation of blowing ratio. The velocity value was found by using
the orifice. The data used in the measurements are given in Table 2.1.
Table 2.1. Values for velocity and turbulence measurements
Injected air characteristics Main flow characteristics
Hole geometry Tj(K) Vj(m/s) j(kg/m3) (kg/s) T(K) V(m/s) (kg/m3) M I
Cylindrical 330 21.60 1.0516 0.0143 300.0 10.800 1.1774 1.75 3.57
Rectangular 330 18.19 1.0516 0.0140 302.0 9.600 1.1703 1.75 3.23
Measurements were made for cylindrical holes after the sixth hole. The diameters of the holes with a
cylindrical cross section are 8.5 mm. Eleven injection holes on the model are in a single row. The
schematic view of cylindrical holes is presented in figure 2.3. Coordinate axes are positioned as out from
the sixth hole.
.
m
66 İbrahim KOÇ / GU J Sci, 30(3):63-77(2017)
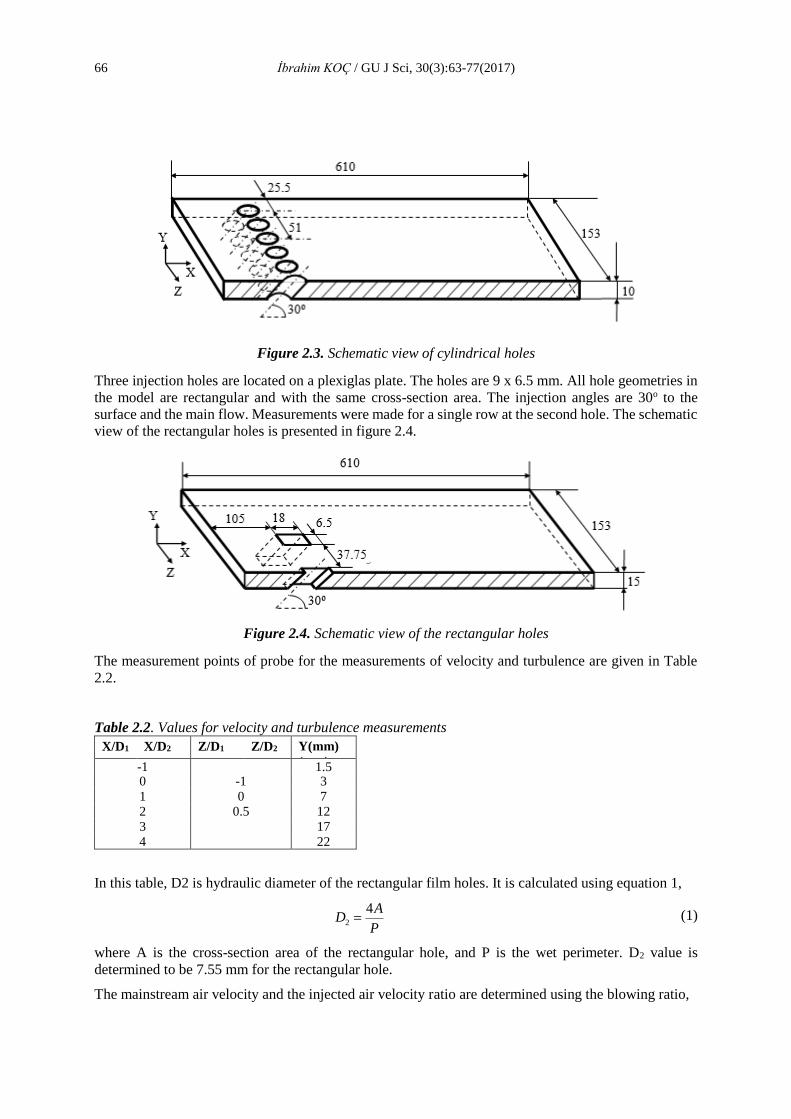
Figure 2.3. Schematic view of cylindrical holes
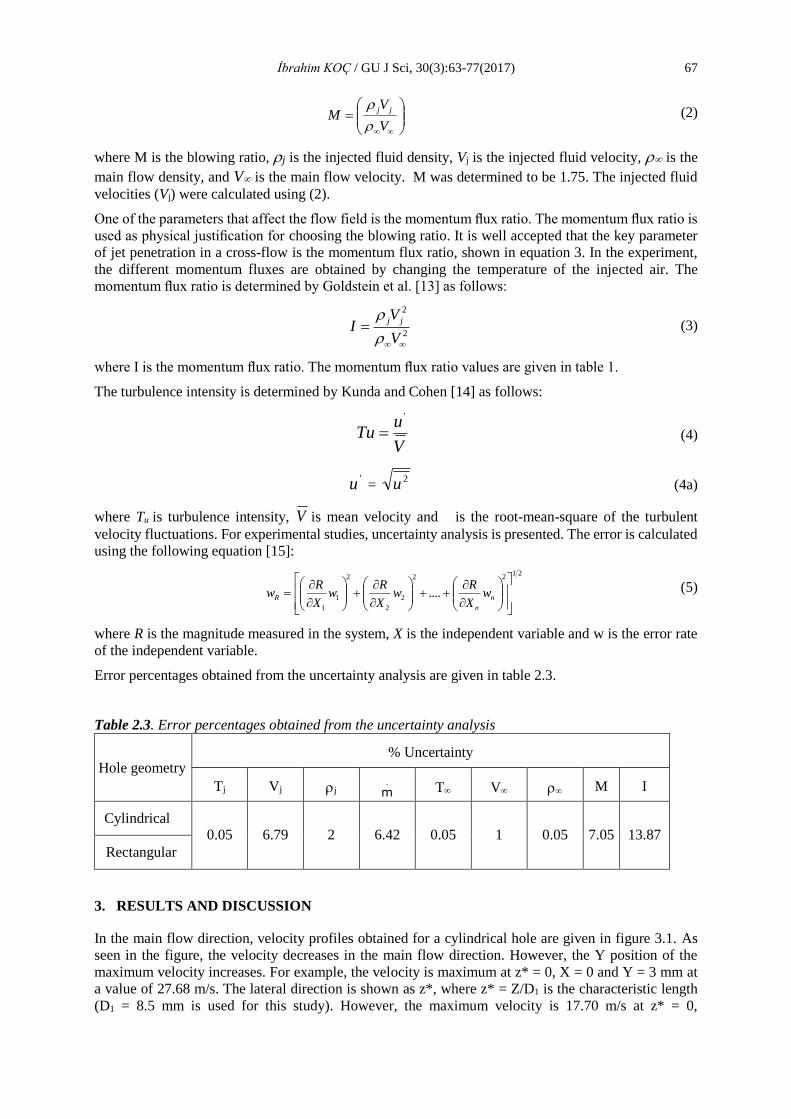
Three injection holes are located on a plexiglas plate. The holes are 9 x 6.5 mm. All hole geometries in
the model are rectangular and with the same cross-section area. The injection angles are 30o to the
surface and the main flow. Measurements were made for a single row at the second hole. The schematic
view of the rectangular holes is presented in figure 2.4.
Figure 2.4. Schematic view of the rectangular holes
The measurement points of probe for the measurements of velocity and turbulence are given in Table
2.2.
Table 2.2. Values for velocity and turbulence measurements
X/D1 X/D2 Z/D1 Z/D2 Y(mm)
(mm) -1 1.5 0 -1 3
1 0 7 2 0.5 12
3 17
4 22
In this table, D2 is hydraulic diameter of the rectangular film holes. It is calculated using equation 1,
P
AD
42 (1)
where A is the cross-section area of the rectangular hole, and P is the wet perimeter. D2 value is
determined to be 7.55 mm for the rectangular hole.
The mainstream air velocity and the injected air velocity ratio are determined using the blowing ratio,
İbrahim KOÇ / GU J Sci, 30(3):63-77(2017) 67
V
VM
jj
(2)
where M is the blowing ratio, j is the injected fluid density, Vj is the injected fluid velocity, is the
main flow density, and V is the main flow velocity. M was determined to be 1.75. The injected fluid
velocities (Vj) were calculated using (2).
One of the parameters that affect the flow field is the momentum flux ratio. The momentum flux ratio is
used as physical justification for choosing the blowing ratio. It is well accepted that the key parameter
of jet penetration in a cross-flow is the momentum flux ratio, shown in equation 3. In the experiment,
the different momentum fluxes are obtained by changing the temperature of the injected air. The
momentum flux ratio is determined by Goldstein et al. [13] as follows:
2
2
V
VI
jj
(3)
where I is the momentum flux ratio. The momentum flux ratio values are given in table 1.
The turbulence intensity is determined by Kunda and Cohen [14] as follows:
'uTu
V (4)
'u = 2u (4a)
where Tu is turbulence intensity, V is mean velocity and is the root-mean-square of the turbulent
velocity fluctuations. For experimental studies, uncertainty analysis is presented. The error is calculated
using the following equation [15]:
21
22
2
2
2
1
1
....
n
n
R wX
Rw
X
Rw
X
Rw (5)
where R is the magnitude measured in the system, X is the independent variable and w is the error rate
of the independent variable.
Error percentages obtained from the uncertainty analysis are given in table 2.3.
Table 2.3. Error percentages obtained from the uncertainty analysis
Hole geometry % Uncertainty
Tj Vj j T V M I
Cylindrical 0.05 6.79 2 6.42 0.05 1 0.05 7.05 13.87
Rectangular
3. RESULTS AND DISCUSSION
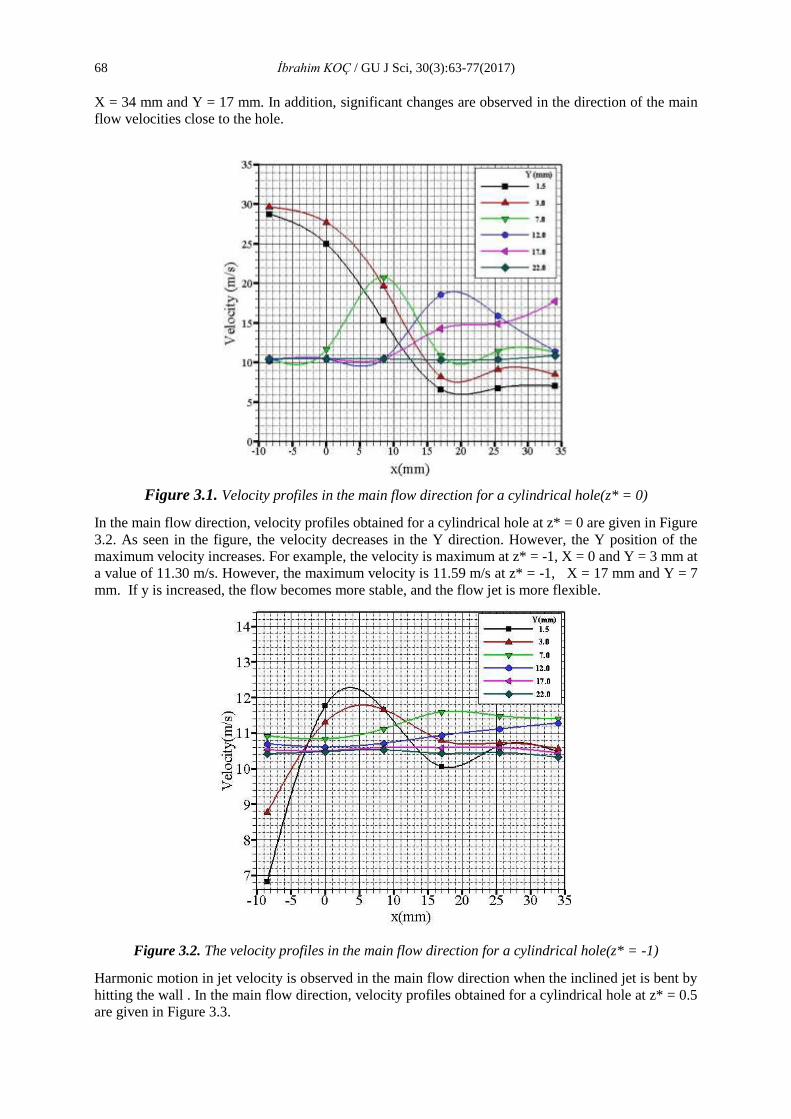
In the main flow direction, velocity profiles obtained for a cylindrical hole are given in figure 3.1. As
seen in the figure, the velocity decreases in the main flow direction. However, the Y position of the
maximum velocity increases. For example, the velocity is maximum at z* = 0, X = 0 and Y = 3 mm at
a value of 27.68 m/s. The lateral direction is shown as z*, where z* = Z/D1 is the characteristic length
(D1 = 8.5 mm is used for this study). However, the maximum velocity is 17.70 m/s at z* = 0,
.
m
68 İbrahim KOÇ / GU J Sci, 30(3):63-77(2017)
X = 34 mm and Y = 17 mm. In addition, significant changes are observed in the direction of the main
flow velocities close to the hole.
Figure 3.1. Velocity profiles in the main flow direction for a cylindrical hole(z* = 0)
In the main flow direction, velocity profiles obtained for a cylindrical hole at z* = 0 are given in Figure
3.2. As seen in the figure, the velocity decreases in the Y direction. However, the Y position of the
maximum velocity increases. For example, the velocity is maximum at z* = -1, X = 0 and Y = 3 mm at
a value of 11.30 m/s. However, the maximum velocity is 11.59 m/s at z* = -1, X = 17 mm and Y = 7
mm. If y is increased, the flow becomes more stable, and the flow jet is more flexible.
Figure 3.2. The velocity profiles in the main flow direction for a cylindrical hole(z* = -1)
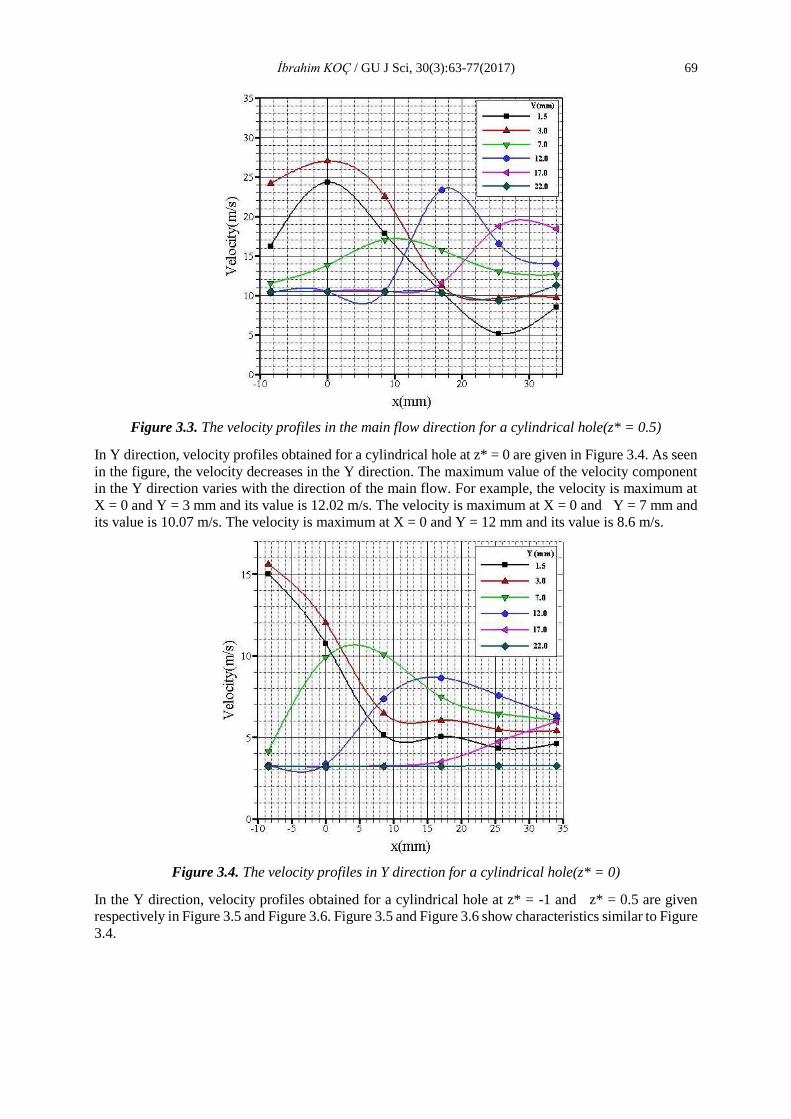
Harmonic motion in jet velocity is observed in the main flow direction when the inclined jet is bent by
hitting the wall . In the main flow direction, velocity profiles obtained for a cylindrical hole at z* = 0.5
are given in Figure 3.3.
İbrahim KOÇ / GU J Sci, 30(3):63-77(2017) 69
Figure 3.3. The velocity profiles in the main flow direction for a cylindrical hole(z* = 0.5)
In Y direction, velocity profiles obtained for a cylindrical hole at z* = 0 are given in Figure 3.4. As seen
in the figure, the velocity decreases in the Y direction. The maximum value of the velocity component
in the Y direction varies with the direction of the main flow. For example, the velocity is maximum at
X = 0 and Y = 3 mm and its value is 12.02 m/s. The velocity is maximum at X = 0 and Y = 7 mm and
its value is 10.07 m/s. The velocity is maximum at X = 0 and Y = 12 mm and its value is 8.6 m/s.
Figure 3.4. The velocity profiles in Y direction for a cylindrical hole(z* = 0)
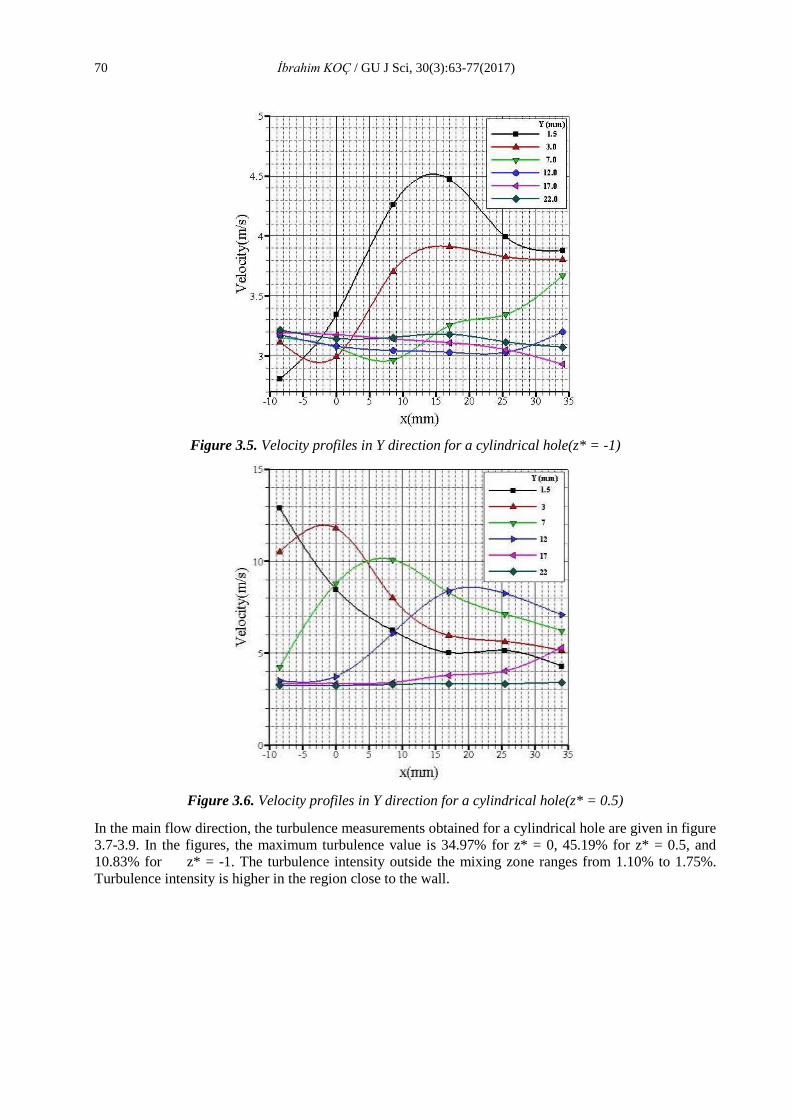
In the Y direction, velocity profiles obtained for a cylindrical hole at z* = -1 and z* = 0.5 are given
respectively in Figure 3.5 and Figure 3.6. Figure 3.5 and Figure 3.6 show characteristics similar to Figure
3.4.
70 İbrahim KOÇ / GU J Sci, 30(3):63-77(2017)
Figure 3.5. Velocity profiles in Y direction for a cylindrical hole(z* = -1)
Figure 3.6. Velocity profiles in Y direction for a cylindrical hole(z* = 0.5)
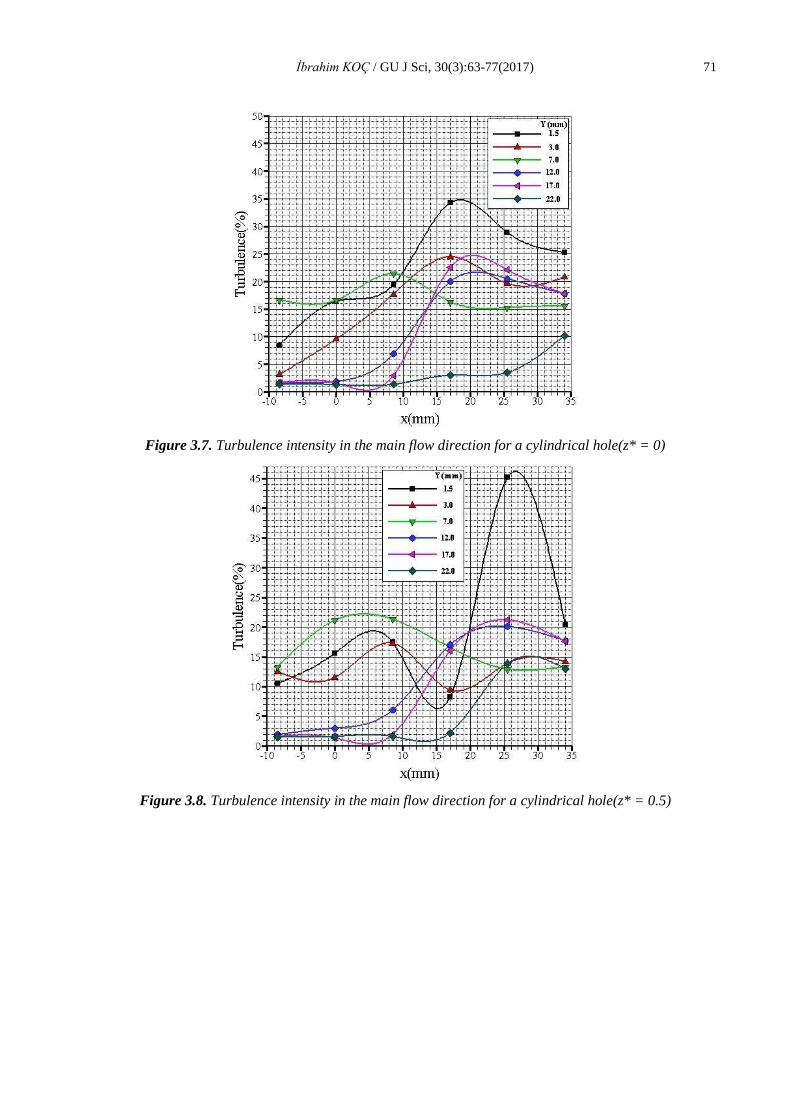
In the main flow direction, the turbulence measurements obtained for a cylindrical hole are given in figure
3.7-3.9. In the figures, the maximum turbulence value is 34.97% for z* = 0, 45.19% for z* = 0.5, and
10.83% for z* = -1. The turbulence intensity outside the mixing zone ranges from 1.10% to 1.75%.
Turbulence intensity is higher in the region close to the wall.
İbrahim KOÇ / GU J Sci, 30(3):63-77(2017) 71
Figure 3.7. Turbulence intensity in the main flow direction for a cylindrical hole(z* = 0)
Figure 3.8. Turbulence intensity in the main flow direction for a cylindrical hole(z* = 0.5)
72 İbrahim KOÇ / GU J Sci, 30(3):63-77(2017)
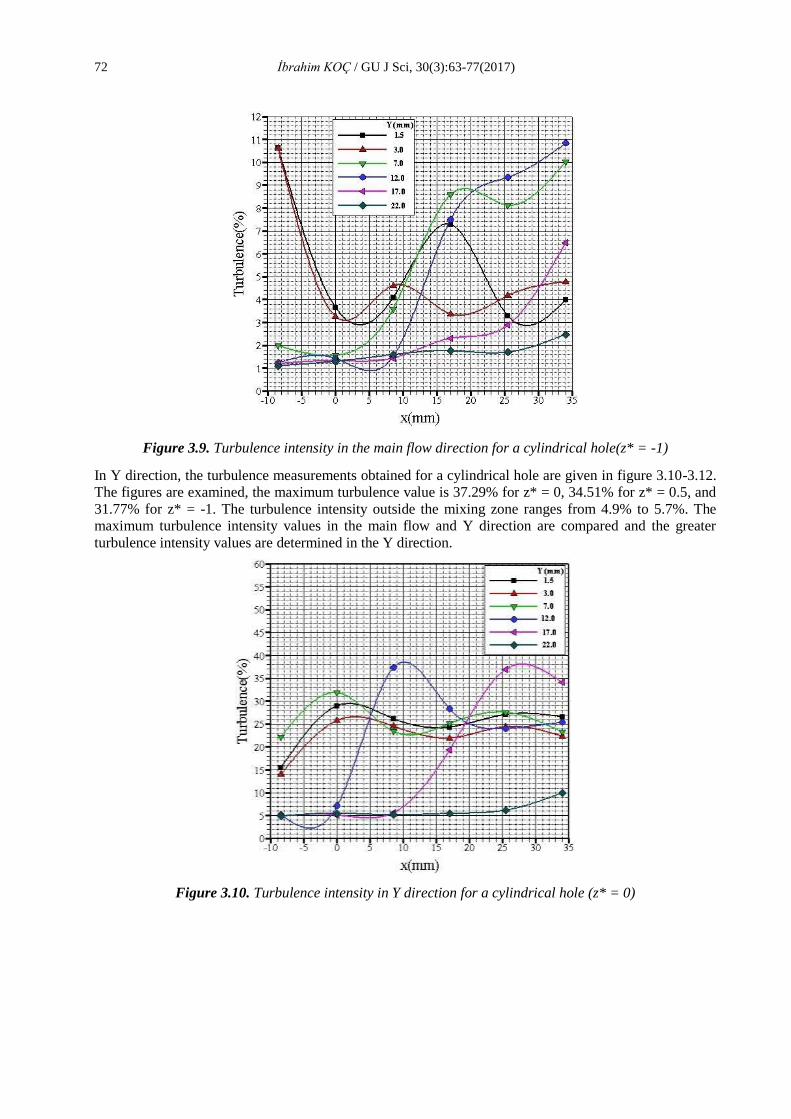
Figure 3.9. Turbulence intensity in the main flow direction for a cylindrical hole(z* = -1)
In Y direction, the turbulence measurements obtained for a cylindrical hole are given in figure 3.10-3.12.
The figures are examined, the maximum turbulence value is 37.29% for z* = 0, 34.51% for z* = 0.5, and
31.77% for z* = -1. The turbulence intensity outside the mixing zone ranges from 4.9% to 5.7%. The
maximum turbulence intensity values in the main flow and Y direction are compared and the greater
turbulence intensity values are determined in the Y direction.
Figure 3.10. Turbulence intensity in Y direction for a cylindrical hole (z* = 0)
İbrahim KOÇ / GU J Sci, 30(3):63-77(2017) 73
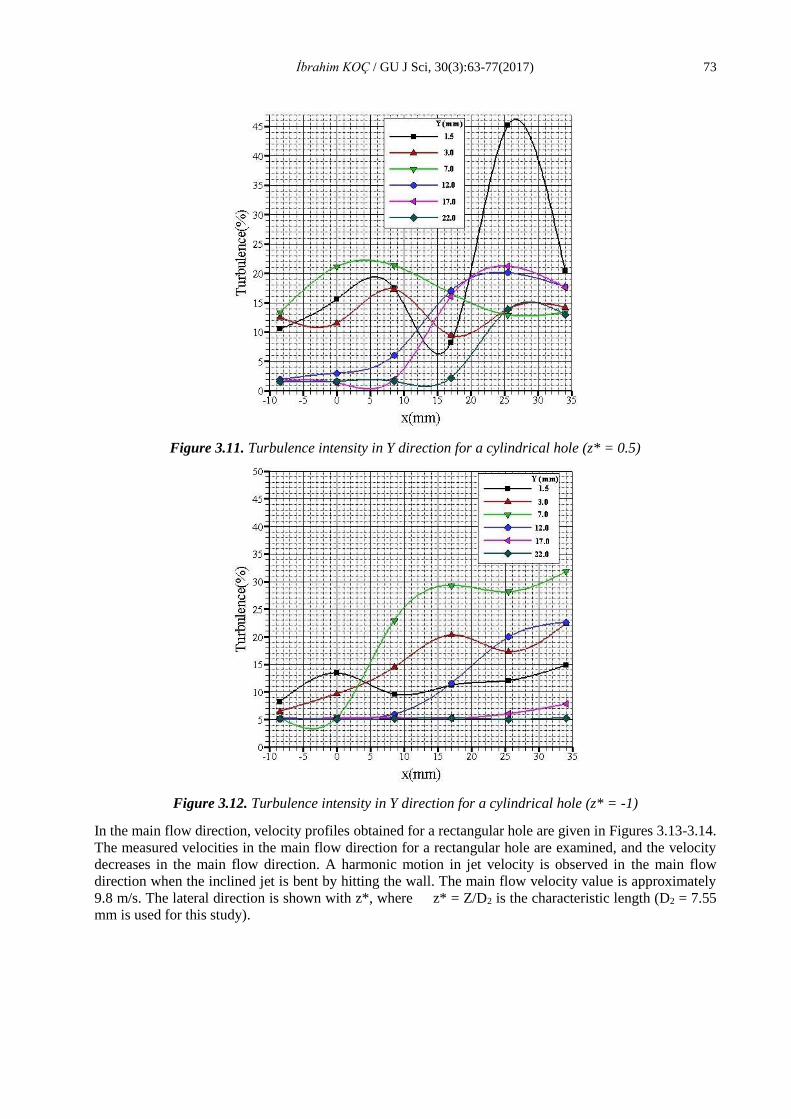
Figure 3.11. Turbulence intensity in Y direction for a cylindrical hole (z* = 0.5)
Figure 3.12. Turbulence intensity in Y direction for a cylindrical hole (z* = -1)
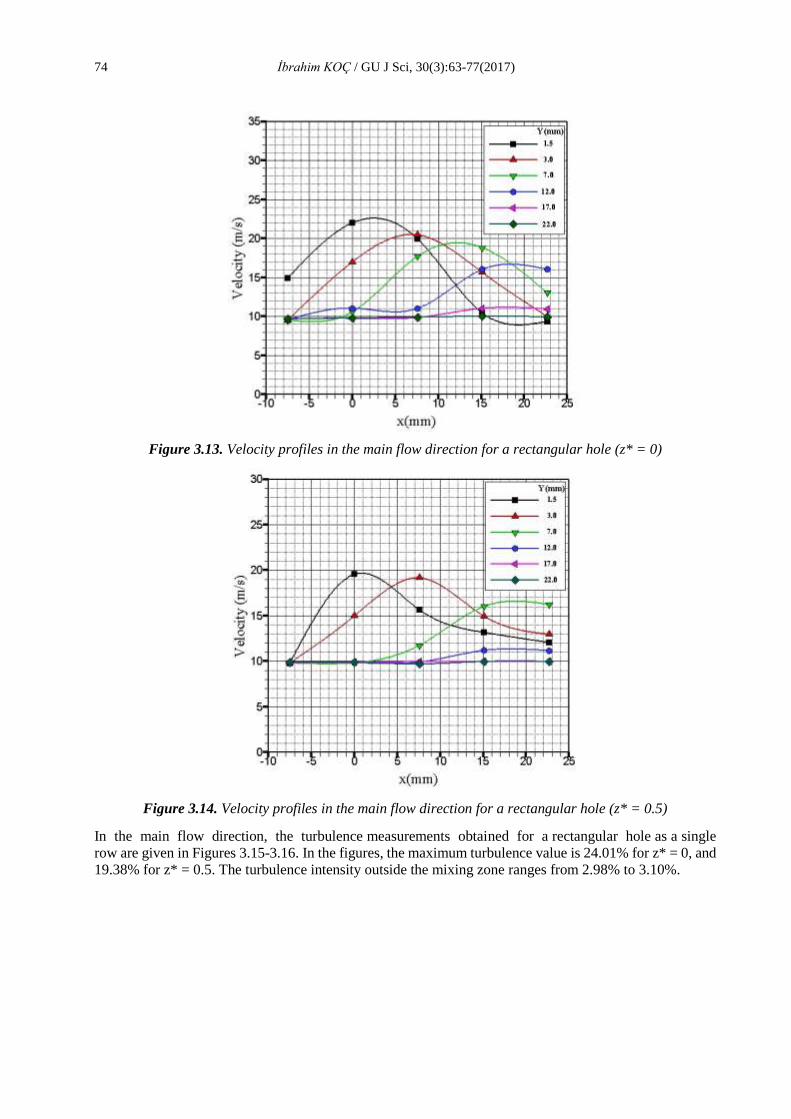
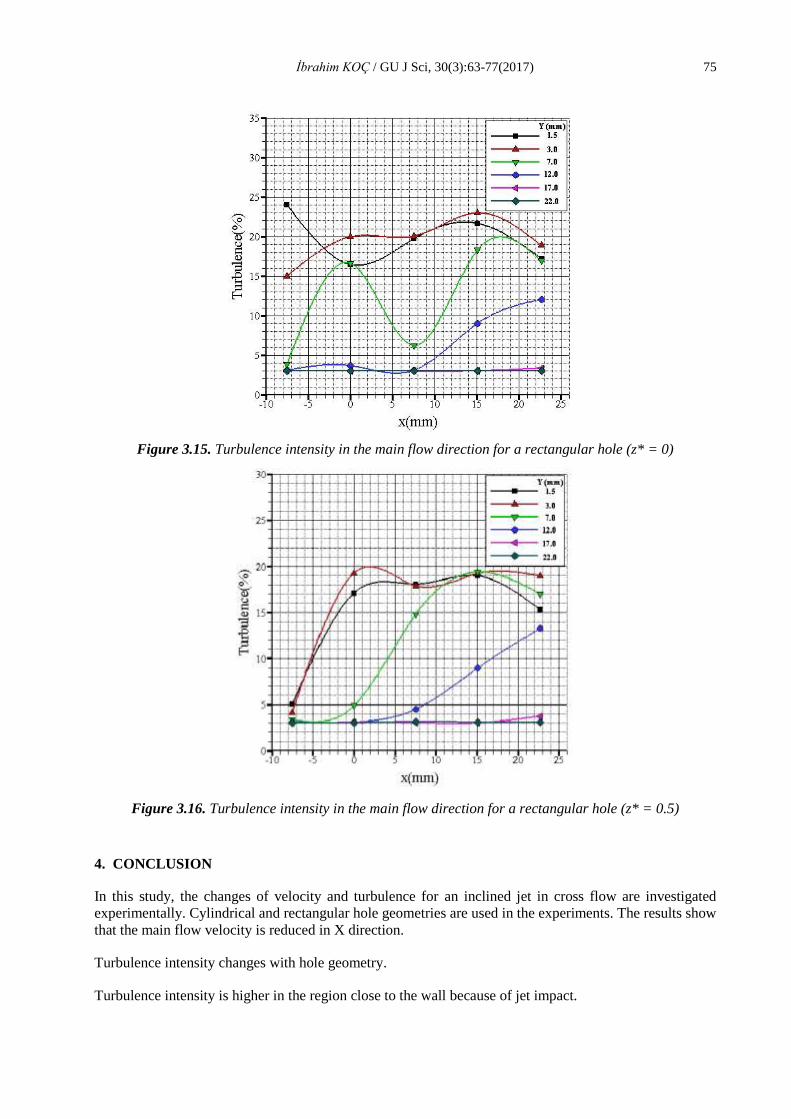
In the main flow direction, velocity profiles obtained for a rectangular hole are given in Figures 3.13-3.14.
The measured velocities in the main flow direction for a rectangular hole are examined, and the velocity
decreases in the main flow direction. A harmonic motion in jet velocity is observed in the main flow
direction when the inclined jet is bent by hitting the wall. The main flow velocity value is approximately
9.8 m/s. The lateral direction is shown with z*, where z* = Z/D2 is the characteristic length (D2 = 7.55
mm is used for this study).
74 İbrahim KOÇ / GU J Sci, 30(3):63-77(2017)
Figure 3.13. Velocity profiles in the main flow direction for a rectangular hole (z* = 0)
Figure 3.14. Velocity profiles in the main flow direction for a rectangular hole (z* = 0.5)
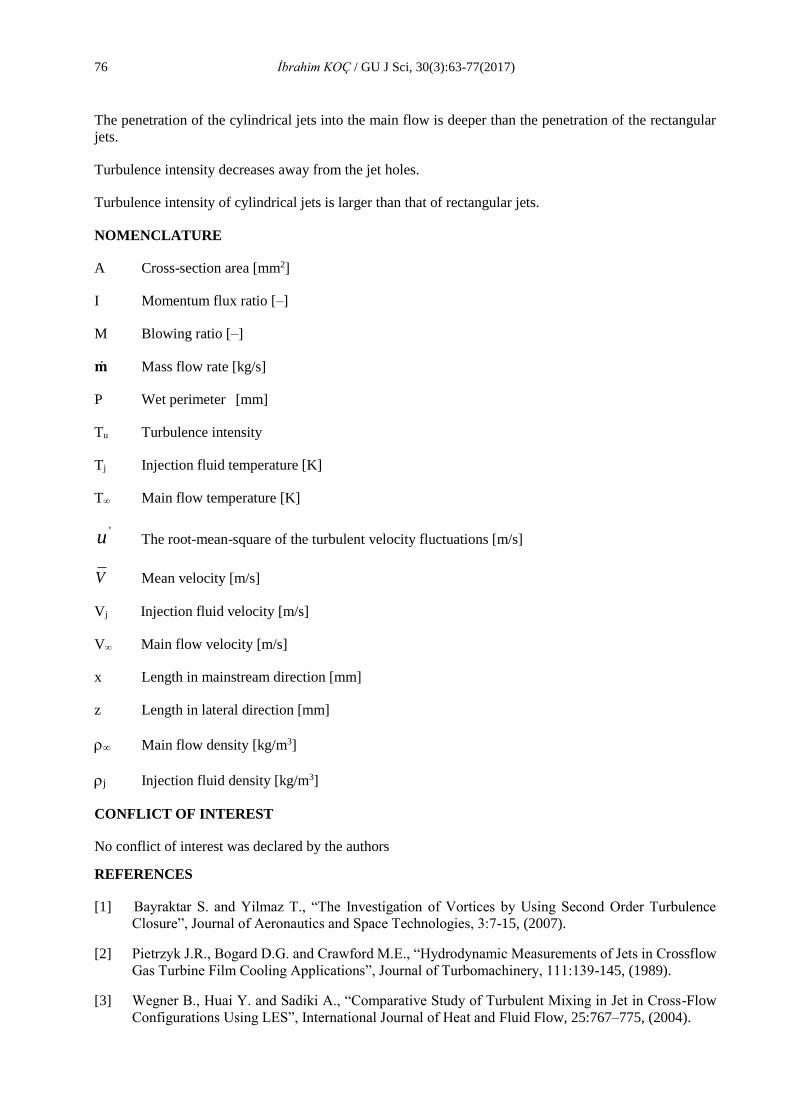
In the main flow direction, the turbulence measurements obtained for a rectangular hole as a single
row are given in Figures 3.15-3.16. In the figures, the maximum turbulence value is 24.01% for z* = 0, and
19.38% for z* = 0.5. The turbulence intensity outside the mixing zone ranges from 2.98% to 3.10%.
İbrahim KOÇ / GU J Sci, 30(3):63-77(2017) 75
Figure 3.15. Turbulence intensity in the main flow direction for a rectangular hole (z* = 0)
Figure 3.16. Turbulence intensity in the main flow direction for a rectangular hole (z* = 0.5)
4. CONCLUSION
In this study, the changes of velocity and turbulence for an inclined jet in cross flow are investigated
experimentally. Cylindrical and rectangular hole geometries are used in the experiments. The results show
that the main flow velocity is reduced in X direction.
Turbulence intensity changes with hole geometry.
Turbulence intensity is higher in the region close to the wall because of jet impact.
76 İbrahim KOÇ / GU J Sci, 30(3):63-77(2017)
The penetration of the cylindrical jets into the main flow is deeper than the penetration of the rectangular
jets.
Turbulence intensity decreases away from the jet holes.
Turbulence intensity of cylindrical jets is larger than that of rectangular jets.
NOMENCLATURE
A Cross-section area [mm2]
I Momentum flux ratio [–]
M Blowing ratio [–]
�̇� Mass flow rate [kg/s]
P Wet perimeter [mm]
Tu Turbulence intensity
Tj Injection fluid temperature [K]
T∞ Main flow temperature [K]
'u The root-mean-square of the turbulent velocity fluctuations [m/s]
V Mean velocity [m/s]
Vj Injection fluid velocity [m/s]
V∞ Main flow velocity [m/s]
x Length in mainstream direction [mm]
z Length in lateral direction [mm]
∞ Main flow density [kg/m3]
j Injection fluid density [kg/m3]
CONFLICT OF INTEREST
No conflict of interest was declared by the authors
REFERENCES
[1] Bayraktar S. and Yilmaz T., “The Investigation of Vortices by Using Second Order Turbulence
Closure”, Journal of Aeronautics and Space Technologies, 3:7-15, (2007).
[2] Pietrzyk J.R., Bogard D.G. and Crawford M.E., “Hydrodynamic Measurements of Jets in Crossflow
Gas Turbine Film Cooling Applications”, Journal of Turbomachinery, 111:139-145, (1989).
[3] Wegner B., Huai Y. and Sadiki A., “Comparative Study of Turbulent Mixing in Jet in Cross-Flow
Configurations Using LES”, International Journal of Heat and Fluid Flow, 25:767–775, (2004).

İbrahim KOÇ / GU J Sci, 30(3):63-77(2017) 77
[4] Hong R., Li H., Ding J. and Li H., A Correlation Equation for Calculating Inclined Jet Penetration
Length in a Gas-Solid Fluidized Bed, China Part, 3(5):279-285, (2005).
[5] Yang Y-T. and Wang Y-X., “Three-Dimensional Numerical Simulation of an Inclined Jet with
Cross-Flow”, International Journal of Heat and Mass Transfer, 48, 4019–4027, (2005).
[6] Boushaki T., Mergheni M.A., Sautet J.C. and Labegorre B., “Effects of Inclined Jets on Turbulent
Oxy-Flame Characteristics in a Triple Jet Burner”, Experimental Thermal and Fluid Science, 32,
1363–1370, (2008).
[7] Walters D.K. and Leylek J.H., “A Detailed Analysis of Film Cooling Physics: Part I – Streamwise
Injection with Cylindrical holes”, Journal of Turbomachinery, 122, 102–112, (1997).
[8] Baldauf S., Schulz A. and Wittig S., “High-Resolution Measurements of Local Effectiveness From
Discrete Hole Film Cooling”, Journal of Turbomachinery, 123, 758–765, (2001).
[9] Guo X., Schröder W. and Meinke M., “Large-Eddy Simulations of Film Cooling Flows”, Computer
& Fluids, 35, 587–606, (2006).
[10] Koc I., “Experimental and Numerical Investigation of Film Cooling Effectiveness for Rectangular
Injection Holes”, Aircraft Engineering and Aerospace Technology”, 79, No.6, 621-627, (2007).
[11] Jessen W., Schro¨der W., Klas M., “Evolution of Jets Effusing from Inclined Holes into Crossflow”,
International Journal of Heat and Fluid Flow, 28, 1312–1326, (2007).
[12] Krishnan G. and Mohseni K., “An Experimental Study of a Radial Wall Jet Formed by the Normal
Impingement of a Round Synthetic Jet”, European Journal of Mechanics - B/Fluids, 29, 269-277,
(2010).
[13] Goldstein R.J., Eckert E.G.R. and Burggraf F., “Effects of Hole Geometry and Density on Three-
Dimensional Film Cooling”, International Journal of Heat and Mass Transfer, 17, 595-607, (1974).
[14] Kunda P.K. and Cohen I.M., Fluid Mechanics, Academic Press, SanDiego, California, United States
of America, (2002).
[15] Genceli, O. F., 2000. Ölçme Tekniği, Birsen Yayınevi, Cağaloğlu, İstanbul, (2000).