Embed Size (px)
Citation preview
Journal of Social andEconomic Development
Vol. 5 No. 1 January - June 2003
Forty Years of Change in Rural South India
A Critical Reflection on Development of Scheduled Castes
Investment in Power Sector: Past Trend and Short-Term Prospect
Rural Household Characteristics and Health Expenditure in India:An Analysis
Negative Impacts of Emerging Informal Groundwater Markets in PeninsularIndia: Reduced Local Food Security and Unemployment
Environment and Natural Resources in Orissa
P. R. Brahmananda: His Work, and Beyond
Book Reviews
INSTITUTE FOR SOCIAL AND ECONOMIC CHANGEBANGALORE

JOURNAL OF SOCIAL AND ECONOMIC DEVELOPMENT(Published biannually in January and July)
Institute for Social and Economic ChangeBangalore–560 072, India
Editor: Gopal K. Kadekodi
Managing Editor:G. K. Karanth
Associate Editor: Anil Mascarenhas
Editorial Advisory Board
Isher Judge Ahluwalia (Delhi) J. B. Opschoor (The Hague)Abdul Aziz (Bangalore) Narendar Pani (Bangalore)Simon R. Charsley (Glasgow) B. Surendra Rao (Mangalore)Dipankar Gupta (Delhi) V. M. Rao (Bangalore)G. Haragopal (Hyderabad) U. Sankar (Chennai)Yujiro Hayami (Tokyo) A. S. Seetharamu (Bangalore)James Manor (Brighton) Gita Sen (Bangalore)Joan Mencher (New York) K. K. Subrahmanian (Thiruvananthapuram)M. R. Narayana (Bangalore) A. Vaidyanathan (Thiruvananthapuram)
DTP: B. Akila
Aims and Scope
The Journal provides a forum for in-depth analysis of problems of social, economic,political, institutional, cultural and environmental transformation taking place in theworld today, particularly in developing countries. It welcomes articles with rigorousreasoning, supported by proper documentation. Articles, including field-based ones,are expected to have a theoretical and/or historical perspective. The Journal wouldparticularly encourage inter-disciplinary articles that are accessible to a wider groupof social scientists and policy makers, in addition to articles specific to particularsocial sciences. The Journal also gives scope to Research Notes, Comments, BookReviews and Review Articles.
All correspondence to be addressed to:
EditorJournal of Social and Economic DevelopmentInstitute for Social and Economic ChangeProf. V. K. R. V. Rao AvenueNagarabhavi P.O.Bangalore 560 072, India
CopyrightCopyright rests with the authors of the respective papers, who alone are responsiblefor the views expressed.

Journal ofSocial and Economic
Development Vol. VI January – June 2004 No.1
Articles
Impact of Trade Liberalisation on Employment in Indian 1Manufacturing: Evidence from the Organised Sector
Shashanka Bhide and Kaliappa Kalirajan
Land Reforms and Liberalisation in India: Rhetoric and Realities 20N. Rajasekaran
Tradition in Transition: Globalisation, Priests and Ritual Innovation 57in Neighbourhood Temples in Bangalore
Tulasi Srinivas
Cointegration Analysis - Causality Testing and Wagner's Law:The Case of Nigeria, 1970–2001 76
Philip Olomola
Organisational Structure, Membership Pattern and Status of HillResource Management Societies in Haryana Shiwalikas 91
Swarn Lata Arya and R. K. Aggarwal
School Participation and Child Labour: A Recent Survey of Rural 113Households in North Bengal
Sudip Chakraborty
Book Reviews
S. Mahendra Dev, K. P. Kannan and Nira Ramachandran (eds.). 131Towards a Food Secure India: Issues and Policies— N. Rajasekaran
Satu Kahkonen and Mancur Olson (eds.). A New InstitutionalApproach to Economic Development — L. Venkatachalam 134
S. L. Rao. Governing Power: A New Institution of Governance, the 137Experience with Independent Regulation of Electricity— D. Narasimha Rao

Mira Seth. Women and Development: The Indian Experience— Deepthi S 140
Nira Wickramasinghe. Civil Society in Sri Lanka: New Circlesof Power — D. Rajasekhar 142
Books Received 145
ISSN 0972 – 5792
Website: www.isec.ac.in/journal
Forty Years of Change in Rural South India
T. Scarlett Epstein*
Abstract
Meant to be a tribute to M. N. Srinivas, this paper presents a longitudinalstudy of over forty years of the different paths of development ofsocio-economic changes that were triggered off by the Krishnarajasagarirrigation scheme in two South Indian villages that are situated near eachother and are also similar in terms of social composition: Wangala, avillage where access to canal water facilitated the growing of sugarcaneand paddy as cash crops, and Dalena, where lands remained dry becausethey lie above the canal levels. In Wangala irrigation has reinforcedtraditional patron-client relationships and thus resulted in continuingvillage introversion. To benefit from the regional economic growth resultingfrom irrigation Dalena villagers had to diversify their activities and seekcontacts with the wider economy. This village extroversion led to abreakdown in the social fabric.
How the Late Professor M. N. Srinivas Influenced My Life
I owe a great debt to the late Professor M. N. Srinivas: he exerted theforemost influence over my career — if I have achieved anything at all, the creditmust go to him.
I first met the late Professor M. N. Srinivas in 1953 when he was a VisitingProfessor at Manchester University, and I was a graduate student preparing for myanthropological-style Ph. D. research. Having read and admired his publications, Iwas then overawed by his importance. Thus I was pleasantly surprised when Ifound him to be not only an expert teacher, modest of his scholarly achievementsand with a great sense of humour, but also an extremely gentle and patient supervisor.With his advice and under his guidance I prepared my Ph. D. proposal to study thesocio-economic impact of the large South Indian dam irrigation scheme on localvillages. He met me on arrival at Bombay seaport and accompanied me on the longtrain journey to Mysore, thereby helping me to adapt to life in India. He found me ateacher of the vernacular and helped me in the selection of my first fieldwork site.His concepts of ‘Sanscritization’ and the ‘Dominant Caste’ proved a great help tome in trying to understand the process of change on which my village studiesfocused. It was he who sparked off in me my love for South Indian village societies.
*Practical Education and Gender Support (PEGS), 5, Viceroy Lodge, Kingsway, HOVE BN34RA, England. E-mail: [email protected]
In later years I was proud to notice that he came to regard me as a colleagueand family friend, though to me he remained my guru. The last time I met him was afew weeks before his death when at a seminar organised by the KarnatakaDepartment for Rural Development to launch my documentary film Village Voices –Forty Years of Rural Transformation in South India he was asked to say a fewwords. As always on such occasions he impressed the audience with his scholarlyargument presented in a modest and unassuming fashion. This symbolized the kindof extraordinary man he was.
Professor Srinivas’s devoted supervision and guidance throughout myfieldwork helped me to bridge the gap between economic and anthropologicalstudies. This is reflected in the analysis of different social change processes in thetwo South Indian villages I studied....
1954–621
I began my research in 1954 in Wangala2, which is situated in MandyaTaluk in Karnataka State. Before canals reached the Taluk in 1934, villages in thearea had largely subsistence economies. Uncertainty of rainfall and poor quality ofsoil restricted local riots to subsistence cultivation of dryland crops; small-scalesericulture and sheep breeding provided the only village sources of cash income.Thus it was reasonable for me to assume that in pre-irrigation days, the economy ofDalena, a dryland village even after canal irrigation, was almost identical with thatof Wangala, a wetland village.
Wangala and its Unilineal ChangesThe advent of irrigation upset the balance of these almost stagnant
economies. To Wangala irrigation brought one dominant new opportunity: thegrowing of cash crops such as sugarcane and paddy. To Dalena farmers irrigationpresented no such single outstanding opportunity. My studies clearly indicatedthat canal irrigation had made Wangala altogether much more prosperous. Farmerswere able to grow the more valuable crops of paddy and sugarcane. These cropsrequired more labour than their traditional dryland millet crops, which meant moreemployment for local landless labour and also attracted migrant labourers to settlein Wangala during the agricultural peak seasons. Irrigation had thus raisedWangala’s income at a stroke onto a higher level, though the degree of improvementin levels of living differed considerably between landowning farmers and landlesslabourers.
Tradition and Modernity: The changes within Wangala resulting from irrigationstrengthened the ties between Peasant caste farmers on the one hand and theirlandless Functionary Caste and Scheduled Caste (SC) clients on the other. Itthereby reinforced the traditional intra-village social system. At the same time,
2 Journal of Social and Economic Development Jan. - June 2003

external forces were trying to break these hereditary dependencies. India’sindependence in 1947 had set in motion a process of radical socio-political changesaiming at transforming India’s hierarchical caste societies, which emphasized statusascription into egalitarian democratic social systems with universal adult franchise.For instance, legislation introduced democratically elected village panchayats(councils) with reserved seats for SCs. It thereby attacked the traditional hereditarysystem that access to irrigation in Wangala had in fact reinforced. The first democraticpanchayat elections, which I was fortunate enough to observe in 1955, turned outto be no more than a farce to the greatest distress of the Revenue Inspector, whowas also the Electioneering Official. For at least two years after the election thestatutory elected panchayat never met as a body nor was a secretary appointed.None of the SCs ever attended the village panchayat meetings, except as silentobservers sitting well apart from the caste men. The traditional Peasant castepanchayat, composed of the elders of the ‘major’ lineages, continued to functionand the statutory panchayat was no more than a de jure authority. The conduct ofthe election of Wangala’s panchayat was hardly that envisaged by the Act. Thedifficulty arose from the State attempting to introduce revolutionary changes in theinternal economic and/or political relations within villages. Such changes as hadtaken place in Wangala since irrigation were in consonance with the traditionalsystem and could therefore be absorbed in it.
All this made me analyze the impact of irrigation on Wangala’s socio-political system in terms of unilinear changes in the sense that the new opportunitieswere in line with the former mode of economic organization and therefore reinforcedthe traditional socio-political system to such an extent that it could withstandexternal interventions.
Dalena and its Multifarious Changes
Dalena displayed much more radical socio-political changes than had takenplace in Wangala, although it remained a dryland enclave in the midst of an irrigatedbelt. Dalena land was actually traversed by a canal yet remained completely dry.Across the canal Dalena farmers would see immediately before their eyes the benefitsresulting from irrigation and exactly what was involved in growing cash crops. Thisspurred some of them onto efforts leading to their own economic progress, andencouraged them to participate in the economic growth resulting from irrigation inthe region. Dalena villagers, like Wangala people, referred to the advent of irrigationas the turning point in their history. Alternative economic opportunities that occurredin the new wetland region made dryland farming comparatively less advantageousto Dalena farmers. They were eager to take part in the economic expansion theycould see happening in front of their eyes. Realizing that they could do so only byreaching out into the wider economy they looked for opportunities outside Dalena.
Vol. V, No.1 Epstein: Forty Years of Change in Rural South India 3

The village dry land continued to be cultivated, but mainly by female labour. Thisallowed men to take up other income-earning opportunities. Since they could notgrow cash crops in their own village, many purchased newly irrigated land inneighbouring villages, where they would then grow crops for sale. Dalena familieswere shrewd and tried to marry their daughters into neighbouring irrigated villagesto make sure they would be the first to hear whenever land came onto the marketthere. By this and other methods they managed to acquire considerable wet landacreage outside their own village. In 1956 as much as 73 per cent of Dalenahouseholds owned and cultivated wet lands in the vicinity. Their extra-villagenetwork of relations put them in a strategic position to venture also into workoutside farming. A fair number of Dalena ryots acted regularly as contractors forthe building of canals and the accompanying road system. Most of Dalena’spoorest farmers and landless have worked at one time or other as labourers forprivate contractors or for the Public Works Department directly. Their contact withthe Administration made Dalena people realise the importance of literacy in particularand education in general. Accordingly, a few sent their sons to secondary schoolin Mandya and two of these students subsequently secured jobs in the MandyaAdministration. They worked in 1955 in the town’s Agricultural Office andtransmitted the latest techniques of farming to Dalena ryots. The patel was thusencouraged to experiment with the Japanese method of paddy cultivation on wetland he cultivated in neighbouring villages. Surprisingly as it seemed, as a nativefrom a dryland village he won the prize for the best-irrigated paddy cultivation inthe region in 1954. Their many extra-village contacts enabled Dalena men to takeadvantage of the new economic opportunities resulting from irrigation in the region.In 1956 altogether twenty-six men (13 per cent of the male working population) wereemployed in Mandya, most of whom worked as labourers in the sugar factory;others were clerks, orderlies or drivers. Dalena men also helped to provide theservices needed by neighbouring irrigated villages. Some bought carts and strongbullocks and transported cane from nearby villages to Mandya’s refinery at a dailyhiring charge. Others again became cattle traders and/or middlemen in bullocksales.
Diversification of economic activities: By providing these services they enabledfarmers of recently irrigated lands to concentrate on cultivating their lands. Indoing so Dalena men first of all helped to extend the benefits of irrigation even tovillages situated at the margin of the canal system; second and most important,they spontaneously promoted the development of a regionally integrated economy.They introduced specialization and division of labour between irrigated and drylandvillages and thereby promoted the development in Mandya Taluk of a regionallyintegrated economy. This desirable by-product of large irrigation schemes appearsto have eluded the planners of the overall canal irrigation scheme and still seems to
4 Journal of Social and Economic Development Jan. - June 2003
be ignored by planners of large irrigation schemes.The broadening of Dalena’s economic horizon also broadened villagers’
political horizons. Unlike Wangala, where nobody read papers and only a few wereaware of the wider political issues, Dalena commuters were members of TradeUnions. As factory workers they not only participated in strikes but also becamefamiliar with elected authority and majority decisions, political arrangements, whichdiffered radically from their customary hereditary succession in particular andascribed status in general. The hereditary principle of social organisation appearedto be compatible only with a closely integrated society, in which economic, politicaland ritual relations were concentrated within the boundaries of the village. Oncethe range of these relations was extended beyond the limits of the particular society,the dependence on fellow-villagers diminished and the personal character in theindigenous relationships gave way to an impersonal one.
Dalena’s diversification of economic activities represented multifariouschanges. I argued that these multifarious economic changes that had taken place inDalena since irrigation reached the area triggered off a more radical socio-politicaltransformation. Already in 1955 they had so many different economic links with theregional economy that their political attitudes and social relations had changedaccordingly.
Restudy in 19703
New Economic Opportunities in Mandya DistrictThe years between 1955 and 1970 saw a considerable economic expansion
of Mandya District’s integrated regional economy the formation of which I hadnoted in my earlier studies. The authorities realised the area’s overall economicpotential, and consequently in 1962 it was included in the All-India IntensiveAgricultural Development Programme (I.A.D.P.). The programme aimed at, amongother things, maximisation of crop production by providing facilities such as suppliesof improved seeds, fertilisers, agricultural credit and technical know-how andmarketing to all the participating farmers. The State Authorities devoted considerableamounts of money and effort to the promotion of agricultural development in MandyaDistrict. During the year 1970–1, public expenditure on agricultural developmentper head in Mandya District was more than three times that in the neighbouringMysore District: in the former it was Rs.1.60 while in the latter only Rs.0.50, althoughthe amount spent in Mandya District on rural development was still considerablyless than what the State spent on industrialisation.
How and Why Wangala and Dalena Changed Between 1955 and 1970Both villages changed considerably in appearance. The most striking
feature was the increased economic differentiation. It was not even necessary to
Vol. V, No.1 Epstein: Forty Years of Change in Rural South India 5

collect statistical evidence for the claim of polarisation that had gone on between1955 and 1970; it was so obvious. The lifestyle of the wealthier had considerablyimproved in every aspect: they had better housing, wore better clothing and lookedbetter nourished. By contrast, among landless labourers and marginal farmers,housing had deteriorated; their clothing looked more tattered and their bodiesseemed more emaciated. The households with larger wet land acreages werestrategically placed to improve their economic position; the more acres of wet landa family owned the greater was its overall income. During the fifteen years that hadelapsed since my first field studies in Wangala and Dalena a decline in real wageshad led to a deterioration in the levels of living among all those households thatdepended on employment for most of their income. On the other hand, the wealthierparts of the villages had access to more and better facilities. Dalena had alreadybeen connected in 1955 with the State power supply; Wangala installed electricityin 1963 mainly to operate power cane crushers but then also benefited from streetlighting. A few of the village magnates had built for themselves nice modern two-storey houses by the main road passing through Wangala; they formed a roadsideelite. The Scheduled Caste settlement, consisting mainly of landless labourers,presented a stark contrast to the increased wealth among Peasant farm households.Their poverty was glaring.
Wangala’s Village IntroversionIn 1955 I analysed the change that had taken place in Wangala as a result
of the advent of canal irrigation in terms of a unilineal process. Fifteen years laterI was struck by the continuing effect of this process expressed in terms of resistanceto outside interference in intra-village affairs. I then decided to refer to this socialphenomenon as village introversion.
Dalena’s Village ExtroversionIn contrast to Wangala, Dalena’s multifarious style of economic
development had continued in a big way. The socio-political system had changedmore radically since I lived there first. Increasingly Dalena villagers looked to thewider economy to improve their standard of living. Realizing this I decided to referto this process as village extroversion.
Restudy in 19964
WangalaSince 1955 when almost all houses in Wangala were on the east of the main
road passing through the village, housing now extends to a considerable distanceon both sides of the road. The whole area is built up. The space that years agoclearly separated the Caste from the Scheduled Caste settlement is no longer soobvious. A few years ago they established near Wangala’s border and at a distance
6 Journal of Social and Economic Development Jan. - June 2003
from the main village residential area a new colony with small RCC structures forlandless households. In this colony there are about 50 households, the majority ofwhich are Scheduled Castes. But there are also a few Peasant and FunctionaryCaste families residing there. The number of houses in Wangala has greatly increasedand their appearance has changed considerably. Many now are urban-style well-furnished two-storeyed structures with modern facilities, private water taps andsome even with latrines; some also have telephones and/or television sets. Moreover,there are public water taps so that all households have easy access to water. Thehousing of the poorest too has improved greatly; there are now many fewerconventional small thatched huts; these have been replaced by RCC structures.Street lights and drainage are also important innovations. Most houses have accessto drainage. This has done away with the 1955 stench of the streets and makes thevillage healthier and cleaner looking. The hustle and bustle around Wangala’s mainroad — where most Peasants still reside — gives the impression of a small butthriving urban settlement. Indeed I heard people refer to their village as ‘LittleMandya,’ a small replica of Mandya town. The headquarters for the Village Councilare housed in a substantial structure consisting of a large meeting hall and threerooms with a telephone. The Village Council covers five villages: Wangala and fourneighbouring villages. This means that many Government officials as well asresidents from other villages frequently call at the council offices. Throughout theday buses, cars, scooters and bicycles stop off in Wangala on their way to otherdestinations. Such busy traffic was unknown in 1955. Many village buildings carryboards with big lettering indicating the nature of their business. As was to beexpected, the branch of the Corporate Bank occupies the most solid and impressivebuilding. This bank also caters for neighbouring villages and therefore attractsmany visitors. In the morning when school begins and in the afternoon when itends, crowds of boys and girls neatly dressed in uniforms stream through thevillage streets; many go to the shops and treat themselves to snacks. Small specialistshops and restaurants cater for a variety of consumer requirements. They allappear well frequented throughout the day.
DalenaTo approach Dalena one has to go south of Mandya along the major
highway connecting Bangalore with Mysore. Forty years ago four miles of opencountryside separated the town from Dalena. Since then Mandya too has grown agreat deal and residential areas extend in all directions. Along both sides of thehighway south of the town, many colourful advertisements try to attract the passers-by to the numerous small shops and restaurants along the roadside; there are canecrushers and flourmills; and mechanics provide bicycle and car repair services.These buildings extend now all the way to Dalena. The village lands situated to thewest of the highway used to be open fields. I was surprised to find a church and
Vol. V, No.1 Epstein: Forty Years of Change in Rural South India 7
other nice buildings including a health clinic there. Next to this missionary complexthere is an industrial estate. Opposite to the east of the highway there now is a lineof buildings including a post office, small restaurants and various shops selling agreat variety of goods. Much traffic passes along the highway. Buses travelling inboth directions stop at Dalena. This creates the impression that by now Dalena isalmost a suburb of Mandya. On turning left into the village itself I spotted theprimary school building which had looked nice and new in 1970. Now it was rundown and badly in need of renovation. In front of it a water tank has been constructedto provide piped drinking water. There are eleven public water taps in the villageand a number of houses have their own private taps. In Dalena the main villagesquare was being sealed to facilitate the traffic of cars and trucks. Bordering on thesquare and between a small temple and the house I occupied in 1955, there are nowthe offices of the Dairy Co-operative Society, which buys milk from the villagers.The Anjeneya temple near the square also looks completely renovated with attractive,colourful decorations. Along one of the village streets the old Marichowdi temple,which in 1955 housed the local primary school, was undergoing renovation. Ispotted a few new elaborate and urban-style houses, but far fewer than in Wangala.The majority of Dalena’s improved houses were in the Scheduled Caste settlementat the back of the Peasant residences. A lot of the old Scheduled Caste thatchedhuts have been replaced by RCC structures. Most houses now benefit from drainage— another welcome innovation. Four Peasant households have built their ownbiogas plants to provide fuel for cooking. The increase in the number of houses hasgreatly overshadowed the separation between the Caste and the Scheduled Castesettlements, which still existed in 1970. Peasant residences extend even behind theScheduled Caste settlement, which is now sandwiched between Caste houses.Judging by appearances, the lifestyle of Dalena’s Scheduled Castes has considerablyimproved. Their housing has improved; they are better clothed and look betternourished than what I remembered in 1955. Altogether there is no doubt that bothWangala and Dalena have grown considerably during the past forty years. Thiswas to be expected. Yet I found a noticeable difference in the way the two villagesappeared to have changed.
Economic Change FactorsAgricultural technologies: With population growth and limited availability of lands,the average per capita land area has declined in Wangala by about 33 per cent andin Dalena by about 50 per cent. But Wangala’s wet lands permitted the applicationof new agricultural technologies, which improved crop productivity. In discussionswith farmers it emerged that many single out the change in cultivation practices asthe most important change that has taken place over the past forty years. MostWangala farmers these days plant High Yielding Varieties (HYV) of seeds and applyfertilizer to their irrigated lands. Much agricultural labour has been replaced by
8 Journal of Social and Economic Development Jan. - June 2003
mechanization. Different types of capital assets are now available to farmers: forinstance, besides the numerous cane crushers and flourmills, there are now irrigationpump sets, power tillers and tractors. One Wangala farmer told us:
‘About four months ago I managed to get a loan of Rs.70,000 at 14 per centinterest from the Wangala branch of the Corporation Bank. This enabled me topurchase a power tiller, which I now use on my own lands, but I also offer it forhire. With my power tiller it takes about three hours to plough one acre of land. Icharge Rs.125 per hour. I am pretty confident that there will be sufficient demandfor my power tiller to enable me to repay my debt within about two or three years.Once I am in the clear I can then continue earning quite a bit of money by offeringmy power tiller on hire.’
To meet the higher costs of agricultural inputs, farmers can get credit from differentsources. By paying Rs.10 and thus becoming a shareholder of the Wangalacooperative society, a farmer qualifies for credit on the security of his landholding.He can also get seeds or fertiliser through the co-operative society on payment ofonly 20 per cent cash down; of the remaining amount he gets 60 per cent in kind and40 per cent in cash. Farmers can purchase fertiliser on credit also from privatetraders at Government-controlled prices. Only when traders have access to certainkinds of fertilizer that are temporarily in short supply while farmers are eager to gethold of some quantities do they get away with charging higher prices unofficially.
Urban impact: The recent commercial and industrial development of Mandya, theheadquarters of Mandya District, which is within easy reach from Dalena andWangala, has had a considerable impact on its rural hinterland. Mandya’s populationhas increased manifold from only about 6,000 persons in 1951 to 120,000 in 1991.This large population growth resulted, of course, mainly from urban migration.Increasing numbers of villagers not only from Mandya’s immediate vicinity butalso from much farther afield have been attracted by the income-earning possibilitiesthe growing town offers. The town has over the years developed into a thrivingcommercial, industrial and educational centre. Travelling through the various partsof Mandya, it becomes apparent that a distinct class division has accompanied itsdevelopment. An area with substantial residential buildings, each of which issurrounded by large and well-tended gardens, manifests the presence of wealthyhouseholds. A sprawling area with smaller but also nice looking bungalows indicatesthe presence of a considerably sized middle class, each standing on a separate plot.The large mass of unskilled labourers and unemployed mostly stay in small thatchedroofed huts or in temporary and improvised accommodation.
Mandya’s rapid urbanisation has had numerous repercussions in Dalenaand Wangala. It provided a demonstration model for village development. In termsof lifestyles, this is reflected not only in the many recently built urban-style housesin the villages but also in the furniture that now forms part of many such houses
Vol. V, No.1 Epstein: Forty Years of Change in Rural South India 9

and altogether in the availability of amenities such as television sets and telephones.In 1955 these were luxuries of which villagers would not even have dreamt; nowthey have become an accepted part of everyday village reality. Economic activitieshave also been shaped by Mandya’s development. It encouraged the process ofeconomic diversification. Though this process has occurred both in Dalena andWangala, it took a different form in each of these two villages.
The constraints of dry land have led Dalena men to seek incomes fromother sources outside their village: skilled mechanics and electricians work onnearby industrial estates, building contractors build houses in neighbouring villagesand towns, horticulturists work for the Bangalore and Mandya Departments ofAgriculture; cane crushers process cane grown outside Dalena; carpenters makethe more elaborate carts now wanted by better-off farmers in neighbouring irrigatedvillages; buying agents and merchants operate at Mandya’s jaggery auction andmany villagers are employed at the Mandya refinery. Dalena shops and restaurantsby the side of the highway cater mainly for passing traffic — they sell, for instance,bottled petrol. Dalena villagers own four lorries, which fetch the cane to the crushersand take the jaggery to buyers. Fifteen households own scooters. A few houseshave their own telephones. There are eight small shops and as many small restaurantscatering for villagers’ requirements but none of the many specialist services thatare now available in Wangala. Dalena’s internal market is too small for muchspecialisation to meet local demand; villagers have to export their skills and servicesto secure and/or improve their livelihood. This has meant that they have turnedmore to work in secondary than in tertiary industry, because in doing so theyencounter less competition for employment in the wider economy. Some 65 per centof Dalena men within working age are engaged in non-agricultural work outside thevillage, and about 60 per cent of these pursue industrial activities. Also a considerablenumber of professionally-trained Dalena men have already left the village with theirimmediate families to work and reside elsewhere. They appear to have severed theirlinks with their native village and are likely to be soon forgotten by the people ofDalena.
By contrast, Wangala’s access to irrigation and the consequent increasein crop productivity and rural incomes has created a sufficiently large internaldemand to promote non-agricultural activities within the village. There are smallvegetarian and non-vegetarian restaurants, all of which appear to be well frequentedby Caste members. Most have sheltered seating accommodation outside, so thatcustomers can take their drinks and food while enjoying a bit of the breeze. Thereare also many small stores. Two cycle workshops and one engineering workshopoffer hire and repair services. A post office provides, among other things, savingsarrangements. One Corporation Bank branch offers general banking facilities andtwo Finance Corporations offer credit. Two private fertiliser businesses and one
10 Journal of Social and Economic Development Jan. - June 2003
general farmers co-operative as well as a dairy co-operative, together with tractors,power tillers and harvesters on hire, and many cane crushers provide the goodsand services farmers need. Those craftsmen like the potters, whose products are nomore in demand, have had to turn to other work. One Wangala potter does tailoringand another has acquired a motor rickshaw with the help of a bank loan; he runs itas a taxi. Almost all Wangala individuals who pursue non-agricultural occupationswork within the village; the activities of about 60 per cent of them can be classifiedunder tertiary industries; the rest are mainly craftsmen like the blacksmith andcarpenter whose hereditary skills are essential in making and repairing agriculturaltools and equipment. Most of the goods and services villagers require are nowavailable within Wangala, and this attracts neighbouring villagers to availthemselves also of Wangala’s facilities. The expanding market induces craftsmenfrom outside to move to Wangala and some of them have settled in the villagerecently. Wangala’s non-agricultural activities are almost all directly or indirectlyconnected with village agriculture. Significantly, when I asked what changes theywould like to see in the near future the Wangala men invariably said: ‘We need afactory in Wangala that will manufacture agricultural implements.’ Thus whereasDalena villagers concentrate their non-agricultural activities in secondary industriesand meet needs arising outside their immediate rural environment, Wangala’s non-agricultural activities tend to relate in one way or another to intra-village requirementsand agriculture.
Commercial opportunities: The railway line and the major highway connectingBangalore with Mysore pass through Mandya. There is now a quite substantialindustrial estate to the west of the railway line. The sugar refinery was the firstfactory established in Mandya. It set the pace for the town’s subsequent rapidexpansion. By now there are many other industrial and commercial establishmentsthat flourish in Mandya. Over the years the refinery’s fortunes have depended notonly on the productivity of cane crops, which in turn largely depended on availabilityof water in the irrigation canals, but even more so on competing cane sale outlets.The jaggery boon of the 1960s caused by prohibition obviously alerted farmers tothe possibility of alternative sales outlets besides the Mandya refinery and theynever forgot it. There has been a growing demand for jaggery for sweeteningpurposes in different parts of India. Demand for jaggery therefore continued evenafter the 1960s, though the abolition of prohibition considerably reduced its level.This meant that buyers continued to tour the cane growing areas to buy jaggeryfrom local farmers. Many farmers and even some of the buyers complained that thiswas an inefficient and unsatisfactory marketing system. In some cane-growingIndian states there already existed official Agricultural Marketing Corporationswhere jaggery was successfully auctioned. In 1989 the then Mandya DistrictCommissioner decided to sponsor the establishment of such a corporation in
Vol. V, No.1 Epstein: Forty Years of Change in Rural South India 11

Mandya, where jaggery auctions are held daily. This corporation operates throughlicensed agents and licensed buyers. The agents form relationships with specificfarmers; they take care of their jaggery delivery and see it through auction. Thecane supplier ultimately receives the total amount that the buyer offers. The buyerhas to pay 103 per cent of that amount: two per cent goes to the agent and one percent to the Agricultural Marketing Corporation. The jaggery auctions haveconsiderably improved the cane farmers’ bargaining position and have resulted ina mushroom growth of village cane crushers as can be seen in Dalena and Wangala.
The two villages were, however, affected differently by thecommercialization of jaggery sales. In Wangala rising jaggery prices encouragedextension of cane cultivation besides the establishment of more cane crushers.Wangala cane farmers now try to keep themselves informed about jaggery pricesand compare them with what the refinery pays for contracted cane. When jaggeryprices are more attractive than those paid for cane by the refinery many farmers aretempted to default on the cane contracts they have entered into with the refinery.This poses serious problems for Mandya’s refinery because it makes its planningextremely difficult. Wangala farmers, who in 1955 were all risk minimisers andstruggled to secure contracts with Mandya’s refinery, are now prepared to takemore risks. They produce a much larger quantity of cane than they contract with therefinery in the hope of selling it as jaggery at attractive prices. They are happy aslong as the going is good, but complain bitterly if the jaggery market fails. Havingbecome aware of the bargaining strength they can derive from facing competingbuyers, they have learned to choose how and where to sell their cane with a view tooptimizing their returns. Wangala’s 32 cane crushers clearly indicate that manyfarmers consider it an economic advantage to process the cane they grow. Yet theystill do not appear to appreciate the impact on prices of increasing volumes ofsupplies. High jaggery prices induce many farmers to put more acreage under canecultivation. They do not consider that when many farmers do likewise the jaggerymarket will be flooded and prices will fall.
By contrast, Dalena villagers did not have the option of growing morecane on their own village dry lands. This induced some of the enterprising men toseek a niche for themselves as jaggery agents or buyers. Commercialization of thejaggery trade has led Dalena entrepreneurs not only to strengthen their commerciallinks within their region but also to extend them beyond the boundaries of Karnataka.As jaggery merchants they have to take higher risks. When bidding at the auctionthey must already have in mind potential buyers and an estimate of the price theywill pay. The different aspects of involvement in the jaggery trade reinforced Dalena’svillage extroversion that already existed to a certain extent in 1955 and which haddeveloped further by 1970.
12 Journal of Social and Economic Development Jan. - June 2003
Financial opportunities: The introduction of new and costly capital assets tofarming and the expansion of non-agricultural activities could not have taken placewithout improvements in savings and credit facilities. In 1955 most villagers wereindebted to informal moneylenders; only the largest landowners qualified for bankcredit. Nowadays many villagers have savings in appropriate institutions and haveaccess to credit from various sources. Their financial position has thus greatlyimproved, though of course this does not apply to the same extent to all villagers.Post offices in Wangala and Dalena besides postal services also offer savingsfacilities. There are now numerous ‘Recurring Deposit Accounts’ at Wangala’spost office that are meant for longer-term deposits and carry an interest rangingfrom 10.5 per cent during the first year to 12.5 per cent during the fifth year. Thereare also short-term savings accounts that earn five per cent interest. Half of thepost office savings belong to the Wangala school complex and the other half toindividuals. Post offices also distribute government pensions and welfare payments.
A Corporation Bank branch in Wangala provides only savings and creditfacilities and current cheque accounts; it serves all the villages included in theWangala Gram Panchayat. In 1996 Wangala villagers had some 1,200 savingsaccounts of which about 125 are held by women without their husbands’ knowledgeand 25 are in the names of widows, who receive a monthly State pension of Rs.150.There are 85 current accounts with a total of about Rs.100, 000 and 105 fixed depositaccounts worth a total of about Rs.530, 000. The earnings of members of Wangala’sDairy Co-operative Society are paid directly into their bank accounts, which explainsthe large number of small savings accounts. The bank also offers credit, but only onthe basis of security of land, jewellery or third-party guarantees. The bank manageremphasised that his branch runs at a loss. If it were a private bank it would havealready been closed down. But as it is a Government institution it can continueincurring losses.
Finance Corporations, of which there are two in Wangala, were started in1994. They are registered as co-operative societies. Kangowda, one of the foundingmembers of the Soudhardha Kougaroda Finance Corporation, related:
‘We saw the numerous Finance Corporations that have been established in Mandyaand are registered as co-operative societies allowed to offer loans to businessventures only, not for agricultural purposes. We found out that all these corporationswere thriving because of the many petty business people who had difficulty ingetting loans. This gave us the idea to set up such finance corporation in Wangalawhere there are also many small businesses in need of loans to meet their workingexpenses. Six of us got together and each contributed Rs.15, 000. We started offwith a working capital of Rs.90, 000. Our loans to small entrepreneurs range fromRs.2, 000 to Rs.25, 000 at 23 per cent interest for a maximum period of 10 months.We deduct the interest at the time we give the loan. A man specially engaged to call
Vol. V, No.1 Epstein: Forty Years of Change in Rural South India 13

personally on each of our debtors on a daily basis collects the rest. He is paidRs.500 monthly for the job. Our debtors prefer to repay small amounts daily andalways do so. The secret of our collector’s success lies in his personal contact withour debtors. Unlike the banks we have no loan recovery problem. By now wehave altogether advanced about Rs.350, 000 and with it have helped small businessesto grow not only in Wangala but also neighbouring villages. The Rs.90, 000 workingcapital with which we originally started our Finance Corporation has almostdoubled during the first two years of operation. Our financial success has encouragedsome of our fellow villagers to invest in our venture; this has added anotherRs.159, 000 for which we pay 16 per cent annual interest to depositors.’
Kangowda stated that the other Wangala Finance Corporation in the village haddeveloped in a similar way and other villagers present nodded in agreement. Thesuccess of Wangala’s Finance Corporations made me wonder why none of myenterprising Dalena friends had yet thought of establishing such a corporation intheir village. When I asked them they told me that a few of them are involved in suchcorporations in Mandya; they felt that the demand in Dalena and neighbouringvillages for small business finance was not sufficiently strong to warrant theestablishment of a Finance Corporation in their own village. Wangala FinanceCorporations represent ingenious institutions appropriately adapted to the needsof small businesses. The modus operandi of the loan collection is so obviouslywell suited to debtors’ requirements and ensures a high recovery rate. It has theadvantage of continuing the personal aspect of creditor-debtor relationships, whichused to be the central feature of traditional money-lending arrangements in Wangala;only now loans are set in a new financial environment. The Government may thereforebe well advised to encourage such Finance Corporations also to finance agriculturalactivities instead of prohibiting them from doing so. Unlike the Government bankbranch in Wangala, which concentrates on agricultural credit and operates at aloss, these privately organised Finance Corporations make a handsome profit andlenders as well as debtors are pleased with the way they operate.
Rural Development and Water ShortagesExternal interventions to increase rural incomes have until recently
concentrated on improving agricultural productivity. This has succeeded prettywell in South India. Irrigation schemes have relieved farmers from dependence onuncertain and scarce rainfall. Irrigation, together with the High Yielding Varieties ofseeds and artificial fertiliser, brought about the ‘Green Revolution.’ Agriculturalproductivity of irrigated lands increased manifold. Wangala farmers did well out ofthe ‘Green Revolution’ so much so that their crop outputs have kept pace with theirgrowing population. This has reinforced their village introversion and strengthenedtheir social unity. However, irrigated farming practices use up excessive amounts ofwater, with the result that water rather than land has now become the scarce resource.
14 Journal of Social and Economic Development Jan. - June 2003

Accordingly, the rural development focus is likely to have to change from optimisingagricultural productivity per unit of water rather than per unit of land. This importantfact does not appear as yet to be fully recognised either by South Indian authoritiesor the public at large. The recent temporary closing of the K.R.S. irrigation systemin Karnataka State for the purpose of relining the canals clearly illustrates that theauthorities are taking a narrow and short-term view rather than the wider and longer-term implications of water scarcity.
The Social Cost of ChangeRapid South Indian rural development appears to have been accompanied
by serious social problems. Drinking and gambling often result in violence. Theelder villagers complain about the declining moral and ethical standards. Previouslyit was taboo for Peasant Caste members to touch alcohol, and wife beating was arare and punishable phenomenon. Now most village men enjoy at least some alcoholin the evening after work. Not everyone drinks excessively, but a considerablenumber do. These days there is a lot of drunkenness among villagers. The liquorstores, which can be found in each village, provide ready access to alcoholicbeverages. Men seem to be the main offenders in terms of drinking and gambling.When drunk they often become violent and beat their wives and children. If theylose in gambling they are often driven to pledging their wives’ jewellery andhousehold possessions. This causes havoc with family relationships. It forcesmany wives to fend for themselves to look after their children and to keep theirfamilies together. There are many such cases both in Dalena and Wangala. InDalena the drink problem has taken on such proportions that the informal traditionalPeasant Caste panchayat introduced a rule according to which any person founddrinking or gambling in the village has to pay a fine. The money thus collected isused for development purposes.
Psychological strain is another regrettable feature that did not exist in1955 and is now prevalent in these villages. According to the doctor at Wangala’sPrimary Health Unit, ‘as much as 60 per cent of the patients who come to the clinicsuffer from psychological stress. Most of them are not severe cases and get betterreasonably quickly; all they seem to need is a sympathetic listener to their problems.The more serious cases are transferred to Mandya or if necessary even to Bangalorepsychiatric units.’ In Dalena and Wangala a growing number of suicides haveoccurred in recent years. This manifests the existence of stress and strain in thesesocieties. Psychological stress has been on the increase also in Westernindustrialized society for some time already. It is regrettable that it has now come tobedevil even Indian rural societies that previously were thought to be immune topsychological problems.
HIV/AIDS is another health issue that has been imported into rural areas.The Wangala doctor related that ‘there has already been one case of AIDS in
Vol. V, No.1 Epstein: Forty Years of Change in Rural South India 15
Wangala. It was a young man who when diagnosed was expelled and died threemonths later. We checked and tested all his village contacts but found them allnegative. Now there is another case in one of the neighbouring villages; in myjudgement the young man will also soon die — there is hardly anything we can doto help HIV/AIDS affected patients...’
At the end of my brief return to Dalena and Wangala in 1996, when I cameto say my fond farewells to my many village friends, I could not help but wonderwhether the various health and social problems villagers now encounter are anunavoidable social cost of change. Further, is it possible to ensure the advantagesof progress without having to suffer the accompanying disadvantages?
Notes
1. For a more detailed account see Epstein 1962. The book also appeared in the ELBSseries and the Agricultural University, Bangalore, has published a vernacular translation.It was republished by Media Promoters and Publishers Pvt Ltd, Bombay, 1979.
2. I have used pseudonyms for the villages to conceal the identity of my informants. I havecalled the wet village Wangala and the dry Dalena.
3. For a more detailed account see Epstein 1973. The book also appeared in the ELBSseries, and the Agricultural University, Bangalore, has published a vernacular translation.
4. For a more detailed account see Epstein et al. 1998, and the documentary film with thesame title produced by the German Institute for Scientific Films, Goettingen University.
ReferencesEpstein, T. Scarlett (1962). Economic Development and Social Change in South India.
Manchester: Manchester University Press.——— (1973). South India: Yesterday, Today and Tomorrow. London: Macmillan.Epstein, T. Scarlett, A. P. Suryanarayana, T. Thimmegowda (1998). Village Voices — Forty
Years of Rural Transformation in South India. New Delhi: Sage Publications.
16 Journal of Social and Economic Development Jan. - June 2003
Received: August 8, 2003 Accepted: September 8, 2003

A Critical Reflection on Development of ScheduledCastes
M. Mahadeva *
Abstract
Notwithstanding the Constitutional guarantees and developmentalinterventions, the goal of bringing the Scheduled Castes (SCs) into themainstream has proved to be a distant dream. It is turning out to be adaunting challenge especially in the light of ongoing economic changes,as the public actions have further distanced this section from the coreeconomic activities. Unrealistic interventions have compounded themisery among SCs. On the demand side, large-scale landlessness andlack of skills have impeded their economic advancement. This paperexamines the scale of deprivation among SCs in the economic and socialspheres at the national and state levels. The paper advocates alternativedevelopment strategies for SCs under the ‘Comprehensive Development(CD)’ and ‘Integrated Approach (IA)’ framework to empower allsegments and to contain the existing levels of social and economicdeprivation.
Introduction
Scheduled Castes (SCs) are prominent socially and economicallydisadvantaged groups in India, comprising 138.22 million. SCs account for 16.48per cent of the country’s population and 39.45 per cent of the socially disadvantagedpopulation. For centuries, SCs have been subjected to the inhuman practice ofuntouchability and discrimination on the basis of caste by the upper caste people.Unfortunately, untouchability and discrimination, though legally banned, continueto flourish even to date. The hope of eliminating the inhuman practice has beenlargely belied by the relative resilience of various socio-cultural institutions,particularly in rural areas. Atrocities (e.g., beating, burning of property, rape, killing,denial of civil rights, social boycotts) against SCs are routine occurrences and areincreasing at an alarming level, for social-economic-political reasons (see, Shah
* Associate Professor, Agricultural Development and Rural Transformation Unit, Institutefor Social and Economic Change, Bangalore-560 072. E-mail: [email protected] paper would not have been possible without the guidance and support of ProfessorsAbdul Aziz and S. Bisalaiah. The research help of Dr. Jayasheela is gratefullyacknowledged. Thanks are also due to the anonymous referee for useful suggestions.The usual disclaimers apply.

2000; Pai 2000). The law and order authorities are callous in dealing with suchatrocities against SCs. The number of unregistered incidents is said to be at leastone-and-a-half times that of registered incidents (Pai 2000, p.419). While the Statemachinery is insensitive to the hardships of SCs, the intervention efforts1 to improvetheir lives have been mostly half-hearted. Even after five decades of independence,access to economic and social bases to lead a normal decent living has been a far-reaching dream for a majority of SCs. Their current plight is mainly attributable tolimited public action together with scant public investment for the welfare of SCs.Lack of need-based interventions has also been a factor. Further, new employmentopportunities have gone in favour of head-starts in society, and as a result the SCshave hardly reaped these benefits, as most of them are not technically equipped orskilful. Indeed, a serious attempt to assess the socially lopsided impact of the recenteconomic changes is yet to be made either by the state or scholars concerned.
A few recent studies assume significance in their attempt to account fordevelopment in the light of the changing economic sphere. Journal of Indian Schoolof Political Economy and Journal of Rural Development brought out special issuesduring the past two years on Scheduled Castes. The first one carried contributionof experiences from major states like Punjab, Uttar Pradesh, Bihar, West Bengal,Gujarat, Maharashtra and Tamil Nadu. The several papers focus on the levels ofadvancement among Scheduled Castes as well as the lags in economic and politicalspheres, from a sociological perspective. The second, being a combination ofcontributions from bureaucrats and academics, examined constitutional guarantees,protective measures and discriminations, impact of states’ intervention for thewelfare of Scheduled Castes, etc. Also, the weaknesses in the development andempowerment programmes and their contributions to continued inequality havebeen clearly spelt out (Thorat 2000). However, notwithstanding the efforts of thesecontributions, they fail to document the overall position of this section and to accountfor the scale of advancement over the years. Also, these studies fail to throw lighton the volume and scale of social and economic deprivations among SCs vis-à-visothers both at the macro level and at the state level. Further, critical issues such aslandlessness, higher incidence of illiteracy and drop-outs at various levels, higherscale of poverty, representation of SCs in services (central public sector undertakings/commercial banks and financial institutions) have not been extensively examined.Similarly, issues pertaining to housing, drinking water, electricity and sanitationhave never been addressed, despite their growing importance in bringing aboutsocial advancement and improvement in living standards. Since all these issuesform the bases of backwardness, this paper attempts to examine critically the scaleof social and economic deprivations among SC families at the macro and statelevels. Such an analysis is extremely important to remind the states of theirresponsibilities towards SC families in the changing circumstances besides
18 Journal of Social and Economic Development Jan. - June 2003

answering the popular question as to how much longer the state should take theresponsibility of improving the conditions of SCs.
This paper analyses the information contained in a number of officialreports and data sources. All India Report on Agricultural Census (1990–91) ofthe Ministry of Agriculture and Co-operation (1998) has been used to assess theland and landlessness situation. Annual Reports of the Department of AdministrativeReforms and Public Grievances (1994), Ministries of Chemicals and Fertilisers,Industries and Commerce and Finance (2000–2001), Government of India, are thesources to account for the representation of SCs in public services. Similarly, Reportof the Expert Group on Estimation of Poverty (1993–94) has been consulted topresent the status of poverty among SCs at the national and state levels. Finally, tomeasure ‘houselessness’ and lack of amenities, an occasional paper on housingand amenities of Census of India (1991) has been made use of. Data for two periodswould have better indicated the development distance of SCs, but owing to non-availability of comprehensive data on many indicators used in the paper the samecould not be attempted. This paper is organised into four sections. In the secondsection, skewed distribution of holdings and landlessness, lags in educationaladvancement and in public services have been discussed. The third section analysesthe scale of poverty and social deprivation. In the final section, obstacles todevelopment of SCs and future policy options have been indicated.
Land and Landlessness
The importance of land as a means of livelihood cannot be overemphasisedin an agrarian and rural-based society like India. In a country where over one-thirdand around half of its population respectively are below the poverty line and illiterate,land is considered the basis for sustenance or survival. Especially for those whohave been considered untouchables, with large-scale poverty and illiteracy, it isimpossible to visualise the plight of the landless. Besides higher scale of landlessness,access to land by SC families is far from satisfactory. Before analysing the skeweddistribution, it is worth noting that just over 134 lakh families of SCs are reportedlylandholders. This works out to 51 per cent of the total number of SC familieswhereas in the case of general population/families the share of landholders is wellover 70 per cent. This only confirms the scale of deprivation of land for SC familiesas compared with general families. Yet another aspect is the skewed distribution ofland. At the outset, although SC families account for 12.59 per cent of the totalnumber of holdings in the country, the total area held by them has been only around8 per cent. Similarly, the average size of holding of SC families has been only 0.57hectares as against the national average of 1.55 hectares. The shortage exists invarious size categories, and is particularly widespread in the large holdings category.The difference in SC large holdings is less by 0.63 hectares followed by 0.13 hectares
Vol. V, No.1 Mahadeva: A Critical Reflection on Development of Scheduled Castes 19
among medium farming, 0.06 hectares in semi-medium, 0.03 hectares in small and0.04 hectares in marginal farming.
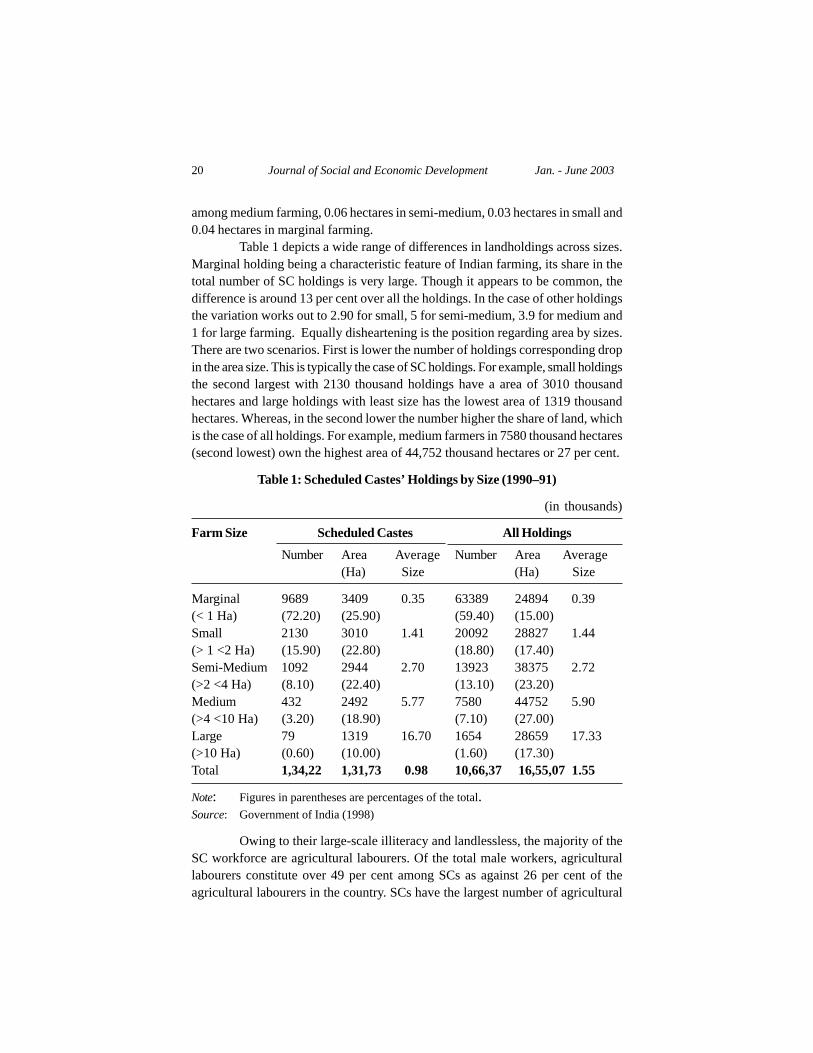
Table 1 depicts a wide range of differences in landholdings across sizes.Marginal holding being a characteristic feature of Indian farming, its share in thetotal number of SC holdings is very large. Though it appears to be common, thedifference is around 13 per cent over all the holdings. In the case of other holdingsthe variation works out to 2.90 for small, 5 for semi-medium, 3.9 for medium and1 for large farming. Equally disheartening is the position regarding area by sizes.There are two scenarios. First is lower the number of holdings corresponding dropin the area size. This is typically the case of SC holdings. For example, small holdingsthe second largest with 2130 thousand holdings have a area of 3010 thousandhectares and large holdings with least size has the lowest area of 1319 thousandhectares. Whereas, in the second lower the number higher the share of land, whichis the case of all holdings. For example, medium farmers in 7580 thousand hectares(second lowest) own the highest area of 44,752 thousand hectares or 27 per cent.
Table 1: Scheduled Castes’ Holdings by Size (1990–91)
(in thousands)
Farm Size Scheduled Castes All HoldingsNumber Area Average Number Area Average
(Ha) Size (Ha) Size
Marginal 9689 3409 0.35 63389 24894 0.39(< 1 Ha) (72.20) (25.90) (59.40) (15.00)Small 2130 3010 1.41 20092 28827 1.44(> 1 <2 Ha) (15.90) (22.80) (18.80) (17.40)Semi-Medium 1092 2944 2.70 13923 38375 2.72(>2 <4 Ha) (8.10) (22.40) (13.10) (23.20)Medium 432 2492 5.77 7580 44752 5.90(>4 <10 Ha) (3.20) (18.90) (7.10) (27.00)Large 79 1319 16.70 1654 28659 17.33(>10 Ha) (0.60) (10.00) (1.60) (17.30)Total 1,34,22 1,31,73 0.98 10,66,37 16,55,07 1.55
Note: Figures in parentheses are percentages of the total.Source: Government of India (1998)
Owing to their large-scale illiteracy and landlessless, the majority of theSC workforce are agricultural labourers. Of the total male workers, agriculturallabourers constitute over 49 per cent among SCs as against 26 per cent of theagricultural labourers in the country. SCs have the largest number of agricultural
20 Journal of Social and Economic Development Jan. - June 2003

labourers as compared with any other community. ‘Uncertainty of livelihood’ bestdescribes the plight of these labourers. Since they work during the agriculturalseason and migrate to urban areas during the slack season, they constantly face thechallenges of employment both at home and at destinations. Agriculturalsluggishness and increasing mechanisation of economic activities (e.g., constructionsectors) in urban areas have substantially reduced the human labour requirement.The eroded employment opportunities have forced these labourers to acceptemployment under public works, whose money wages are far below the rulingwages. That apart, public works have generated only a limited number ofemployment2 opportunities owing to lack of public investment and eroded publicexpenditure especially during the 1990s. Their added misery is the shocks to artisansfrom the new programmes of liberalisation. Increasing product differentiation andmarket diversification have destabilised the conditions of a wide range of artisans.
Educational (Dis) Advancement
Public concern for educational advancement of SCs is one of the foundingexpectations of the Indian Constitution under Article 46. Ever since the adoptionof the Constitution, public interventions could make just over one-third of the SCpopulation literate. Despite the dismal progress, the position of the so-calledilliterates or educated persons is equally disappointing. The public concern topromote the educational interest of SCs has yielded only fringe benefits. Thoughreservation in public services has helped only a limited number of persons, themajority of the so-called educated SCs have ended up unemployed.3 Increasingeducated unemployment among SCs is mainly due to the gap between theemployment market and educational skills that these sections are acquiring. Theemployment market demands skills that many educated SC persons do not possess,owing to their poor status and poor guidance. Further, the new economic regimehas widened the existing gap that has been referred to. It can be said that theeconomic reforms of the late 80s were introduced when SCs (and other weakersections also) were educationally consolidating their positions. The publicopportunities, which were till then a source of hope for these sections, are dwindlingowing to withdrawal of public investment, recruitment holdings, increasing privateinvestment, etc. These buzzwords have not only further marginalised these sectionsbut have also thrown them into a worst ever situation. However, SCs are partlyresponsible for their plight. The majority of SCs, especially in the rural areas, takepride in pursuing such education, which does not fetch them a basic livelihood letalone a decent living. Apart from the shrinking opportunities, lack of capital hasdriven a number of persons into the informal sectors for employment such as garmentunits/outlets and hotels.
Vol. V, No.1 Mahadeva: A Critical Reflection on Development of Scheduled Castes 21
The plight of educated SCs is thus seen to be unenviable. However, thatof school drop-outs among SC wards is worse. The incidence of such drop-outs isparticularly high in rural areas (NSSO 42nd Round). Of the total number of drop-outs(6,31,72,776) in the country, SC wards account for 15.61 per cent or 98,60,465. Amongthe total number of drop-outs from the depressed sections (SC, ST and Neo-Buddhist), the share of SC wards was over 70 per cent. Male wards constitute themajority (71,02,208 or 72.03 per cent) of the total number of drop-outs. The percentageof drop-outs is highest (63.29 per cent) at the primary level followed by the secondarylevel (34.66 per cent) and at other levels (2.05 per cent). Similar to the primary level,post-secondary level is also considered for higher scale of drop-outs with 76.73 percent of 8,706 wards. The only difference is that the incidence is higher amongfemale wards (53 per cent). The higher incidence of drop-outs among SC wards islargely explained by several factors such as lack of interest in education/furtherstudies (30.42 per cent), other economic reasons (23.54 per cent), participation inhousehold economic activity (18.38 per cent), failures (15.97 per cent), attendingdomestic chores (4.84 per cent), and the remaining for other reasons. Though thesereasons vary slightly between male-female wards, attending to domestic chores isone of the main reasons for drop-outs among female wards, whose incidence isthrice as high as the average. Also these reasons hold good for non-enrolment asstudents besides non-availability of schooling facilities close to SC habitations. Ithas been estimated that about 6.10 lakh children have never been enrolled in school,i.e., around 23 per cent of the total number of non-enrolled children in the country.The incidence is higher among SC female children (3.54 lakhs or 58.03 per cent).
Representation in Services
Given the skewed distribution of landholdings, large-scale landlessnessand higher incidence of poverty, it has been impossible for Scheduled Castes toenter into the mainstream of society and to become partners of development. Addedto this, lack of capital in the hands of SCs has kept them away from economicactivities like trade and business. Employment in government services (central andstates) and public sector undertakings is the only avenue for SCs to improve theirsocio-economic conditions and to make a decent living. But for the representationin services over five decades even the meagre development benefits that have accruedwould have been impossible for SCs, thanks to the protective discrimination andConstitutional safeguards. This only reinforces the need for such safeguards andpositive discriminations as long as these people are outside the mainstream of societyin the social and economic spheres. With the given representation in services forSCs, not everything is all right. Owing to their poor educational background andlack of professional skills, SCs have had to start from the lower cadres of services,
22 Journal of Social and Economic Development Jan. - June 2003

and by the time they reach the positions that matter they would have attainedsuperannuation. Even if some have reached the positions that matter, they wouldhave either consolidated themselves in such positions or would have got entangledwith difficulties/pressures from others. Though the data set is questionable, therepresentation of SCs in services, as listed in Table 2, depicts the overwhelmingscenario and confirms the above arguments.
Table 2: Representation of Scheduled Castes in Public Services
Total Employment Scheduled Percentage Castes Share
I Government (Central) (As on 1.1.1994)Group A 59016 6046 10.24Group B 103198 12442 12.06Group C 238613 374758 15.73Group D 1023285 209423 20.46Total 3567112 602670 16.90
II Public Sector Undertakings (50) (11 M/C&F) (39 (M/Commerce)(As on 31.12.2001)
Group A 16138 1632 10.11Group B 14572 1949 13.37Group C 25251 4111 16.28Group D 6827 1926 28.21Total 62778 9618 15.32
III Public Sector Banks / Financial Institutions (As on 31.12.2001)Officers 240615 31367 13.03Clerks 435330 66044 15.17Sub-staff 157505 39057 24.8Sub-Staff 35200 18867 53.60(sweepers)Total 868650 155335 17.88
Source: Government of India (1994, 2002).
Overcrowding in the lower cadres and thin representation of SCs inpositions that matter are the features. Though the overall representation of SCs inservices is well above the provisions, there is cause for concern with regard tohigher positions. The legal provisions in the context of social justice enjoin judiciousand equal representation of SCs in all cadres, but this has not happened to theexpected level in government and PSU services let alone in other services. It is clearfrom the table that in the hierarchical cadres SCs have been overrepresented in
Vol. V, No.1 Mahadeva: A Critical Reflection on Development of Scheduled Castes 23

group D segments to the extent of over 20 per cent in government, over 28 per centin public undertakings4 and around 25 per cent in the public sector banks andfinancial institutions. Further SC representation constitutes over fifty per cent ofthe total sub-staff category of the banking sector. As a result, there exists deficiencyof representation for SCs in group A & B categories of Government and PSUs andat officers level of the banking sector. Lack of motivation on the part of the authoritiesalone is not the reason. SC employees are also responsible for their plight as mostof them take pride in their present positions rather than industrious and painstakingsteps toward upward mobility.
Poverty and Scheduled Castes
Poverty is synonymous with Scheduled Castes in India as most of them,especially rural illiterates, are born in poverty, live in poverty and die in poverty.Also it may not be wrong to use ‘poverty’ and ‘Scheduled Castes’ interchangeably.Lack of assets, income and proper livelihood system being a regular feature of SCson the one hand, deprivation of even basic needs like a decent house with properlighting and drinking water is a reality on the other hand. Not that the poverty ofSCs is unique or extraordinary, but the magnitude of poverty is always higheramong this section. This means that either the anti-poverty intervention is notproperly designed or was not provided sufficiently. This is clear from the fact thatpoverty among SCs, which was 8 per cent more than the national average in 1977–78, continues to maintain the gap rather increasingly. This gap was around 13 percent in 1983–84, dropped to around 12 per cent in 1987–88, and then increased to 13per cent in 1993–94. A further disappointing feature has been a marginal reductionof poverty among SCs as compared with the total population. Over the years, theoverall poverty trend has dropped by over 12 per cent (from 48.3 per cent in 1977–78 to 35.97 per cent in 1993–94), whereas in the case of SCs, the drop is only 7.93 percent during the period. Interestingly, the falling trend in the ratio among both SCsand the general population till 1987–88 has reversed itself by 1993–94, which iseventually the period of economic reforms. During the reforms period the povertyratio increased by 6 per cent among the general population and by 7 per cent amongSCs (Table 3).
Table 3: Percentage of Scheduled Caste Population below Poverty Line(1977–78 to 1993–94)
Year SCs All population
1977–78 56.30 48.301983–84 50.10 37.401987–88 41.50 29.901993–94 48.37 35.97
24 Journal of Social and Economic Development Jan. - June 2003

The scenario is far more disturbing across states than at the national level. Thereare two major disappointing features in this regard (Table 4). First, higher povertygaps among SC families, which are even more than the national average (12.4 percent). Second, higher poverty ratio, which is over and above the national averagefor SC families. With some overlapping states in both the categories, fifteen of thesixteen states have registered a higher poverty gap among SC families ranging from2.52 to 22.66 per cent above the average. Especially in the case of nine of the fifteenstates the situation has aggravated. Karnataka maintains a huge gap of povertyamong SC families with 22.66 per cent followed by Uttar Pradesh (19.66 per cent),Tamil Nadu (16.65 per cent), Rajasthan (15.03 per cent), Maharashtra (14.52 percent), Madhya Pradesh (14.88 per cent), Gujarat (13.59 per cent), Punjab (13.37 percent) and Haryana (12.87 per cent). Similarly in seven states, the SC poverty ratio isfar more than the SCs national average (48.37 per cent) ranging from the highest(60.51 per cent) in Uttar Pradesh to the lowest (51.08 per cent) in Orissa. Others areMadhya Pradesh (57.40 per cent), Karnataka (55.82 per cent), Bihar (54.40 per cent),Maharashtra (51.78 per cent) and Tamil Nadu (51.68 per cent). In all the above statesthe poverty alleviation efforts are inadequate and far from ground reality. Therefore,in these states a lot more needs to be done in order to arrest the higher incidence ofpoverty among SCs.
Further, the distribution of poverty ratio among the SC families in rural/urban areas across states is equally worrisome. The SC population in urban andrural areas faces higher poverty, which is above all population at the national level.In urban areas the SC population below the poverty line works out to 49.48 per cent,which is over 17 per cent higher than that of all population in urban areas. Also, itis higher by more than 1 per cent of total SCs. Though the incidence of povertyamong SCs in rural areas is not as severe as in urban areas, the scale of incidence isstill higher at around 11 per cent vis-a-vis all-rural population. This apart, the SCpoverty ratio is extremely high in rural-urban areas of a number of states. Forexample, around 71 per cent of SCs in rural Bihar are BPL followed by 59 per cent(Uttar Pradesh), 52 per cent (Maharashtra) and 49 per cent (Orissa). Similarly, MadhyaPradesh takes the lead with a high poverty ratio among SCs in urban areas with 65per cent followed by Karnataka (61.59 per cent), Tamil Nadu (61.50 per cent), UttarPradesh (58 per cent), Bihar (54.40 per cent) and Maharashtra (52.56 per cent). Thehigher incidence of poverty in all population in Bihar and in Madhya Pradesh alsocontributed to the higher incidence among SCs in rural and urban areas respectively.
Houselessness
Absolute houselessness5 is defined as the difference between the numberof households and the number of occupied residential houses. It is a state in whichthe number of households/families exceeds the number of houses. Before analysing
Vol. V, No.1 Mahadeva: A Critical Reflection on Development of Scheduled Castes 25
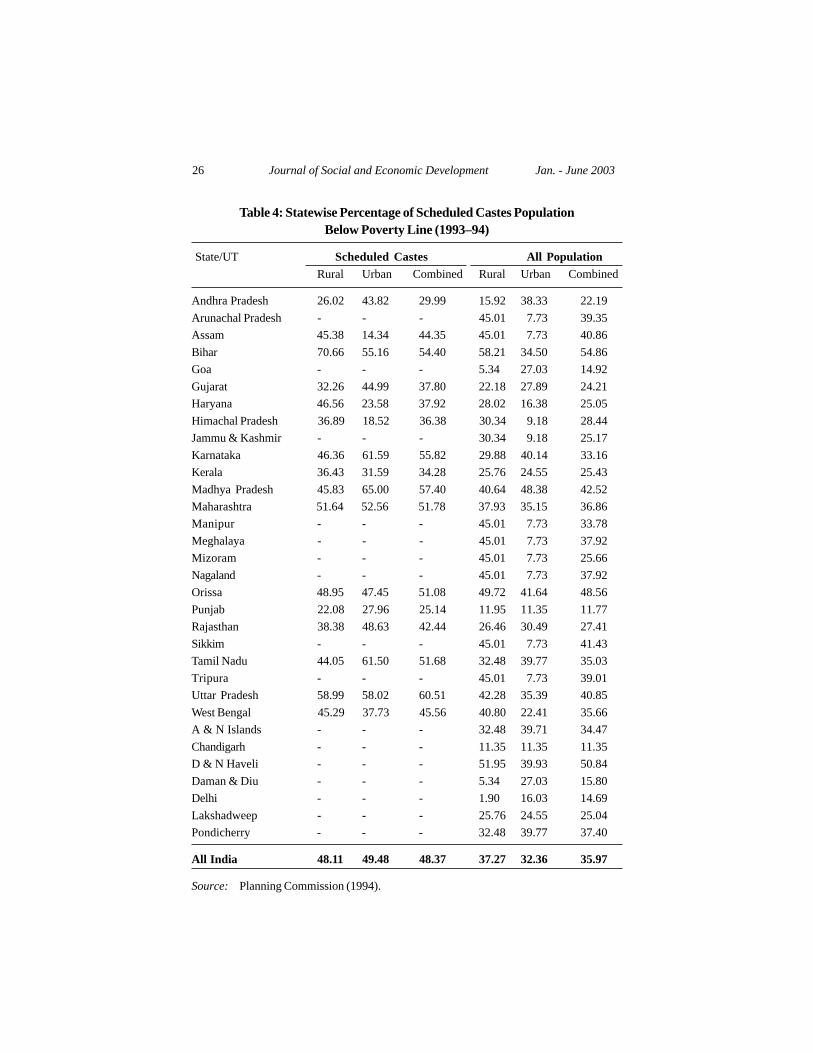
Table 4: Statewise Percentage of Scheduled Castes PopulationBelow Poverty Line (1993–94)
State/UT Scheduled Castes All PopulationRural Urban Combined Rural Urban Combined
Andhra Pradesh 26.02 43.82 29.99 15.92 38.33 22.19Arunachal Pradesh - - - 45.01 7.73 39.35Assam 45.38 14.34 44.35 45.01 7.73 40.86Bihar 70.66 55.16 54.40 58.21 34.50 54.86Goa - - - 5.34 27.03 14.92Gujarat 32.26 44.99 37.80 22.18 27.89 24.21Haryana 46.56 23.58 37.92 28.02 16.38 25.05Himachal Pradesh 36.89 18.52 36.38 30.34 9.18 28.44Jammu & Kashmir - - - 30.34 9.18 25.17Karnataka 46.36 61.59 55.82 29.88 40.14 33.16Kerala 36.43 31.59 34.28 25.76 24.55 25.43Madhya Pradesh 45.83 65.00 57.40 40.64 48.38 42.52Maharashtra 51.64 52.56 51.78 37.93 35.15 36.86Manipur - - - 45.01 7.73 33.78Meghalaya - - - 45.01 7.73 37.92Mizoram - - - 45.01 7.73 25.66Nagaland - - - 45.01 7.73 37.92Orissa 48.95 47.45 51.08 49.72 41.64 48.56Punjab 22.08 27.96 25.14 11.95 11.35 11.77Rajasthan 38.38 48.63 42.44 26.46 30.49 27.41Sikkim - - - 45.01 7.73 41.43Tamil Nadu 44.05 61.50 51.68 32.48 39.77 35.03Tripura - - - 45.01 7.73 39.01Uttar Pradesh 58.99 58.02 60.51 42.28 35.39 40.85West Bengal 45.29 37.73 45.56 40.80 22.41 35.66A & N Islands - - - 32.48 39.71 34.47Chandigarh - - - 11.35 11.35 11.35D & N Haveli - - - 51.95 39.93 50.84Daman & Diu - - - 5.34 27.03 15.80Delhi - - - 1.90 16.03 14.69Lakshadweep - - - 25.76 24.55 25.04Pondicherry - - - 32.48 39.77 37.40
All India 48.11 49.48 48.37 37.27 32.36 35.97
Source: Planning Commission (1994).
26 Journal of Social and Economic Development Jan. - June 2003
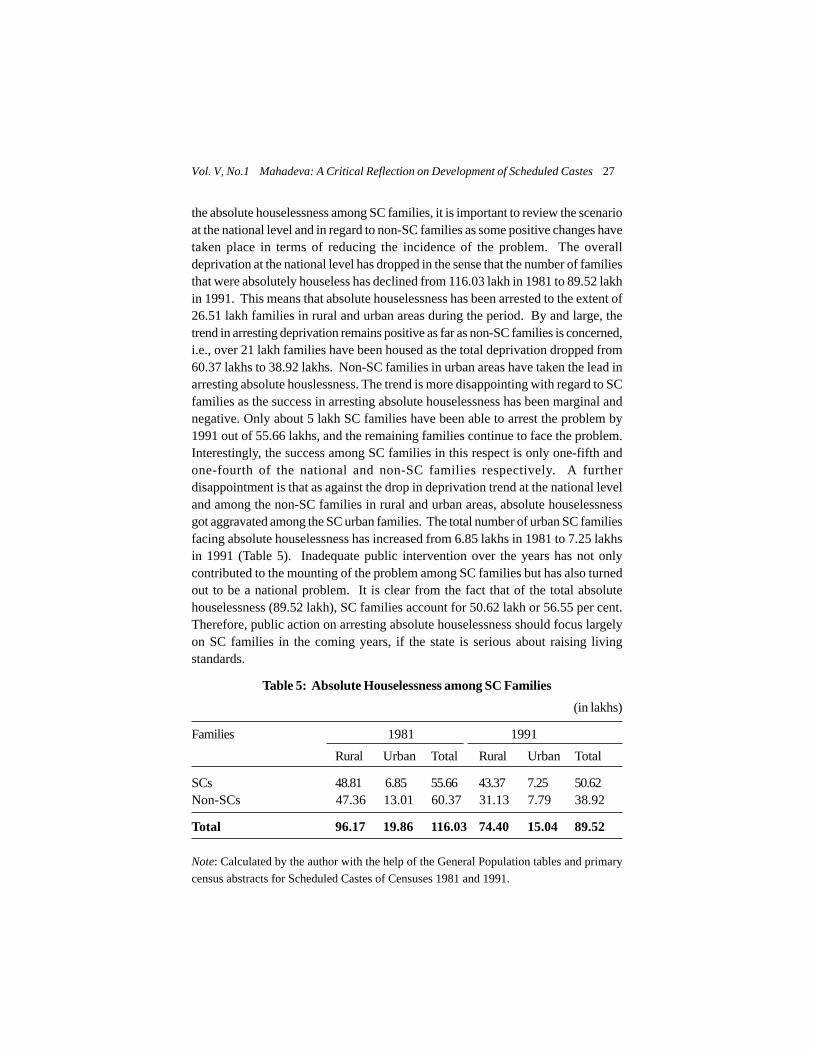
the absolute houselessness among SC families, it is important to review the scenarioat the national level and in regard to non-SC families as some positive changes havetaken place in terms of reducing the incidence of the problem. The overalldeprivation at the national level has dropped in the sense that the number of familiesthat were absolutely houseless has declined from 116.03 lakh in 1981 to 89.52 lakhin 1991. This means that absolute houselessness has been arrested to the extent of26.51 lakh families in rural and urban areas during the period. By and large, thetrend in arresting deprivation remains positive as far as non-SC families is concerned,i.e., over 21 lakh families have been housed as the total deprivation dropped from60.37 lakhs to 38.92 lakhs. Non-SC families in urban areas have taken the lead inarresting absolute houslessness. The trend is more disappointing with regard to SCfamilies as the success in arresting absolute houselessness has been marginal andnegative. Only about 5 lakh SC families have been able to arrest the problem by1991 out of 55.66 lakhs, and the remaining families continue to face the problem.Interestingly, the success among SC families in this respect is only one-fifth andone-fourth of the national and non-SC families respectively. A furtherdisappointment is that as against the drop in deprivation trend at the national leveland among the non-SC families in rural and urban areas, absolute houselessnessgot aggravated among the SC urban families. The total number of urban SC familiesfacing absolute houselessness has increased from 6.85 lakhs in 1981 to 7.25 lakhsin 1991 (Table 5). Inadequate public intervention over the years has not onlycontributed to the mounting of the problem among SC families but has also turnedout to be a national problem. It is clear from the fact that of the total absolutehouselessness (89.52 lakh), SC families account for 50.62 lakh or 56.55 per cent.Therefore, public action on arresting absolute houselessness should focus largelyon SC families in the coming years, if the state is serious about raising livingstandards.
Table 5: Absolute Houselessness among SC Families(in lakhs)
Families 1981 1991
Rural Urban Total Rural Urban Total
SCs 48.81 6.85 55.66 43.37 7.25 50.62Non-SCs 47.36 13.01 60.37 31.13 7.79 38.92
Total 96.17 19.86 116.03 74.40 15.04 89.52
Note: Calculated by the author with the help of the General Population tables and primarycensus abstracts for Scheduled Castes of Censuses 1981 and 1991.
Vol. V, No.1 Mahadeva: A Critical Reflection on Development of Scheduled Castes 27
Lack of Amenities
Provision of safe drinking water, electricity and safe disposal of humanwaste are obviously central to good housing and living conditions and to health(UNCHS 1996). If consideration is given to housing rather than to the servicesassociated with it, then it is only development without quality. In fact, the quality ofamenities (drinking water, electricity, toilet/wash rooms) within housing has becomeincreasingly important in the context of improving living standards. Unfortunately,in the Indian context, development of housing, particularly in the rural areas, isbeing taken up on a compartmentalised basis without providing these amenitiessimultaneously. Interestingly, public-social housing schemes are not an exceptionto this because plans and budgets are evolved only for construction of housingunits but not for these amenities. Therefore, an integrated approach (housing alongwith related amenities) is confined to only private initiatives, and is yet to becomea reality in the public housing schemes. Since public housing schemes are theprincipal sources for SC families to meet their housing needs, the scale of deprivationin regard to housing amenities is greater than it is with others.
Despite considerable progress in providing safe drinking water to a majorityof the population, over one-third of them had no alternative but to use unsafe waterfor their day-to-day needs. These people would have been using contaminated waterowing to lack of piped water supply to their homes. Though with regard to accessto safe drinking water, the variation is only marginal between SC families and allpopulation, the former experience extreme difficulties when it comes to the questionof ‘pay and use water’. Access to electricity and washroom (toilet) facilities is nobetter. A little over 28 and 11 per cent of SC families have access to electricity andwash-room facilities respectively as against over 48 and around 29 per cent inrespect of all population (Table 6). With this, the development disparity varies ataround 20 and 18 per cent. This indicates that development of services has notreached all sections, especially those who are incomeless. The lack of electricityand toilets has forced the disadvantaged sections to resort to unhealthy practices.Kerosene continues to be the principal source of lighting for most SC familiesdespite the emission of a lot of carbon dioxide and consequent respiratory problems.As regards human waste disposal, most SC families, especially in rural areas, useopen spaces around their habitation, thereby endangering their health. A simple pitlatrine in the household is yet to become a reality for most SC families. With regardto access to all the three services (drinking water, electricity and toilet), the positionremains lamentable at the national level let alone among SC families. However,when compared with whatever little progress the country achieved, SCs’ access tothese three facilities is one-third of what it is at the national level. This calls formeasures to take the development efforts to the doorsteps of the vulnerable groupsinstead of the other way round.
28 Journal of Social and Economic Development Jan. - June 2003
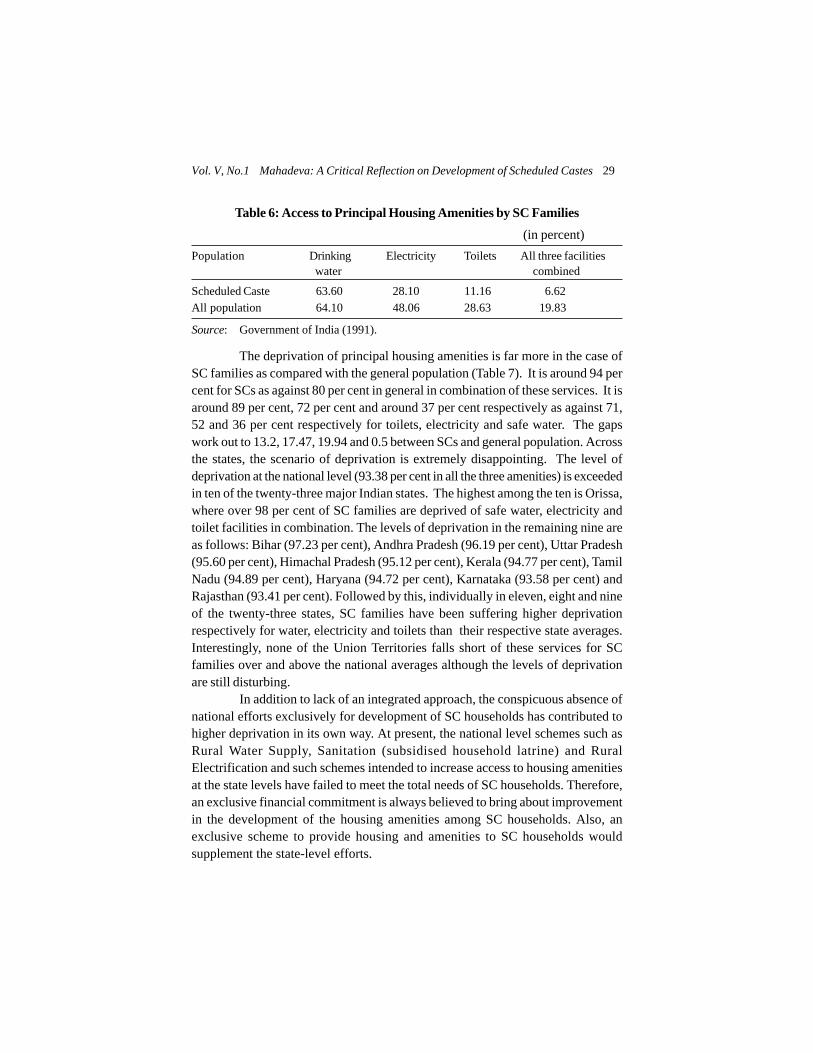
Table 6: Access to Principal Housing Amenities by SC Families (in percent)Population Drinking Electricity Toilets All three facilities
water combined
Scheduled Caste 63.60 28.10 11.16 6.62All population 64.10 48.06 28.63 19.83
Source: Government of India (1991).
The deprivation of principal housing amenities is far more in the case ofSC families as compared with the general population (Table 7). It is around 94 percent for SCs as against 80 per cent in general in combination of these services. It isaround 89 per cent, 72 per cent and around 37 per cent respectively as against 71,52 and 36 per cent respectively for toilets, electricity and safe water. The gapswork out to 13.2, 17.47, 19.94 and 0.5 between SCs and general population. Acrossthe states, the scenario of deprivation is extremely disappointing. The level ofdeprivation at the national level (93.38 per cent in all the three amenities) is exceededin ten of the twenty-three major Indian states. The highest among the ten is Orissa,where over 98 per cent of SC families are deprived of safe water, electricity andtoilet facilities in combination. The levels of deprivation in the remaining nine areas follows: Bihar (97.23 per cent), Andhra Pradesh (96.19 per cent), Uttar Pradesh(95.60 per cent), Himachal Pradesh (95.12 per cent), Kerala (94.77 per cent), TamilNadu (94.89 per cent), Haryana (94.72 per cent), Karnataka (93.58 per cent) andRajasthan (93.41 per cent). Followed by this, individually in eleven, eight and nineof the twenty-three states, SC families have been suffering higher deprivationrespectively for water, electricity and toilets than their respective state averages.Interestingly, none of the Union Territories falls short of these services for SCfamilies over and above the national averages although the levels of deprivationare still disturbing.
In addition to lack of an integrated approach, the conspicuous absence ofnational efforts exclusively for development of SC households has contributed tohigher deprivation in its own way. At present, the national level schemes such asRural Water Supply, Sanitation (subsidised household latrine) and RuralElectrification and such schemes intended to increase access to housing amenitiesat the state levels have failed to meet the total needs of SC households. Therefore,an exclusive financial commitment is always believed to bring about improvementin the development of the housing amenities among SC households. Also, anexclusive scheme to provide housing and amenities to SC households wouldsupplement the state-level efforts.
Vol. V, No.1 Mahadeva: A Critical Reflection on Development of Scheduled Castes 29

Table 7: Percentage Deprivation of Principal Housing Amenities among SC Families
State/UT Safe Drinking Electricity Toilets All the Three Water Facilities
SCs Others SCs Others SCs Others SCs Others
Andhra Pradesh 42.44 45.04 75.83 46.51 93.34 78.00 96.19 85.16Arunachal Pradesh 30.31 32.55 50.42 47.90 48.88 46.71 65.09 61.93Assam 54.65 52.33 83.62 79.13 66.05 58.12 92.54 89.39Bihar 44.60 37.56 92.56 85.57 95.01 85.84 97.23 91.34Goa 56.01 56.60 27.04 15.02 79.13 58.88 88.67 78.26Gujarat 26.26 25.45 34.68 27.68 76.86 63.61 80.84 68.09Haryana 27.67 25.18 49.24 24.67 92.71 73.70 94.70 75.60Himachal Pradesh 27.07 20.80 18.68 10.10 94.04 85.75 95.12 85.87Karnataka 21.37 29.79 66.44 42.99 90.76 72.37 93.58 79.71Kerala 76.50 81.51 76.26 48.72 70.67 46.10 94.77 90.57Maharashtra 30.47 29.49 41.32 26.49 83.19 66.07 86.20 70.12Manipur 72.54 65.61 49.19 38.24 59.57 43.61 87.70 80.03Meghalaya 51.31 40.73 53.01 38.37 53.21 33.83 77.06 57.27Mizoram 78.41 79.05 26.91 17.07 18.75 17.64 81.12 83.55Nagaland 00.00 49.82 00.00 43.13 00.00 30.85 00.00 71.53Orissa 57.31 60.25 85.86 66.39 96.18 84.78 98.14 91.53Punjab 9.86 6.22 31.89 12.03 83.96 59.99 86.30 62.79Rajasthan 40.95 39.13 76.77 56.72 89.38 74.61 93.41 78.95Sikkim 33.19 26.11 51.14 40.26 73.18 64.39 78.66 70.49Tamilnadu 29.15 33.19 69.09 38.69 90.16 76.24 94.89 81.56Tripura 59.96 52.37 66.30 50.82 24.74 16.18 83.23 70.43Uttar Pradesh 44.85 35.39 88.61 74.61 93.13 78.23 95.60 84.51West Bengal 19.81 15.02 81.25 59.77 83.39 60.64 92.24 73.06A&N Island 00.00 28.31 00.00 35.15 00.00 61.18 00.00 68.37Chandigarh 2.57 2.21 40.53 12.41 52.12 24.87 55.65 26.98D&N Haveli 28.59 27.04 18.17 16.80 70.77 51.93 75.51 57.05Daman & Diu 17.14 28.43 2.97 4.16 86.10 69.91 88.80 74.63Delhi 6.17 3.70 35.55 16.56 68.85 28.15 73.01 33.63Lakshadweep 00.00 95.24 00.00 1.78 00.00 5.45 00.00 96.53Pondicherry 11.71 11.14 54.89 32.17 86.90 60.11 90.97 66.61
All India 36.40 35.90 71.90 51.94 88.84 71.37 93.38 80.17
Source: Ibid
30 Journal of Social and Economic Development Jan. - June 2003

Discussion and Conclusions
Scheduled Castes have undergone suppression over centuries and havealways been the target of atrocities owing to their disabilities. The sufferings ofSCs are entirely different in terms of volume. It is simply unfair to compare thesufferings of SCs with those of others. Ordinary SCs (assetless, young girls andother weak) have to adjust their lifestyle and livelihood according to the whims andfancies of landlords in rural areas, whereas the other segment of SCs is strugglingto earn a moderate and dignified living. Unfortunately, this has turned out to be adistant goal even after over five decades of development planning and constant butincommensurate interventions. While these are only a few instances of the attitudesof the ‘civilised society’ towards SCs, the government, as protector of the oppressedsection, has failed to give due recognition to the cause. Subsidiary attentions arereflected in the public interventions targeted at SCs over the years. First of all, thestrategies and programmes designed for socio-economic advancement of SCs areby and large ad hoc and have only supplemented the fringe development instead ofcontributing to total transformation. This is because the strategies, volume ofassistance (monetary and kind) and contents targeting SCs have not been dissimilarto that of the programmes of other target groups. Unfortunately, the SpecialComponent Plan, meant only for SCs, also emphasises creation of such assets,which are impermanent in nature and have hardly helped these families to cross thepoverty line. Also, these assets have been prone to either loss or disposal. Therefore,a comprehensive and self-sustainable intervention is the need of the hour to createa strong but onetime asset base for the landless and vulnerable SC families. Also,there needs to be a separate public action exclusively for the human developmentof SCs to make them development seekers instead of dole seekers. Second, thekind of education the younger generation of SCs is acquiring is cause for concern.It has largely failed to give them the needed upward mobility together with anindependent livelihood. In other words, except for creating a band of unemployededucated, educational initiatives have hardly achieved anything worthwhile overthe years. This is because the educational skill that these sections acquire has hardlyany relevance to the present context. Unfortunately, the educational backgroundthat was sufficient to fetch them a livelihood up to the early 80s is being pursuedlargely by SCs even in the changing circumstances. This is partly on account oflack of campaigning for a relevant education system designed to provide economicstability with secure employment and independent livelihood with regular income.Another lacuna in the public educational intervention is the scant attention givento skill development among SCs. This could have increased their employability notonly in the public sector but also in the private sector besides giving rise to self-employment. It is disappointing that skill development efforts have seriousweaknesses like limited perceptions and coverage, administrative snags, etc.
Vol. V, No.1 Mahadeva: A Critical Reflection on Development of Scheduled Castes 31

Notwithstanding the felt need for skill development, the focus has been on a veryrestricted range of economic activities such as handicrafts, carpentry and others.These limited approaches have obviously generated employment for only a fewand have marginally supplemented the family income. As a result, the majority ofpotential workforce (like cultivators, agricultural labourers, semi-skilled artisans,etc) have been left uncovered. Further, the most important lacuna is with regard tofinancial and institutional infrastructure for skill development of SCs. Owing to theskewed distribution of provisioning of financial resources and missing priorities,only limited resources have been earmarked for skill development and job orientationpurposes. It is also for obvious reasons of overemphasis on basic educationpromotion. This apart, the limited number of training institutions and their urbanlocations have also contributed to the disappointing scenario. These institutionsare catering only to those who have access to information in urban areas and haveignored the needs of a huge segment in rural areas. In this regard, the much expectedrole of development initiatives of the corporation and their rural spread have beenbelied owing to their urban concentration.
The rising poverty among SCs over the years is a clear reflection on theinadequacy of public interventions. Three reasons can be cited for the failures:lower participation of the poorest of the poor, failure to create a strong and sustainableasset base for employment generation, and lack of adequate income generation inthe hands of these families. This is evident from a number of empirical studies. Forexample, the participation of SCs in Integrated Rural Development Programme(IRDP), a major anti-poverty initiative, was only 53 out of the 1,000 households,which works out to a little over 5 per cent. Similarly, in other public works, SCparticipation was 4 per cent. Participation of SCs both in IRDP and public workswas even worse, working out to 3.3 per cent in 1,000 households (Central StatisticalOrganisation 1998). Similarly, the kind of assets given under these initiatives werenot only impermanent but have also failed to last long. Milch animals, draughtanimals and sheep/goats, being the major component of assistance, would haveeither died for want of proper care or failed to generate the needed income andemployment. Though the official reports (GOI 1997) claimed to have generated 11man days of employment in 30 days under Jawahar Rozgar Yojana, the empiricalstudy (Mahadeva 2003)6 indicates only 8 man days in rural areas. If this is thescenario of SCs’ participation and employment generation under anti-povertyprogrammes, the impact on income should be anything less than one-third of thepoverty level income under the then minimum wages framework.
If the social development approach was to bring about quality in livingstandards among SCs, an integrated approach should have been evolved. Anintegrated approach advocates development of housing and housing amenities(drinking water, electricity and toilets) simultaneously. But this did not happen both
32 Journal of Social and Economic Development Jan. - June 2003

under the schemes aimed at housing and amenities to the poorer sections in generaland in those meant exclusively for SCs (also STs) to provide these benefits inparticular. Instead, construction of houses and provision of these services havebeen undertaken on a compartmentalised basis at different points of time owing toseparate action plans and eventually for financial allocation. At this juncture, it isimportant to note that despite growing concern to integrate housing developmentwith related services (safe drinking water, sanitation and electricity) the practice isyet to get established in the rural context, especially in the public-financed socialhousing schemes.7 If the costs of these services are not built into the cost ofhousing, not only would the goal of quality in living standards suffer but also suchdevelopment (housing without amenities) would be termed mal-development ashas been the experience of SCs over the last five decades.
Before discussing alternative strategies, it is necessary to throw light onthe database on Scheduled Castes, its nature and limitations. The existing databaseon Scheduled Castes is scant and has many limitations. Census, national surveys(NSS, CSO etc), reports of various expert groups, annual reports of ministries atthe national level and departments at the state level and field-based empirical studiesare the main sources of data for research on Scheduled Castes. Unfortunately, allthese sources have limitations. Census being an important source of data on SCs,the information is usually made available only once in a decade and often itsdissemination takes even longer. For example, Agricultural Census (1991) andHousing and Amenities (1991) with information on social groups were released inearly 1998 and at the end of 1994 respectively. As a result, researchers have got touse these sources as long as the next series of data are made available, which probablytakes another ten years or even more. The absence of estimation in between bythese sources is another lacuna. Often the information provided by the ministriesand departments pertaining to SCs/STs is not comprehensive and complete.Moreover, only a few ministries and departments have been able to present dataand a large number of them have failed to disseminate such information presumablyowing to apprehensions of not having met their Constitutional obligations. Similarly,in sample surveys, the information provided is mostly in percentage terms andoften researchers do not get absolute figures pertaining to all parameters of SCs.Further, the position of expert group reports (constituted by public authorities atnational and state levels) is not different from that of the other sources as theirinvestigations/ probes are generally purpose specific. These reports are also notcomplete. For example, in the BPL estimates of SC families of 1993–94, informationis not available for 9 of the 25 states and for all union territories. If this is theconcern of public authorities, it is less said the better in the case of field-based orempirical studies. First, even to date the subject matter of research on SCs haslargely attracted scholars from within the castes rather than outsiders. However,
Vol. V, No.1 Mahadeva: A Critical Reflection on Development of Scheduled Castes 33
with a few exceptions these studies are often region and purpose specific. In factone hardly finds any serious attempt by researchers to document the SCs’deprivations, development scale across all states and union territories for differentpoints of time. The possibility of lack of a good database on SCs cannot be ruledout for such apathy. Therefore, considering the fact that Scheduled Castes are aprominent target group for all public policy making, a well-defined and well-structureddatabase is the need of the hour to promote proper understanding and pursuanceof all aspects of SCs both by the inside and outside researchers.
From the above analogy, it is clear that the SC population suffers fromlarge-scale poverty and deprivation. The state-sponsored development interventionover the years has hardly contributed to containing poverty and deprivation.Unfortunately, the public action initiated in the economy since the late 80s hasaggravated the sufferings of SCs and has turned out to be a stumbling block. In thelight of these realities, further deterioration should be immediately checked.Especially in the changing economic circumstances, the state should reengineer itsapproaches to the welfare of SCs to accelerate the pace of bringing them into themainstream of society. Also, to rebuild the lost hopes, the state needs to revitaliseits initiatives towards these sections through purpose-oriented and need-basedstrategies. Therefore, a comprehensive development plan for SCs with consolidatedefforts of the state is necessary to cater to the needs of different segments.
The proposed plan should emphasize creation of permanent assets for thefamilies of the landless, which is a major segment of the SC population. Togetherwith permanently income yielding assets, family-based economic activities alsoneed to be promoted to generate employment for these families. Marginal and smallfarmers, being the second largest segments, need to be supported with agriculturalinputs such as modern equipment, small and mini-irrigation facilities and subsidisedfertilisers, certified seeds, regular exposure to modern methods of cultivation andtechnological advancements, etc along with off-season employment in family-basedindustries. Such incentives would encourage these families to grow more to earntheir livelihood and increase avenues for employment during non-agriculturalseasons. To contain the growing incidence of educated unemployment, skilldevelopment, and training to increase employability are the need of the hour. Inaddition, assistance for self-employment on a large scale should be provided tomake them self-reliant. Finally, the young segment of the SC population needs tobe carefully nurtured in order to be equipped to face the new challenges. Thissegment should be provided with not just basic education but a scientific andtechnological orientation. To bring about the needed change in this section of thepopulation, they should be developed in residential schools with round-the-clockcare by trained manpower. Residential schools not only provide a conduciveeducational environment but also help children to excel in their pursuit, whichgenerally SC wards are deprived of in their home environment.
34 Journal of Social and Economic Development Jan. - June 2003
The Comprehensive Development Plan (CDP) for SCs has been proposedto put an end to the ongoing piecemeal assistance under various anti-povertyprogrammes and special component plan. In other words, the resources earmarkedfor SCs under various anti-poverty programmes and SCP need to be pooled withthe proposed CDP. This approach has many advantages. It encourages single windowto evolve and execute development measures for SCs. It eliminates overlapping,which is widespread across various schemes. It also brings about efficiency inadministration of welfare. CDP and its execution do not of themselves bring aboutthe needed change in the life of SCs. Monitoring and supervision have a role toplay. As has happened over the decades, the assets given, economic activitiespromoted, and assistance given for the welfare of SCs should not be left unmonitored.Instead, the CDP should have an in-built mechanism to avoid loss/ disposal ofassets with proper monitoring. Committed voluntary action needs to be formedwithin this section to educate beneficiaries and to bridge the gap between servicingauthorities and target groups. Similarly, skill-oriented training and residentialschools’ pursuits should be closely monitored. Though these suggestions appear tobe like prescriptions they are immensely necessary to judiciously reap the benefitsof public investment and to bring about improvement among SCs within a definitetime-frame.
Similar to CDP for economic improvement, an integrated approach is thesolution to the current social deprivations among SCs. Efforts are necessary toprovide housing benefit along with safe drinking water, electricity and toilet facilities.Towards this goal what is needed is an integrated plan with coordination betweenagencies. Therefore, the total cost of housing under various public-sponsoredschemes has to be revised including the costs of the housing amenities. The greatestadvantage of the approach is that housing and related amenities can be developedsimultaneously and also yield cost efficiency. Besides, the approach can minimisethe disparity that exists between rural and urban areas in the development of housingand amenities. Financial assistance (loan-cum- subsidy) would go a long way inthis regard.
A comprehensive development plan and integrated approach are thepractical and realistic interventions for securing the economic and social securityof SC families given the present order of deprivation. Especially in the presenteconomic climate these interventions would go a long way as they intend to empowereconomically all segments and bring this section of the population into themainstream in the years to come. However, bringing SCs into the mainstreamdepends largely on ‘political will and honesty and realistic financial commitmenton the part of the governments’. Under the new economic order, political will andhonesty refers to the total commitment needed to implement all the provisions inthe Indian Constitution in their true spirit for bringing about honour, social, economic
Vol. V, No.1 Mahadeva: A Critical Reflection on Development of Scheduled Castes 35

and political justice for SCs. Educational attainment emphasising technical and skillorientation would help SC youths to obtain employment in the market besidessetting up their own ventures. Regular exposure to SC farmers for modern methodsof cultivation and technological know-how along with subsidised inputs wouldpave the way for increasing agricultural production beyond the subsistence level.Finally, large-scale financial assistance with skill development is seen as analternative method of arresting growing educated unemployment among SCs.Importantly, while implementing these provisions and public action, the governmentneeds to see SCs as a core group among the poverty-stricken population withoutproper access to production agents such as land, capital, entrepreneurial skills, etc.It should also ensure that SCs are not seen as a target group for antidotes of povertyand as a segment for political gain. In other words, subsidiary attention and improperattitudes towards SCs would only mean ineffective interventions, thereby increasingtheir misery as in the last five decades. This reflects the need for meaningful andadequate intervention for accelerated upward mobility of this section.
A final issue is public allocation and financial facilitation for the cause ofSCs. Considering the high scale of deprivation and the future challenges to bringabout equitable development, not only does public allocation need to be hiked butalso a new stream of financial commitment needs to be initiated. The current publicfinancial commitments of government are very meagre and unrealistic in relationto the present order of social and economic needs of SCs. Therefore, it is importantto increase public allocations to arrest the current economic and social deprivationsand to meet the fresh challenges ahead. Further, in order to increase the pace ofupward mobility of SCs and bring them into the mainstream, a definite financialearmarking needs to be worked out for all the Public Sector Banks (PSBs) andPublic Financial Institutions (PFIs). It cannot be denied that these institutions havehardly fulfilled their social responsibility of meeting the financial needs of SCs.PSBs/PFIs can be instrumental in meeting the financial needs of the SC students oftechnical/ professional education in the light of the growing incidence of dropoutsowing to financial difficulties. Also, educated-unemployed SCs could be a targetfor financial services. PSBs/PFIs and other financial institutions need to be givenfiscal incentives for the cause of development equity and bringing about social andeconomic justice.
Notes
1. Educational advancement, improvement of economic and living conditions have been thefocal strategies of public interventions ever since the beginning of development planning.The underlying philosophy has been to educationally empower the SCs to increaseaccess to economic opportunities and thereby to improve their quality of living. Second,it is to support SC families with agricultural inputs so as to promote and sustain their
36 Journal of Social and Economic Development Jan. - June 2003

economic activities. Finally, the aim has been to bring about improvement in quality oflife by meeting the basic needs. These three long-term goals are sought to be achievedthrough joint financial commitment and action between the central and state governments.Post-matriculation scholarships, students hostels, special coaching, etc, have been providedto achieve educational advancement. State governments provide assistance to purchaseagricultural implements, bullocks, carts, fertilisers and effect land improvement. Throughconstruction of residential houses, supply of safe drinking water, electricity etc., socialdevelopment is aimed at, with central and state government assistance. As an additionalstrategy, training for skill development for SC youths to make them self-employable andimprove their employability has also been pursued. Financial assistance in the form ofloans and subsidies to set up tiny service centres was also intended to be provided (see,Sankaran 2000). Although these approaches were followed up to the end of the Fifth FiveYear Plan (1974–79), to further strengthen and accelerate the socio-economic process aSpecial Component Plan (SCP) (Mohanty 2000) was introduced during the Sixth Plan(1981–85) to finance exclusively the beneficiary-oriented projects. Self-employment (inindustrial, service and business sectors) and family-oriented projects (land purchases,individual and community irrigation) are being financed under the scheme. To implementand monitor the scheme, development corporations at the state level have been created.The scheme has been supported with Special Central Assistance (SCA) in addition toregular budgetary allocations for filling up the critical gaps in achieving the objectives ofthe scheme (Planning Commission 1997–2002). In addition to these specific interventions,it is mandatory that all anti-poverty programmes adequately represent SCs in beneficiarycoverage. About one-third of the beneficiaries need to be SCs for generation of employment,creation of income-generating assets (IRDP-JRY, EAS, etc) and skill development(vocational and apprenticeship) training programmes from the late 80s.
Since the outcome of these initiatives was not encouraging vis-à-vis the total needs of theSCs and to minimize further marginalisation of these sections, it was decided to adopt athree-pronged strategy during the Ninth Five Year Plan (1997–2002). Social and economicempowerment and social justice were reassured for SCs to bring about all-rounddevelopment. A Special Plan of Action (1998) was initiated to fill the critical gaps inproviding basic minimum services to those living below the poverty line (PlanningCommission, p. 2.222).
The measures proposed as part of the strategy included improving the educationalstatus, universalisation of primary education by 2005, reaching the unreached areas, freeeducational inputs, vocationalisation, encouraging higher technical / professional education,promoting education among children of unclean occupations, complete eradication ofuntouchability and manual scavenging, and a special health package to combat endemicdiseases. The economic components included a special thrust on employment andincome generation activities, strengthening of national and state-level finance anddevelopment corporations to play a catalytic role, motivating private and corporate
Vol. V, No.1 Mahadeva: A Critical Reflection on Development of Scheduled Castes 37

sectors to invest on SCs, ensuring minimum size of landholding and preserving landownership, promotion of small and lift irrigation, and prioritising the group for financialsupport. Finally, strict implementation of reservation policy, curbing social discrimination,untouchability, exploitation, atrocities through effective implementation of Indian PenalCode, Protection of Civil Rights and SCs/STs (Prevention of Atrocities) Act, setting upof special and mobile courts, compensating adequately the victims of social injustice,developing community-based defence, changing attitude and mind-sets, sensitising allworking for the well-being of SCs, and making the National Commission to enforce therights and interests of these sections to bring about social justice.
2. For more details on employment erosion under public works, see Government of India(1997).
3. Owing to paucity of systematic data it has not been possible to present a quantitativeanalysis of educated unemployment among SCs at the macro level. However, there isevidence that unemployment among educated SC persons has increased markedly as perthe information available for the period 1992 to 1998 from the live Register of Employmentexchange in Karnataka.
4. The information pertains to 11 and 39 public sector undertakings respectively under theMinistries of Chemicals and Fertilizers and Finance of the Union Government of India.Similar information with regard to PSUs of other ministries was not made available in theofficial website: www://Indiastats.com. There has been a dearth of consolidated informationfor SCs’ representation in services at the state level.
5. Absolute houselessness is one of the three components employed to estimate totalhousing shortage, evolved by the National Buildings Organization (NBO). The other twocomponents are pavement dwelling and families/households living in sub-standard or life-threatening houses. Owing to non-availability of data on the extent of SC families livingon pavements and in sub-standard houses it has not been possible to analyze the dimensionof the problem. In fact these forms of dwelling are high among SC families facing higherincidence of poverty and some of them are nomadic for employment purposes.
6. For a detailed discussion on failures of employment generation see, Mahadeva (2003aand b).
7. For example, Indira Awaas Yojana, a centrally sponsored housing scheme exclusively forfamilies of SCs/STs freed from bonded labour. Also, there are a number of similarschemes at the state level meant for these sections.
References
Central Statistical Organisation (1998). Sarvekshana, XXl(4), April–June.Government of India (1991). Census of India 1991. ‘Housing Amenities.’ Registrar General
and Census Commissioner. ———(1994). Annual Report. New Delhi: Department of Administrative Reforms & Public
Grievances.
38 Journal of Social and Economic Development Jan. - June 2003

———(1997). Concurrent Evaluation of Jawahar Yojana. New Delhi: Ministry of RuralAreas and Employment.
——— (1998). All India Report on Agricultural Census 1990-91. New Delhi: Ministry ofAgriculture and Cooperation.
———(2002a). Annual Report 2001–2002. New Delhi: Ministries of Chemicals & Fertilisersand Commerce & Industries.
———(2002b). Annual Report 2001–2002. New Delhi: Ministry of Finance.Mahadeva, M. (2003a). Jawahar Rozgar Yojana: Limited Successes and Far From Realities.
Indian Journal of Labor Economics, (Forthcoming).——— (2003b). Community Assets and Employment Generation under JRY in Karnataka:
A Dolorous Performance. In Vatsala Srivastava, (ed.). Social and EconomicDimensions of Indian Population. Serials Publication, 2003.
Mohanty, P.K. (2000). Development of Scheduled Castes and Scheduled Tribes in IndependentIndia: Leads and Lags. Journal of Rural Development, 19(4), October–December.
Pai, Sudha (2000). Changing Socio-Economic and Political Profile of Scheduled Castes inUttar Pradesh. JISPE, Xll (3&4), July–December, pp. 405–22.
Planning Commission (1994). Report of the Expert Group on Estimation of Poverty 1993–94, Government of India.
——— (2002). Ninth Five-Year Plan, Vol. II, Chapter 3, pp. 2.217–2.236.Sankaran, S.R. (2000). Welfare of Scheduled Castes and Scheduled Tribes in Independent
India—An Overview of State Policies and Programmes. Journal of RuralDevelopment, 19(4), October–December.
Shah, Ghanshyam (2000). Hope and Despair: A Study of Untouchability and Atrocities inGujarat. Journal of Indian School of Political Economy, Xll(3&4), July–December,pp. 4-59-72.
Thorat, Sukhadeo (2000). Programmes for Empowerment and Reducing Inequality: LongWay To Go for Untouchables. Journal of Rural Development, 19(4), October –December, pp. 653–89.
United Nations Centre for Human Settlements (Habitat) (1996). An Urbanizing World. OxfordUniversity Press.
Vol. V, No.1 Mahadeva: A Critical Reflection on Development of Scheduled Castes 39
Received: January 1, 2003 Accepted: July 17, 2003

Investment in Power Sector: Past Trend andShort-Term ProspectT.R. Satish Chandran*
Abstract
Investment in the power sector from the 50s to the 80s of the lastcentury was almost wholly in the public sector. Power sector reform,which began in 1991, opened the doors to private investment but theresponse has been poor. Public sector investment in power as a part ofPlan outlay has declined in the Eighth and Ninth Plan periods, especiallyin the States. The progress of Distribution reform at the State level,which is crucial for attracting private investment, has been halting anduneven. The interim solution is to step up public investment; this hasbeen factored into the Tenth Plan. For maximum result, public sectorinvestment in power projects should be leveraged through joint ventureswith private investors. There is urgent need for political commitment atboth Central and State levels to a time-bound reform agenda.
Introduction
Power shortages have become endemic in most parts of the country andhave had a crippling effect on the economy. At the end of the Ninth Plan (March31, 2002), energy and peak shortages were assessed to be 7.5 per cent and 12.6 percent for the country as a whole1. There is general agreement that inadequacy ofpower supply has resulted in a significant loss of the country’s Gross DomesticProduct (GDP). Analysis of energy consumption data over the last few decadesshows that whereas energy – GDP elasticity (including traditional fuels) has declined,electricity-GDP elasticity is still the highest among different forms of energy,indicating that electricity is a vital input into the different sectors of the economy.Not only does electricity demand show a high growth rate but the electricity industryalso happens to be highly capital intensive. Therefore, mobilisation of investmentfunds on the scale required to eliminate shortages and to sustain an acceleratedgrowth of the economy poses a serious challenge in a capital-scarce country like* Chairman, Board of Governors, ISEC, Nagarabhavi, Bangalore - 560 072.This is a slightly revised version of the paper, ‘Investment Policy and Financing of PowerSector’ presented at the Brainstorming Workshop on Power Sector Reforms held at IndianInstitute of Management, Bangalore, on April 11-12, 2003.The helpful comments of the anonymous referee are gratefully acknowledged.The assistance of Dr. K. Gayithri, Institute for Social and Economic Change, in preparingTable 1 is gratefully acknowledged.
India. According to the Blueprint for Power Sector Development prepared byMinistry of Power, the country requires an addition of over 1,00,000 MW ofgenerating capacity and associated transmission and distribution (T & D)infrastructure. Over the current and the next plan periods, this breaks up roughlyinto 40,000 MW during the Tenth Plan (2002–07) and 60,000 MW during theEleventh Plan (2007–12). This entails an investment of about Rs.8, 00,000 croresover ten years, which means a threefold increase in the next five years and a fivefoldincrease in the following five years over the current level of public sector investment.Resource mobilisation of this order by the public sector is clearly not feasible andthere is an urgent need to channel private investment into this sector. Given thelimited size of domestic financial markets, this means also that we need to tap intointernational capital markets and attract foreign direct investment (FDI) in order tobuild up requisite capacity in the power sector.
The compulsions of non-availability of investment funds for the powersector apart, there has been a radical change of the country’s economic policy since1991. As is happening in many countries around the world, the power sector inIndia is being restructured so as to dismantle public monopolies, allow a greaterrole for the private sector and permit market forces to operate in all segments of thepower industry. This, it is believed, will result in improved technical and operationalefficiency of power systems and provide better service to consumers at an economiccost. Thus, as a part of the new economic policy, power sector reforms were initiatedin 1991, starting with the generation segment. Since then, there have been statutechanges and policy pronouncements to deepen the sectoral reforms by opening upavenues for private sector participation in T and D also. Broadly, the approach sofar has been to permit entry of multiple players including private entities into thegeneration segment of power systems, a component which is clearly amenable tocompetition. Operation of the transmission system will remain with a public sectorentity; the law has however been amended to permit private ownership oftransmission lines. As regards distribution, after unbundling the power system, thegeneral approach is to divide the State into different distribution areas in each ofwhich there will be a distribution company. The ultimate objective is to inductprivate entities through a competitive bidding process to take over the distributionfunction in each area. A long-term objective is to separate ‘wire’ and ‘energy’business in both T and D and allow electricity to be traded like any other commodity,with freedom of choice of the supplier by the consumer and vice versa.
As mentioned earlier, an important element of power sector reform is toattract private capital especially from abroad to boost investment in the Indianpower sector. With this end in view, Government of India has offered a variety ofincentives and concessions. Foreign investment in equity is permitted up to 100per cent, tax exemption is allowed for five years followed by 30 per cent tax
Vol. V, No.1 Chandran: Investment in Power Sector 41
concession for the following five years, foreign investment is protected by exchangerate guarantee, etc. What is more, a return of 16 per cent on equity at a performancelevel of 68.5 per cent PLF is guaranteed (with incentive for better performance)and ‘take or pay’ clause is included in the power purchase agreement. Consideringthat the package offered by India was more attractive than that of many otherdeveloping countries, the expectation was that the power sector would attract amassive inflow of foreign capital. Though the initial response from the industrialisedworld was encouraging, the results on the ground have been disappointing.
Public finances at both central and state levels are in poor shape and publicsector investment on power has not been rising rapidly. This, coupled with the lowscale of private sector funding, has resulted in a widening gap between demand forand availability of power. The attempt in this paper is to explore measures that canbe taken in the short run (three to five years) to overcome the present impasse andraise the level of both public and private investment in the power sector so as tomove towards an adequate, competitive and efficient power industry in the country.In the next section, we examine the past pattern of investment in the pre- reformand post-reform periods. This is followed by a section that looks at initiatives takenby the Government of India in the last few years to give an impetus to investment asa part of the effort to push forward implementation of sectoral reforms. Possiblelines of future action are examined in the last section.
Past Pattern of Investment in the Power Sector
Before charting the future course of action, it will be useful to look at howthe power sector has been funded so far. This will help us to identify problem areasthat need to be addressed. The past record of investment can be broken into twoparts — the pre-reform period and the post-reform period.
Pre-Reform Period 1961–90Table 1 shows the plan outlay on the power sector during the three decades
preceding the launch of the new economic policy in 1991, while Table 2 shows thecomposition of installed capacity at the end of the Seventh Plan, i.e., on the eve ofthe launch of reforms.
It may be recalled that soon after the country attained independence,Parliament enacted the Electricity (Supply) Act in 1948. This brought the entirepower industry in the country into the fold of the public sector, establishing theSEB as a vertically integrated utility in each State and setting up the CentralElectricity Authority (CEA) as the apex technical body to oversee the power industryat the national level. However, development of the power sector was almost whollythe responsibility of the state governments until the 1970s. The only centralintervention earlier had been the setting up of the multi-purpose Damodar ValleyCorporation in 1948 in exercise of the Centre’s constitutional role in the development
42 Journal of Social and Economic Development Jan. - June 2003

Table 1: Plan Outlay on Power Sector (1961–90)
Plan Centre States and UTs Total Outlay Percentage of Outlay Percentage of Outlay Percentage of(Rs. Cr) Plan Outlay (Rs. Cr) Plan Outlay (Rs. Cr) Plan Outlay
Third Plan(1961-66) 109 3.0 903 23.1 1012 13.5Fourth Plan(1969-74) 447 5.0 2001 28.5 2448 15.4Fifth Plan(1974-79) 825 4.1 6469 33.4 7294 18.6Sixth Plan(1980-85) 4725 10.0 14540 28.9 19265 19.8Seventh Plan(1985-90) 11051 11.6 23222 27.5 34272 19.0
Source: Planning Commission – respective plan documents
Table 2: Composition of Installed Capacity at the End of Seventh Plan
Sector End of Sixth Plan (31.3.1985) End of Seventh Plan (31.3.1990)
Capacity (MW) Percentage Capacity (MW) Percentage
Centre 6,758 15.9 16,285 25.6States & UTs 33,642 79.0 44,709 70.2Private 2,185 5.1 2,642 5.4All India 42,585 100.0 63,636 100.0
Source: Planning Commission, Report of Working Group on Power for Ninth Plan, Table1.5
of inter-state river valleys. For the first time in the 1970s, the Government of Indiadecided to play a positive role in augmenting power generation in the country andestablished the National Thermal Power Corporation (NTPC) and NationalHydroelectric Power Corporation (NHPC) in 1975. The idea was to set up largepithead thermal power stations and optimally located large hydropower stations,the benefits of which would be shared by the states in the region.
As seen from Table 1, central investment in power started rising from the1980s. But the state governments accounted for the major share of outlay on thissector and the allocation to this sector under the State plans was the highest amongall the sectors of development. Only a small share of generating capacity wasunder private ownership for historical reasons — in the cities of Ahmedabad,Mumbai and Kolkata. The states were the dominant players in the power industrywith a share of nearly four-fifths of aggregate capacity and near–total ownership of
Vol. V, No.1 Chandran: Investment in Power Sector 43
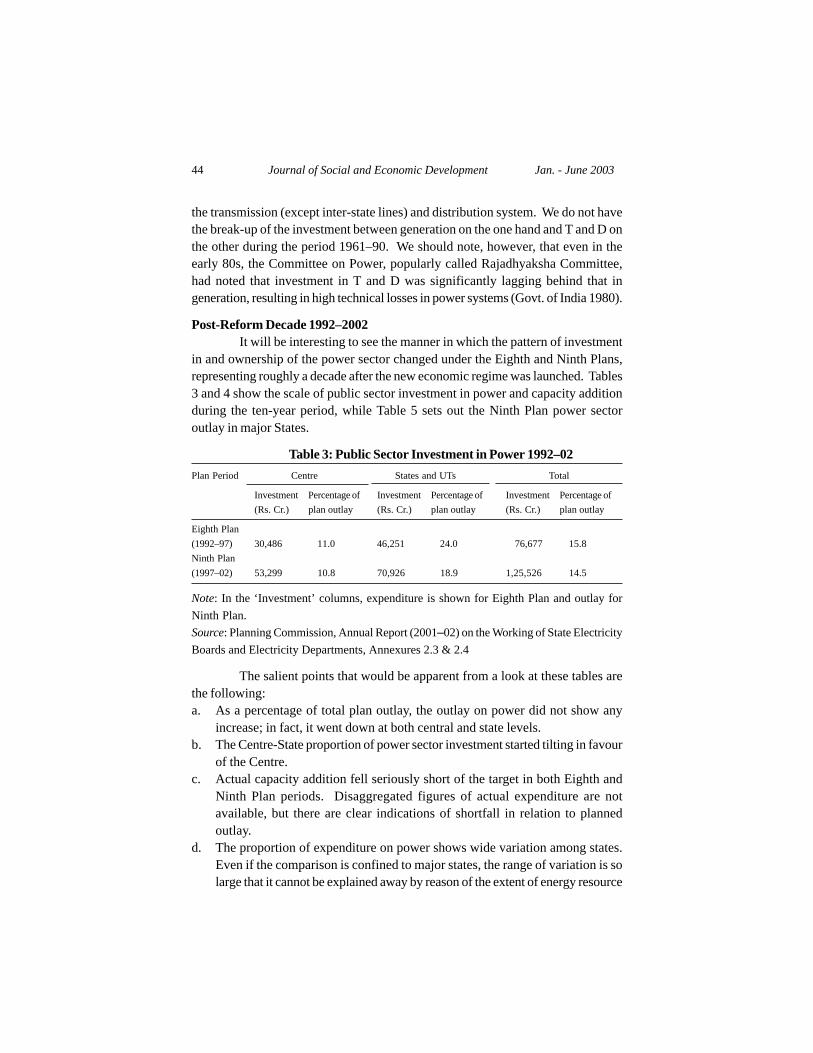
the transmission (except inter-state lines) and distribution system. We do not havethe break-up of the investment between generation on the one hand and T and D onthe other during the period 1961–90. We should note, however, that even in theearly 80s, the Committee on Power, popularly called Rajadhyaksha Committee,had noted that investment in T and D was significantly lagging behind that ingeneration, resulting in high technical losses in power systems (Govt. of India 1980).
Post-Reform Decade 1992–2002It will be interesting to see the manner in which the pattern of investment
in and ownership of the power sector changed under the Eighth and Ninth Plans,representing roughly a decade after the new economic regime was launched. Tables3 and 4 show the scale of public sector investment in power and capacity additionduring the ten-year period, while Table 5 sets out the Ninth Plan power sectoroutlay in major States.
Table 3: Public Sector Investment in Power 1992–02Plan Period Centre States and UTs Total
Investment Percentage of Investment Percentage of Investment Percentage of(Rs. Cr.) plan outlay (Rs. Cr.) plan outlay (Rs. Cr.) plan outlay
Eighth Plan(1992–97) 30,486 11.0 46,251 24.0 76,677 15.8Ninth Plan(1997–02) 53,299 10.8 70,926 18.9 1,25,526 14.5
Note: In the ‘Investment’ columns, expenditure is shown for Eighth Plan and outlay forNinth Plan.Source: Planning Commission, Annual Report (2001–02) on the Working of State ElectricityBoards and Electricity Departments, Annexures 2.3 & 2.4
The salient points that would be apparent from a look at these tables arethe following:a. As a percentage of total plan outlay, the outlay on power did not show any
increase; in fact, it went down at both central and state levels.b. The Centre-State proportion of power sector investment started tilting in favour
of the Centre.c. Actual capacity addition fell seriously short of the target in both Eighth and
Ninth Plan periods. Disaggregated figures of actual expenditure are notavailable, but there are clear indications of shortfall in relation to plannedoutlay.
d. The proportion of expenditure on power shows wide variation among states.Even if the comparison is confined to major states, the range of variation is solarge that it cannot be explained away by reason of the extent of energy resource
44 Journal of Social and Economic Development Jan. - June 2003

Table 4: Capacity Addition 1992–2002
Type Target (MW) Achievement (MW)
Central State Private Total Central State Private TotalSector Sector Sector Sector Sector Sector
Eighth Plan (1992–97)Hydro 3260 5860 162 9282 1465 795 168 2428Thermal 8498 9010 2646 20156 6252 6041 1262 13555Nuclear 1100 - - 1100 440 - - 440Total 12858 14870 2810 30538 8157 6835 1430 16423
Ninth Plan (1997–02)Hydro 3455 5815 550 9820 540 3912 86 4538Thermal 7574 4933 17038 29545 3084 5538 4975 13957Nuclear 880 - - 880 880 - - 880Total 11909 10748 17588 40425 4504 9450 5061 19015
Source: Planning Commission, Ninth Plan, Vol.II, Chapter 6, Table14 and Draft Tenth Plan, Vol.2, Table 8.2.2
Vol. V, No.1 C
handran: Investment in Pow
er Sector 45

Table 5: Ninth Plan Power Sector Outlays of States and UTs
State Ninth Plan
Outlay (Rs. Cr.) % of Plan Outlay
Andhra Pradesh 5749 22.8Bihar 2300 13.8Jharkand - -Gujarat 4000 14.3Haryana 2648 28.5Karnataka 3650 15.6Kerala 2531 15.7Madhya Pradesh 3464 17.2Chattisgarh - -Maharashtra 5580 15.2Orissa 4623 30.8Punjab 2927 25.4Rajasthan 4489 20.4Tamil Nadu 6000 24.0Uttar Pradesh 7468 16.1Uttaranchal - -West Bengal 5632 33.3Total-States & UTs 70926 18.9
Source: Planning Commission, Draft Tenth Plan, Vol.2, Annexure 3-C
endowments available in the respective states. Some states appear to haveconsciously accorded lower priority to investment in power.
e. Private sector performance was highly disappointing, the achievement beingnot even a third of the target.
In brief, the post-reform performance shows that far from the expectedimprovement in the country’s power situation, the sector suffered a severe setback.It is not surprising that the overall power situation in the country has deteriorated.
There is another aspect of power sector outlay, namely the break-up ofexpenditure between generation and T and D. The position during the Eighth andNinth Plan periods is shown in Table 6.
As seen from the table, the proportion of expenditure on T & D hasremained low. However, there was some improvement in the Ninth Plan. But thebacklog of investment, especially in distribution, has yet to be corrected.
The cumulative position of power generation capacity in the country atthe end of the Ninth Plan (March 31, 2002) is shown in Table 7.
46 Journal of Social and Economic Development Jan. - June 2003
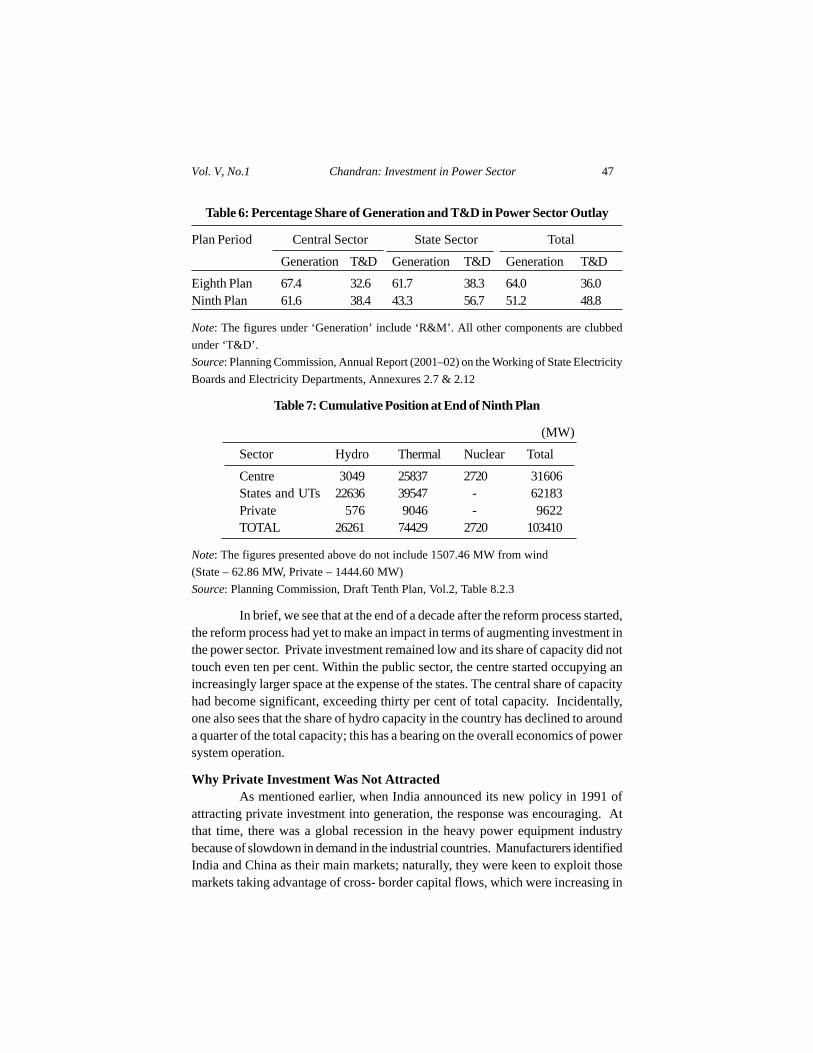
Table 6: Percentage Share of Generation and T&D in Power Sector Outlay
Plan Period Central Sector State Sector Total
Generation T&D Generation T&D Generation T&D
Eighth Plan 67.4 32.6 61.7 38.3 64.0 36.0Ninth Plan 61.6 38.4 43.3 56.7 51.2 48.8
Note: The figures under ‘Generation’ include ‘R&M’. All other components are clubbedunder ‘T&D’.Source: Planning Commission, Annual Report (2001–02) on the Working of State ElectricityBoards and Electricity Departments, Annexures 2.7 & 2.12
Table 7: Cumulative Position at End of Ninth Plan
(MW)
Sector Hydro Thermal Nuclear Total
Centre 3049 25837 2720 31606States and UTs 22636 39547 - 62183Private 576 9046 - 9622TOTAL 26261 74429 2720 103410
Note: The figures presented above do not include 1507.46 MW from wind(State – 62.86 MW, Private – 1444.60 MW)Source: Planning Commission, Draft Tenth Plan, Vol.2, Table 8.2.3
In brief, we see that at the end of a decade after the reform process started,the reform process had yet to make an impact in terms of augmenting investment inthe power sector. Private investment remained low and its share of capacity did nottouch even ten per cent. Within the public sector, the centre started occupying anincreasingly larger space at the expense of the states. The central share of capacityhad become significant, exceeding thirty per cent of total capacity. Incidentally,one also sees that the share of hydro capacity in the country has declined to arounda quarter of the total capacity; this has a bearing on the overall economics of powersystem operation.
Why Private Investment Was Not AttractedAs mentioned earlier, when India announced its new policy in 1991 of
attracting private investment into generation, the response was encouraging. Atthat time, there was a global recession in the heavy power equipment industrybecause of slowdown in demand in the industrial countries. Manufacturers identifiedIndia and China as their main markets; naturally, they were keen to exploit thosemarkets taking advantage of cross- border capital flows, which were increasing in
Vol. V, No.1 Chandran: Investment in Power Sector 47
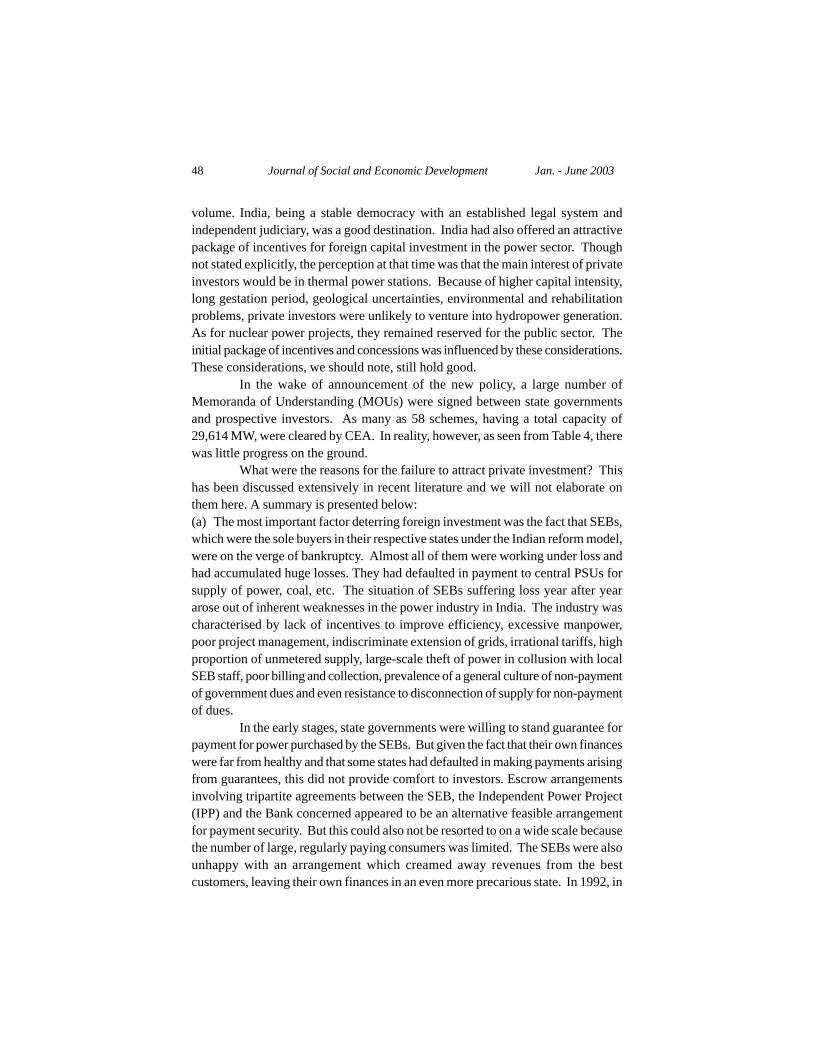
volume. India, being a stable democracy with an established legal system andindependent judiciary, was a good destination. India had also offered an attractivepackage of incentives for foreign capital investment in the power sector. Thoughnot stated explicitly, the perception at that time was that the main interest of privateinvestors would be in thermal power stations. Because of higher capital intensity,long gestation period, geological uncertainties, environmental and rehabilitationproblems, private investors were unlikely to venture into hydropower generation.As for nuclear power projects, they remained reserved for the public sector. Theinitial package of incentives and concessions was influenced by these considerations.These considerations, we should note, still hold good.
In the wake of announcement of the new policy, a large number ofMemoranda of Understanding (MOUs) were signed between state governmentsand prospective investors. As many as 58 schemes, having a total capacity of29,614 MW, were cleared by CEA. In reality, however, as seen from Table 4, therewas little progress on the ground.
What were the reasons for the failure to attract private investment? Thishas been discussed extensively in recent literature and we will not elaborate onthem here. A summary is presented below:(a) The most important factor deterring foreign investment was the fact that SEBs,which were the sole buyers in their respective states under the Indian reform model,were on the verge of bankruptcy. Almost all of them were working under loss andhad accumulated huge losses. They had defaulted in payment to central PSUs forsupply of power, coal, etc. The situation of SEBs suffering loss year after yeararose out of inherent weaknesses in the power industry in India. The industry wascharacterised by lack of incentives to improve efficiency, excessive manpower,poor project management, indiscriminate extension of grids, irrational tariffs, highproportion of unmetered supply, large-scale theft of power in collusion with localSEB staff, poor billing and collection, prevalence of a general culture of non-paymentof government dues and even resistance to disconnection of supply for non-paymentof dues.
In the early stages, state governments were willing to stand guarantee forpayment for power purchased by the SEBs. But given the fact that their own financeswere far from healthy and that some states had defaulted in making payments arisingfrom guarantees, this did not provide comfort to investors. Escrow arrangementsinvolving tripartite agreements between the SEB, the Independent Power Project(IPP) and the Bank concerned appeared to be an alternative feasible arrangementfor payment security. But this could also not be resorted to on a wide scale becausethe number of large, regularly paying consumers was limited. The SEBs were alsounhappy with an arrangement which creamed away revenues from the bestcustomers, leaving their own finances in an even more precarious state. In 1992, in
48 Journal of Social and Economic Development Jan. - June 2003

order to give a fillip to investment in power generation, Government of India offeredcounter-guarantee to a few so-called fast-track projects. While Enron ran intodifficulties for reasons that we need not go into here, none of the other projectscovered by sovereign guarantee could reach financial closure because of other factorslisted below.(b) Investors had to face formidable procedural hurdles, negotiations had to becarried out with a variety of agencies at both central and state levels and multipleclearances from national to local levels had to be obtained. Single-windowmechanisms proved ineffective. Investors discovered that the transaction costswere high.(c) In order to reach the guaranteed level of performance at which the IPP wouldearn the guaranteed return on capital, thermal power stations required assured andtimely supplies of coal. But both coal companies, which produce coal, and Railways,which transport coal to the power station sites, were unwilling to enter into legallyenforceable fuel supply agreements.(d) It was clear from the outset that regulatory mechanisms were needed to maintaina balance between the interest of the consumers and the interest of the suppliers.But there was delay in carrying out changes in the relevant statutes and the firstState Electricity Regulatory Commission (SERC) was established in Orissa in 1996.It was only in 1998 that every state was legally required to set up such a commissionand the Central Electricity Regulatory Commission came into existence. Some ofthe State Commissions are still not functional.(e) As mentioned earlier, a return of 16 per cent on equity was guaranteed subjectto a normative level of performance. Initially, the MOU route was followed fornegotiating the Power Purchase Agreement (PPA). But there was apprehension ofcost padding, and the Government of India soon changed its policy to makecompetitive bidding compulsory for all projects (except small projects).Nevertheless, the public perception has been that power supply by an IPP is costlierthan that from a similar publicly owned generating station. The problem of populardissatisfaction with IPP tariff has been faced in other countries also (e.g., Philippinesand Pakistan) and the PPAs have been reopened. This is not conducive to attractingprivate investment in the power sector.
We must recognise that the charge per unit levied by an IPP is bound to behigher than what it would have been under government ownership. The reason isthat risk allocation does not figure at all in the appraisal of public sector investmentin a new generation project; this is because all risks are absorbed by the exchequer.The private investor naturally pays meticulous attention to risk allocation, as hehas to protect his investment. Stated simplistically, commercial risks should beborne by the investor while country risks should be borne by the host countrygovernment through extension of appropriate guarantees. We have in India a
Vol. V, No.1 Chandran: Investment in Power Sector 49

situation in which the investor is unwilling to take responsibility for all commercialrisks because of the poor financial situation of SEBs. Even when the host countrygovernment offers protection against country risks, investors and internationalfinancial institutions make their own assessment of the risk status of the countryinvolved and invariably add a risk premium to the capital cost. Naturally, this isreflected in the cost of power supplied by the IPP. The difference in cost between‘public’ and ‘private’ power can be narrowed down only if we are able to offer abetter investment climate.(f) Judicial processes in India are long drawn and do not provide quick relief.(g) Confusing signals continue to emanate from both central and state governmentsin regard to the degree of their commitment to the power sector reform agenda.
So far, we have discussed factors affecting private investment in powergeneration. We will now briefly focus on the other two components of powersystems, namely, transmission and distribution. Compared with generation, powertransmission is less interesting to private investors. In the transmission business,there is a high proportion of fixed cost. The scope available to the owner of atransmission line to cut costs or maximise revenue is limited because he has nocontrol over the flow of power in his line. Even in USA and UK, there has not beenmuch investor interest in erecting transmission lines. For this reason, as at presentin India, state public sector entities will have to continue to be responsible forintra-state transmission, while inter-State transmission will have to be theresponsibility of a central public sector utility (like Power Grid Corporation ofIndia).
The private sector has to play an important role in power distribution also.As mentioned earlier, there is a sizeable backlog of investment required to reducetechnical and commercial loss and to keep pace with load growth. More importantly,improvement in operational efficiency and quality of service, proper billing andcollection and greater responsiveness to consumer needs will be the principal gainsfrom private ownership and management of distribution networks. The extent towhich there will be private inflow into power distribution will depend on the natureand pace of reform of this sub-sector, especially in regard to tariff structure andregulation. Different models of reform can be visualised, including those tried inother countries. But we will not attempt an examination of the relative merits ofthese models because that would be outside the scope of the paper. We would onlyreiterate that successful distribution reform holds the key to success in therestructuring of the power sector.
It would be clear from the foregoing account that there are no ‘quick fix’solutions which can improve the investment climate for attracting private investment.Restructuring of the power industry has to be the first step. Involving as it does avariety of stakeholders and vested interests, it is not an easy process and a transition
50 Journal of Social and Economic Development Jan. - June 2003

period is inescapable. Our effort should be to keep this period to the minimum. It isnot that the reform process would have to be completed before investor confidenceis restored. If credible reform measures are initiated and concrete results in theshape of improvement in technical and financial performance begin to show up,private investment will start coming in even while the reform process is under way.
Current Steps
The states are still the major players in the power industry in India. It is atthe state level that the main action lies in the implementation of power sector reforms.The progress so far has been uneven and, in general, slow. Appreciating the needto stimulate implementation of reforms at the state level, Ministry of Power (MOP)has taken some initiatives; an integral feature of most of these initiatives is the offerof incentives to state governments predicated on the achievement of milestones inthe agreed reform agenda.
New Initiatives of Ministry of Power(a) In 1995, Government of India announced special concessions for mega power
projects, including exemption from import duties on capital equipment andtax holiday for ten years. Eighteen projects were identified, the basic criteriabeing that the project should have a capacity of 1000 MW or more in the caseof thermal projects and 500 MW or more in the case of hydro projects, thebenefits being shared by more than one state.
(b) MOUs have been entered into by MOP with most state governments underwhich the states have undertaken to reduce T & D loss through metering of all11 kV lines by a specified date, as well as metering of all consumers by anotherspecified later date. In return, Government of India has given assurance ofsupport under APDP (explained below), assistance in securing funds fromPower Finance Corporation, allocation of additional power from centralgenerating stations, etc.
(c) A substantive measure taken by MOP was the introduction of AcceleratedPower Development Programme (APDP) in February 2000, under whichinvestment funds were provided for Renovation and Modernisation and LifeExtension of power plants and upgradation of sub-transmission and distributionlines (33 kV and below). To begin with, APDP was launched in sixty-threespecified circles all over the country, with the expectation that these wouldserve as models for replication in other areas. Release of APDP funds wasmade conditional on achievement of reform milestones by the state governmentconcerned. Following the recommendation of the Expert Committee on State–Specific Reforms, this scheme was later converted into the Accelerated PowerDevelopment and Reforms Programme (APDRP), the modification being that,
Vol. V, No.1 Chandran: Investment in Power Sector 51

while a part of the funds would be utilised for purposes contemplated underAPDP, the rest of the funds would be earmarked for providing financialincentives to the states for achieving higher power system efficiency measuredin terms of reduction in the gap between unit costs of supply and realisation.APDRP is to be funded jointly by the Government of India, state governmentsand financial institutions; the central budgetary provision would be leveragedto attract total funding of a higher order. The allocation for APDRP in theCentral budget 2002–03 was Rs.3, 500 crores. For the remaining period of theTenth Plan, an outlay of Rs.40, 000 crores is planned, the funding to be sharedequally by central government and financial institutions. Out of this amount,Rs.20, 000 crores will be allocated for investment, while the balance will beoffered as incentive for improvement of power system efficiency. APDRP willthus be of strategic importance in accelerating the pace of reform.
(d) The Expert Group on Settlement of Dues (headed by Montek Ahluwalia), whichwas constituted by Ministry of Power to suggest the manner in which SEBdues to NTPC, NHPC, PGCIL, Coal India, etc. towards supply of power, coaland transmission charges should be dealt with, submitted its report in May2001. The committee noted that, as at the end of February 2001, the duesamounted to Rs.41, 473 crores, inclusive of Rs.15, 766 crores of interest/surcharge and recommended that these dues might be securitised, with somewrite-off of interest/surcharge. Government of India has accepted therecommendation with a slight modification — the dues are to be securitisedwith a waiver of 60 per cent of surcharge. SEBs will have to pay current duespromptly in future failing which penalty will be imposed in the shape ofreduction of power supply from central stations and coal supply. The stateshave also to accept reform – based milestones specified in MOUs with MOP.This method of settling the dues is a step in the right direction, because clearanceof dues from future earnings would call for an unacceptable increase in tariffand endanger the entire reform process.
(e) MOP constituted two other Expert Groups. The first was the Distribution PolicyCommittee (chaired by Ashok Basu) to study issues related to distributionreform, including private sector participation. The committee presented itsreport in May 2002; the report identified different models of restructuring thepower sector at the State level and appraised their relative merits. The othergroup set up by MOP was the Expert Committee on State-Specific Reforms(Deepak Parekh Committee), which was asked to review the APDP programme(to which reference was made earlier) and to devise state-specific reformprogrammes for five or six states. In its report submitted in September 2002,the committee took the position that it was the prerogative of each state todetermine how it wanted to run and fund its power sector and confined itself to
52 Journal of Social and Economic Development Jan. - June 2003
suggesting a ‘template’ for initiating discussions with individual states.Introduction of competition, avoidance of single buyer model, formation ofconcentrated zones for privatisation of distribution and multi-year regulatoryregime are the principal features of the template. The Committee emphasisedthe interdependence of different components of reform and the importance ofproper sequencing.
(f) As stated in the Blueprint for Power Sector Development brought out by MOPin August 2001, MOP constituted a Committee of Experts (headed by UdeshKohli) to identify sources of funding for power sector development, includinggovernment funding, multilateral and bilateral assistance, institutional finance,market borrowings, international resources, private investment, etc.; thecommittee submitted its report in December 2002. According to the well-knownNGO, Prayas (Prayas 2003), the recommendations included disinvestments ofexisting power stations to mobilise funds for fresh investment required to bemade by the public sector. We will comment on this particular recommendationlater in this paper.
All these initiatives are to be commended as they have helped to highlightproblem areas and suggest solutions. Different reform models have been presentedfrom which the state government can make a choice. Guidance needed to facilitatedecision on reform measures has been provided, as also incentives for reformimplementation.
In the Indian context, in which both the centre and the states have a roleand share responsibility for development of the power sector, it is clearly necessaryto have the support of the states to put through the sectoral reform. Keeping this inview, besides the usual interaction at the official level, the instrumentality of ChiefMinisters’ Conferences chaired by the Prime Minister has been utilised to securesupport for the programme. Conferences of state chief ministers and power ministerswere held in 1996, 1998 and 2001 to persuade the states to move faster on thepower reform effort. At each of these conferences, the chief ministers agreed totake specific time-bound measures. The conference of 1996 resulted in the CommonMinimum National Action for Power which required, among others, fixing aminimum tariff of 50 ps. per unit for agricultural consumption and raising it to atleast 50 per cent of the average cost of supply within three years. An importantdecision taken at the conference in December 1998 was to set up State ElectricityRegulatory Commissions before March 31, 1999. Energy audit of 11 kV feeders tobe made effective within six months and of all consumers by the end of 2001 wasone of the action points agreed to in the March 2001 conference. Unfortunately,these did not result in concrete action in most states.
Vol. V, No.1 Chandran: Investment in Power Sector 53
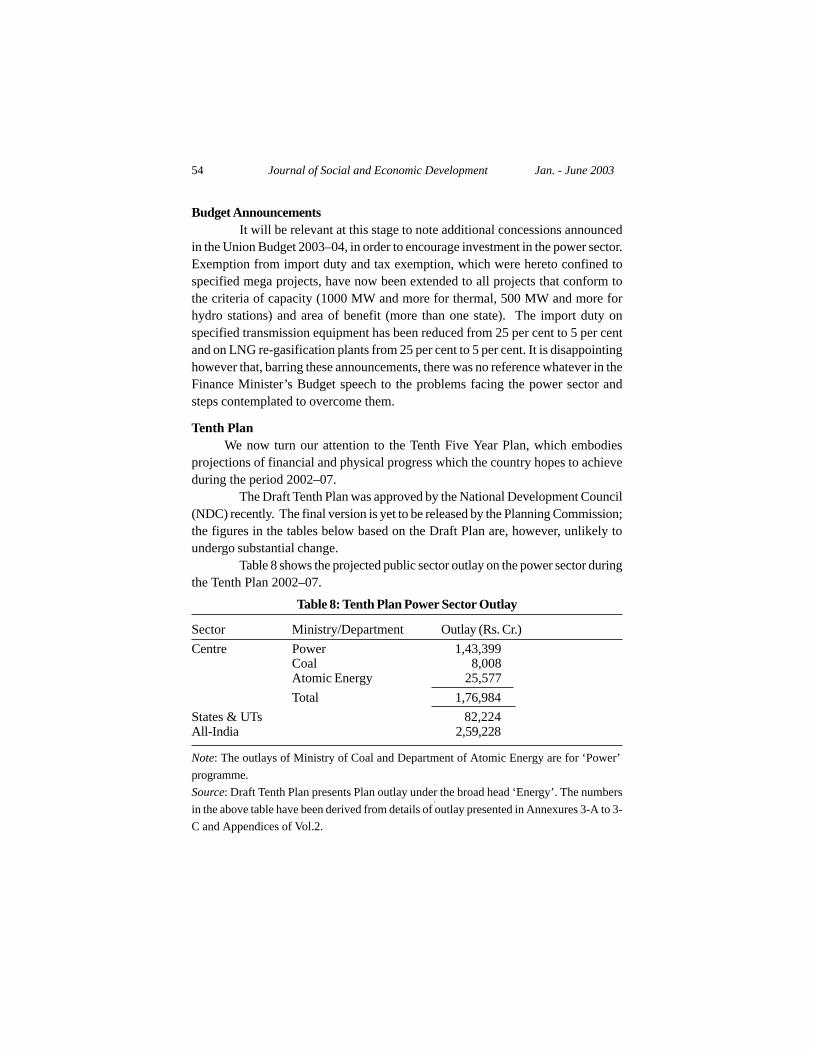
Budget AnnouncementsIt will be relevant at this stage to note additional concessions announced
in the Union Budget 2003–04, in order to encourage investment in the power sector.Exemption from import duty and tax exemption, which were hereto confined tospecified mega projects, have now been extended to all projects that conform tothe criteria of capacity (1000 MW and more for thermal, 500 MW and more forhydro stations) and area of benefit (more than one state). The import duty onspecified transmission equipment has been reduced from 25 per cent to 5 per centand on LNG re-gasification plants from 25 per cent to 5 per cent. It is disappointinghowever that, barring these announcements, there was no reference whatever in theFinance Minister’s Budget speech to the problems facing the power sector andsteps contemplated to overcome them.
Tenth Plan We now turn our attention to the Tenth Five Year Plan, which embodiesprojections of financial and physical progress which the country hopes to achieveduring the period 2002–07.
The Draft Tenth Plan was approved by the National Development Council(NDC) recently. The final version is yet to be released by the Planning Commission;the figures in the tables below based on the Draft Plan are, however, unlikely toundergo substantial change.
Table 8 shows the projected public sector outlay on the power sector duringthe Tenth Plan 2002–07.
Table 8: Tenth Plan Power Sector Outlay
Sector Ministry/Department Outlay (Rs. Cr.)Centre Power 1,43,399
Coal 8,008Atomic Energy 25,577Total 1,76,984
States & UTs 82,224All-India 2,59,228
Note: The outlays of Ministry of Coal and Department of Atomic Energy are for ‘Power’programme.Source: Draft Tenth Plan presents Plan outlay under the broad head ‘Energy’. The numbersin the above table have been derived from details of outlay presented in Annexures 3-A to 3-C and Appendices of Vol.2.
54 Journal of Social and Economic Development Jan. - June 2003

Table 9: Tenth Plan Outlays of States and UTs
State State Plan Outlay Power Sector
Outlay % increase over Outlay % of Plan(Rs. Cr.) Ninth Plan (Rs. Cr.) Outlay
Andhra Pradesh 46614 64.8 7618 16.3Bihar 21000 89.2 2479 11.8Jharkand 14633 1727 11.8Gujarat 40007 55.1 4850 12.1Haryana 10285 28.0 1400 13.6Karnataka 43558 39.9 2267 5.2Kerala 24000 72.4 3500 14.6Madhya Pradesh 26190 50.3 3555 13.6Chattisgarh 11000 1493 13.6Maharashtra 66632 41.9 8351 12.5Orissa 19000 58.8 3863 20.3Punjab 18657 74.9 3314 17.8Rajasthan 27318 37.7 4586 16.7Tamil Nadu 40000 60.5 6779 16.9Uttar Pradesh 59708 103.0 7790 13.0Uttaranchal 7630 995 13.0West Bengal 28641 32.9 6182 21.6Total-States & UTs 632456 58.2 82244 13.9
Source: Planning Commission, Draft Tenth Plan. In the footnote to the Table at Annexure3C, Vol. II (from which figures in the above Table have been drawn) of the Draft Plan, it isindicated that Arunachal Pradesh, Assam, Haryana, Karnataka, Kerala, Meghalaya, Mizoram,Nagaland and Sikkim have submitted firm sectoral allocations and other state allocationsare indicative.
The Tenth Plan projections show a sharp jump in the public sector outlayon power. As the Draft Plan rightly points out, ‘Keeping in view the low level ofinvestment by the private sector, it would be desirable, in the short run, to step uppublic sector investment even as efforts continue to put the SEBs back on the railsin order to attract private investments’. For the country as a whole, the outlay onthis sector will show an increase of 106.5 per cent, whereas the overall Tenth Planoutlay goes up by only 62.1 per cent compared with the Ninth Plan. What is moresignificant and interesting, the central power outlay (Rs.1, 76,984 crores) is slatedto increase by 220.6 per cent over the Ninth Plan outlay of Rs.52, 299 crores. Incontrast, the aggregate of the Tenth Plan outlays of states and UTs is to increase by63.4 per cent over the Ninth Plan outlay, but the outlay on power will go up by only
Vol. V, No.1 Chandran: Investment in Power Sector 55
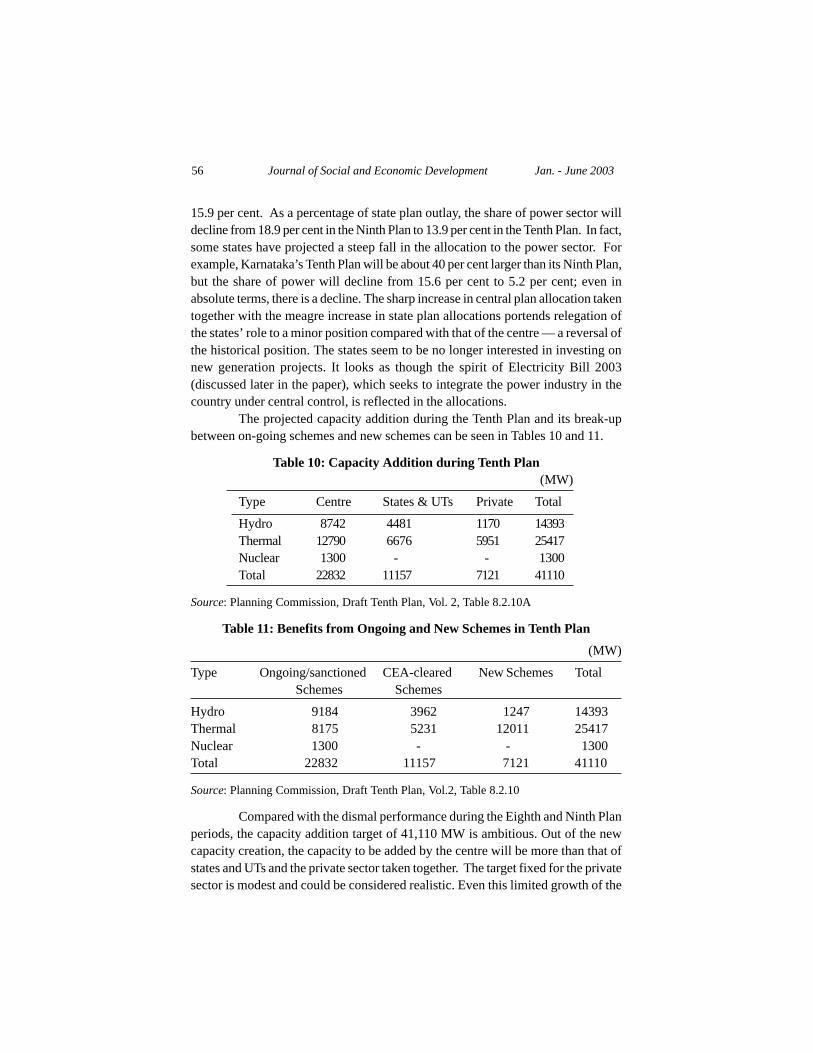
15.9 per cent. As a percentage of state plan outlay, the share of power sector willdecline from 18.9 per cent in the Ninth Plan to 13.9 per cent in the Tenth Plan. In fact,some states have projected a steep fall in the allocation to the power sector. Forexample, Karnataka’s Tenth Plan will be about 40 per cent larger than its Ninth Plan,but the share of power will decline from 15.6 per cent to 5.2 per cent; even inabsolute terms, there is a decline. The sharp increase in central plan allocation takentogether with the meagre increase in state plan allocations portends relegation ofthe states’ role to a minor position compared with that of the centre — a reversal ofthe historical position. The states seem to be no longer interested in investing onnew generation projects. It looks as though the spirit of Electricity Bill 2003(discussed later in the paper), which seeks to integrate the power industry in thecountry under central control, is reflected in the allocations.
The projected capacity addition during the Tenth Plan and its break-upbetween on-going schemes and new schemes can be seen in Tables 10 and 11.
Table 10: Capacity Addition during Tenth Plan (MW)
Type Centre States & UTs Private Total
Hydro 8742 4481 1170 14393Thermal 12790 6676 5951 25417Nuclear 1300 - - 1300Total 22832 11157 7121 41110
Source: Planning Commission, Draft Tenth Plan, Vol. 2, Table 8.2.10A
Table 11: Benefits from Ongoing and New Schemes in Tenth Plan(MW)
Type Ongoing/sanctioned CEA-cleared New Schemes Total Schemes Schemes
Hydro 9184 3962 1247 14393Thermal 8175 5231 12011 25417Nuclear 1300 - - 1300Total 22832 11157 7121 41110
Source: Planning Commission, Draft Tenth Plan, Vol.2, Table 8.2.10
Compared with the dismal performance during the Eighth and Ninth Planperiods, the capacity addition target of 41,110 MW is ambitious. Out of the newcapacity creation, the capacity to be added by the centre will be more than that ofstates and UTs and the private sector taken together. The target fixed for the privatesector is modest and could be considered realistic. Even this limited growth of the
56 Journal of Social and Economic Development Jan. - June 2003

private sector will be achieved only if payment security issues are resolved quickly.Incidentally, it may be noticed that a three-fold increase in additional hydro capacityis planned. Given the recent experience of infructuous attempts in India andelsewhere to construct large hydro projects, how far this will be achieved is open toquestion.
As already mentioned, the Tenth Plan envisages a vastly increased role ofthe central government, calling for a steep rise in power sector outlay. The mannerin which financing on this scale will be organised is shown in Table 12.
What stands out from the above table is that while the increase in budgetarysupport looks manageable, there is to be an extraordinary increase in ‘Internal andExtra- Budgetary Resources’ (IEBR). Internal generation of funds by public sectorenterprises like NTPC, NHPC, etc. cannot go up in a spectacular manner, as bulksupply tariffs for sale of power from central power stations are subject to regulationand there are limits to the extent to which they can be raised. Equally, marketborrowings by public sector undertakings (PSUs) cannot be unrestrained; theviability of projects and the need to maintain overall financial stability of the PSUimpose constraints. It looks as though the quadrupling of IEBR is sought to beachieved through joint ventures. According to the Draft Plan, ‘The Governmentproposes to enhance public funding for the sector as well as encourage PSUs totake up projects in joint ventures with private investors and state governments duringthe Tenth Plan period.’ How joint ventures will be launched overcoming the problemof payment security has not been explained.
The strategy of relying primarily on public funding of power projects inthe next few years is to be welcomed. It shows an appreciation of the fact that thefinancial viability of the power industry has to be established as a pre-condition toattract private investment on a large scale and that reforms in the power sectorgeared to achieve this objective will take a few years to be fully carried out. It isdisappointing, however, that the power sector has not been accorded due priority inthe state plans.
While, as stated earlier, the sharp increase of the outlay on the powersector is to be commended, there is the larger question of credibility of the TenthPlan projections. Central and state government finances continue to be in a badcondition. In fact, the central budgetary allocations in the first year of the TenthPlan (2002–03), which is already over and the allocations in the budget of 2003–04 recently presented by Union Finance Minister, do not hold out hope of the TenthPlan financial projections coming through in the central sector. Most state budgetshave yet to be announced, but one does not expect the position to be different.Table 13 shows the allocations in the Union Budget.
Vol. V, No.1 Chandran: Investment in Power Sector 57

Table 12: Financing Pattern of Central Sector Outlay in Tenth Plan
(Rs. crore at 2001–02 prices)
Ministry/ Budgetary Support Internal and Extra-Budgetary Resources Total Outlay
Department Ninth Plan Tenth Plan % increase Ninth Plan Tenth Plan % increase Ninth Plan Tenth Plan % increaseRealisation Projection Realisation Projection Realisation Projection
Atomic Energy 6771 21550 218.3 1671 10820 547.5 8442 32370 283.4Coal 2233 1050 -53.0 14623 30541 106.0 17058 31591 85.2Power 14907 25000 67.7 29785 118399 297.5 44692 143399 220.9
Note: 1. The outlay under Atomic Energy covers both power and R&D programmes. In the Tenth Plan, Rs.25, 577 crores is provided for power. 2. The Budgetary support for ‘coal’ includes Rs.1257.4 cr. and Rs.8007.6 cr. under ‘Ninth Plan Realisation’ and ‘Tenth Plan Projections’ respectively for power (Neyveli Lignite Corporation).Source: Planning Commission, Draft Tenth Plan, Vol 1, Annexure 3-B
58 Journal of Social and Economic D
evelopment Jan. - June 2003

Table 13: Central Energy Sector Annual Plans 2002–03 & 2003–04(Budgetary Allocations)
(Rs. Cr.)
Ministry/Department 2002–03 2003–04
BE RE BEAtomic Energy 2741 2686 4106Coal 3491 2744 3321Power 13483 11268 14070
Note: The figures shown above for Ministry of Coal and Department of Atomic Energy aregross provisions; the allocation for power programmes is not known.Source: Union Budget 2003–04 — Central Plan Outlay by Ministries/Departments
The budgetary provision in 2003–04 for Ministry of Power, which has thekey role in power development, is only slightly higher than in 2002–03. The positionis similar in the case of Ministry of Coal. The increased allocation to Departmentof Atomic Energy could be due to the launching of the 1000 MW KudankulamProject with Russian assistance. If, as is apparent, the financial provisions in thefirst two years are not in line with the plan projections, it follows that the projectedphysical targets will also be difficult to achieve.
Electricity Bill 2003A new and important milestone in the development of the power sector in
India is the passing of the Electricity Bill 2003 by Parliament recently. Apart frombringing the electricity industry in the country within the fold of a single legalenactment, it sets out the framework for its emergence as an efficient and competitiveindustry, besides serving larger social goals. The highlights of the Bill are:
• Central Government will, in consultation with State Governments,formulate the National Electricity Policy and Tariff Policy for developmentof power systems and optimum utilisation of domestic energy resourceendowments including renewable sources of energy.
• Rural areas will receive special attention. Central Government will, inconsultation with state governments, draw up a national policy permittingstand-alone power systems for supply to rural areas. There will also be anational policy for rural electrification which will provide for bulk purchaseof power and its distribution by panchayats, NGOs, cooperative societies,users’ associations, etc.
• No licence is required for generation except for hydropower stations(beyond specified capital investment). Captive generation is freed fromrestrictions.
Vol. V, No.1 Chandran: Investment in Power Sector 59

• The private sector can participate as licensees in both transmission anddistribution. Electricity trading is recognized as a distinct activity.
• There will be non-discriminatory open access to transmission lines, subjectto availability of capacity. Open access to distribution lines will be providedin a phased manner. These will be subject to such surcharges as theRegulatory Commission concerned may impose. The proceeds of thesurcharge are to be utilised for meeting the requirement of cross-subsidy.Both the surcharge and cross-subsidy are to be phased out gradually.
• There can be more than one Distribution Licensee in a given area, withseparate distribution systems. A consumer may choose to take supply froma source other than the Distribution Licensee, subject to payment ofspecified charges.
• Metering will be compulsory.• There will be an Appellate Tribunal for Electricity. The order of the
Authority can be taken in appeal to the Supreme Court.• Subsidies are to be paid by Government through the Budget (so as to be
transparent).• There will be more stringent penalties for theft of power.• Provisions of State laws already passed as are not inconsistent with this
law will be saved.
As would be apparent from the salient features presented above, ElectricityBill 2003 will provide a coherent framework for reform of the power sector andgive direction to policy actions to be launched hereafter. It is therefore a measure tobe welcomed.
Our immediate interest is in the impact the Bill may have on investment inthe power sector in terms of attracting private funds. Viewed from this angle, non-requirement of a licence for generation and open access to transmission anddistribution networks to both suppliers and consumers should stimulate investorinterest. Third party sales to selected customers at mutually negotiated rates couldbe an attractive proposition. This will come about eventually when we have adequatecapacities in the transmission and distribution systems and there are no bottlenecksof the kind we find at present; it is obviously uneconomic for power stations toconstruct dedicated delivery systems. Also, we should remember that SEBs couldestablish escrow arrangement of payment security only to a limited extent becauseof the limited number of large consumers paying remunerative tariff. It is difficultfor a new power supplier to counter the market power of the public sector entitiesand wean away good customers. It is not surprising that private investment is notforthcoming unless there are long-term arrangements that assure a market for thepower generated (and thereby reduce market risk) and provide security of payment.
60 Journal of Social and Economic Development Jan. - June 2003
The new Bill has special provisions to ensure spread of electricity to ruralareas. Under Clause 13, SERC may, in consultation with the State Government,exempt local authorities, panchayats, cooperatives, etc. from licensing requirementfor transmission and distribution in rural areas. Clause 14 lays down that in ruralareas notified by the State Government, a person can generate and distribute powerwithout having to obtain a licence. The focus of Clause 13 is on institutionalarrangements for proper management of distribution rather than on mobilising localinvestment. As for Clause 14, one cannot be optimistic about private investmentcoming forward to set up generation and distribution facilities in rural areas. First,it is presently hard to find distributed generation technologies capable of producingpower at rates competitive with grid power. They may be appropriate for remoteareas, but do not lend themselves to wide application. Second, the bulk of ruralconsumers belong to subsidised domestic and agricultural categories. There is littlescope for cross-subsidy, apart from the fact that the law mandates its gradualelimination. Viability of investment will therefore be totally dependent on the extentand consistency of commitment on the part of the state government in regard topayment of subsidy. A prudent investor is unlikely to risk his funds under suchcircumstances.
Thus, the impact of the Bill will be limited in the short run. The beneficialeffects of Electricity Bill 2003 will accrue only when the financial health of theelectricity industry improves. As argued elsewhere in this paper, this is criticallydependent on sectoral reforms at the state level. Unfortunately, the bill leaves it tothe state government to decide whether to unbundle the SEB at all and if so, in whatmanner. Thus, the movement forward in restructuring the power industry has beenrendered unpredictable. Reviewing the earlier version of the bill as introduced inParliament, namely Electricity Bill 2001, S. L. Rao commented, ‘In the absence offinancial viability of the state sectors, this bill will make for some slight improvementin procedures, but not in the substance of the electricity system in India’ (Rao2001). As the relevant provisions remain unchanged in Electricity Bill 2003, thisobservation applies equally to the final version.
Short-Term Prospect
It is over ten years since reform of the power sector, which is a vital partof the country’s infrastructure, was initiated as a part of wide-ranging changes inthe country’s economic policy. Power sector reform started with the generationsegment and later extended to transmission. It took some time to appreciate thatpriority really ought to be given to distribution reform, because the fundamentalweakness of the power industry lay there. Meanwhile, the power industry as a wholehas suffered a setback. Public investment has come down and private investmenthas not picked up. Indeed, the sector is in bad shape.
Vol. V, No.1 Chandran: Investment in Power Sector 61

Reform impulses have not percolated equally to all parts of the country.While regulatory mechanisms have come up in most states, which is a healthydevelopment, progress in implementation of other reform measures has been slow.A few states have made some headway, but this is confined to what may be calledthe soft part of the reform package, namely, unbundling and corporatisation. Changeof formal structure does not by itself provide a solution. What is basic is tariffrationalisation; this has to be paralleled by control of theft of power and reductionof system losses. True, this cannot be done overnight and has to be phased over aperiod of time, say three to five years. But what is worrisome is that we do not seeany concerted move in this direction in most states.
It is not that enough knowledge is not available in the country as to howwe should proceed. As we have seen, there has been extensive exploration of differentaspects of reform and expert advice is available within the country and outside.The lines of action that need to be taken are well understood by those who occupydecision-making levels in the governance of the country. The missing element ispolitical will and commitment. The country’s political economy has reached a stagewhen the time horizon for policy making at the political level is limited to the nextelection. State chief ministers and power ministers agree to time-bound measureswhen they meet in conferences, but most of them show no inclination to pursuethem. It is clear that power reform cannot go ahead without full political backing.This is because the reforms impact, directly or indirectly, all sections of society.Civil society is not free from blame either. Sections of society which wield politicalclout by the strength of their numbers or otherwise, exert pressure to protectprivileges enjoyed by them in the shape of concessional power tariff. Unfortunateas it may be, it is perhaps only a situation of crisis which will sensitise the communityand the leadership of the country to the urgency of corrective action to restore thehealth of the power sector and foster its growth.
In the long term, as in any market economy, private capital has to be themain source of investment funds for the power sector in India and this will happenonce the electricity industry turns the financial corner and the investment climate inthe country improves. The reality is that investor perception of India today is lowerthan before. The AT Kearney/FOREIGN POLICY Magazine Globalization Index2003 (based on thirteen variables covering economic, political and other factors),which has just been released, ranks India 56th among 62 advanced economies andkey emerging markets. In the last two years, India held the 49th position. It is thereforeimperative that we maximise public sector investment in power programmes in thenext few years. For the central sector, the target should be to reach the outlayprojected in the Tenth Plan within the next four years. As for the states, the PlanningCommission should ensure that there is adequate allocation to the power sectorwhile finalising the Tenth Plan of each state, as well as during Annual Plandiscussions.
62 Journal of Social and Economic Development Jan. - June 2003

As mentioned earlier, one of the expert groups set up by Ministry of Poweris reported to have suggested disinvestment of existing power stations as a possibleway of raising funds for investment by Government. This is not a desirable courseof action. In the first place, the sale will obviously not be at book value; publicassets cannot be gifted away to private parties. It will have to be at market value,but this could mean converting a low-cost power source into a high-cost source, asthe consumer who had already paid for the capital cost will have to pay for it all overagain (Purkayastha 2001). This will result in a heavier burden on the consumerwithout any benefit in return. Second, it is likely that in a situation in which theindustry is running at a loss, the assets may not fetch a good price. A point could bemade that the foregoing scenario may not be valid, as other countries, notablyU.K., sold their power facilities for a good price without any adverse effect onconsumer tariff. With freedom from licensing and possibility of third party salesavailable under Electricity Bill 2003, it is urged, there is no reason why this courseof action should not be resorted to in India. Attractive as it may appear, this argumentcannot be accepted. At the time of denationalisation in the 80s, the British powerindustry was a well-run industry, both technically and financially. As it happened,there was excess capacity in the power system and abundant supplies of North Seagas, which was a cheaper and cleaner fuel, became available during that period.The U.K. electricity market soon became competitive and consumers benefited bylowering of tariff. Present conditions in our country are, needless to say, different;that the power industry is in poor shape with supply shortages and high technicaland financial losses needs no elaboration. At the same time, capacity to pay is areal issue for large sections of consumers; it is essential to retain low-cost generationsources so as not to aggravate the subsidy problem. There is even a suggestion thatsuch sources should be segregated into a separate system for supply to poorhouseholds and agricultural consumers (Sankar 2002). In any event, tariffrebalancing and efficiency improvement (which calls for substantial investment)can be achieved only over a period of time. Our focus should be on fresh investmentsthat add capacity in all segments of power systems.
Presently, we are in a situation where private investment in the powersector is not forthcoming on its own and the capital budgets of Governments, Centraland State, are limited. For the transition period necessary to set right the financialviability of the power industry, we need to leverage available public funds byestablishing strategic partnerships with the private sector so as to mobilise funds ofthe order needed to avoid a further widening of the power supply-demand gap,which will have serious consequences for the national economy. Power generationoffers good scope for joint ventures. As it happens, Union Finance Minister hasintroduced in this year’s Central Budget the concept of viability gap funding in thecontext of infrastructure development — principally, roads, railways, airports and
Vol. V, No.1 Chandran: Investment in Power Sector 63
seaports. To quote from his Budget speech, ‘The essence of the new fundingmechanism is to leverage public money through private sector partnership, whereverpossible’. He has made it clear that there would be no open-ended guarantees atany stage. This concept is not altogether new — generally, it translates into a one-time capital subsidy or an annual revenue subsidy until the break-even level isreached. Taking roads as an example, what this means is that there will be privateinvestment on toll roads under a BOOT arrangement, in which Government willmake good any shortfall in annual revenue on an agreed basis. It is a variant of the‘cost plus guaranteed return’ approach, which can be justified on the ground thatroads partake largely of the character of a public good. This model will not, however,be suitable for power projects. Even if gold plating of capital cost is avoided throughcompetitive bidding, it will amount to an indiscriminate subsidy from the exchequerto all electricity consumers. The pattern of joint ventures in power generation projectswill have to be different. These projects should be based on investment sharing;automatically, this means risk sharing as well. The Central PSU, which co-promotesthe project, should remain a minority shareholder, preferably with not more than26 per cent equity capital. A few mega projects may be identified and for each ofthem, the joint venture partner may be selected through a competitive process. Thepresence of PSU nominees in the higher echelons of management will ensure thatcapital costs are not inflated. Power tariff may be determined on the pattern set byCentral Electricity Regulatory Commission (CERC) in the last couple of years forbulk supply tariff payable to NTPC. CERC has laid down clear parameters fordetermination of a two-part tariff; these include norms of technical performance,operational expenses, depreciation, etc. as well as the methodology for arriving atthe availability-based capacity charge. The tariff provides for a return of sixteenper cent return on equity at the stipulated level of availability, together with someincentive for better performance. We believe that the CERC prescription is fair toboth the supplier and buyer of power and could be the benchmark for negotiatingPPAs with the beneficiary state utilities. The period of the PPA may be limited toten years so as to cover the loan amortisation period and the PPA will be subject toregulatory approval. Payment security may be by way of adjustment of centralresource transfers to states. Power supply from new projects should be conditionalon the states accepting this mode of payment security. It will take four years ormore to commission a large power station at a greenfield site. Hopefully,rationalisation of retail tariffs would have made good headway by then and occasionsfor resorting to the security mechanism would be few and far between. Unlesssome such arrangement is made, the Tenth Plan target will not be reached.
Thus, in the short-term scenario that we are looking at, the mainresponsibility for addition of new generation capacity will devolve on the centralgovernment. It is desirable that state governments also play a part, including that ofpartners in joint projects.
64 Journal of Social and Economic Development Jan. - June 2003

Restrictions on captive generation may be lifted. This is already visualisedin the Electricity Bill 2003. We should remember that this is a sub-optimal solution,but has to be accepted as a short-term measure.
Funds for transmission lines and related facilities will also have to sourcedalmost wholly from the public sector; here, the states will be the major players, thecentral role being limited to inter-state transmission.
Though distribution is not as capital-intensive as generation andtransmission, this segment also requires inflow of investment funds, if system lossesare to be brought down and efficiencies improved. As mentioned earlier, thiscomponent of the power system has been neglected in the past and there is a backlogof investment, which needs to be made up. Universal metering is a prime necessityto establish base line operating parameters, such as the precise extent of technicalloss, non-technical or commercial loss and the proportion of energy consumed bydifferent categories of consumers (this information is required for tariff rebalancing).Unless conductor and transformer capacities are upgraded in keeping with loadgrowth and the ratio of high tension lines to low tension lines is increased, technicalloss cannot be controlled. Apart from the electricity meter, which is the basicinstrument for ensuring that power consumption is recorded and paid for, IT-basedapplications are now available for monitoring and accounting power flows in thedistribution system. How will the required investment funds be sourced? This willdepend on the reform and privatisation strategy of the State Government. Reportedly,some state governments do not contemplate privatisation at all, in which case theresponsibility for investment in power distribution will squarely be on them.However, in the majority of states, privatisation is on the reform agenda though thetime frame and route to be followed have not yet crystallised. One option is todevote the next few years to preparing the ground for privatisation by completingthe installation of meters, taking vigorous action against stealing of power, tighteningup billing and collection, and reducing tariff distortions. Naturally, the stategovernment will have to provide the necessary funds to the SEBs or their successorentities. So far, most of the states appear to be following this path but, as pointedout earlier, the scale of fund flow has been dwindling. The other option is to privatisequickly, following a methodology that is the best possible under the circumstances.
Only two states, Orissa and Delhi, have so far privatised their distributionsystems. Orissa was the pioneer, but the results have been disappointing. While weneed not go into the reasons for this outcome, we should note that the Orissaexperience has lessons to offer to states planning to go ahead with privatisation,namely, the need for reliable baseline data, realistic valuation of assets and multi-year regulation. These aspects appear to have been taken care of by Delhi(Government of the National Capital Territory of Delhi) while carrying outprivatisation of power distribution last year. Assets were valued by the Business
Vol. V, No.1 Chandran: Investment in Power Sector 65
Valuation Method. Regulatory uncertainty was eliminated by issue of a policydirective by the state government to the Regulatory Commission. The stategovernment also gave a clear commitment on the quantum of financial support overthe five-year period, within which the private operator is required to achieve theagreed percentage reduction in the ‘aggregate technical and commercial loss’(difference between units supplied and units for which payment is received). Thereare incentives and penalties related to the level of performance. It is too early toassess the impact of the Delhi privatisation, but the signs are encouraging. Delhihad some advantages: being primarily an urban conglomeration, it did not have alarge proportion of agricultural consumers and unmetered supply. These favourablefactors cannot be replicated in most states, which makes the process of privatisationmore complex.
Karnataka is considering adoption of the ‘Distribution Margin’ (DM)approach for privatising its distribution system. In its essence though not in detail,it is similar to the Delhi model. Under the DM methodology, the Distribution Margin,calculated to cover operating cost and capital recovery cost, will be payable to theprivate party as a first charge on the revenue collected, subject to the agreed‘minimum collection requirement’ being achieved. There is provision for differentincentive rates and performance benchmarks. The DM arrangement is intended toapply for an interim period, which will end when defined conditions are met.Thereafter, the conventional regulatory system will apply. Here again, the RegulatoryCommission is expected to play a prominent role in defining the initial structure ofthe DM methodology as well as the conditions of switching to a more conventionalregulation.
Interim arrangements of the kind mentioned above have to be tailored tosuit local conditions. As far as investment is concerned, one cannot expect theprivate operator to expose himself to capital risk beyond what is needed to reachthe minimum level of performance required to get his guaranteed return or payment.Continued support of the state government under APDRP will be necessary. If aminimum level of investment is insisted upon as one of the bid conditions, theoperator may ask for government guarantee for his borrowing, since it will be difficultfor him to get non-recourse third party financing on account of the perceived highlevel of risk. What this adds up to is that though there may be some supplementfrom the private operator, the primary responsibility for investment will remainwith the state government. The main criticism of such ad hoc models of privatisationis that risk allocation is tilted heavily in favour of the operator. This has to beweighed against the gains in terms of better management, improved efficiency andbenefit to the consumer. It is desirable that the states accelerate the reform processby adopting models of privatisation, which may not be ideal but are best suited totheir situation, rather than drift in a directionless fashion. The problems of the
66 Journal of Social and Economic Development Jan. - June 2003

power industry in the country are worsening day by day and demand correctiveaction on the distribution front.
As indicated at the outset, this paper has focused on issues pertaining topower sector investment in the short run, covering essentially the transition from avertically integrated monopoly to a deregulated regime, in which private capital willplay an increasingly important role. This period is crucial as it should signify theupturn of the power industry and set it on the path to its emergence as a technicallyefficient and financially healthy component of India’s infrastructure.
None of the steps suggested above for augmenting investment in the powersector during the next few years is new, much less innovative. Over the years, theIndian power sector has been the subject of a large number of studies by individualscholars, expert groups set up by governments at central and state levels and financialinstitutions, and all that can be said has been said. What is badly needed is thewillingness to act. This is where the political factor comes in. The role of the centralleadership in carrying the states with them in the reform effort is important. Equally,it bears responsibility for developing a consensus in favour of reform among themajor political parties. As we look round, we see that reforming states do not havea common political affiliation; the multi-party democratic system we have in thecountry is not a hurdle. A great deal will depend on the capability of the nationalleadership to push the reform agenda at the state level. It is only through vigorousand determined effort that there is hope of the Indian power sector being set on aneven keel and sustaining the country’s ambitious plans for a high growth rate of theeconomy and rapid reduction of poverty.
Note
1. There have been two developments since writing the paper. First, Planning Commissionhas issued the final version of the Tenth Plan. Second, Electricity Bill 2003 has beenenacted as Electricity Act 2003, effective from June 10, 2003. However, these do notaffect the views expressed in the paper.
References
AT Kearney Inc. ATKearney/FOREIGN POLICY Magazine Globalization Index 2003.http://www.atkearney.com
Government of India, Ministry of Finance (2003). Union Budget 2003–04. http://www.finmin.nic.inGovernment of India, Dept. of Power (1980). Report of the Committee on Power, p26.Government of India, Ministry of Power
(1996). Common Minimum National Action for Power.(2001). Resolutions of the Chief Ministers/Power Ministers Conference on 3rd
March 2001.
Vol. V, No.1 Chandran: Investment in Power Sector 67
(2001). Blue Print for Power Sector Development.(2001). Report of the Expert Group on Settlement of SEB Dues.(2002). Report of Distribution Policy Committee.(2002). Report of Expert Committee on State-Specific Reforms.
http://www.powermin.nic.inGovernment of India, Planning Commission
(1997). Ninth Five Year Plan.(2002). Indian Planning Experience – A Statistical Profile.(2002). Annual Report (2001–02) on the Working of State ElectricityBoards and Electricity Departments.(2003). Tenth Five Year Plan – Draft as approved by NationalDevelopment Council.
http://www.planning commission.nic.inPrayas (2003). India Power Sector Reforms Update, Issue 5, February.
http://www.prayaspune.orgPurkayastha, Prabir (2001). Public Sector Policies and New Electricity Bill: From Crisis to
Disaster. Economic and Political Weekly, XXXVI (25), Jun.23-29, pp 2257-2262.Rao, S.L. (2001). Electricity Bill 2001: What it Reflects of Power Policy. Economic and
Political Weekly, XXXVI (38), Sep. 22-28, pp 3608-3613.Sankar, T.L. (2002). Power Sector Reform: Towards a People’s Plan. Economic and Political
Weekly, XXXVII (40), Oct.5-11, pp 4143-4151.
68 Journal of Social and Economic Development Jan. - June 2003
Received: April 24, 2003 Accepted: July 17, 2003
Rural Household Characteristics and HealthExpenditure in India: An Analysis
Maathai K. Mathiyazhagan ∗∗∗∗∗
Abstract
The main objective of this paper is to analyse the rural householdcharacteristics and health expenditure in India. The study uses a national-level household survey and finds that health expenditure of the membersof rural households in India is sensitive to changes in their income levels.The elasticity of health expenditure with respect to income is largest forhigh-income groups with the income elasticity of health expendituremore than 1 in absolute terms. It indicates an income elastic situationfor spending on treating both short-term morbidity (STM) and long-term morbidity (LTM) by the upper income groups. It is also true in thecase of drugs and medicine expenditures. The results also suggest thathouseholds incur higher total health expenditure and higher expenditureon drugs and medicines for getting treated from formal health careproviders in the rural areas.
In recent times, studies on new household behaviour have assumed greaterimportance among researchers in the field of health economics (Pollack and Wales1981; Russo et al. 1993; Deaton 1987; Deaton et al. 1989; Parker and Wong 1997).Indeed, one of the basic reasons for measuring household cost is to understanduser behaviour. Knowing the costs borne by the household members for using theservice helps to predict the quantum of services utilised or in ascertaining whyservices are not used. Seeking health services in a household depends mainly onvarious demand and supply side factors. From the perspective of society, both thecost of obtaining primary health care services and the cost of producing servicesare important. It implies that the demand side of health service utilisation is aspertinent as the supply side. Several factors appear likely to influence the anticipatedsatisfaction that patients receive from health services. They include availability ofdrugs, qualification of the staff, and the level of sophistication of equipment andtechnology, all perceived as success of previous contacts with the service(Mathiyazhagan 1999). Some studies suggest that the perceived quality of servicesis more important than fees paid in determining the choice of health service (Gilsonet al. 1994; Wensing et al. 1994; Mathiyazhagan 2003). Thus, user behaviour is an∗ Assistant Professor, Economics Unit, Institute for Social and Economic Change, Nagarbhavi,Bangalore-560 072, E-mail: [email protected], [email protected]. The author is gratefulto anonymous referees for useful comments on this paper.

important factor in learning about the household cost pattern. Individuals, on theirpart, try to minimise the cost of health care by using the scarce resources effectively,thereby revealing the household costs on health. Thus, rural householdcharacteristics and health expenditure in India are important in the Indian context.
Framework for Household Health Expenditure Function
Household economics assumes that households derive utility orsatisfaction from consuming commodities and services, and household membersmust produce many of the commodities desired for consumption. In order to maintaingood health status, in general, the households in rural areas face constraints of timeand monetary resources. In this context, it may be observed that householdsderive utility mainly from their members’ health and other consumption. In order toconsume health, households produce it by combining inputs such as health careservices and the household members’ time. In this sense, the utilisation of healthservices is assumed to be a derived demand from the production of health. It couldbe formulated through a simplified household utility function, which represents allmembers and assumes that households derive utility from overall consumption andhealth, which is controlled by the household composition (i.e., demographic factors)and constrained by its social and economic context (socio-economic characteristics).In fact, the derived demand for health care is a function of the level of income of thehouseholds, prices, and preferences for health relative to other items of consumption.It is important to note that price is considered a vital variable for estimating demandor expenditure functions. However, the price variable was considered unobservablein most empirical research studies on expenditure functions (Deaton 1987, Deatonet al. 1989). In this context, budget share equation has been used as an alternativeapproach in determining the expenditure functions instead of estimating demandequations for health care. Parker and Wong (1997) propose another approach usingexpenditures and quantities to derive the estimates of prices. It is important torecognise that the prices of health care are mostly unobserved. This is because inprinciple, health care services in India are offered free of charge through the publichealth care system. The available data present severe limitations because of lack ofprice information and quantities of health services availed of, and hence it is onlypossible to approximate an expenditure function for health care demand among therural households through socio-economic and demographic factors.A regression equation for household expenditure could be formulated as follows:
where,
( ) ieizK
k iknkiniY
iniY
ih ++∑=
+
+
+=− δβββα
1
2ln2ln1
*expln
70 Journal of Social and Economic Development Jan. - June 2003

(h-exp)*i are the expenditures on health care by household iYi is the household incomeni is the number of household membersnik is the number of household members in age-group kzi represents a vector of other household socio-economic and demographiccharacteristics andei is a random error term.
It is better to use the logarithmic transformations of expenditures andincome in order to capture possible non-linearity in the relations. It is assumed that(h-exp)* is the unobserved desired level of expenditures by the household. It onlyobserves (h-exp) when it is positive beyond a certain threshold, otherwise it is zero.As is common in these types of specifications, we estimate the expenditure equationincluding only those households with positive expenditures, using a Heckmancorrection for the selectivity bias by this convention (Maddala 1983).
In order to estimate the expenditure functions in health, the study usestotal health expenditure of the households in relation to other determinant factorstaken together. First, it divides the sample into households of short –term morbidity(STM) and long-term morbidity (LTM) expenditures. Second, for each of these twogroups, two income groups (upper 50th percentile and lower 50th percentile) areformed, as it is important to measure the demand for health care among higherincome households separately, which is less elastic (Gertler et al. 1987). It is alsoimportant to note that expenditure on drugs and medicines is the main componentof total health expenditure of the rural households. It accounts for nearly 70 percent of the total health expenditure of the households (Mathiyazhagan 2003).Therefore, it is important to estimate separate expenditure functions for drugs andmedicines in view of their implications on drug pricing in India.
The total monetary health expenditure of the households or totalexpenditure on drugs and medicines is used as a dependent variable for the regressionequations. It is important to note that standard linear regression models assumethat errors in the dependent variable are uncorrelated with the independentvariable(s). When this is not the case (for example, when relationships betweenvariables are bi-directional, especially between health expenditure and income ofthe household in the present analysis), linear regression using ordinary least squares(OLS) no longer provides optimal model estimates. Hence, Two-stage least-squares(2SLS) regression uses instrumental variables that are uncorrelated with the errorterms to compute estimated values of the problematic predictor(s) (the first stage),and then uses those computed values to estimate a linear regression model of thedependent variable (the second stage). Since the computed values are based onvariables that are uncorrelated with the errors, the results of the two-stage modelare optimal.
Vol. V, No.1 Mathiyazhagan: Rural Household Characteristics & Health Expenditure 71
Four groups of explanatory variables are included in the analyses, viz.,household income, household composition, risk, and socio-economic variables.The first group comprises household income, categorised as low and high-incomepercentiles. The second group includes total household size, percentage of womenof fertile ages (15–49 years) and percentage of children with respect to the totalnumber of household members. The risk variables that form the third group arehealth status variables such as general health conditions of the household members,number of hospital episodes in the month prior to the survey interview, the numberof working days lost due to ill health, health seeking behaviour of the householdsand source of health care utilised. It is important to note that health condition is asubjective assessment such as perception of one’s own health or proportion ofpeople reporting one or more health problems during household survey. Thesehealth-related variables have been used in two groups, one representing the typeof remedial actions taken and the other representing the adverse results of ill health.The remedial actions group includes variables such as the number of times a doctorwas consulted in the month prior to the survey. Some of these remedial actionvariables have been considered as indicators of past utilization of health care servicesbut they have been used here as general indicators of the health status of therespondents. Two dummy variables (i.e., private and public health care providers)are used for analysing the role of health care provider in total health expenditure,and drugs and medicines expenditure functions. The adverse effects of ill healthhave been measured (as proxy) here through the number of days (working) lost asa result of illness or the number of days spent in bed. The fourth group of variablescomprises socio-economic variables such as whether the household head ordependents have health insurance or other benefits, and educational level of thehousehold head. In addition, all regressions include regional dummies, to proxy forthe differences in cost of living with severe morbidity across regions. In this sense,location of the states represented by zones is used as a proxy.
Data Source
The study uses household survey data for an empirical analysis. For thedata on morbidity pattern and its associated expenditure on drugs and medicine,the study uses the Household Survey Data, which has been collected by NationalCouncil of Applied Economic Research (NCAER), New Delhi, with the sponsorshipof United Nations Development Program (UNDP) in 1994. It is confined only torural households in major states in India. A stratified, multistage sampling procedurehas been adopted to identify the index household for the study. The nature andnumber of strata of households formed in the states were different as the compositionof the population in terms of attributes like age, marital status, caste, occupation,and income were different across the states in India. The households were listed
72 Journal of Social and Economic Development Jan. - June 2003

and drawn from different strata of the sample. The first stratum included householdswith at least one pregnant woman. Households with at least one child aged lessthan twelve months but no pregnant women were included in the second stratum.The remaining households were stratified according to religion, ethnic group, andoccupation of the head of the household. The strata were formed in various statesalong with allocation of sample households. The total number of rural householdsselected in the sample was 35,130 spread over 1,765 villages and 195 districts in 16major states in India. Nearly 1, 94, 486 household members were interviewed (Table1). The data set provides morbidity pattern and health expenditure in general anddrug expenditure in particular for short and long-term illnesses by controlling socio-economic characteristics of the rural people. It is important to note that the datawere obtained from a household survey, using a one-month recall period for STMand a one-year recall period for LTM. Though the survey allowed three illnessepisodes, the study considered only the first illness episode of the recall period, asmost of the households experienced only one illness episode.
Table 1: Rural Samples by States in India
States Total Number Number of Samples Households Surveyed
of Districts Districts Villages Households Households HouseholdMembers
Andhra Pradesh 22 12 113 2244 2100 10540Bihar 42 12 116 2338 2155 12973Gujarat 19 10 88 1768 1606 9239Haryana 16 11 90 1808 1722 11078Himachal Pradesh 12 8 65 1260 1225 7179Karnataka 20 15 135 2747 2523 15001Kerala 14 8 75 1500 1474 8045Maharashtra 30 16 151 2998 2765 15336Madhya Pradesh 45 25 217 4320 4162 25083Orissa 13 11 102 2040 1971 11354Punjab 12 8 70 1373 1303 7983Rajasthan 27 12 106 2102 1984 12558Tamil Nadu 20 8 76 1545 1456 6990Uttar Pradesh 63 23 217 4251 4036 25436West Bengal 17 8 78 1560 1515 8927Assam 60 8 66 1276 1233 6764All India 432 195 1765 35130 33230 194486
Vol. V, No.1 Mathiyazhagan: Rural Household Characteristics & Health Expenditure 73

Descriptive Results of Household Health Expenditure Function
An overview of the descriptive results of household health expendituresforms the basis for the empirical analysis in this paper. The analysis covers (i)proportion of health expenditure in relation to total income of the households, (ii)per person health expenditure for STM and LTM among the rural householdsacross the states in India, (iii) per person health expenditure for STM and LTMacross the socio-economic characteristics of the rural households, (iv) componentsof health care expenditure of the households, (v) per person drugs and medicineexpenditure for STM and LTM across the states, and (vi) per person drugs andmedicines expenditure across the socio-economic characteristics.
Total Health Expenditure in Proportion to Annual Income of the HouseholdsDespite the large role of government in the health care sector in almost
every country, globally more than 40 per cent of health care is financed privatelythrough voluntary private insurance, out-of-pocket payments, or charities and otherNGOs (Gaag and Barham 1998). Further, in most of the poorer countries, privatehealth care spending may be as high as 80 per cent. India, in particular, has one ofthe highest proportions of private health care financing (i.e., nearly 82 per cent) inthe world (WHO 2000). It is a negative implication of health care financing underthe ongoing economic reform and structural adjustment polices of most of thedeveloping countries. It implies that the structural adjustment policies influencethe health sector by reducing private income or consumption (Gaag and Barham1998). In fact, government financing in the health sector plays a vital role inproviding efficient and quality health care services especially in the rural areas ofIndia. However, the government has not been in a position to spend more thanabout 3 per cent of the total plan outlays over the years, which is barely 1.7 per centof the GDP expenditure of the country (UNDP 1999). Further, in order to control andstabilize monetary factors, the government has no means of increasing its outlay onthe health sector in the near future due to the economic reform, which curtailsgovernment spending on social sectors. In this context, it is important to assessthe health care expenditure in proportion to household-level annual income. Sucha proportion has policy implications on whether rural people are willing to contributetowards efficient and quality health care services. In fact, these private resourcesare not always used on the most effective interventions. In many countries, it hasbeen suggested that emphasis be placed on reforming the health sector througheffective utilisation of both public and private resources (World Bank 1993). In thisrationale, it is essential to estimate the private health expenditure out-of-pocketpayments in rural India as it has implications for the potential role of private healthinsurance schemes in India.
74 Journal of Social and Economic Development Jan. - June 2003
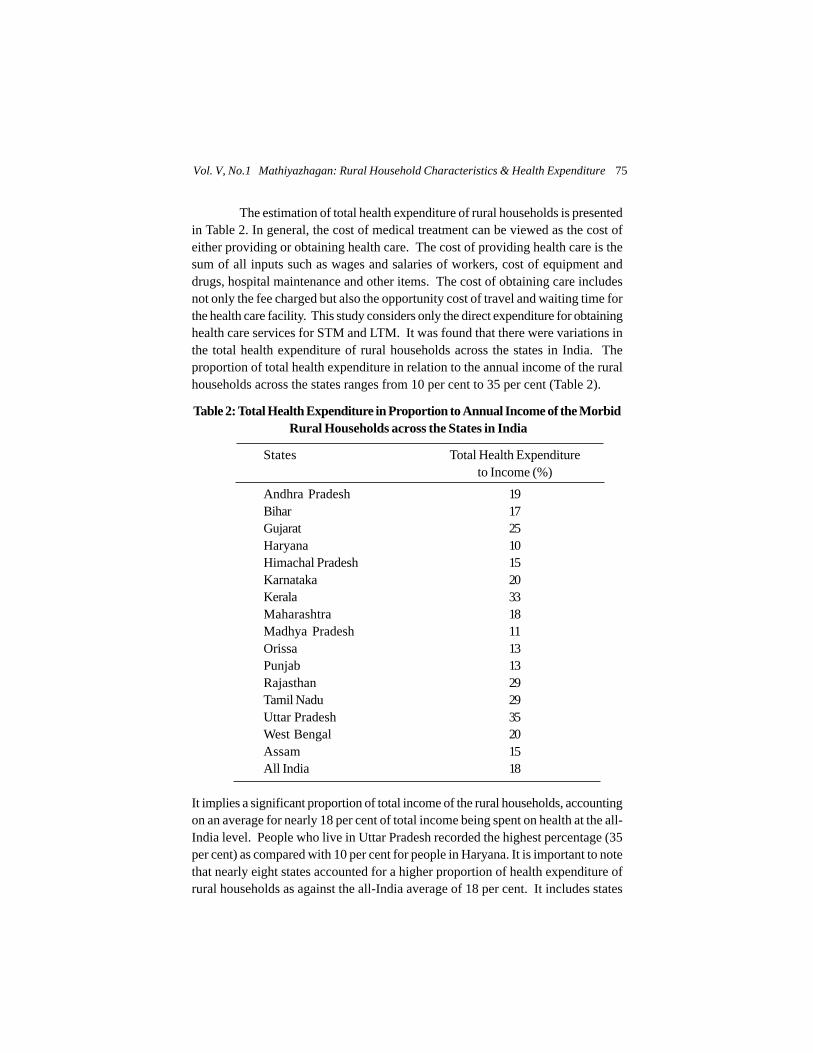
The estimation of total health expenditure of rural households is presentedin Table 2. In general, the cost of medical treatment can be viewed as the cost ofeither providing or obtaining health care. The cost of providing health care is thesum of all inputs such as wages and salaries of workers, cost of equipment anddrugs, hospital maintenance and other items. The cost of obtaining care includesnot only the fee charged but also the opportunity cost of travel and waiting time forthe health care facility. This study considers only the direct expenditure for obtaininghealth care services for STM and LTM. It was found that there were variations inthe total health expenditure of rural households across the states in India. Theproportion of total health expenditure in relation to the annual income of the ruralhouseholds across the states ranges from 10 per cent to 35 per cent (Table 2).
Table 2: Total Health Expenditure in Proportion to Annual Income of the Morbid Rural Households across the States in India
States Total Health Expenditureto Income (%)
Andhra Pradesh 19Bihar 17Gujarat 25Haryana 10Himachal Pradesh 15Karnataka 20Kerala 33Maharashtra 18Madhya Pradesh 11Orissa 13Punjab 13Rajasthan 29Tamil Nadu 29Uttar Pradesh 35West Bengal 20Assam 15All India 18
It implies a significant proportion of total income of the rural households, accountingon an average for nearly 18 per cent of total income being spent on health at the all-India level. People who live in Uttar Pradesh recorded the highest percentage (35per cent) as compared with 10 per cent for people in Haryana. It is important to notethat nearly eight states accounted for a higher proportion of health expenditure ofrural households as against the all-India average of 18 per cent. It includes states
Vol. V, No.1 Mathiyazhagan: Rural Household Characteristics & Health Expenditure 75
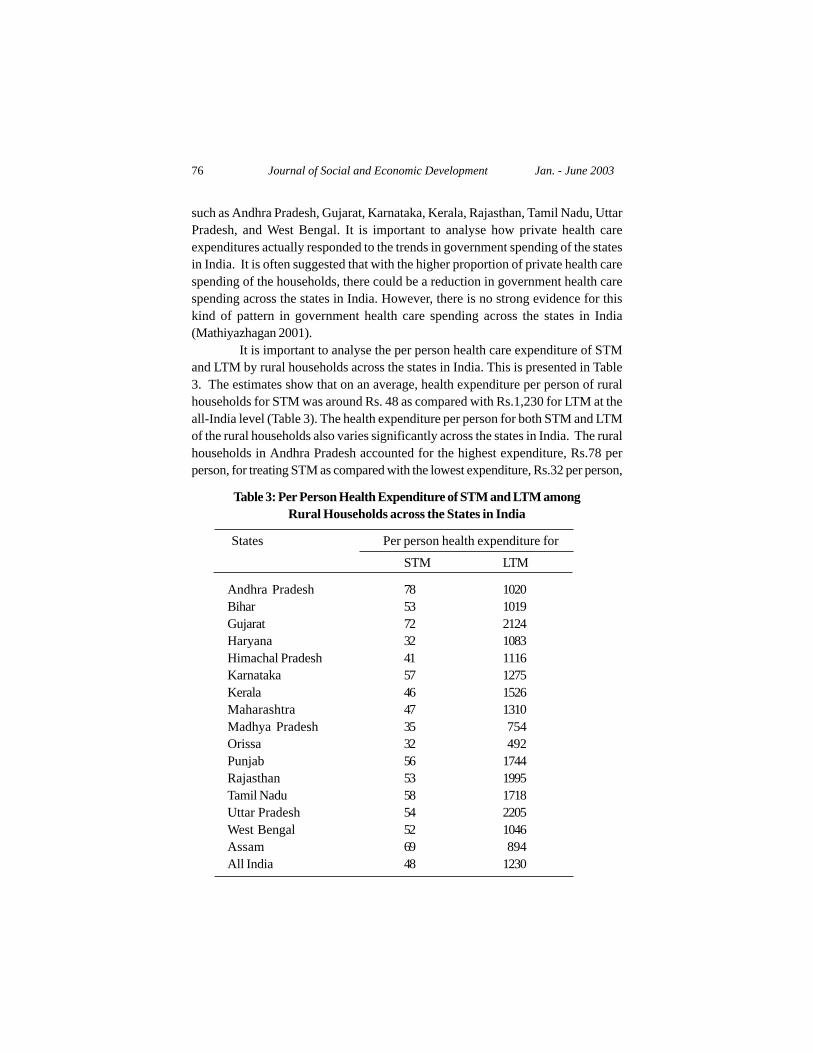
such as Andhra Pradesh, Gujarat, Karnataka, Kerala, Rajasthan, Tamil Nadu, UttarPradesh, and West Bengal. It is important to analyse how private health careexpenditures actually responded to the trends in government spending of the statesin India. It is often suggested that with the higher proportion of private health carespending of the households, there could be a reduction in government health carespending across the states in India. However, there is no strong evidence for thiskind of pattern in government health care spending across the states in India(Mathiyazhagan 2001).
It is important to analyse the per person health care expenditure of STMand LTM by rural households across the states in India. This is presented in Table3. The estimates show that on an average, health expenditure per person of ruralhouseholds for STM was around Rs. 48 as compared with Rs.1,230 for LTM at theall-India level (Table 3). The health expenditure per person for both STM and LTMof the rural households also varies significantly across the states in India. The ruralhouseholds in Andhra Pradesh accounted for the highest expenditure, Rs.78 perperson, for treating STM as compared with the lowest expenditure, Rs.32 per person,
Table 3: Per Person Health Expenditure of STM and LTM amongRural Households across the States in India
States Per person health expenditure for
STM LTM
Andhra Pradesh 78 1020Bihar 53 1019Gujarat 72 2124Haryana 32 1083Himachal Pradesh 41 1116Karnataka 57 1275Kerala 46 1526Maharashtra 47 1310Madhya Pradesh 35 754Orissa 32 492Punjab 56 1744Rajasthan 53 1995Tamil Nadu 58 1718Uttar Pradesh 54 2205West Bengal 52 1046Assam 69 894All India 48 1230
76 Journal of Social and Economic Development Jan. - June 2003

in Haryana and Orissa, respectively. It may be observed from Table 3 that there isno standard pattern of government health care spending across the states in India.Most of the states in India exceed an all-India average of health expenditure perperson of the rural households. The few states such as Haryana, Himachal Pradesh,Kerala, Maharashtra, Madhya Pradesh and Orissa recorded the lowest spendingon treatment of STM as compared with the all-India average. There is a consistencybetween the lower spending on treating STM and the pattern of STM prevalence inthese states in India (Mathiyazhagan 2001).
The per person spending on treating LTM of the rural households, on anaverage, amounts to nearly Rs.1,230 per person, and varies significantly across thestates in India (Table 3). The per person expenditure of the LTM for rural householdsin Uttar Pradesh was the highest (i.e., Rs.2,205) as compared with the lowest of onlyRs.492 per person in the case of Orissa. Most of the households incurred higherexpenditure in treating LTM per person than the recorded all-India average ofRs.1,230. It ranges between Rs.1,310 and Rs.2,205. The states that spent more forLTM per person include Gujarat, Karnataka, Kerala, Maharashtra, Punjab, Rajasthan,Tamil Nadu and Uttar Pradesh. The higher prevalence of LTM of rural householdswas recorded for only four states, namely, Andhra Pradesh, Himachal Pradesh,Kerala and Rajasthan.
Per Person Health Expenditure of STM and LTM by Controlling HouseholdCharacteristics in India
The analysis of per person health care expenditure of STM and LTM ofthe rural households by given household characteristics shows a contrastingpicture for different states in India. The class structure in rural society in India playsa vital role in determining the health status and its expenditure. The per personhealth expenditure of STM and LTM by social status in terms of caste of thehousehold members indicates lower spending by the socially backward classessuch as SCs and STs as compared with the others in society (Table 4). It records anexpenditure of Rs.40 per person on treating STM and Rs.586 for the treatment ofLTM in the case of members of STs, while those who belong to the socially forwardclass in rural society accounted for nearly Rs.50 and Rs.1,389, respectively for STMand LTM.
There is a well-known postulate that at higher and higher incomes, peoplespend proportionately less and less. This was not valid in the case of per personspending on treating the STM and LTM of rural households in India. The averageper person spending on treating STM was around Rs.45 for the lower income group(i.e., first 20 per cent of household income quintiles), as against Rs.48 for the higherincome group (i.e., last 20 per cent of household income quintiles). In the case ofper person spending on treating LTM, it was nearly Rs.1,457 and Rs.1,057 for higher
Vol. V, No.1 Mathiyazhagan: Rural Household Characteristics & Health Expenditure 77

and lower income groups respectively. It implies that the higher income groupswere spending more on health in rural India, but relatively less vis-à-vis incomelevels. The same pattern has been depicted in the case of per person healthexpenditure of STM and LTM by poverty status of the members of the ruralhouseholds (Table 4).
Household size is an important indicator influencing per person healthexpenditure of rural households in India. Households with a large number of members(say, more than eight) were able to spend smaller amounts on treating STM andLTM, as shown in Table 4. The table shows that households of a larger sizeaccount for only Rs.37 per person spending on treating STM as compared withRs.58 among households with fewer members (i.e., less than four members in thehousehold). In this case, per capita spending on treating LTM was around Rs.1,111among households of smaller size than among households with more members(Rs.1,389). It is important to note that households of smaller size spend more ontreating STM and less on treating LTM.
Occupational status is another factor in per capita health expenditure ofrural households in India. The estimates illustrate that there is not much of adifference in spending on treatment of STM among occupational groups of thehousehold members (Table 4). The professionals spent marginally less (Rs.46) thanagriculturists and others (Rs.48). However, spending on treatment of LTM wasmarked by major differences among the occupational categories of the householdmembers. The salaried and professional members of the rural households recordedthe highest per person spending on treating LTM, amounting to Rs.1,421. It is alsoimportant to note that daily wage earners of the households spent only Rs.1,087 perperson for LTM, which was the lowest among the occupational categories.
It was found that ownership of land and landholding size influencedspending behaviours among members of the households on health. The resultsindicate that all the non-land owners of the household incurred higher spendingper person for STM and lower for LTM, amounting to Rs.51 and Rs.1,186 per personfor STM and LTM, respectively. As far as the link between landholding size and perperson health expenditure of the members of the rural households is concerned, itshows that the larger landholding size group spent more on treating STM while themedium landholding size group spent more on treating LTM.
Analysis of Components of Health Expenditure of the Household Members inRural India
It is evident from the analysis in the last section that there was a variationin per person health expenditure of the household members in rural India as awhole. It is useful to identify the major components of health expenditures inrelation to the total of the households. Table 5 analyses the components of perperson health expenditure of the household members in rural India. The major
78 Journal of Social and Economic Development Jan. - June 2003
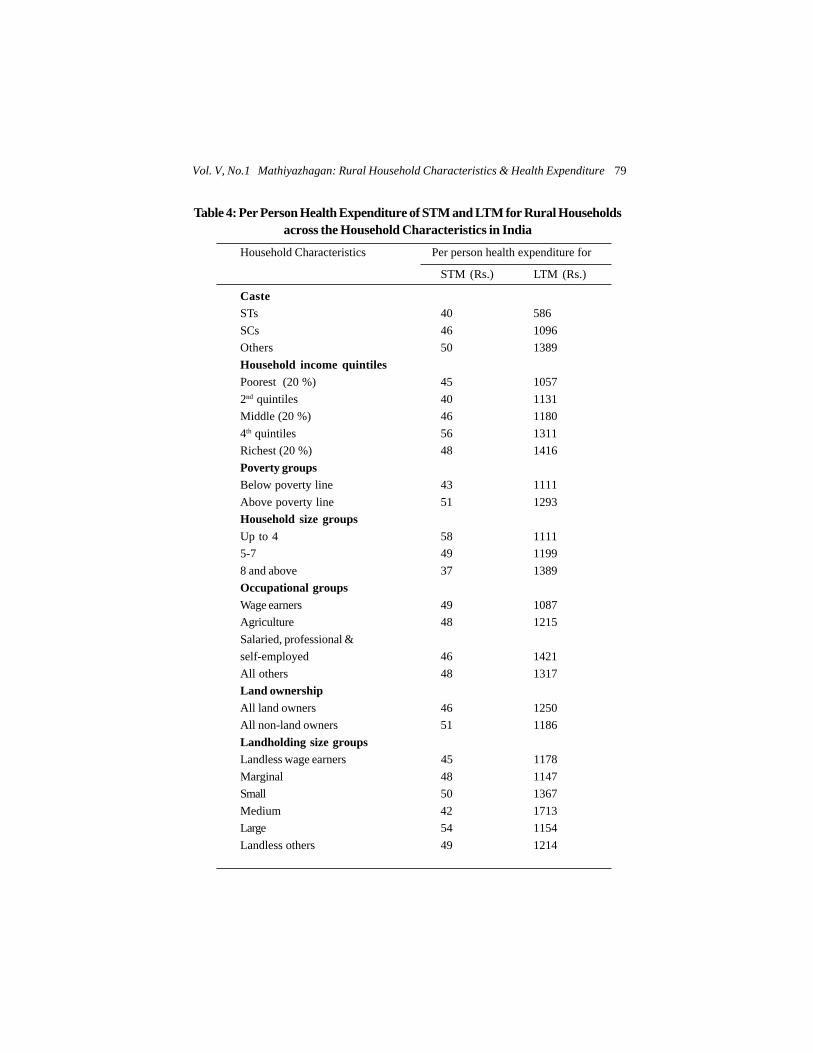
Table 4: Per Person Health Expenditure of STM and LTM for Rural Householdsacross the Household Characteristics in India
Household Characteristics Per person health expenditure for
STM (Rs.) LTM (Rs.)
CasteSTs 40 586SCs 46 1096Others 50 1389Household income quintilesPoorest (20 %) 45 10572nd quintiles 40 1131Middle (20 %) 46 11804th quintiles 56 1311Richest (20 %) 48 1416Poverty groupsBelow poverty line 43 1111Above poverty line 51 1293Household size groupsUp to 4 58 11115-7 49 11998 and above 37 1389Occupational groupsWage earners 49 1087Agriculture 48 1215Salaried, professional &self-employed 46 1421All others 48 1317Land ownershipAll land owners 46 1250All non-land owners 51 1186Landholding size groupsLandless wage earners 45 1178Marginal 48 1147Small 50 1367Medium 42 1713Large 54 1154Landless others 49 1214
Vol. V, No.1 Mathiyazhagan: Rural Household Characteristics & Health Expenditure 79
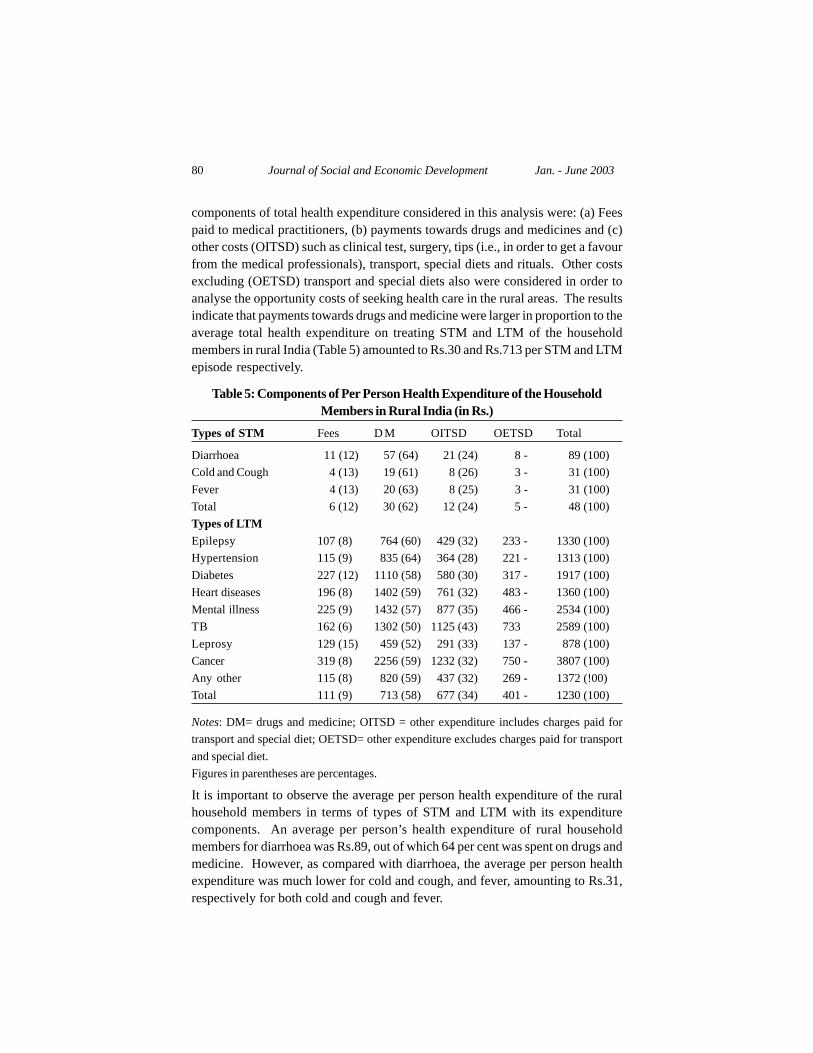
components of total health expenditure considered in this analysis were: (a) Feespaid to medical practitioners, (b) payments towards drugs and medicines and (c)other costs (OITSD) such as clinical test, surgery, tips (i.e., in order to get a favourfrom the medical professionals), transport, special diets and rituals. Other costsexcluding (OETSD) transport and special diets also were considered in order toanalyse the opportunity costs of seeking health care in the rural areas. The resultsindicate that payments towards drugs and medicine were larger in proportion to theaverage total health expenditure on treating STM and LTM of the householdmembers in rural India (Table 5) amounted to Rs.30 and Rs.713 per STM and LTMepisode respectively.
Table 5: Components of Per Person Health Expenditure of the HouseholdMembers in Rural India (in Rs.)
Types of STM Fees D M OITSD OETSD Total
Diarrhoea 11 (12) 57 (64) 21 (24) 8 - 89 (100)Cold and Cough 4 (13) 19 (61) 8 (26) 3 - 31 (100)Fever 4 (13) 20 (63) 8 (25) 3 - 31 (100)Total 6 (12) 30 (62) 12 (24) 5 - 48 (100)Types of LTMEpilepsy 107 (8) 764 (60) 429 (32) 233 - 1330 (100)Hypertension 115 (9) 835 (64) 364 (28) 221 - 1313 (100)Diabetes 227 (12) 1110 (58) 580 (30) 317 - 1917 (100)Heart diseases 196 (8) 1402 (59) 761 (32) 483 - 1360 (100)Mental illness 225 (9) 1432 (57) 877 (35) 466 - 2534 (100)TB 162 (6) 1302 (50) 1125 (43) 733 2589 (100)Leprosy 129 (15) 459 (52) 291 (33) 137 - 878 (100)Cancer 319 (8) 2256 (59) 1232 (32) 750 - 3807 (100)Any other 115 (8) 820 (59) 437 (32) 269 - 1372 (!00)Total 111 (9) 713 (58) 677 (34) 401 - 1230 (100)
Notes: DM= drugs and medicine; OITSD = other expenditure includes charges paid fortransport and special diet; OETSD= other expenditure excludes charges paid for transportand special diet.Figures in parentheses are percentages.
It is important to observe the average per person health expenditure of the ruralhousehold members in terms of types of STM and LTM with its expenditurecomponents. An average per person’s health expenditure of rural householdmembers for diarrhoea was Rs.89, out of which 64 per cent was spent on drugs andmedicine. However, as compared with diarrhoea, the average per person healthexpenditure was much lower for cold and cough, and fever, amounting to Rs.31,respectively for both cold and cough and fever.
80 Journal of Social and Economic Development Jan. - June 2003
The average per person health expenditure of the household members forLTM indicates a high variation (Table 5). Treating cancer was more expensive thantreating other major diseases. In the case of cancer, it was around Rs.3,807 perperson followed by Rs.2,589 for TB, Rs.2,534 for mental illnesses, Rs.1,360 for heartdiseases, Rs.1,917 for diabetes, Rs.1,330 for epilepsy and Rs.1,313 for hypertension.The lowest per person health expenditure was accounted for by the treatment ofleprosy.
Results from Multivariate Analysis for Health ExpenditureFunction
Tables 6 and 7 present the Two stage least squares (2SLS) selection-biascorrected estimates of the log of household health expenditures. Table 6 presentsthe estimates of the determinants of the total health expenditure function for STMand LTM across income groups (i.e., lower and upper percentiles). The resultsindicate that health expenditure for the upper income percentile groups of LTM ispositively and significantly related to per capita income. It implies that higher thelevels of income, the greater is the tendency to spend on treating LTM. The resultsshow that every Re.1 increase in income levels will cause a Rs.1.69 increase in thehealth expenditure of LTM. Contrary to this, for the lower income group, there is anegative association between the per capita income and household healthexpenditure of LTM. Though this negative association has not been statisticallysignificant at 5 per cent level of significance, it supports the view that lower incomepeople spend a higher proportion for health in rural areas in India. In the case ofhealth expenditure of STM, there is a significant negative relationship between percapita income and health expenditure of the higher income group. However, in thecase of the lower income group, there is a positive relationship between per capitaincome and health expenditure.
It is often observed that health expenditure tends to rise less rapidly in thelower income group than in the higher income ones. To accommodate this possibility,the regression model uses the squared incomes of the household members. Theresults of the influences of logarithm of squared per capita income on healthexpenditure are opposite to the other form of per capita income (i.e., logarithm of percapita income) of the household members. The results indicate that the upperincome group spends less on treating LTM, which implies a significant negativerelationship between them. It shows that for every Re.1 increase in income, there isa reduction of Rs.1.60 in health expenditure of the household members on treatingLTM (Table 6). However, the lower income groups spend more on health expenditure.It shows that for every Re.1 increase there is a marginal increase (i.e. 8 paise) in thetotal health expenditure on treating LTM. It is also important to note that the influenceof squared per capita income has a significant positive relationship with health
Vol. V, No.1 Mathiyazhagan: Rural Household Characteristics & Health Expenditure 81

Table 6: 2SLS Regression Results for Total Household Health ExpenditureFunction
Variable STM LTM
Lower 50 % Upper 50% Lower 50 % Upper 50%
(Constant) 5.27 -22.99 5.60 35.73(1.72)* (10.11)** (1.44)* (9.23)*
Logarithm of per capita income 0.48 -1.37 -0.08 1.67of the Household members (0.25)* (1.13)* (0.22) (1.03)*Square of logarithm of per capita -0.03 1.40 0.08 -1.60income of the household members (1.31) (6.76)* (1.12) (6.17)*Percentage of fertile women in -0.15 -0.13 -0.05 -0.04the household (0.08)* (0.05)** (0.04) (0.03)Percentage of children in the 0.11 0.06 0.02 0.01household (0.02)* (0.01)* (0.10) (0.03)Number of times doctors 0.06 0.09 0.12 0.18consulted (0.02)* (0.04)* (0.02)** (0.05)*Dummy for private health 0.20 0.23 0.02 0.02provider=1 otherwise-0 (0.06)** (0.09)* (0.08) (0.10)Dummy for public health 0.03 0.05 0.18 0.20provider=1 otherwise=0 (0.09) (0.07) (0.06)* (0.04)*Number of working days lost 0.10 0.13 0.09 0.07
(0.03)* (0.04)** (0.02)** (0.05)Health benefits from other -0.06 -0.09 -0.03 -0.02sources of the households (0.03)* (0.04)* (0.07) (0.08)Occupational categories of the 0.00 0.04 0.01 0.03household members (0.01) (0.01)* (0.01) (0.01)**Literacy level of the household 0.01 0.01 0.01 0.01members (0.05) (0.06) (0.05) (0.05)Residing locations of the -0.11 -0.02 -0.15 -0.06*household members (0.01)* (0.01) (0.01)* (0.01)
Notes: Figures in parentheses are standard errors. * Significant at 1 per cent level of significance.** Significant at 5 per cent level
82 Journal of Social and Economic Development Jan. - June 2003
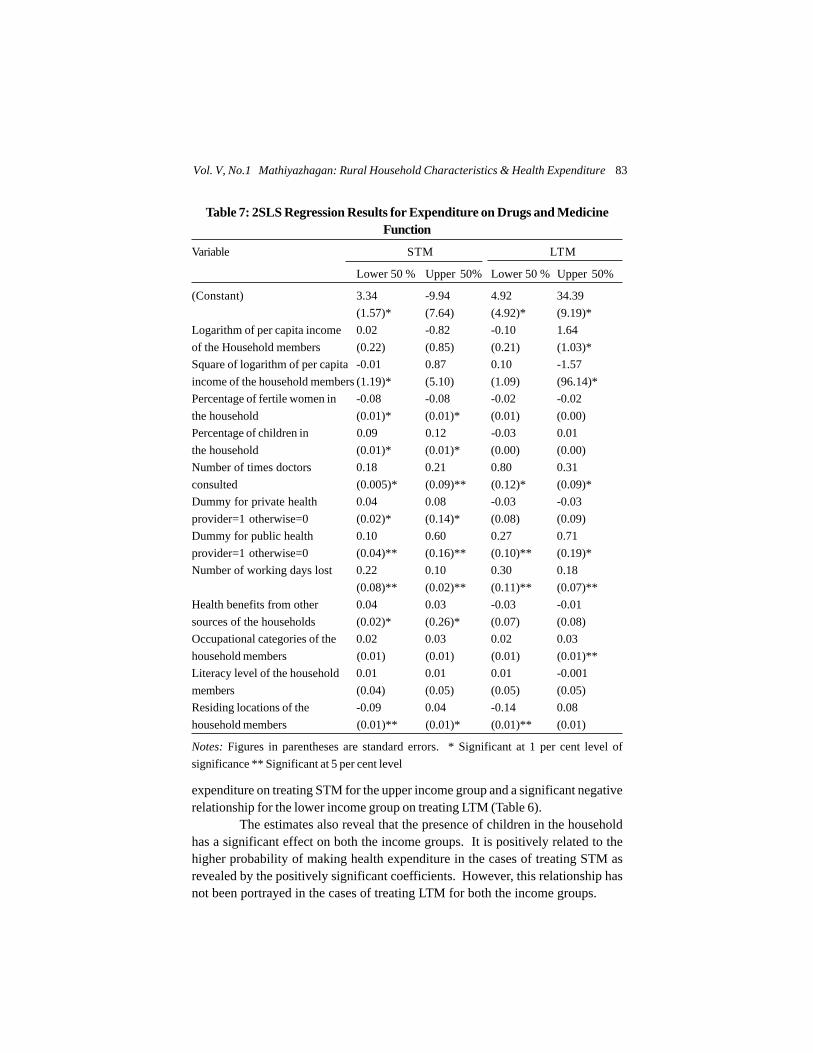
Table 7: 2SLS Regression Results for Expenditure on Drugs and MedicineFunction
Variable STM LTM
Lower 50 % Upper 50% Lower 50 % Upper 50%
(Constant) 3.34 -9.94 4.92 34.39(1.57)* (7.64) (4.92)* (9.19)*
Logarithm of per capita income 0.02 -0.82 -0.10 1.64of the Household members (0.22) (0.85) (0.21) (1.03)*Square of logarithm of per capita -0.01 0.87 0.10 -1.57income of the household members (1.19)* (5.10) (1.09) (96.14)*Percentage of fertile women in -0.08 -0.08 -0.02 -0.02the household (0.01)* (0.01)* (0.01) (0.00)Percentage of children in 0.09 0.12 -0.03 0.01the household (0.01)* (0.01)* (0.00) (0.00)Number of times doctors 0.18 0.21 0.80 0.31consulted (0.005)* (0.09)** (0.12)* (0.09)*Dummy for private health 0.04 0.08 -0.03 -0.03provider=1 otherwise=0 (0.02)* (0.14)* (0.08) (0.09)Dummy for public health 0.10 0.60 0.27 0.71provider=1 otherwise=0 (0.04)** (0.16)** (0.10)** (0.19)*Number of working days lost 0.22 0.10 0.30 0.18
(0.08)** (0.02)** (0.11)** (0.07)**Health benefits from other 0.04 0.03 -0.03 -0.01sources of the households (0.02)* (0.26)* (0.07) (0.08)Occupational categories of the 0.02 0.03 0.02 0.03household members (0.01) (0.01) (0.01) (0.01)**Literacy level of the household 0.01 0.01 0.01 -0.001members (0.04) (0.05) (0.05) (0.05)Residing locations of the -0.09 0.04 -0.14 0.08household members (0.01)** (0.01)* (0.01)** (0.01)
Notes: Figures in parentheses are standard errors. * Significant at 1 per cent level ofsignificance ** Significant at 5 per cent level
expenditure on treating STM for the upper income group and a significant negativerelationship for the lower income group on treating LTM (Table 6).
The estimates also reveal that the presence of children in the householdhas a significant effect on both the income groups. It is positively related to thehigher probability of making health expenditure in the cases of treating STM asrevealed by the positively significant coefficients. However, this relationship hasnot been portrayed in the cases of treating LTM for both the income groups.
Vol. V, No.1 Mathiyazhagan: Rural Household Characteristics & Health Expenditure 83
The higher proportion of fertile age group women in the households hasa significant negative influence on health expenditure for all income groups ontreating STM but the same relationship is not significant in the case of LTM (Table6). The other variables such as percentage of children in the household, othersources of health benefits such as insurance of the household, and literacy level ofmembers of the household do not have any significant influence on the healthexpenditure of LTM for both income groups. However, these variables play a vitalrole in the household health expenditure determinant function in the case of STM.The results indicate that the high percentage of children in the household resultedin a positive and significant impact on total health expenditure on treating STM forboth low and high income groups. Contrasting with this result, a significant negativerelationship is established between the other sources of health benefits of thehousehold and total health expenditure on treating STM. It is also important tonote that occupational status plays a significant role in determination of householdhealth expenditure of the upper income groups on treating STM and LTM. Theestimates for the household members’ residing location show that there is asignificant negative relationship with household health expenditure. It implies thatthere is a significant health expenditure variation among the household membersliving in the different states (represented as a zone in this context).
The number of working days lost due to illness, which is the proxy for thehealth status of the rural household members, is positive and significant for bothtotal health expenditure and expenditure on drugs and medicines functions. Theresults reveal that the frequency of doctor’s consultation has significant positiveresponses in both the total health care expenditure function, and expenditure ondrugs and medicine function (Table 6 and Table 7). However, the degree of positiveresponses between frequency of doctor’s consultation and expenditure on drugsand medicine is higher than the total health expenditure for both STM and LTM.This implies that much of the total health expenditure of the household members inrural India is due to higher expenditure on drugs and medicines. It could also bedue to non-availability of essential drugs at subsidised rates in the governmenthealth care providers in rural India. It is also explained by the choice of health careprovider of the rural households. The choice of private provider having a negativerelationship with expenditure on drugs and medicine is due to LTM of the householdmembers (Table 7).
Table 7 shows the analysis of expenditure on drugs and medicines of STMand LTM for lower and upper income groups. The estimates illustrate the samepattern of aggregate health expenditure of the household members of rural India formost of the cases, albeit, the lower degree of coefficients for drugs and medicinesexpenditure function. However, two important variables, namely, treatment fromformal health care provider and health benefits from other sources of the households
84 Journal of Social and Economic Development Jan. - June 2003

in this function, yield different results especially for income groups of STM andLTM. In the aggregate health expenditure function, these two variables explain thenegative impacts on health expenditure, whereas they play a positive role in thedetermination of drugs and medicines expenditure function. It suggests that ahousehold spends more money on drugs and medicines to get better treatmentfrom the formal health care provider in the rural areas. It also reflects the negativeimplication on the quality of health care in the existing government health careprovider, where drugs and medicines are provided free of cost. In this sense, it isassumed that there will be a negative impact in the determination of drugs andmedicine expenditure function. The positive influence of this variable on the drugsand medicine expenditure function establishes the fact that most of the people inthe rural areas have to pay for drugs and medicine.
Tables 8 and 9 show estimates of the elasticity of total health expenditure,and drugs and medicine expenditure of household members respectively with respectto household income, derived from the regression results1. The table includesestimates regarding the changes in the probability of making health care expenditurewith respect to income of household members. The income elasticity of healthexpenditure function represents the ratio of the percentage change in healthexpenditure to the percentage change in income. Overall, the elasticity estimatesare plausible, ranging between –1.37 and 1.67 (Table 8). It is important to note thatthe elasticities of upper income groups range are -1.37 and 1.67 for STM and LTM,respectively. The income elasticity of STM expenditure equals –1.37, which meansan increase in income leads to a decrease in health expenditure of the householdmembers, i.e., a 10 per cent increase in the upper income group causes a 13.7 percent decrease. Income elasticity in the case of LTM is positive, which means that anincrease in real income leads to an increase of health expenditure among thehousehold members of the upper income group in treating LTM. The incomeelasticity of this group equals 1.67; this means a 10 per cent increase in incomecauses the health expenditure to increase by 16.7 per cent. Thus, the estimatesindicate an income elastic situation for spending on treating both STM and LTM by
Table 8: Impacts of Household Income on Total Health Expenditurefor STM and LTM
Household Income STM LTM
Lower 50 % Upper 50% Lower 50 % Upper 50%
Elasticity with respect tohousehold income 0.48 -1.37 -0.08 1.67Change in probability of healthexpenditure with respect tohousehold income -0.03 1.40 0.08 -1.60
Vol. V, No.1 Mathiyazhagan: Rural Household Characteristics & Health Expenditure 85

Table 9: Impacts of the Household Income on Drugs and Medicine Expenditurefor STM and LTM
Household Income STM LTM
Lower 50 % Upper 50% Lower 50 % Upper 50%
Elasticity with respect tohousehold income 0.02 -0.82 -0.10 1.64Change in probability of healthexpenditure with respect tohousehold income -0.01 0.87 0.10 -1.57
the upper income groups as it exceeds the income elasticity of health expenditureby more than 1 in absolute terms. It is also important to note that there is an incomeinelastic situation for spending on treating both STM and LTM for low-incomegroups, which means that no change occurs in health expenditure when the incomeof the household member changes. However, the estimates show that the incomeelasticity of spending on treating STM is 0.48, which means a 10 per cent increasein income leads to an increase of 4.8 per cent in the health expenditure of thehousehold members of the low-income group. However, the case of income elasticityof spending on treating LTM is –0.08, which implies that every 10 per cent increasein income of the household members leads to a 0.80 per cent decrease in total healthexpenditure.
Contrary to the aggregate health expenditure with respect to income of thehousehold members, the analysis includes change in probability of healthexpenditure with respect to income of the household members (Table 8), whichdisplays the same pattern of aggregate health expenditure function notwithstandingthe lower degree of changes. It is also important to note that the analysis of theimpacts of income of the household members on drugs and medicines expenditureexplains income elasticity only for the higher income group in treating LTM (Table9). It is also significant to observe that the income elasticity of spending on treatingSTM is 0.02, which indicates a 0.20 per cent increase of the drugs and medicinesexpenditure for every 10 per cent increase of income of the household members inthe rural areas.
Discussion
The principal findings suggest that health expenditure of the householdmembers of rural India is sensitive to changes in household income levels, and theelasticity of health expenditure with respect to income is largest for high incomegroups. It indicates an income elastic situation for spending on treating both STMand LTM by the upper income groups as the elasticity exceeds by more than 1 inabsolute terms. It is also true in the case of drugs and medicine expenditure function.
86 Journal of Social and Economic Development Jan. - June 2003

This suggests that at times of economic crisis and recession, these householdmembers proportionately reduce cash expenditures on health care more than thelow-income group. One of the more interesting questions concerning this researchhas to do with health care as a luxury good. Economists define a luxury good as onethat has income elasticity above + 1.00. Health care is considered to be a luxurygood for upper income people only in the case of treatment of LTM. If the aggregateincome elasticity of health expenditure, and drugs and medicines expenditure areabove + 1.00, this may provide a demand-side explanation as to why health careexpenditure as a proportion of household income has increased at any point oftime. As the household economy grew over the years and real per capita incomeexpanded, the households allocated a greater proportion to health care because it isa luxury good especially for the upper income group in treating LTM.
Health care could also be considered a normal good since the values ofincome elasticity are positive for the upper and lower income groups on treatingLTM and STM, respectively. It means that even with the values of an incomeinelasticity, increase in income leads to an increase in health expenditure of theupper and lower income groups on treating LTM and STM, respectively. Theresults also indicate that with macro-economic shocks, households are likely toadjust their total health care expenditure, and expenditures on drugs and medicine.The pattern of adjustment will differ by income group and by health-benefit coverageof the population. The findings also indicate the importance of health benefit fromother source of the household members determining drugs and medicinesexpenditure on health care for treating STM, which is an indication of thedetermination of labour market participation in the formal or informal sector ofemployment.
The results also suggest that households incur more total healthexpenditure in general and spend on drugs and medicines in particular to get treatedfrom the formal health care provider in the rural areas. It is an important issue inhealth care planning and financing such an income inelastic situation of the lowerincome rural households in relation to total health expenditure and expenditure ondrugs and medicines in India. It is important also because of the low availabilityand accessibility of drugs in the rural areas in India. Thus, there is a need forproviding protection to the lower income people in terms of supplying qualityhealth care by the government. The much discussed policy options of recentgovernments are social security schemes for the rural poor and opening up of theinsurance sector to private partnership, which includes more options to the voluntaryhealth insurance schemes in India (Krishnan 1996; Mathiyazhagan 1994, 1995; GOI2003). The successive central governments failed to design effective social securityschemes for the rural poor. However, the government of India has opened up theinsurance sector to private partnership for providing voluntary health insurance
Vol. V, No.1 Mathiyazhagan: Rural Household Characteristics & Health Expenditure 87

schemes. Indeed, currently sixteen private partnership insurance companies alongwith government traditional insurance companies are competing with each other toattract more people into the insurance fold. The voluntary health insurance throughexisting government insurance companies and ensuing recent private healthinsurance companies will concentrate only on the economically powerful segmentof the population in India. The socially and economically deprived population inthe rural areas will not gain more from this kind of scheme. In this context,government should recognize the willingness of the people to pay for the ruralhealth insurance scheme through community participation with the help of NGOsand Panchayat (village) level administration, which proved to be feasible in ruralareas of Karnataka State in India (Mathiyazhagan 1998). Indeed, there is a need fora national-level rural household survey in order to assess the viability of the ruralhealth insurance scheme through community participation in India, which could bemanaged at the decentralised level (i.e., village panchayat administration). Thismay enhance the accessibility and availability of quality-oriented health careservices to the lower income households, who are working in the unorganisedsector in the rural areas.
Notes
1. The expression for the elasticities is: ),(ln221
xββ + where the regression coefficientscorrespond to those of the log-income and the squared log-income terms in the equationrespectively. The elasticity is obtained by evaluating the expression at the mean value ofln x.
References
Deaton, A. (1987). Estimation of Own and Cross-Price Elasticities from Household SurveyData. Journal of Econometrics, 36: 7–30.
Deaton, A., Ruiz-Castillo J., and Thomas D. (1989). The Influence of Household Composi-tion on Household Expenditure Patterns: Theory and Spanish Evidence. Journalof Political Economy, 97: 179–200.
Gaag, J.V.D., and Tania Barham (1998). Health and Health Expenditures in Adjusting andNon-Adjusting Countries. Social Science and Medicine, 46(8): 995–1,009.
Gertler, P., Luis Locay, and Warren Sanderson (1987). Are User Fees Regressive? TheWelfare Implications of Health Care Financing Proposals in Peru. Journal ofEconometrics, 36: 67–88.
Gilson, L., M. Alilio, and K. Heggenhougen (1994). Community Satisfaction with PrimaryHealth Care Services: An Evaluation Undertaken in the Morogoro Region ofTanzania. Social Science and Medicine, 39(6):767–80.
Government of India (2003). Union Budget 2003–2004. New Delhi: Ministry of Finance,Economic Division.
88 Journal of Social and Economic Development Jan. - June 2003
Krishnan, T. N. (1996). Hospitalisation Insurance: A Proposal. Economic and PoliticalWeekly, 31: 944–46.
Maddala, G. S. (1983). Limited Dependent and Qualitative Variables in Econometrics.Cambridge: Cambridge University Press.
Mathiyazhagan, M. K. (1994). Rural Health Insurance Scheme through CommunityParticipation: A Viable Policy Option for India? Health Exchange, No.3 Autumn,October.
———(1995). Financing Health for All: A Case for Viability of Rural Health InsuranceScheme in India. Research Report Submitted to the International Health PolicyProgram of World Bank, Washington D.C., USA.
———(1998). Willingness to Rural Health Insurance Scheme through CommunityParticipation in India. International Journal of Health Planning and Management,13: 47–67.
——— (1999). Choice of Health Care Provider in India (Working Paper 45), Bangalore:Institute for Social and Economic Change.
——— (2001). Drugs and Medicine for the Rural Poor in India: Implications of WTOAgreement and Policy Options. Project Report QAU/EU/11/2001. Bangalore:Institute for Social and Economic Change.
——— (2003). People’s Choice of Health Care Provider: Policy Options for Rural Karnatakain India. Journal of Health Management, 5(1):111–37.
Parker, S.W., and Wong, R. (1997). Household Income and Health Care Expenditures inMexico. Health Policy, 40: 237–55.
Pollack, R.A., and Wales T.J. (1981). Demographic Variables in Demand Analysis.Econometrica, 49: 1,533–59.
Russo, G., Ogawa N., Wandaningsih D., and Sardjunani N. (1993). Household Expendituresfor Health Care in Indonesia: Estimates from the 1987 Socio-Economic Survey,HOMES Indonesia Project, East-West Center, Honolulu, Hawaii.
UNDP (1999). Human Development Report. New York: Oxford University Press.Wensing, M., R. Grol, and A. Smits (1994). Quality Judgements by Patients on General
Practice Care: A Literature Analysis. Social Science and Medicine, 38(1): 45–53.World Bank (1993). Investing in Health. World Development Report. Washington D.C.:
Oxford University Press.World Health Organization (2000). The World Health Report 2000. Health Systems:
Improving Performance. Geneva: WHO.
Vol. V, No.1 Mathiyazhagan: Rural Household Characteristics & Health Expenditure 89
Received: August 20, 2003 Accepted: September 21, 2003

Negative Impacts of Emerging InformalGroundwater Markets in Peninsular India: Reduced
Local Food Security and Unemployment1
H. Diwakara *
N. Nagaraj **
Abstract
In peninsular India, water remains an extremely critical and valuableresource because of its scarcity. Being a semiarid region, demand forirrigation water competes with increasing demands from other sectorssuch as domestic and industrial uses. This paper analyses the impact ofgroundwater transfer from rural to urban areas on local food securityand employment. We argue that groundwater trading from peri-urban tourban centres has led to ‘overdraft of groundwater,’ inflicting damage tothe local economy such as unemployment, out-migration of labourers,and local food insecurity. Based on the results, we propose some policymeasures to regulate groundwater extraction and use via water allocationmanagement plans which issue permissible annual extractions, pricingof water on a pro-rata basis to reflect true cost of water, andencouragement of users’ participation in groundwater conservationthrough watershed development programmes. These regulations shouldbe embedded in local State-based policy evolved under the NationalWater Policy.
Introduction
Surface and sub-surface water bodies are hydrologically interconnectedand the extraction and use is subject to competition from different users and uses.There is tremendous pressure on water, leading to both physical and economicscarcity in India and adverse consequences for ecology, environment and equity.The number of regions in the world where human demand exceeds local watersupplies is growing. Global water use has been growing at more than twice the rate* Ph.D. Scholar, Member, Water Policy and Law Group, School of International Business,
University of South Australia, Adelaide, Australia. Email: [email protected],Phone: +61 8 8302 0749, Facsimile: +61 8 8302 0512
* * Professor, Department of Agricultural Economics, University of Agricultural Sciences,Bangalore, India. Email: [email protected], Phone: +91 8232 39211.Facsimile: +91 80 3330277

of population increase during the last century (United Nations 1997). Thus, waterscarcity could be one of the major factors limiting our ability to increase foodproduction to feed the growing population.
Groundwater has contributed significantly to the development of Indianagriculture, particularly during the last three decades. It has been responsible forattaining food security through the green revolution and commercial farming andpromoting equity. Its exploitation in India is largely in the hands of private individualsand its development has grown explosively over the years. Besides irrigation,groundwater is also an important source of potable water both in urban and in ruralareas (Nagaraj et al. 1999).
In peninsular India, water remains an extremely critical and valuableresource because of its relative scarcity. As India is a semiarid region, demand forirrigation water competes with increasing demands from other sectors such asdomestic and industrial uses besides meeting the ecological needs, thus exacerbatingthe tensions between rural and urban interests. In both urban and rural areas, wateris highly subsidized, not reflecting its true cost. Hence, there has been large inter-temporal and interspatial misallocation of this scarce resource. Owing to the massivesubsidies to the private individual well owners, groundwater is extracted on a largescale and supplied to the competing users in the urban areas, resulting in‘groundwater overmining.’ This unsystematic and rapid development of wellstructures has led to adverse direct and indirect effects from water transfers, leadingto serious overdraft implications — a classic common problem (see McKay 2003).In addition to direct impacts on agricultural production, water transfers cannegatively affect business activities, local government fiscal capacity and the qualityof public services in areas from which water is being transferred because of thereduction in irrigated area or production and associated reduction in agriculturallylinked economic activities (Rosegrant 2000).
The focus of this study is to analyse the economic implications ofgroundwater transfer from rural to urban areas and its impact on local food securityand unemployment. The specific objectives of the study include: (i) Identifying theinterplay of factors promoting water transfers from rural to urban areas; (ii)Assessment of the impact of water transfers through groundwater markets on localfood security and unemployment, and (iii) Analysis of the impact of rural-urbanwater markets on groundwater sustainability. The scope of this paper is to draw theattention of policy makers to regulate the transfer of water through appropriateeconomic instruments such as pricing, taxation as well as regulatory instrumentsvia issuing of permits. There is a need for statewide policy plus regulation of watermarkets in each state. In addition, the study emphasises the need for strong andeffective institutions to manage the water resources at the national and state levels.These bodies should promote groundwater recharge measures to conserve the
Vol. V, No.1 Diwakara & Nagaraj: Emerging Informal Groundwater Markets 91

water resources. We assume that the social benefit is higher if the water is used inagriculture, the assumption being that it ensures food security in this context2. Thehypotheses were made based on the objectives of the study and are presented inthe following table.
Objectives and HypothesesObjectives Hypotheses Reasons
(i) Identifying interplay (i) Water trading is more lucrative (i)The profit per unit of waterof factors promoting than irrigated agriculture. sold is higher than profit fromwater transfer (ii) Access to modern technology irrigated agriculture.
for drilling deeper wells has (ii) Farmers have responded topromoted water transfers. advent of modern drilling techno-(iii) Subsidized electricity has logy. If farmers owned traditionalpromoted water transfers. dug wells they might not have
resorted to water transfer.(iii) Marginal cost of extractionof groundwater is zero, whichleads to unlimited volume ofgroundwater extraction.
(ii) Assessment of the (i) Water transfer affects the local (i) Due to water transfer to urbanimpact of water trans- food security and employment centres agricultural activities arefers on local food opportunities for labourers lower leading to unemploymentsecurity and employ- depending upon agricultural linked for agricultural labourers.ment activities. (ii) Reduced area under agriculture
leads to decline in food grainproduction affecting the local foodsecurity.(iii) People would depend on citymarkets for their food grainrequirements, i.e., ‘dependencysyndrome.’
(iii) Analyse the impact (i) Groundwater overdraft has led (i) Overdraft of groundwater isof rural-urban water to unsustainable use of ground- due to unlimited extraction ofmarket on groundwater water resource. groundwater. This leads tosustainability unsustainability.
This paper is based on a case study conducted in Bangalore rural districtof Karnataka state, which is a typical hard-rock area representing the peninsularparts of India. The study area is located about 10 kilometres from Bangalore city.There is evidence that on account of massive exploitation of groundwater in theperi-urban area the depth of bore wells has been increasing. Over the last five yearsthis has resulted in a decline in well yield (Figure 2). The number of bore wells has
92 Journal of Social and Economic Development Jan. - June 2003
been increasing rapidly (Jagadish 1999) for the last two decades in Bangalore ruraldistrict especially in and around Bangalore city. Further, there has been an increasein the growth of bore wells as the rate of annual growth of bore wells was 2.7 percent (Figure 3). This rapid expansion reflects the signs of overexploitation ofgroundwater resources.
A reconnaissance survey was conducted to identify the intensity of watermarkets in the urban hinterlands and to assess the ground realities regarding thewidth and functioning of groundwater markets among the water sellers in the area.A sample of 30 respondents was chosen randomly for this study. The field datawere collected by primary survey through personal interviews using an open-endquestionnaire. The primary data pertain to the year 2001. Information relating toinvestment on wells and infrastructure required to supply groundwater to commercialestablishments in the city was elicited.
Groundwater exploitation entails a lumpy investment that has to beamortised in order to compute the annual water extraction charges. Accordingly,the investments on well, pump set and conveyance structures have been amortisedto arrive at the annual cost of water supply to which the variable costs are added toget the total cost. The amortisation cost is calculated as follows:
Amortised Cost = Cost of Assets/ 1-(1+i) –n/ i
where, Assets = Bore well, Pump Set and Conveyance Structure, n = the life spansof well, irrigation pump set and conveyance structures, i = the interest rate. Theannual cost of water supply is calculated by adding the variable costs like electricitycharges to the amortised cost. The cost per unit of water is calculated using aformula as follows:
Cost per unit of water = Total cost/ Total volume of water extracted
In this study the average life span of the bore well and the submersiblepump set was considered as 10 years and 20 years respectively. In order to supplywater from source to destination, the water sellers own vehicles embedded with atanker having a capacity ranging from 5,000 to 6,000 litres. The investment on waterconveyance has also been amortised by using an interest rate of 10 per cent 3 andconsidering 20 and 25 years as life span of the vehicle and tank respectively. Theeconomics of groundwater used in agriculture is also worked out.
Rapid Urbanisation and Industrialisation: Pressure on Groundwater
Although groundwater use is mainly confined to the agriculture sector, inrecent years the demand for groundwater use has been increasing at a fast rate due
Vol. V, No.1 Diwakara & Nagaraj: Emerging Informal Groundwater Markets 93

to rapid urbanisation and industrialisation. Consequently, there has been intensivepressure on this vulnerable resource for different uses and users such asconstruction activities, municipal use, urban drinking water needs, and industrialuse, and so on. Thus, groundwater markets provided access to the water needs ofthe urban community. With the emergence of groundwater markets, there has beena rapid expansion of groundwater development both for irrigation and for otheruses. Even though groundwater is considered a renewable resource, due to theindispensable nature, absence of substitute sources, and ever-increasing demandfor agricultural and urban needs, the rate of extraction is surpassing the natural rateof recharge in most of the semi-arid areas4. In areas where there is no assuredsource of surface water it has led to the depletion of this valuable resource.
Results and Discussion
Allocation of Groundwater for Different PurposesIn the recent past, demand for groundwater use has been growing at a
faster rate due to rapid urbanisation and industrialisation. Consequently, waterusers are competing between activities such as construction, hotel, drinking water,and industrial use. Considering the proportion of groundwater allocated to differentpurposes, a large proportion of the groundwater has been allocated to non-agricultural purposes (90 per cent). Thus, there has been a paradigm shift in thewater allocation in peri-urban areas from agricultural to non-agricultural use. It wasevident that only a small proportion of groundwater extracted was allocated toagriculture (10 per cent). It has also been observed that non-agricultural activitiesare competing with agriculture for groundwater use around urban centres. Thisclearly indicates that rapid urbanisation has led to increased groundwater demandfrom the urban community. Thus, the groundwater markets served as an instrumentfor the water needs of the urban community (Figure 1).
Figure 1: Allocation of Groundwater for Different Purposes
Hotel22%
Drinking20%
Agriculture10%Construction
30%
Industries 18%
94 Journal of Social and Economic Development Jan. - June 2003
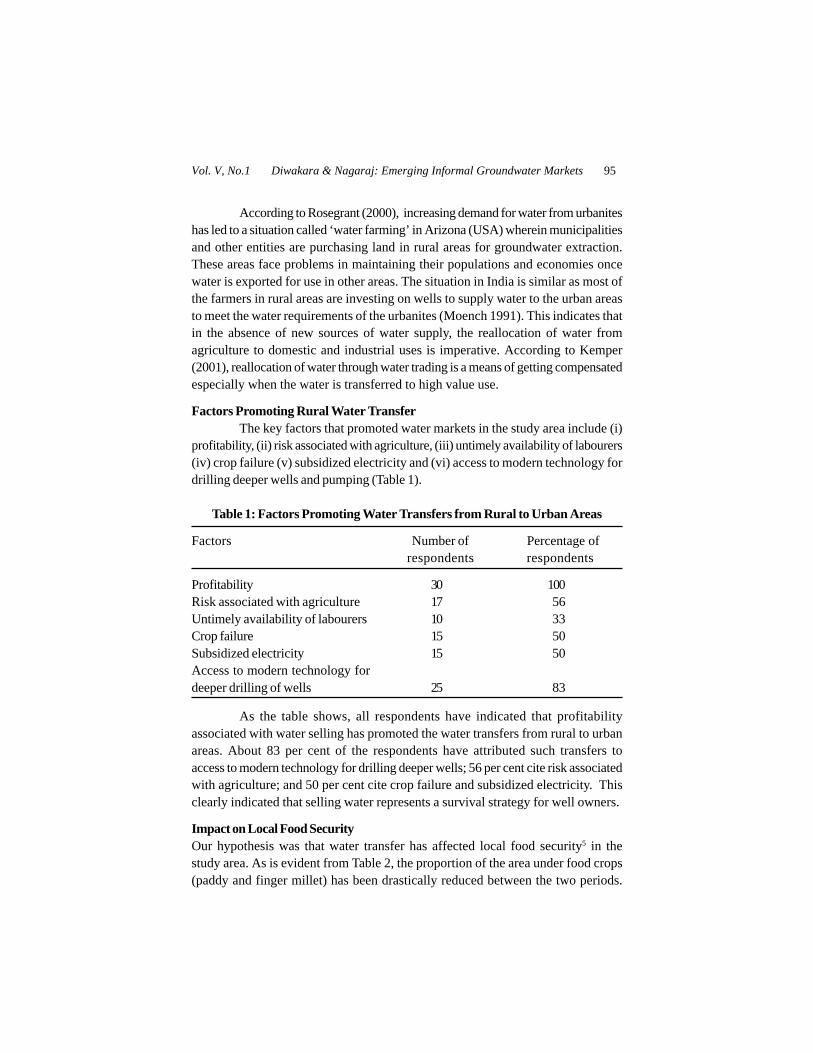
According to Rosegrant (2000), increasing demand for water from urbaniteshas led to a situation called ‘water farming’ in Arizona (USA) wherein municipalitiesand other entities are purchasing land in rural areas for groundwater extraction.These areas face problems in maintaining their populations and economies oncewater is exported for use in other areas. The situation in India is similar as most ofthe farmers in rural areas are investing on wells to supply water to the urban areasto meet the water requirements of the urbanites (Moench 1991). This indicates thatin the absence of new sources of water supply, the reallocation of water fromagriculture to domestic and industrial uses is imperative. According to Kemper(2001), reallocation of water through water trading is a means of getting compensatedespecially when the water is transferred to high value use.
Factors Promoting Rural Water TransferThe key factors that promoted water markets in the study area include (i)
profitability, (ii) risk associated with agriculture, (iii) untimely availability of labourers(iv) crop failure (v) subsidized electricity and (vi) access to modern technology fordrilling deeper wells and pumping (Table 1).
Table 1: Factors Promoting Water Transfers from Rural to Urban Areas
Factors Number of Percentage ofrespondents respondents
Profitability 30 100Risk associated with agriculture 17 56Untimely availability of labourers 10 33Crop failure 15 50Subsidized electricity 15 50Access to modern technology fordeeper drilling of wells 25 83
As the table shows, all respondents have indicated that profitabilityassociated with water selling has promoted the water transfers from rural to urbanareas. About 83 per cent of the respondents have attributed such transfers toaccess to modern technology for drilling deeper wells; 56 per cent cite risk associatedwith agriculture; and 50 per cent cite crop failure and subsidized electricity. Thisclearly indicated that selling water represents a survival strategy for well owners.
Impact on Local Food SecurityOur hypothesis was that water transfer has affected local food security5 in thestudy area. As is evident from Table 2, the proportion of the area under food crops(paddy and finger millet) has been drastically reduced between the two periods.
Vol. V, No.1 Diwakara & Nagaraj: Emerging Informal Groundwater Markets 95

The productivity of food crops has reduced to the extent of 63 per cent, reflectingthe loss of income from agriculture to the extent of 77 per cent respectively. It alsoindicated that the agricultural labourers have lost employment opportunities to theextent of 65 per cent owing to reduction in the area under cultivation (Table 2).
Table 2: Impact of Water Transfers on Local Food Security
Particulars Before water After watertransfer (acres) transfer (acres)
Food cropsArea (acres) 4 1 (25)Yield (quintals) 80 30 (37)Labour employment (man days) 100 35 (35)Income from crops (Rs.) 29,999 4,972 (23)Commercial cropsArea (acres) 2 0Yield (quintals) 20 0Labour employment (man days) 50 0Income from crops (Rs.) 10,000 0Perennial cropsArea (acres) 1 1Yield (Number of nuts) 2,000 500Labour employment (man days) 50 15Income from perennial crops (Rs.) 8,000 2,000
Note: Figures in parentheses indicate percentage of the total.
This has severe implications for the equity and employment opportunitiesfor the agricultural labourers in this area. In addition, there has been out-migrationof the labourers to the urban areas in search of employment opportunities. Incomefrom crop enterprise has drastically fallen as a result of the groundwater transfer.Similarly, the irrigated area under commercial crops (tomato and brinjal) has fallendrastically. Thus on account of water transfers, the area under both food andcommercial crops has reduced. Owing to this, farmers in the area are fully dependenton urban markets for food grain requirements, causing local food insecurity in thearea. With the dipping of agricultural activities in the locality, there has been agreater degree of ‘dependency syndrome’ for food. The groundwater transfer alsoaffected the agriculturally linked activities. A study by Rosegrant (2000) indicatedthat groundwater transfer negatively affects business activities; local governmentfiscal capacity and quality of public services in areas from which water is beingtransferred because of the reduction in agriculturally linked economic activities. In
96 Journal of Social and Economic Development Jan. - June 2003
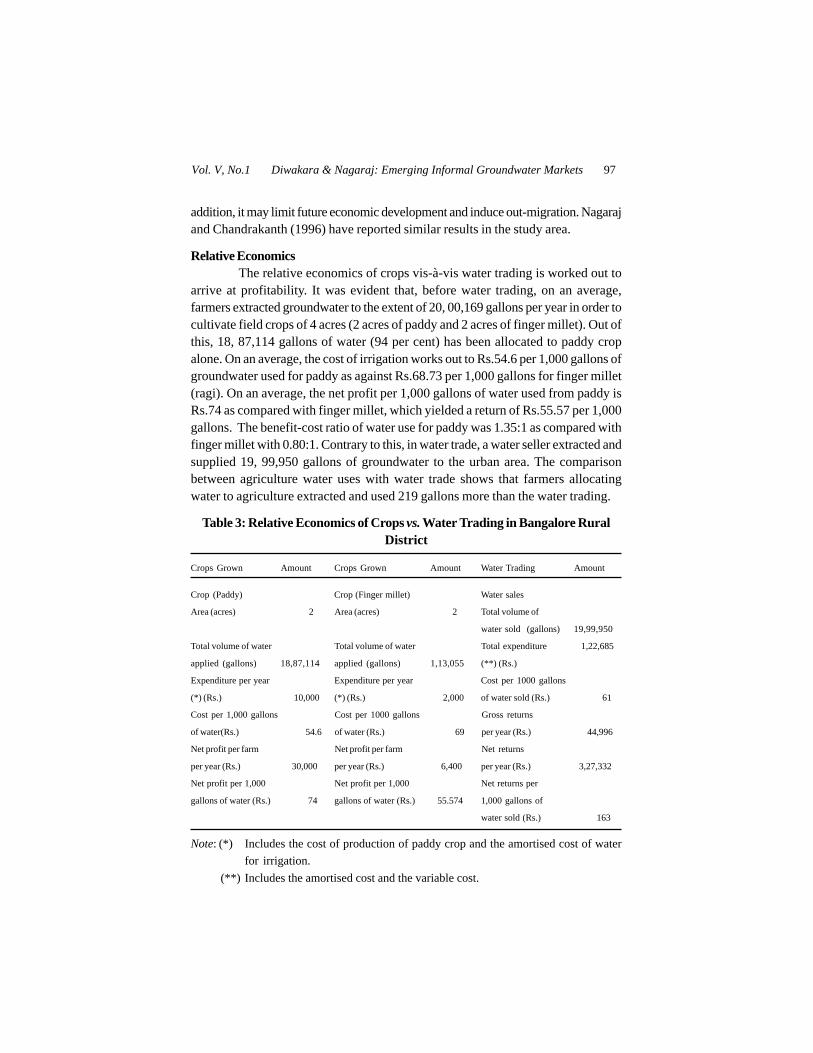
addition, it may limit future economic development and induce out-migration. Nagarajand Chandrakanth (1996) have reported similar results in the study area.
Relative EconomicsThe relative economics of crops vis-à-vis water trading is worked out to
arrive at profitability. It was evident that, before water trading, on an average,farmers extracted groundwater to the extent of 20, 00,169 gallons per year in order tocultivate field crops of 4 acres (2 acres of paddy and 2 acres of finger millet). Out ofthis, 18, 87,114 gallons of water (94 per cent) has been allocated to paddy cropalone. On an average, the cost of irrigation works out to Rs.54.6 per 1,000 gallons ofgroundwater used for paddy as against Rs.68.73 per 1,000 gallons for finger millet(ragi). On an average, the net profit per 1,000 gallons of water used from paddy isRs.74 as compared with finger millet, which yielded a return of Rs.55.57 per 1,000gallons. The benefit-cost ratio of water use for paddy was 1.35:1 as compared withfinger millet with 0.80:1. Contrary to this, in water trade, a water seller extracted andsupplied 19, 99,950 gallons of groundwater to the urban area. The comparisonbetween agriculture water uses with water trade shows that farmers allocatingwater to agriculture extracted and used 219 gallons more than the water trading.
Table 3: Relative Economics of Crops vs. Water Trading in Bangalore RuralDistrict
Crops Grown Amount Crops Grown Amount Water Trading Amount
Crop (Paddy) Crop (Finger millet) Water sales
Area (acres) 2 Area (acres) 2 Total volume of
water sold (gallons) 19,99,950
Total volume of water Total volume of water Total expenditure 1,22,685
applied (gallons) 18,87,114 applied (gallons) 1,13,055 (**) (Rs.)
Expenditure per year Expenditure per year Cost per 1000 gallons
(*) (Rs.) 10,000 (*) (Rs.) 2,000 of water sold (Rs.) 61
Cost per 1,000 gallons Cost per 1000 gallons Gross returns
of water(Rs.) 54.6 of water (Rs.) 69 per year (Rs.) 44,996
Net profit per farm Net profit per farm Net returns
per year (Rs.) 30,000 per year (Rs.) 6,400 per year (Rs.) 3,27,332
Net profit per 1,000 Net profit per 1,000 Net returns per
gallons of water (Rs.) 74 gallons of water (Rs.) 55.574 1,000 gallons of
water sold (Rs.) 163
Note: (*) Includes the cost of production of paddy crop and the amortised cost of waterfor irrigation.
(**) Includes the amortised cost and the variable cost.
Vol. V, No.1 Diwakara & Nagaraj: Emerging Informal Groundwater Markets 97

The average cost per 1,000 gallons of water extracted for water trading isRs.61 (including the amortised investment on well) and a net profit of Rs.163 per1,000 gallons was realised. The benefit cost ratio was 2.67:1. This clearly indicatesthat farmers supplying water to urban areas are realising substantially more netprofit compared with farmers allocating groundwater for growing crops. Thisindicated that water trading has been more lucrative than irrigated farming. Thoughthe return per unit of water is high in the case of water trading compared withagriculture, the true cost of water is not reflected in the water price6. As indicated byRosegrant (2000), water markets have been facilitated through broadening marketsfor water to urban areas, leading to a secular decline in the water table, inflictingeconomic damage to the production system. However, it is not groundwater marketsalone that are responsible for over-extraction but also agriculture, which demandsmore water for growing crops, as indicative from the results, as a large quantity ofgroundwater has been allocated for paddy crop alone.
Economics of Water TradeThe economics of water trade in Bangalore rural area (Table 4) indicated
that on an average the amortised cost of well and vehicle and conveyance structureswas Rs.72,540 per year. Out of the total investments on well development, the costof exploration forms a meagre 3 per cent. Similarly, electricity service forms 4 percent, pump set 4 per cent and pump house 3.2 per cent, and investment on overheadtanker forms 8 per cent. The investment on vehicle forms 84 per cent of the totalinvestment made. This indicates that though water trading is capital-intensive, thereturn per rupee of investment is quite high compared with the returns per rupee ofinvestment from agriculture. This was one of the reasons for water trading. Thevariable cost incurred for water trading is Rs.54,147.60 (including electricity charges,salary to driver and helper required for a water tanker, and vehicle and pump repair,painting of vehicle, diesel cost and road tax).
It was evident that the average groundwater extracted per day was about13,333 gallons (60,000 litres). The total investment made was Rs.6,17,565 per waterseller. On an average, the cost incurred to extract and supply 13,333 gallons of waterper day works out to Rs.370 (including Rs.125 salary of a driver + Rs.35 salary of ahelper + Rs.210 towards electricity charge).
During a calendar year, groundwater sellers have been actively involvedin water trading for 150 days and the peak period of water selling has been duringthe summer mostly to meet the urban water demand for drinking, construction andindustrial uses.
98 Journal of Social and Economic Development Jan. - June 2003
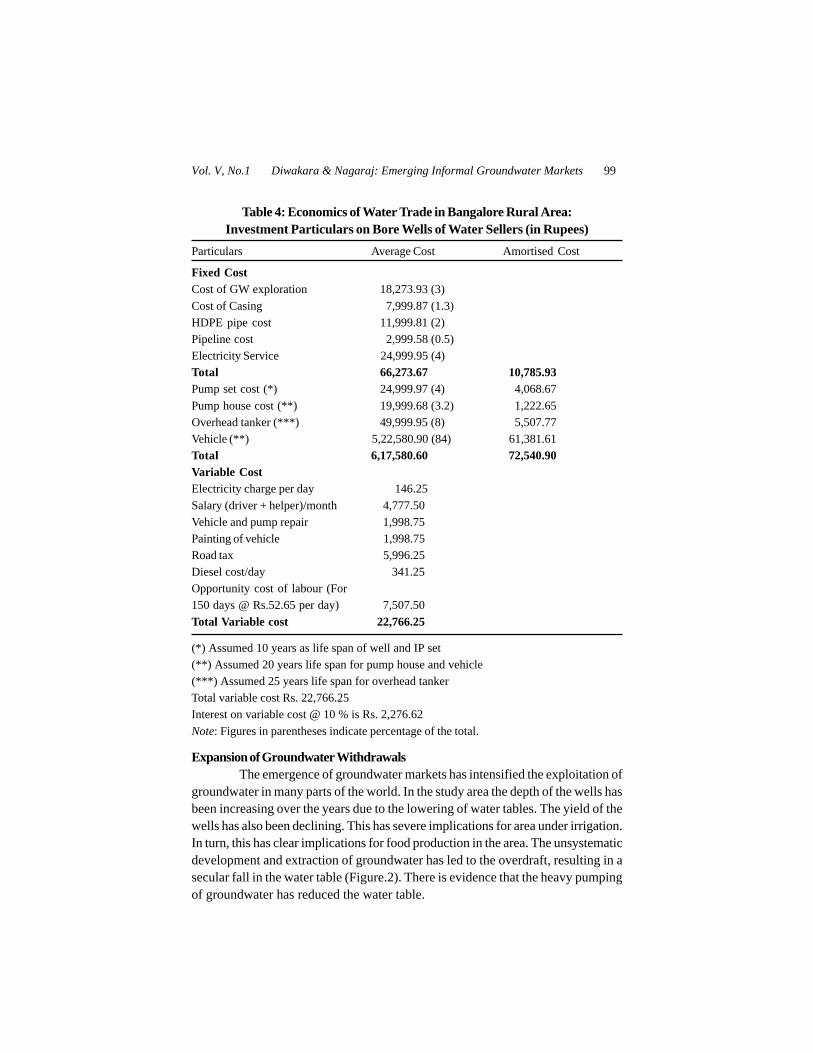
Table 4: Economics of Water Trade in Bangalore Rural Area:Investment Particulars on Bore Wells of Water Sellers (in Rupees)
Particulars Average Cost Amortised Cost
Fixed CostCost of GW exploration 18,273.93 (3)Cost of Casing 7,999.87 (1.3)HDPE pipe cost 11,999.81 (2)Pipeline cost 2,999.58 (0.5)Electricity Service 24,999.95 (4)Total 66,273.67 10,785.93Pump set cost (*) 24,999.97 (4) 4,068.67Pump house cost (**) 19,999.68 (3.2) 1,222.65Overhead tanker (***) 49,999.95 (8) 5,507.77Vehicle (**) 5,22,580.90 (84) 61,381.61Total 6,17,580.60 72,540.90Variable CostElectricity charge per day 146.25Salary (driver + helper)/month 4,777.50Vehicle and pump repair 1,998.75Painting of vehicle 1,998.75Road tax 5,996.25Diesel cost/day 341.25Opportunity cost of labour (For150 days @ Rs.52.65 per day) 7,507.50Total Variable cost 22,766.25
(*) Assumed 10 years as life span of well and IP set(**) Assumed 20 years life span for pump house and vehicle(***) Assumed 25 years life span for overhead tankerTotal variable cost Rs. 22,766.25Interest on variable cost @ 10 % is Rs. 2,276.62Note: Figures in parentheses indicate percentage of the total.
Expansion of Groundwater WithdrawalsThe emergence of groundwater markets has intensified the exploitation of
groundwater in many parts of the world. In the study area the depth of the wells hasbeen increasing over the years due to the lowering of water tables. The yield of thewells has also been declining. This has severe implications for area under irrigation.In turn, this has clear implications for food production in the area. The unsystematicdevelopment and extraction of groundwater has led to the overdraft, resulting in asecular fall in the water table (Figure.2). There is evidence that the heavy pumpingof groundwater has reduced the water table.
Vol. V, No.1 Diwakara & Nagaraj: Emerging Informal Groundwater Markets 99
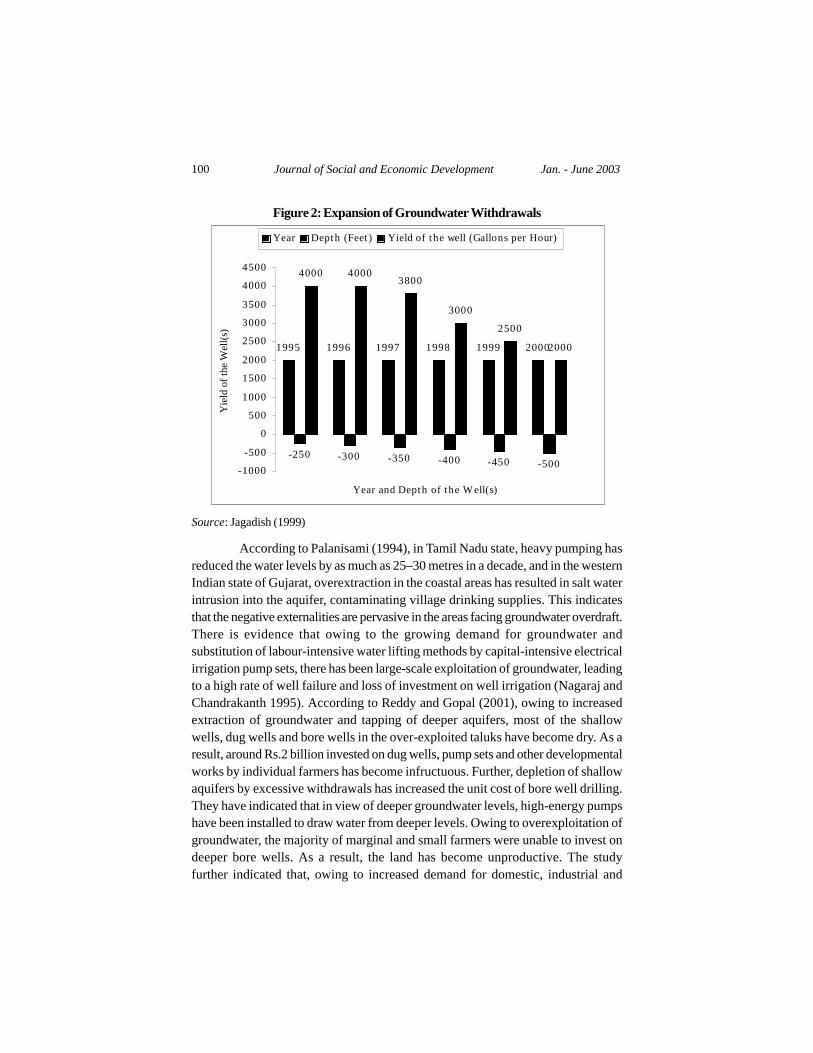
Figure 2: Expansion of Groundwater Withdrawals
Source: Jagadish (1999)
According to Palanisami (1994), in Tamil Nadu state, heavy pumping hasreduced the water levels by as much as 25–30 metres in a decade, and in the westernIndian state of Gujarat, overextraction in the coastal areas has resulted in salt waterintrusion into the aquifer, contaminating village drinking supplies. This indicatesthat the negative externalities are pervasive in the areas facing groundwater overdraft.There is evidence that owing to the growing demand for groundwater andsubstitution of labour-intensive water lifting methods by capital-intensive electricalirrigation pump sets, there has been large-scale exploitation of groundwater, leadingto a high rate of well failure and loss of investment on well irrigation (Nagaraj andChandrakanth 1995). According to Reddy and Gopal (2001), owing to increasedextraction of groundwater and tapping of deeper aquifers, most of the shallowwells, dug wells and bore wells in the over-exploited taluks have become dry. As aresult, around Rs.2 billion invested on dug wells, pump sets and other developmentalworks by individual farmers has become infructuous. Further, depletion of shallowaquifers by excessive withdrawals has increased the unit cost of bore well drilling.They have indicated that in view of deeper groundwater levels, high-energy pumpshave been installed to draw water from deeper levels. Owing to overexploitation ofgroundwater, the majority of marginal and small farmers were unable to invest ondeeper bore wells. As a result, the land has become unproductive. The studyfurther indicated that, owing to increased demand for domestic, industrial and
1995 1996 1997 1998 1999 2000
-250 -300 -350 -400 -450 -500
4000 40003800
3000
2500
2000
-1000
-500
0
500
1000
1500
2000
2500
3000
3500
4000
4500
Year and Depth of the W ell(s)
Yie
ld o
f the
Wel
l(s)
Year Depth (Feet ) Yield of the well (Gallons per Hour)
100 Journal of Social and Economic Development Jan. - June 2003
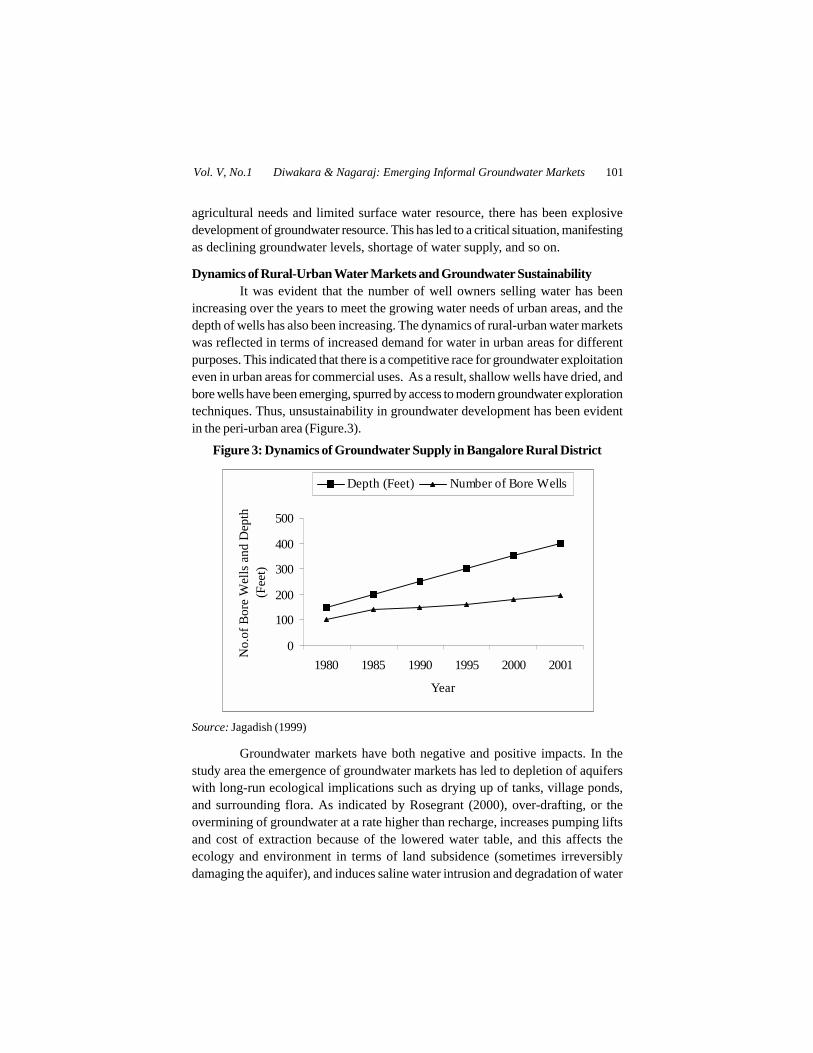
agricultural needs and limited surface water resource, there has been explosivedevelopment of groundwater resource. This has led to a critical situation, manifestingas declining groundwater levels, shortage of water supply, and so on.
Dynamics of Rural-Urban Water Markets and Groundwater SustainabilityIt was evident that the number of well owners selling water has been
increasing over the years to meet the growing water needs of urban areas, and thedepth of wells has also been increasing. The dynamics of rural-urban water marketswas reflected in terms of increased demand for water in urban areas for differentpurposes. This indicated that there is a competitive race for groundwater exploitationeven in urban areas for commercial uses. As a result, shallow wells have dried, andbore wells have been emerging, spurred by access to modern groundwater explorationtechniques. Thus, unsustainability in groundwater development has been evidentin the peri-urban area (Figure.3).
Figure 3: Dynamics of Groundwater Supply in Bangalore Rural District
Source: Jagadish (1999)
Groundwater markets have both negative and positive impacts. In thestudy area the emergence of groundwater markets has led to depletion of aquiferswith long-run ecological implications such as drying up of tanks, village ponds,and surrounding flora. As indicated by Rosegrant (2000), over-drafting, or theovermining of groundwater at a rate higher than recharge, increases pumping liftsand cost of extraction because of the lowered water table, and this affects theecology and environment in terms of land subsidence (sometimes irreversiblydamaging the aquifer), and induces saline water intrusion and degradation of water
0
100
200
300
400
500
1980 1985 1990 1995 2000 2001
Year
No.
of B
ore
Wel
ls a
nd D
epth
(F
eet)
Depth (Feet) Number of Bore Wells
Vol. V, No.1 Diwakara & Nagaraj: Emerging Informal Groundwater Markets 101

quality in the aquifer. In contrast, groundwater markets increase the access togroundwater of those who lack such access.
In areas where groundwater scarcity is acute and monopolistic situationprevails, farmers use this precious resource in a sustainable manner by opting fordifferent water management strategies. Thus, groundwater markets could be usefulinstruments for users to conserve water. Briscoe (1997) argues that it may not beappropriate at this stage to advertise that the groundwater markets are ‘silver bullets’,which affect sustainability, but groundwater markets are one of the strategies toincrease the access to water resources.
Conclusion and Policy Implications
The key factors that promoted water markets include profitability fromwater selling, risk associated with agriculture, untimely availability of labourers,crop failure, subsidized electricity, and access to technology for drilling deeperwells and pumping. The water markets are informal and localised, and the nature ofcompetition resembles an oligopoly.
The irrigated area under food crops has drastically reduced, causing localfood insecurity. There has been out-migration of labour to the urban areas owing toloss of employment in the agriculture sector. There has been a secular decline of thewater table owing to groundwater overexploitation, resulting in land degradation,drying of lakes and irrigation tanks with severe implications for the ecology andenvironment.
The benefit-cost ratio of water use for paddy was 1.35:1, whereas ingroundwater sale it was 2.67:1. Considering the alternative uses of groundwater,farmers would prefer groundwater sale to urban commercial establishments overirrigated agriculture. This clearly shows that water trading has been more lucrativethan irrigated farming in view of associated risks in agriculture. The positive aspectof water transfer from rural to urban areas is that farmers are earning relatively moreprofit from water trading than from agriculture. Though this increases the farmers’ability to purchase the required food grains from the urban centres, the plight of theagricultural labourers who depend on agriculturally linked activities will not beresolved. Therefore, there is a trade-off in rural-urban water transfer. This trade-offhas resulted in converting agriculture to a situation called ‘lucrative water selling’business to reap the larger net returns per gallon of groundwater extracted.
Based on the results, we outline the policy implications of the study. Thegroundwater transfers from rural to urban centres have large negative impacts onrural economy in terms of unemployment to agricultural labourers, out-migration oflabour to the city in search of employment, and local food insecurity problems. Atpresent there is no appropriate regulation for groundwater extraction and use in
102 Journal of Social and Economic Development Jan. - June 2003

India. In this regard, there is a dire need to regulate groundwater extraction and usethrough appropriate policy measures such as
• issuing permits to drill wells. Given the scarcity of groundwater resourceespecially in peninsular India, permission to drill wells is a challenging task.The responsibility of issuing such permits could be with the state groundwaterboard or state groundwater authorities,
• issuing annual permissible extractions; this can be done through water resourcesplans or water allocation management plans. There is evidence in Australia forwater allocation management plans (WAMP). For instance in Queensland, theWAMP is designed to provide a framework for clearly establishingenvironmental flows, water allocations and the resource management conditionsunder which trading of water allocations occurs (McKay 2002). The WAMPdetermines the volume of water that can be allocated to an individual wellowner. This would restrict farmers from extracting an unlimited volume ofgroundwater resource as WAMP defines the volume of water allocations,
• pricing of electricity on pro-rata basis. This is an important issue because theexisting flat rate of electricity has led to unlimited extraction of groundwater. Inorder to promote efficiency in water use and to put scarce water to high valueuse the price of the water should reflect true cost. Therefore, the price ofelectricity should be on pro-rata basis,
• defining clear property rights to groundwater resource use. At present, there isno single regulation in India defining property rights to groundwater resource.In the absence of clear property rights to groundwater the sustainability ofgroundwater resource cannot be achieved. It is apparent that groundwaterdevelopment is under private ownership regime and the legal status in terms ofde jure rights is not transparent. Singh (1995) indicated that India initiated theGroundwater (Control and Regulation) Bill in 1970 and revalidated it in 1992 toregulate and control the development of groundwater. This draft bill has beenpresented in the legislature of several states (except Gujarat and Maharashtra)but has never been approved (Nagaraj et al. 1999). This indicates that forobvious political reasons water policies have failed to make a discernible impact.At present, the only mechanism for the state to check overexploitation ofgroundwater resource is the imposition of restrictions on finance throughNational Bank for Agriculture and Rural Development (NABARD) for welldevelopment in overexploited areas. However, this fails to check privatelyfinanced wells. In this direction, there is a dire need for Federal government toenact appropriate regulation to define the property rights to groundwaterresource,
• encourage users’ participation in groundwater management programmesthrough formation of water users’ associations and co-operatives and
Vol. V, No.1 Diwakara & Nagaraj: Emerging Informal Groundwater Markets 103
• conservation of groundwater resource; keeping in view the sustainable use ofgroundwater, there is a need to conserve the scarce resource through jointefforts to achieve intra- and inter-generational equity. This can be achievedthrough watershed development programmes. Regulations so devised willthen be able to serve a larger section of the community (equity) and will enablesustainability of groundwater resource use. We propose that these regulationsbe embedded in the national water policy.
Notes
1. This research paper was presented at the 11th Stockholm Water Symposium, Stockholm,Sweden, during August 2001. The authors would like to thank an anonymous reviewer forvaluable comments on an earlier draft of this paper. Our thanks are due to Jagadish, K. N.,Department of Agricultural Economics, UAS, GKVK, Bangalore, for his help during ourprimary data collection. We also thank Prof. Jennifer McKay, Director, Water Policy andLaw Group, School of International Business, University of South Australia, for hervaluable comments, and Dr. Lalith Achoth, University of Agricultural Sciences, Bangalore.
2. This assumption may not always be true. However, our understanding is that if thegroundwater was used in agriculture it would have resulted in higher food grain production,which ensures local food security.
3. The opportunity cost of capital is considered as 10 per cent.4 This clearly indicates the unsustainability of groundwater resource use. Nagaraj, et al.
(1999) defines unsustainability of groundwater thus: ‘when there is mining of groundwaterbeyond the natural rates of recuperation, it would lead to unsustainability of the resourcein the long run.’
5. Food security is defined as ‘access to food’ and one’s ability to afford it. However, thereis more to this as we argue that, though farmers who sell water are enjoying higher benefits(private benefits), they depend on the urban centres for their food grain requirement. This‘dependency syndrome’ affects the people depending on agricultural activities for theirlivelihood such as agricultural labourers. Given the low wage rates they cannot afford toget their food from cities. This has resulted in local food insecurity.
6. Because the marginal cost of groundwater extraction is zero due to flat rate of electricitycharge. This has led to unlimited extraction of groundwater, which is sold to urban entities,and no environmental costs.
References
Briscoe, John (1997). Managing Water as an Economic Good: Rules for Reformers. TheInternational Committee on Irrigation and Drainage Conference on Water as anEconomic Good. Oxford. September.
Jagadish, K.N. (1999). Issues in Rural and Urban Groundwater Markets. Seminar Report,
104 Journal of Social and Economic Development Jan. - June 2003
Department of Agricultural Economics, University of Agricultural Sciences, GKVK,Bangalore, India.
Kemper, E. Karin (2001). Markets for Tradable Water Rights, Overcoming Water Scarcityand Quality Constraints, Focus 9 Brief 3 of 14 October 2001. In Meinzen-Dickand Rosegrant (ed.). International Food Policy Research Institute. WashingtonD.C., USA.
McKay, Jennifer (2002). Legal Institutions and Regulatory Models in Privatisation of WaterUtilities in Australia. In S. Bogdanovi (ed.). Regional Conference on Water Law,Legal Aspects of Sustainable Water Resources Management, Bosnia andHerzegovina, 14 –18 May.
McKay, Jennifer (2003). Marketisation in Australian Freshwater and Fisheries ManagementRegimes. In S. Dovers and S.W. River (ed.). Managing Australia’s Environment.The Federation Press. Australia.
Moench, M. (1991). Sustainability, Efficiency and Equity in Groundwater Development:Issues in India and Comparison with the Western US. The Pacific Institute forStudies in Development Environment and Security. Berkeley, California, USA.
Nagaraj, N., and M.G. Chandrakanth (1995). Low Yielding Irrigation Wells in PeninsularIndia: An Economic Analysis. Indian Journal of Agricultural Economics, 50(1):47–58.
Nagaraj, N., and M.G.Chandrakanth (1996). Intra and Inter-generational Equity Effects ofIrrigation Well Failures — Farmers in Hard Rock Areas of India. Economic andPolitical Weekly, 29: A41–A44.
Nagaraj, N, Frasier, W. Marshall and R.K. Sampath (1999). Groundwater Institutions inUS and India: Sustainable and Equitable Resource Use. Economic and PoliticalWeekly, 34: A93–A104.
Palanisami, K. (1994). Cost of Water in Different Uses in Bhavani Basin. Paper presented atthe Policy Advisory Committee Meeting in the Sharing of Common Water Resourcesin Bhavani Basin. Madras Institute of Development Studies, February 18, India.
Reddy, Basappa, and Gopal, Venu, T.N. (2001). Sustainable Development of GroundwaterResources in Karnataka, India in 21st Century. Paper presented at the InternationalConference on Sustainable Development of Water in 21st Century, Singapore.
Rosegrant, W. Mark (2000). Water Resources in the Twenty-First Century: Challenges andImplications for Action, IFPRI, Discussion paper No. 20, International FoodPolicy Research Institute, Washington D.C.
Singh, C. (1995). Research Agenda for Groundwater Law in India. In Moench (ed.)Groundwater Law: The Growing Debate. VIKSAT, Ahmedabad, pp.175–179.
United Nations (1997). Comprehensive Assessment of the Freshwater Resources of theWorld, Stockholm Environment Institute and World Meteorological Organization.
Vol. V, No.1 Diwakara & Nagaraj: Emerging Informal Groundwater Markets 105
Received: May 26, 2003 Accepted: August 18, 2003

Environment and Natural Resources in OrissaShibalal Meher ∗∗∗∗∗
Abstract
The environment of Orissa has been adversely affected by the degrada-tion of natural resources in the state. Not only have the different pat-terns of development in the state led to the degradation of these naturalresources but also other factors like growth of population, poverty level,and unsustainable activities adopted by the poor and the rich have be-come crucial for the degradation of valuable natural resources in thestate. The adoption of unsustainable activities is, however, driven bythe market, institutional and policy failures.
Introduction
The environment of a region depends on the status of its natural resources.The growth process causes continuous depletion and degradation of naturalresources. As long as economic activities in a region are below the regenerativecapacity of the natural environment, there is no secular decline in the quality andquantity of natural resources. The problem arises, however, when these limits arecrossed and when secular decline in the quality and quantity of natural resourcestakes place. The problem can arise in two respects: First, when natural resourcesare overused, that is the rate of use is more than the rate of regeneration, and second,when the discharges from economic activities are more than the abating capacity ofnature (Hirway and Mahadevia 1999). In both the cases, natural resources aredepleted, degraded or polluted, which puts a limit on the sustainability of the growthprocess. This limit is more in the case of non-renewable natural resources than inthe case of renewable natural resources.
The natural resources of Orissa, a poor and backward state in India, havebeen degraded over time. During the last 30 years, the state has lost its forest cover,its agricultural land has been degraded, and rivers and lakes have become polluted.In short, Orissa’s environment has been under attack. While economic developmenthas created some dynamism, the state has at the same time become less ecologicallydiverse, and more environmentally vulnerable. After giving a brief account ofdifferent ecological regions and their diversity, the present paper attempts to presentthe current state of Orissa’s environment and to examine the causes of degradation.∗ Lecturer in Economics, Nabakrushna Choudhury Centre for Development Studies,Bhubaneswar 13. E-mail: [email protected]; [email protected] author is thankful to Indira Hirway, Piet Terhal, and G.C. Kar, and the anonymousreferee for their useful comments on an earlier draft of the paper.
Ecological Regions and Diversity
Orissa, located on the east coast of India, is surrounded by West Bengalto the north-east, Bihar to the north, Madhya Pradesh to the west, Andhra Pradeshto the south and the Bay of Bengal to the east. The state has an area of 1,55,707 sq.kms (4.74 per cent of the total area of the country) and ranks tenth in the country. Itlies in the tropical zone and can be broadly divided into four distinct natural/ecological regions, viz. the Coastal Plains, the Central Tableland, the NorthernPlateau and the Eastern Ghat region.
The coastal plains are the gifts of six major rivers, which bring silt fromtheir catchment and have reclaimed this area from the depths of the Bay of Bengal.About one–fourth of the state’s total area lies in this region. The districts (undivided)in this region are Ganjam, Puri, Cuttack and Balasore. Owing to a number of deltasformed by rivers, this region is characterised by high agricultural productivity andwell-developed infrastructure. The climate of this region is greatly influenced bythe sea and, therefore, differs from that of the other three regions. Alluvial soil ismainly found in this region. This soil has high agricultural potentiality.
The Northern Plateau consists of three districts, viz., Mayurbhanj, Keonjharand Sundargarh. It slopes from north to south, is undulated and frequently intersectedby hill ranges. The land of this region is not fertile but minerals are found in plenty.The uplands are the plateau, hilly and thickly forested. The climate here is hot, withhigh humidity and well-distributed rainfall during the monsoon period. This regioncovers less than one-fifth of the state’s total area. The main types of soil in thisregion are red and yellow soils. Red soil is comparatively less fertile than alluvialsoil.
About one-fourth of the state’s total area lies in the Central Tablelandregion. This region covers three undivided districts, viz. Sambalpur, Bolangir andDhenkanal. This tract lies between the Northern Plateau and Eastern Ghat and hasa number of isolated hills, which rise abruptly from the plains. The climate here isextremely hot and dry in summer, hot and humid in the rainy season, and dry andcold in winter. Three types of soils, viz., red, black, and yellow, are found in thisregion.
The Eastern Ghat region covers three undivided districts, viz. Koraput,Kalahandi and Phulbani, and about one-third of the state’s total area lies in it.Thick and valuable forest covers the region, and hills of this tract have the highestpeaks in the state. Most parts of this region have an elevation of 900 metres actingas watershed of the two sets of river, one set (namely the Nagabali and theVansadhara) flowing directly into the Bay of Bengal, and the other set feeding theGodavari and the Mahanadi system. The main types of soil in this region are red,laterite, black and brown forest soils. Brown forest soils, which are formed inassociation with forest growth, are usually acidic and rich in organic matter.
Vol. V, No.1 Meher: Environment and Natural Resources in Orissa 107

The state experiences tropical monsoon climate with variable rainfall oftenresulting in floods, droughts and cyclones. Average rainfall of 1,482.2 mm is derivedmainly from the Southwest monsoon, from June to October, with the average numberof rainy days in the state exceeding 70. The spread of rainfall is not uniform overthe state; it varies in the northern plateau from 1,500 to 1,750 mm with the bulk ofthe precipitation falling during June–September. The intensity of rainfall graduallydecreases from north to south. Local depressions cause some rainfall in the north-eastern part of the state during March-May. The annual rainfall of the coastal regionis around 1,300 mm and the bulk of precipitation is received during July toSeptember. This region receives cyclonic rainfall during September-October.Sometimes the cyclone becomes severe. During October 1999 it was so severe thatmore than 10,000 people died while lakhs of people were affected.
December and January are the coldest months with average temperaturevarying between 12OC and 15OC. The coastal plains experience moderate climateowing to their proximity to the Bay of Bengal. Extreme climate conditions areexperienced in the central tableland with temperature varying between 7OC and47OC. The eastern ghat region is comparatively cooler due to its undulatingtopography, which is interspersed with high mountain regions of 750 to 900 metresaltitude. The year 1998 witnessed an unusual summer in the state and about 2,032people died of sunstroke indicating a possible change in the climate pattern infuture.
The Current State of Orissa’s Environment
Even though Orissa is rich in natural resources like forests, water, minerals,soils, etc., these resources have deteriorated over time, resulting in the degradationof environment in the state. The environmental problems vary from the degradationof forest and rural land to the pollution of water and air, and many others. Thefollowing paragraphs summarise the main trends.
DeforestationForests are important natural resources of Orissa. They have a moderating
influence against floods and thus protect the soils against erosion. Forests alsoinfluence climate and rainfall. They provide raw materials to a number of industries.But the crisis in forest environment is manifest in the dwindling forest cover of thestate. According to the estimate of the Forest Survey of India (FSI), the forest areain Orissa remains around 30 per cent (Table 1). Over the last 25 years, there has beena marginal decline in the share of forest area. But there has been a steady decline inthe area under ‘closed forest’ both absolutely and relatively. Its share has declinedboth in the total forest area (by about 21 percentage points) and in the totalgeographical area (by about 7 percentage points). At the same time, there has beena decline in the area under ‘mangrove forest’, which is found in the coastal region
108 Journal of Social and Economic Development Jan. - June 2003

of the state. The decline in the closed forest area has resulted in an increase in thearea under ‘open degraded forest’ during the period 1972–75 to 1997.
Table 1: Area under Forest(in sq. kms.)
Year Total Geogra- Area under Area under Area under Total Forest Forest Area as Closed Forest Area asphical area Closed Open De- Mangrove Area % of Geogra- % of Geographical
Forest graded Forest phical Area AreaForest
1972–75 155707 37320 10829 234 48383 31.07 23.97(77.13) (22.38) (0.48) (100.0)
1980–82 155707 28812 10386 227 39425 25.32 18.50(73.08) (26.34) (0.58) (100.0)
1990–91 155707 27349 19661 195 47205 30.32 17.56(57.94) (41.65) (0.41) (100.0)
1995 155707 27163 19749 195 47107 30.25 17.44(57.66) (41.92) (0.41) (100.0)
1997 155707 26101 20629 211 46941 30.15 16.76(55.60) (43.95) (0.45) (100.00)
Note: 1. ‘Closed forest’ refers to forest with more than 40% crown density, whereas ‘open degraded forest’ refers to forests with less than 40% crown density. 2. Figures in parentheses indicate percentage share of total forest area.Source: For the first two time points, Govt. of Orissa, Remote Sensing Application Centre,Dept. of Science, Tech. and Environment. For the third, fourth and fifth time points, Govt.of India, Forest Survey of India (the state of Orissa Forest Report), 1991, 1995, 1997.
The northern plateau region has the highest proportion (40.12 per cent) offorest cover in the state followed by the eastern ghat region (34.20 per cent) (Table2). The coastal plain region has the lowest proportion (19.80 per cent) of forestcover. Considering the closed forest cover, with more than 40 per cent of crowndensity, it is found that the northern region has about 27 per cent of the totalgeographical area, followed by the central tableland region. The eastern ghat region,with about 34 per cent of total forest cover, has only 16.45 per cent of closed forest.The open degraded forest is found to be highest in the eastern ghat region, which ismore than the area under closed forest. This shows that there is severe degradationof forest in this region. The northern plateau region, which has the highest forestcover, has also shown severe degradation of forest.
A number of factors are responsible for the degradation of forests. Earlierstudies have identified the following three main activities that have contributed todeforestation in the developing countries: i) excessive fuelwood collection andlogging, ii) expansion/ conversion of land to agricultural use, and iii) constructionof infrastructure, especially roads and dams (Duraiappah 1996; ADB 1997).
Vol. V, No.1 Meher: Environment and Natural Resources in Orissa 109
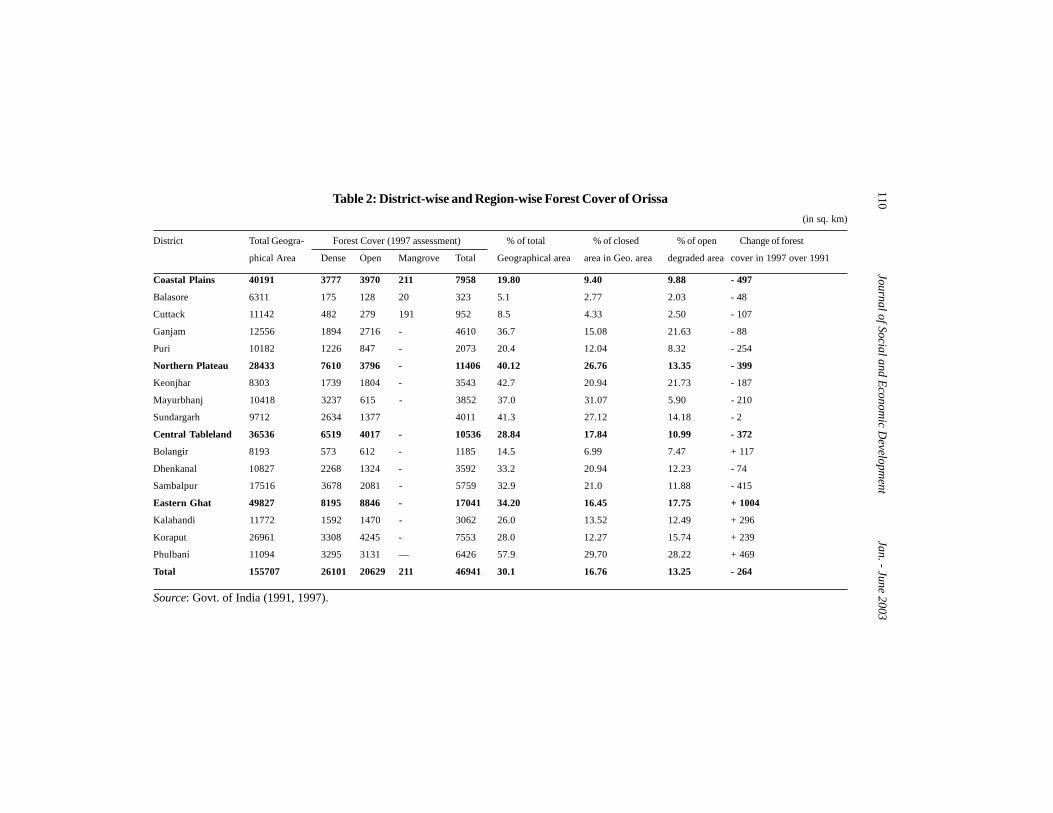
Table 2: District-wise and Region-wise Forest Cover of Orissa(in sq. km)
District Total Geogra- Forest Cover (1997 assessment) % of total % of closed % of open Change of forest
phical Area Dense Open Mangrove Total Geographical area area in Geo. area degraded area cover in 1997 over 1991
Coastal Plains 40191 3777 3970 211 7958 19.80 9.40 9.88 - 497
Balasore 6311 175 128 20 323 5.1 2.77 2.03 - 48
Cuttack 11142 482 279 191 952 8.5 4.33 2.50 - 107
Ganjam 12556 1894 2716 - 4610 36.7 15.08 21.63 - 88
Puri 10182 1226 847 - 2073 20.4 12.04 8.32 - 254
Northern Plateau 28433 7610 3796 - 11406 40.12 26.76 13.35 - 399
Keonjhar 8303 1739 1804 - 3543 42.7 20.94 21.73 - 187
Mayurbhanj 10418 3237 615 - 3852 37.0 31.07 5.90 - 210
Sundargarh 9712 2634 1377 4011 41.3 27.12 14.18 - 2
Central Tableland 36536 6519 4017 - 10536 28.84 17.84 10.99 - 372
Bolangir 8193 573 612 - 1185 14.5 6.99 7.47 + 117
Dhenkanal 10827 2268 1324 - 3592 33.2 20.94 12.23 - 74
Sambalpur 17516 3678 2081 - 5759 32.9 21.0 11.88 - 415
Eastern Ghat 49827 8195 8846 - 17041 34.20 16.45 17.75 + 1004
Kalahandi 11772 1592 1470 - 3062 26.0 13.52 12.49 + 296
Koraput 26961 3308 4245 - 7553 28.0 12.27 15.74 + 239
Phulbani 11094 3295 3131 — 6426 57.9 29.70 28.22 + 469
Total 155707 26101 20629 211 46941 30.1 16.76 13.25 - 264
Source: Govt. of India (1991, 1997).
110 Journal of Social and Economic D
evelopment Jan. - June 2003
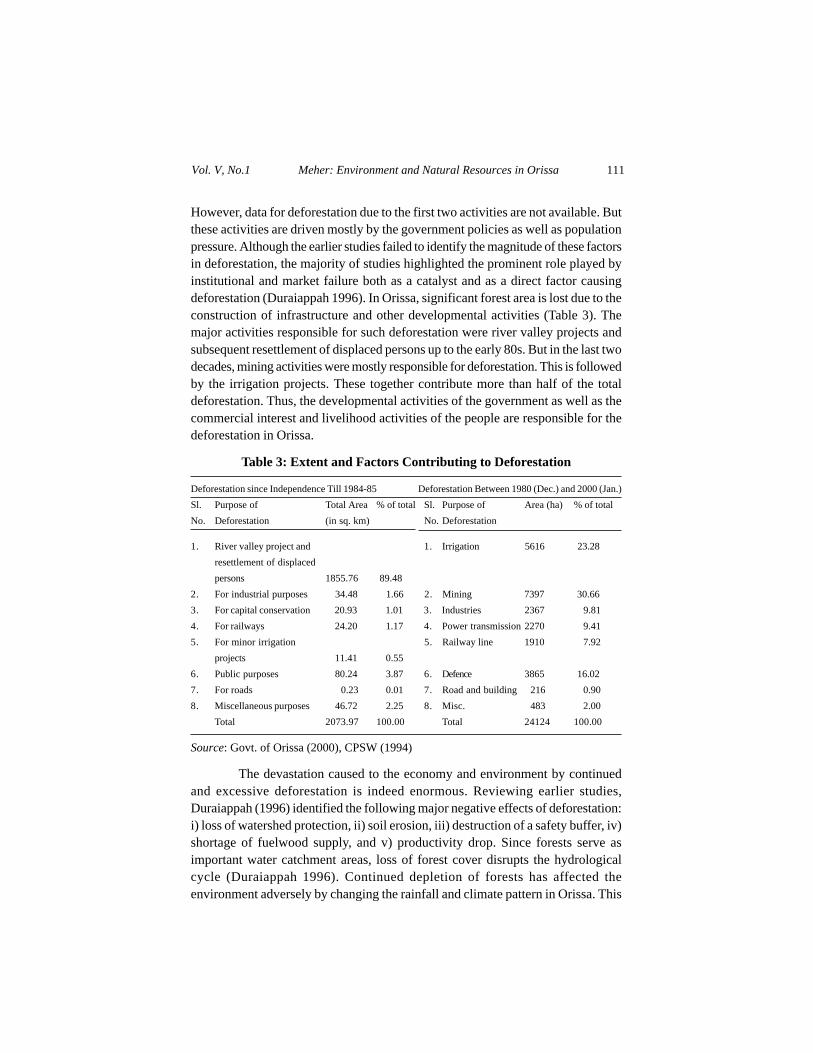
However, data for deforestation due to the first two activities are not available. Butthese activities are driven mostly by the government policies as well as populationpressure. Although the earlier studies failed to identify the magnitude of these factorsin deforestation, the majority of studies highlighted the prominent role played byinstitutional and market failure both as a catalyst and as a direct factor causingdeforestation (Duraiappah 1996). In Orissa, significant forest area is lost due to theconstruction of infrastructure and other developmental activities (Table 3). Themajor activities responsible for such deforestation were river valley projects andsubsequent resettlement of displaced persons up to the early 80s. But in the last twodecades, mining activities were mostly responsible for deforestation. This is followedby the irrigation projects. These together contribute more than half of the totaldeforestation. Thus, the developmental activities of the government as well as thecommercial interest and livelihood activities of the people are responsible for thedeforestation in Orissa.
Table 3: Extent and Factors Contributing to Deforestation
Deforestation since Independence Till 1984-85 Deforestation Between 1980 (Dec.) and 2000 (Jan.)Sl. Purpose of Total Area % of total Sl. Purpose of Area (ha) % of totalNo. Deforestation (in sq. km) No. Deforestation
1. River valley project and 1. Irrigation 5616 23.28resettlement of displacedpersons 1855.76 89.48
2. For industrial purposes 34.48 1.66 2. Mining 7397 30.663. For capital conservation 20.93 1.01 3. Industries 2367 9.814. For railways 24.20 1.17 4. Power transmission 2270 9.415. For minor irrigation 5. Railway line 1910 7.92
projects 11.41 0.556. Public purposes 80.24 3.87 6. Defence 3865 16.027. For roads 0.23 0.01 7. Road and building 216 0.908. Miscellaneous purposes 46.72 2.25 8. Misc. 483 2.00
Total 2073.97 100.00 Total 24124 100.00
Source: Govt. of Orissa (2000), CPSW (1994)
The devastation caused to the economy and environment by continuedand excessive deforestation is indeed enormous. Reviewing earlier studies,Duraiappah (1996) identified the following major negative effects of deforestation:i) loss of watershed protection, ii) soil erosion, iii) destruction of a safety buffer, iv)shortage of fuelwood supply, and v) productivity drop. Since forests serve asimportant water catchment areas, loss of forest cover disrupts the hydrologicalcycle (Duraiappah 1996). Continued depletion of forests has affected theenvironment adversely by changing the rainfall and climate pattern in Orissa. This
Vol. V, No.1 Meher: Environment and Natural Resources in Orissa 111

can be well imagined by the unusual summer of 1998, which has taken more than2000 lives because of sunstroke (Meher 2000). At the same time, the loss ofvegetative cover has exposed the soil to erosion. This not only resulted in loss ofsoil fertility, and hence lower agricultural productivity, but also increased waterrun-off to lower elevation plots. This increases the risk of flooding (Adelman et al1997). Vohra (1987) finds a strong correlation between floods and soil erosion,and states that the best insurance against floods is the prevention of soil losses.Further, the loss of vegetative cover affects the groundwater table adversely byreducing the retention and percolation of water. This has resulted in water scarcityin the rainfed areas. Orissa, therefore, has been facing floods and drought almostevery year since 1965 (Meher 2000). The groundwater scarcity in upland areas dueto the loss of soil has been observed by several studies (Bandyopadhyay 1987,Chengappa 1995).
Deforestation has also entailed increasing suffering to the rural poor andindigenous tribes who have steadily lost their traditional sources of livelihoodprovided by the forests. Besides the livelihood problem, increasing deforestationalso causes fuelwood shortages, which have dire consequences for the poor. Theloss of forest also increases the time taken to collect fuelwood as well as non-timber forest products, indicating that less time is available for both economic andother household activities. This results in productivity drop as well as suffering ofthe female members, who have to go long distances to collect fuelwood and non-timber forest products. Continuing deforestation, therefore, results in a majorecological and socio-economic crisis. The worst affected are the people in the low-income group.
Land DegradationLand resources of Orissa have both low and high agricultural production
potential. However, land is scarce in the state. Owing to increasing population, theaverage size of land decreased from 1.89 hectares in 1970–71 to 1.34 hectares in1990–91. Not only is the per capita availability of land in the state low but alsodegradation of land is severe. During 1985, it was estimated that about 50 per centof the geographical area was degraded (Table 4). The maximum land degradationoccurred owing to soil erosion, followed by shifting cultivation and degraded forest.The degradation from these three sources combined comes to about 46 per cent ofthe total geographical area and 92.29 per cent of the total degraded land. The othertypes of land degradation were water salinity (2.6 per cent), waterlogging (0.44 percent) and ravines (0.7 per cent).
The degradation of land declined from 50.1 per cent in 1985 to 37.3 percent in 1994, but the proportion of land degradation remained higher than that ofall-India (32.7 per cent). The estimate shows that land degradation due to soil erosion,ravines, salinity and shifting cultivation has declined in 1994 from 1985. It is
112 Journal of Social and Economic Development Jan. - June 2003

Table 4: Status of Land Degradation in Orissa
(Area in Lakh Ha.)
Sl. Type of Degradation 1985 Assess- % of Geogra- 1994 Assess- % of Geogra-No. ment graphical area ment phical area
1. Soil erosiona.Water 27.71 17.8 25.70 16.50b.Wind - - - -
2. Ravines 1.13 0.7 0.18 0.13. Saline 4.03 2.6 1.35 0.94. Waterlogged 0.60 0.40 1.42 0.95. Mine and Quarry Waste - - 0.97 0.66. Shifting Cultivation 26.48 17.0 1.84 1.27. Degraded Forest 18.07 11.6 26.56 17.18 Total Orissa 78.3 50.1 58.02 37.39 All-India 1721.75 52.8 1074.30 32.7
Source: Government of India (1995)
surprising to observe that land degradation due to shifting cultivation has declinedsignificantly from 17 per cent in 1985 to 1.2 per cent in 1994. Similarly, salinityhas also declined significantly (Table 4). But the degradation due to soil erosionhas declined marginally and still remains high. On the other hand, land degradationdue to degraded forest and waterlogged area has increased significantly. Further,mine and quarry waste has added to the degradation of land. A 1994 assessmentput land degradation due to degraded forest and soil erosion together at about 90per cent of the total degraded land and about 34 per cent of the total geographicalarea. At the same time, increasing land degradation due to quarry and mine wasteand waterlogging has emerged as a potential threat. The waterlogging and salinisationof crop area of about 2.77 lakh ha is because of poor irrigation practices.
It is clear from the above discussion that land in Orissa is severely degraded.The degradation is, however, mostly in the shape of soil erosion and degradedforest. These two are interlinked and have cumulative effects. The most importanteffect of land degradation is the drop in agricultural productivity owing to loss ofsoil fertility. Degradation of soil fertility can be reversed in the short run. But,reversibility of soil erosion and salinisation has to rely on prevention. Once topsoilhas disappeared, soil erosion becomes almost impossible to reverse. This is because,under natural condition on vegetation cover, it can take between 100 to 500 yearsfor the formation of 1 cm of topsoil (Dasgupta and Maler 1997). Once soil hasbecome sufficiently saline it becomes permanently incapable of being cultivated(Adelman et al 1997, p.166).
Vol. V, No.1 Meher: Environment and Natural Resources in Orissa 113

Mineral ExploitationMinerals are an important non-renewable natural resource of Orissa. The
state has nearly 20 per cent of India’s total mineral resources, which include 98 percent of chromite, 70 per cent of bauxite, 38 per cent of graphite, 26 per cent of ironore and 24 per cent of coal (Govt. of Orissa 1998–99). During 1995, mineral reservesin the state were 54,599.9 million tonnes and their exploitation was 50.97 milliontonnes (i.e., less than one per cent of the total reserve), showing a very low averagerate of exploitation. Assuming that this rate (i.e., the rate of 1995) of exploitationcontinues, it would take more than a thousand years to exhaust all the minerals(Table 5), provided that no new reserves of minerals are discovered. But mineralslike graphite and lead ore would get exhausted within two to three decades if thepresent rate of exploitation continues.The position regarding other minerals is morecomfortable. However, the problem is that the rate of exploitation is increasingrapidly over time, posing a threat. The exploitation of minerals in the state hasincreased from 2.8 million tonnes in 1947 to 51.32 million tonnes in 1995–96, i.e.,by about 18 times. The exploitation is much higher in the 90s than in the earlierperiods. Therefore, the low average rate of exploitation cannot be a sign of relief tothe state. Rather the increasing exploitation is a potential threat. Since most of themineral reserves are in the tribal belt and forest areas of the state, they pose adanger of deforestation and livelihood of the locals.
The rapid increase in mineral exploitation is mostly due to the increasingrevenue interest of the state. Besides, increase in the number of mineral-basedindustries in the state has attracted more exploitation. The illegal and indiscriminatemining has also added to the increased mineral exploitation. Overexploitation ofthese mineral resources has adversely affected land, forests, water and air.
As the demand for minerals grows, the area of mining expands at a fasterrate, threatening increasingly larger areas of landscape, soil degradation, a wideningcircle of deforestation, air pollution and distress to the population affected. Extractionof a large quantity of minerals not only depletes the non-renewable resources butalso creates problems of second and third order effects in the form of irreversibleenvironmental reactions over both the short and the long terms.
Land is lost due to mining, both directly and indirectly. The direct loss isdue to the land leased for mining operations as such, and indirect loss is caused bythe area that is used for the construction of the infrastructure required for mining,namely, roads, railways, stockyards, etc. (Viegas and Menon 1989). Owing tointensive mining not only is land lost but also large-scale displacement occurs. Theindiscriminate quarrying and mining by both leaseholders and public sector minershave caused irreversible environmental and ecological damage.
114 Journal of Social and Economic Development Jan. - June 2003

Table 5: Mineral Reserves (1995), Their Exploitation (1995) and the Years Leftfor Exhaustion at the Current Rate of Exploitation
Mineral Reserve of Annual Extraction Rate of Time Left forOres Mineral (million (million tonnes) Exploitation Exhaustion
tonnes) (%) (years)
Coal 46527 32.65 0.07 1425Bauxite 1670 2.42 0.14 690Chromite 183 1.65 0.90 111Copper Ore 4.7 - - -Iron Ore 3120 9.33 0.30 334Lead Ore 2.6 0.09 3.46 29Manganese Ore 49 0.63 1.29 78Nickel 285 - - -Vanadium 3.4 - - -China Clay 157 0.01 0.006 15700Dolomite 1171 1.34 0.11 874Fire Clay 108 0.09 0.08 1200Graphite 1.5 0.09 6.0 17Limestone 1212 2.38 0.2 509Mineral Sands 82 0.11 0.13 745Pyrophyllite 8.6 0.03 0.35 287Quartz & Quartzite 15 0.15 1.0 100Taeic/Soapstone 0.1 - - -All 54599.9 50.97 0.09 1071
Source: Meher (2000)
Agricultural uses of land are automatically eliminated by the miningactivity, which churns up much sub-soil and dumps it on top of the ground or digsgreat pits deep into the sub-surface up to bedrock formations. Frequently, greatpiles, ridges and mounds of infertile sub-soil are left adjacent to the large burrowpits, creating a landscape far different from the original rolling or level land. Thelives of thousands of people from the surrounding villages have been threatenedby the debris running down the rich agricultural land, turning it into wasteland(Dwivedi, Chari and Mohapatra 1992).
The method and technology of mining has a special bearing on theenvironment and sustainability of natural resources. As most of the mining in Orissais open cast, there is the danger of environmental degradation in and around themining areas. Everything in and around the mines gets covered with dust, leadingto deterioration of air quality. The severity is observed in the case of coalmines.
Vol. V, No.1 Meher: Environment and Natural Resources in Orissa 115
Huge clouds of dust with suspended particles raise sharply the atmospheric toxicitycausing respiratory ailments among the inhabitants living in and around the miningareas. The respiratory dust problem has long-term effects on the health of mineworkers (Meher 2000).
Orissa, being the largest repository of power grade coal (ash content of 40per cent or more), attracts large-scale coal-based thermal power plants. As far asthermal power plants are concerned, ash disposal poses the largest environmentalproblem (Orissa Pollution Control Board 1998).
Water PollutionWater is another important natural resource of the state. With an annual
rainfall that brings 23.46 million hectare metres of water per year, 11 major rivers witha total yield of 78.19 thousand million cusecs and groundwater potential of 23.279lakh hectare metres, Orissa can rightly be described as rich in water resources. Butthe water resources in the state have become polluted. While the pollution hasbecome serious as far as surface water is concerned, it has not yet aggravated in thecase of groundwater in the state.
The pollution of surface water is observed mostly in the case of majorrivers, besides community resources like lakes, ponds and tanks in Orissa. Onekind of river pollution is the level of suspended solids (the amount of wastesuspended in the water). Organic waste is a specific kind of water pollution. Themore organic waste a river or lake contains the more this waste uses up duringdecomposition. The extent of organic waste can be gauged by the biological oxygendemand (BOD): the higher the BOD, the more polluted a river or lake is (ADB 1997).In Orissa, the BOD of rivers Brahmani and Mahanadi, which cover a significant areain the state, is very high. Though these two rivers have been designated as class-C rivers based on designated best use classification, the water quality data showthat these two rivers largely belong to class-D category, indicating that the water isnot suitable for drinking and bathing without treatment (Orissa Pollution ControlBoard 1998, 1999). The other rivers like Baitarani, Rushikulya, etc., are also polluted,though to a lesser extent.
River water pollution has several sources. Untreated municipal sewage,industrial effluents, and runoff from urban and agricultural activity (especially frompesticides and fertilisers) are the main culprits. In Orissa, none of the 103 urbanlocal bodies has a sewage treatment system (Dash undated). Wastewater from thesesources generally contains many organic faecal matters along with disease-carryingcoliforms. About 74.5 thousand kilolitres per day (KLD) of wastewater enters intothe Brahmani River from 26 urban settlements (Orissa Pollution Control Board1998), while 266.3 thousand KLD of wastewater enters into the Mahanadi Riverfrom 34 urban settlements (Orissa Pollution Control Board 1999). Besides the urbanwastewater, these rivers also receive wastewater from industries and mines. While
116 Journal of Social and Economic Development Jan. - June 2003

the industries in the basin of the Brahmani River discharge about 298 thousandKLD of wastewater, the mines discharge about 29.4 KLD of wastewater into theriver. Similarly, the industries in the Mahanadi River basin discharge about 66.7thousand KLD of wastewater, and the coalmines discharge about 33 KLD ofwastewater into the river. The industrial wastewater is likely to contain varioustypes of pollutants depending upon the industrial process. Some of them are toxicand not easily biodegradable.
Many of the potential health hazards posed by such polluted surface watercan be reduced by providing access to safe water through municipal water supplyand sanitation services. But Orissa’s record is very poor in this respect. A verysmall proportion of people in the state have access to safe drinking water. At thesame time, access to sanitation is generally even lower than access to safe water.
The exploitation of groundwater in the state is very low, i.e., 7.1 per cent(Govt of India 1994), but in the coastal districts (except Puri) the exploitation issignificantly higher than the state average. Owing to over-exploitation ofgroundwater in the coastal area, there is a possibility of saline intrusion. Further,groundwater with high water table in coastal districts can be polluted by leaching,containing various pollutants like fertilisers and pesticides used in the agriculturalfields, organic matter from abandoned pits, wastes of industries containing toxicsubstances stored in unlined pits, etc. (State Prevention and Control of PollutionBoard: undated). Even though groundwater exploitation in the state is very low,groundwater is found to be polluted owing to a number of factors. However, nosystematic study has been done in this respect. But there are some indicators, whichconfirm groundwater pollution in the state. The iron content in groundwater isfound to be very high in some areas of the northern plateau region (viz. Mayurbhanj,Keonjhar and Sundargarh districts). It is as high as 34 mg/lt against the recommendedstandard of 0.3 mg/lt. Water in shallow aquifers in deltaic and coastal areas hasdissolved solids, hardness, bicarbonates and chlorides (State Prevention and Controlof Pollution Board, Orissa Undated). Fluoride contamination of groundwater is apossibility in the areas of aluminium smelter and phosphoric fertiliser plantestablished at Angul and Paradeep respectively. Fluoride pollution of shallowgroundwater in a limited area in Hirakud has already been reported — caused bythe haphazard disposal of rejected pot linings of an aluminium plant in the past(ibid.). Contamination of groundwater by hexavalent chromium (which is a knowntoxic substance) due to the use of chromite ore by many industries in Orissa cannotbe avoided. All these show that even though no systematic estimate of groundwaterpollution has been made in the state, yet the above discussion brings some evidenceon groundwater pollution.
Air PollutionAir pollution has not posed a serious problem in Orissa. The concentration
Vol. V, No.1 Meher: Environment and Natural Resources in Orissa 117

of pollutants, like sulphur dioxide (SO2), oxides of nitrogen (NOx), remains belowthe prescribed standard. However, the suspended particulate matter (SPM)concentration exceeds the standard in some places, especially in Bhubaneswar(capital city) and other towns. This is largely due to construction work and roadswith lots of dust on either side or bad roads (Dash: undated). Even though the airpollution level is low in the state, it is aggravated by the use of energy-inefficienttechnologies with no pollution controls and by the use of cheaper, high-sulphurcontents, low quality coal and fuel oil, especially for heating and transport.
In rural areas, air pollution is in the form of particulate, organic matter andvarious oxides. This results seasonally from burning grasslands and from forestclearing for cultivation, grazing and collection of minor forest produce like mohua.Indoor air pollution from cooking with organic fuels or coal or energy-inefficientstoves without proper venting is endemic, and has led to dangerous indoorconcentrations of carbon monoxide particulate and hydrocarbons (Adelman et al1997). The highest concentration of pollutants actually occurs in rural indoor-environment. They come from burning bio-fuels such as wood, crop residues anddung cake, which are used by mass households in Orissa. Pollution released indoorsis far more likely to reach people’s lungs than if released outdoors.
In urban areas, on the other hand, the atmosphere is being polluted bydischarge of gases from industries, congestion, and garbage disposal in the open.Even though the number of industries in Orissa is not too large, there are a numberof polluting industries, which pose a serious concern for the state. Cement, paper,iron and steel, aluminium, and other ancillary industries emit poisonous smoke.Excessive emission of carbon monoxide, nitrogen oxide and sulphur dioxide andhydrocarbons sometimes leads to acid rains which are dangerous for the fertility ofthe soil. Increasing use of automobiles in urban areas of the state causes not onlycongestion but also air pollution. To control pollution in the state no programmewith severe penalty has been launched. The state’s Pollution Control Board, withits limited resources, is unable to tackle the problem. High growth in the number ofmotor vehicles has contributed to an increase in air pollution in two ways: First, ithas resulted in increased fuel consumption, leading to increase in emissions, andsecond, growth in vehicles per kilometre road length has caused road congestionleading to increased fuel consumption and pollutant emissions. The major pollutantsemitted by motor vehicles include carbon monoxide (CO), nitrogen oxide (NOx),sulphur oxide (SOx), hydrocarbons (Hc), and suspended particulate matter (SPM).The pollutants have a damaging effect on both human health and ecology.
Disparity within OrissaTwo indices of environmental degradation have been constructed to show
the disparity among the districts. The first index is constructed by using threeindicators, viz., percentage of drought-prone area, percentage of wasteland area
118 Journal of Social and Economic Development Jan. - June 2003
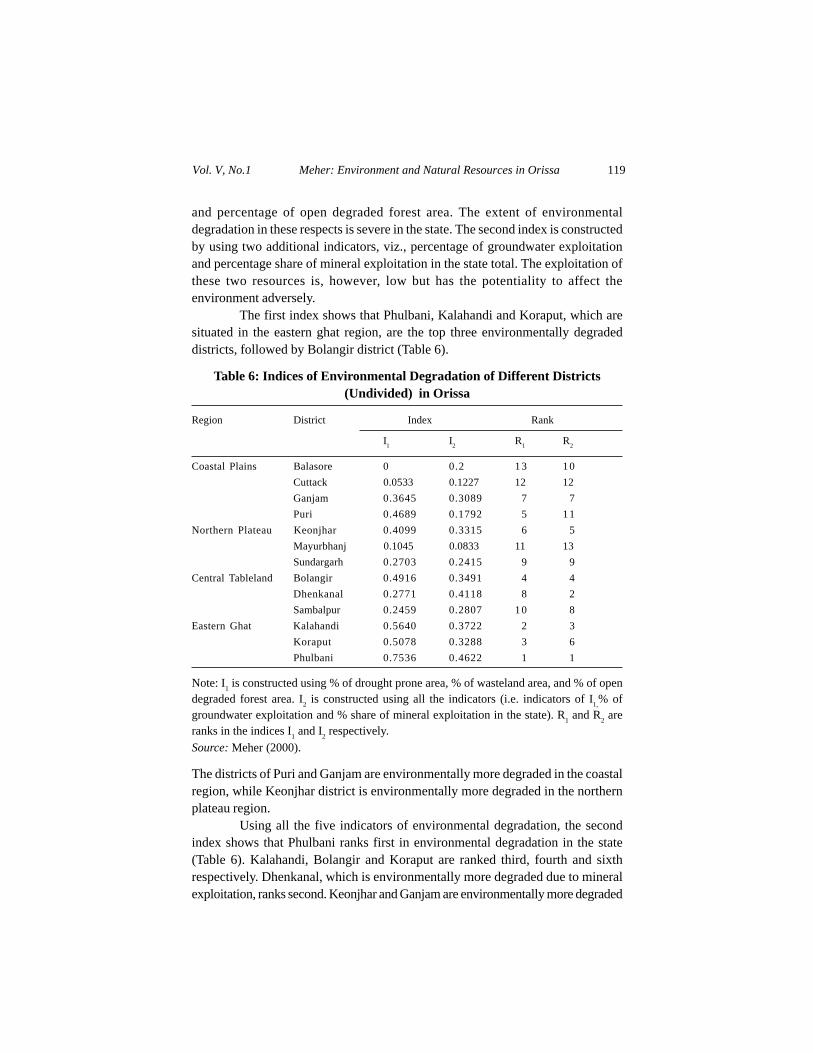
and percentage of open degraded forest area. The extent of environmentaldegradation in these respects is severe in the state. The second index is constructedby using two additional indicators, viz., percentage of groundwater exploitationand percentage share of mineral exploitation in the state total. The exploitation ofthese two resources is, however, low but has the potentiality to affect theenvironment adversely.
The first index shows that Phulbani, Kalahandi and Koraput, which aresituated in the eastern ghat region, are the top three environmentally degradeddistricts, followed by Bolangir district (Table 6).
Table 6: Indices of Environmental Degradation of Different Districts(Undivided) in Orissa
Region District Index Rank
I1 I2 R1 R2
Coastal Plains Balasore 0 0.2 13 10Cuttack 0.0533 0.1227 12 12Ganjam 0.3645 0.3089 7 7Puri 0.4689 0.1792 5 11
Northern Plateau Keonjhar 0.4099 0.3315 6 5Mayurbhanj 0.1045 0.0833 11 13Sundargarh 0.2703 0.2415 9 9
Central Tableland Bolangir 0.4916 0.3491 4 4Dhenkanal 0.2771 0.4118 8 2Sambalpur 0.2459 0.2807 10 8
Eastern Ghat Kalahandi 0.5640 0.3722 2 3Koraput 0.5078 0.3288 3 6Phulbani 0.7536 0.4622 1 1
Note: I1 is constructed using % of drought prone area, % of wasteland area, and % of opendegraded forest area. I2 is constructed using all the indicators (i.e. indicators of I1,% ofgroundwater exploitation and % share of mineral exploitation in the state). R1 and R2 areranks in the indices I1 and I2 respectively.Source: Meher (2000).
The districts of Puri and Ganjam are environmentally more degraded in the coastalregion, while Keonjhar district is environmentally more degraded in the northernplateau region.
Using all the five indicators of environmental degradation, the secondindex shows that Phulbani ranks first in environmental degradation in the state(Table 6). Kalahandi, Bolangir and Koraput are ranked third, fourth and sixthrespectively. Dhenkanal, which is environmentally more degraded due to mineralexploitation, ranks second. Keonjhar and Ganjam are environmentally more degraded
Vol. V, No.1 Meher: Environment and Natural Resources in Orissa 119

in the northern and coastal regions respectively.The above indices show that the districts of eastern ghat region are
environmentally more degraded than the districts of other regions. These districtsare not only environmentally degraded but also economically most backward,indicating a close link between poverty and environment in the region. This isplausible as the main human use made of land, water, and vegetation in these districtsis for sheer survival. Hardly any surplus is forthcoming. The degradation of naturalresources often does not allow poor people to survive without frequent recurrenceto large-scale seasonal migration.
Causes of Environmental Degradation
A number of explanations are offered for environmental degradation inpoor economies. The most important among them are population growth, poverty,economic growth, and institutional, policy and market failures. The validity of theseexplanations in the context of Orissa is examined in what follows.
Population GrowthIt is believed that population growth and environmental degradation are
closely related. Rising population is highly correlated with deforestation, soil erosion,damage to local system, and other forms of environmental degradation. Closerinspection, however, reveals that this is not that simple. How a population behavesis more important than how fast it grows (ADB 1997).
In Orissa, the districts of eastern ghat region, which show higher populationgrowth, have higher environmental degradation. At the same time, it is also observedthat a district like Balasore, with higher population growth, has lower environmentaldegradation. Similarly, slower population growth does not necessarily bring downthe rate of environmental degradation. For example, Bolangir district, with thelowest population growth, is environmentally more degraded than several otherdistricts in the state.
Considering the density of population and its relation with environmentaldegradation in Orissa, it is observed that the severely environmentally degradeddistricts in eastern ghat region have lower density of population. Further, Cuttack,which shows higher density of population, does not show more environmentaldegradation. Hence, population growth or density alone does not seem to beresponsible for environmental degradation. The relationship could be possible inthe presence of poverty, ill-defined property rights, lack of employment alternatives,failed government policies, or others (ADB 1997).
PovertyThe economic condition of people in the state also affects environment.
Significant proportions of people in the state live below the poverty line. Poverty is
120 Journal of Social and Economic Development Jan. - June 2003
widespread in the eastern ghat and other regions, which experience severeenvironmental degradation. So at first sight, it seems that poverty and environmentaldegradation are closely linked. But poverty is not an independent cause thatcontributes to environmental degradation. It seems to exacerbate environmentalproblems in the presence of market, institutional, and policy failures.
There is a negative spiral of poverty and environmental degradation. Naturalresources, such as fuelwood, fodder, fish, etc. are all open access, and the poormust capture as much of them as they can. This leads to higher fertility becausechildren are assets in the race to capture resources. But high fertility, in turn, leadsto further impoverishment as resources are overexploited and degraded (ADB 1997).
Economic GrowthSeveral researchers have identified a relationship between income and the
environment that displays an inverted U-shaped pattern known as the environmentalKuznets curve. This relationship implies that as a country gets richer, its environmentwill get worse before it gets better (ADB 1997). This relationship reveals that sinceOrissa is in the initial stage of development, increasing environmental degradationis inevitable. Environmental quality will continue to deteriorate till the turning pointis reached. However, the turning point of this curve remains at a much higher levelof per capita income (Panayotou 1995; Islam 1997), which suggests thatenvironmental quality in Orissa will continue to deteriorate for a very long period.
The inevitability of the U-shaped relationship is, however, questioned.Substantial evidence exists that the curve can be flattened (ADB 1997). It is arguedthat in the presence of policy distortions or policy failures the environmentdeteriorates more at low-income levels than in their absence. Similarly, improvementof the environment with income growth at higher income levels is not automatic butdepends on the policies and institutions in place. This provides ground for optimism.
Institutional, Policy, and Market FailuresThe most important cause of environmental degradation in Orissa, like
most other developing economies, is institutional, policy and market failures. Thefailure of market, institution and government policy provides incentives to the poorto have short time preferences and the rich to exploit the resource base at anunsustainable rate. The policy failures lead to institutional and market failures,which in turn lead to degradation of environment. Owing to the lack of secureproperty rights in the case of forest and other environmental resources, which is apolicy failure, market fails to price these resources. As a result, it is overexploited.Hence, the classic tragedy of the commons, namely that resources owned by noneare overexploited by all, applies to many of the state’s forest, rivers, and otherenvironmental resources. Even where property rights exist, the prices of goodsoften fail to reflect the environmental cost of their production, leading to further
Vol. V, No.1 Meher: Environment and Natural Resources in Orissa 121

degradation of the environment.
Summary and Conclusion
Orissa has plentiful valuable natural resources, which are being degraded.While forests, land and surface water resources are undergoing severe degradation,groundwater, minerals and air are under serious threat of degradation. Not onlyhave the different patterns of development in the state led to the degradation ofthese natural resources but also other factors like growth of population, their povertylevel and the unsustainable activities adopted by them have become crucial for thedegradation of valuable natural resources in the state. The adoption of unsustainableactivities is, however, driven by the market, institutional and policy failures. Theseprovide incentives to the poor to have short time preferences and to the rich toexploit the resource base at an unsustainable rate.
The degradation of natural resources has not only reduced the economicbase of the state but has also affected the environment adversely. The adverse impactslike change in climatic condition, increased flooding, productivity drop, watershortage, increased infant mortality and morbidity rate, etc. are some of the outcomesof continuing degradation. In the absence of proper measures to reduce thedegradation of natural resources the problem will be further aggravated. Therefore,a policy in this regard is imperative.
References
ADB (Asian Development Bank) (1997). Emerging Asia: Changes and Challenges. Manila.Adelman, Irma, Habib Fetini, and Elise Hardy Golan (1997). Development Strategies and
the Environment. In Dasgupta and Maler (eds.). The Environment and EmergingDevelopment Issues, Vol. 1. New York: Oxford University Press.
Bandyopadhyay, J. (1987). Political Economy of Drought and Water Scarcity: Need for anEcological Water Resources Policy. Economic and Political Weekly, 12 December.
Chengappa, R. (1995). Paradise. India Today, 15 August.CPSW (1994). State of Orissa’s Environment: A Citizen’s Report. Bhubaneswar.Dasgupta, Partha and Karl-Goran Maler (1997). The Resource Basis of Production and
Consumption: An Economic Analysis. In Dasgupta and Maler (eds.). TheEnvironment and Emerging Development Issues, Vol. 1. New York: OxfordUniversity Press.
Dash, Madhab C. (Undated). Environment in Orissa, mimeo, State Pollution Control Board,Bhubaneswar.
Duraiappah, Anantha (1996). Poverty and Environmental Degradation: A Literature Reviewand Analysis. CREED Working Paper Series No. 8, Amsterdam, October.
Dwivedi, R. P., K. N. Chari, and G. N. Mohapatra (1992). Problem Lands of Orissa.
122 Journal of Social and Economic Development Jan. - June 2003

Department of Agriculture and Rural Development, Government of Orissa.Government of India. Forest Survey of India (1991, 1995, 1997). New Delhi: Ministry of
Forest and Environment.Government of India (1994). Groundwater Statistics: 1994. Central Groundwater Board,
New Delhi: Ministry of Water Resources.Government of India (1995). Draft Report on State of Land Degradation in India, Dept. of
Agriculture and Co-operation (Soil & Water Conservation Division), Ministry ofAgriculture.
Government of Orissa. Economic Survey of Orissa: 1998–99.Government of Orissa (2000). Office of the PCCF; Annual Report: 1999–2000, Aranya
Bhawan, Bhubaneswar.Hirway, Indira, and Darshini Mahadevia (1999). Gujarat Human Development Report, 1999.
Ahmedabad: Mahatma Gandhi Labour Institute.Islam, Nazrul (1997). Income-Environment Relationship: How Different is Asia? Asian
Development Review, 15(1): 18–51.Meher, Shibalal (2000). Status of the Natural Resource Environment in Orissa. Working
Paper No. 48, NCDS, Bhubaneswar, July.Orissa Pollution Control Board (1998). Paribesh Samachar, 5(1), June.Orissa Pollution Control Board (1999). Paribesh Samachar, 6(3), Sept.Panayotou, T. (1995). Environmental Degradation at Different Stages of Economic
Development. In I. Ahmed and J. Doelman (eds.). Beyond Rio: The EnvironmentalCrisis and Sustainable Livelihoods in the Third World. London: Macmillan Press.
State Prevention and Control of Pollution Board, Orissa (Undated). State of Environment inOrissa-I: Water Resources.
Viegas, Philip, and Geeta Menon (1989). The Impact of Environmental Degradation onPeople. New Delhi: Indian Social Institute.
Vohra, B.B. (1987). Water Resources: Land Management Holds the Key. The EconomicTimes, New Delhi, Sept.
Received: January 14, 2003 Accepted: July 17, 2003
Vol. V, No.1 Meher: Environment and Natural Resources in Orissa 123

P.R. Brahmananda: His Work, and Beyond
T. Krishna Kumar *
The sudden departure of P. R. Brahmananda on January 23, 2003, at theage of 76, is a great loss to the country and to the economics profession. ManyEnglish newspapers and journals did print fitting obituaries for him1. I chose towrite this article because I think it has to be written for the social science professionin a different style than a journalistic one, or as an obituary. I will say a little abouthis life and work, but more importantly I will stress what needs to be done to pay afitting tribute to him and to put his work in a proper perspective.
His end came just when in this post-reforms era, he could see that theeconomics profession finally appreciated his wage-goods model of 1956, as containedin his book, Planning for an Expanding Economy, which he co-authored with C.N.Vakil. Added to this, his views on inflation and its adverse impact on the poor wereuniversally known. In recent times the growth in money supply had stabilized at 15per cent with inflation below 5 per cent. This must have pleased him.
Swadeshi Scholarship with Professionalism and SocialCommitment
Brahmananda’s father P.R. Ramayya was the founder editor of a popularKannada daily Thayinadu (Motherland) during the pre-independence years. Hismother P.R. Jayalakshamma was the deputy mayor of Bangalore. He thus grew upwith a swadeshi spirit and social commitment as demonstrated by his illustriousparents. He always wore khadi and retained links with pre-independent Indian andGandhi’s philosophy/ideology. Brahmananda graduated with economics honoursfrom Maharajah’s College in Mysore. His post-graduation and Ph.D. in economicswere from Bombay University, under the guidance of Professor C.N.Vakil. I knewProfessor Brahmananda since 1978 in the company of our common friend and myformer teacher Professor N.S. Iyengar. I came to know him better since 1991, whenN.S. Iyengar and we two were associated with the Institute for Social and EconomicChange (ISEC) as members of its Board of Governors. We used to commute to theBoard meetings together. I was at times unhappy that he was not supporting myviews in the Board meetings in public, while sharing my concerns in private. I couldunderstand this behaviour only later as that of his desire not to harm any one, as* Econometrics Institute, Bangalore - 560 078. Phone: 659 7183At the time of writing this article the author was a Visiting Fellow at the Institute for Socialand Economic Change under Ratan Tata Endowment Scheme. The author thanks K.L. Krishna,Sushanta Mallick, and Vinod Vyasulu for their comments on a preliminary draft of thisarticle. The usual disclaimer applies and the author alone takes responsibility for the contents.

some of my views that he did not support related to matters pertaining to ratingacademic performance of some individuals.
We were once invited to be external experts in a seminar given by acandidate for a faculty appointment at Indian Institute of Management, Bangalore.Brahmananda was interrupting the speaker with his questions and not giving thecandidate a free floor to cover the topic within the stipulated time. I found it annoying.During our return journey home I told him that it was not fair. His remark wassomewhat like this:
‘Krishna Kumar, I know his work well. A seminar was not needed to makethe faculty selection decision. I used the occasion to brush up my ownknowledge on the topic from this youngster.’
His inquisitiveness and his eagerness to learn from the younger generationare two characteristic features that endeared him to his students and youngereconomists.
Brahmananda was a teacher throughout his professional career. Severaldistinguished Indian economists were his students. While it is difficult for me to listall of them I might cite just a few names as examples: Krishna Bhardwaj, MeghnadDesai, and Bimal Jalan. Lord Meghnad Desai, a former student of Brahmananda atBombay University, had this to say: ‘… Brahmananda was a friend, an elder brotherin whom you could confide.’ ‘..he also gave us brilliant lectures. I still recall that hisexposition of the basic Keynes model of the General Theory was one of the clearestI ever had and I count Lawrence Klein and Sidney Weintraub among my teachers.’‘ …. the external examiners from Calcutta and Delhi had marked the students downfor writing exclusively and enthusiastically about the wage goods hypothesis. Theexternals thought very little of all that and hence the low marks. PRB was verydejected that summer. He could feel (though he never spoke about it to us) thatsomehow his enthusiasm had harmed the students. So in our senior year he nevermentioned the wage goods hypothesis.’ (Desai 1999: v, vi)
Brahmananda attended the Board meeting of ISEC in the forenoon ofJanuary 23, 2003. As though he could predict the event to occur later in the day, heannounced at that meeting that he was donating his personal collection of books,journals, and other monographs to ISEC’s library. After lunch, and just an hourbefore he passed away, he spoke to the staff at Business Line office in Chennaiabout his next weekly (Saturday) column ‘Economy: A Perspective.’ The columnwas published two days after his death. It dealt with the Tenth Five Year Planpapers that had come out in three volumes. This is what he said in that contribution:‘Competition between political parties in the matter of economic performance is agood goal for the polity. Different economic objectives and differences in instrumentsto achieve the same can differentiate two or more parties, and the electorate should
Vol. V, No.1 Kumar: P. R. Brahmananda — His Work, and Beyond 125

be given the option of choosing between economic objectives and the instrumentsthat would define the efficiency for achieving those objectives.’2
One should read Brahmananda’s works to appreciate the width and depthof his scholarship, and the reasons for his preference to a swadeshi style of hisown. He was quite open to accept ideas from the west if they helped economictheory and if they helped understanding the working of the Indian economy.Although he had a strong preference for classical economic theory it was basedmore on his conviction of its superiority over the other theories and not because hechose to stick to that dogma. His major concern had always been with theory andmethods that helped economic policies in the Indian context. He emphasized thisaspect to be kept in mind in designing the curriculum for economics in Indianuniversities.3
Brahmananda tried to blend empirical facts and economic theory witheconometric methods. He was relatively weak in his mathematical and statisticalmethods when compared with other contemporary economists. Yet, it did not hinderhis quest for knowledge that was full of high doses of both mathematics andeconometrics. When one reads his scholarly discussions, it appears as though hehad an underlying mathematical and analytical structure that was being explainednon-mathematically, as had been the tradition until Samuelsonian revolution engulfedeconomics.
His understanding of Indian economics was so profound that he washighly sought after by the press to comment on budgets and major macroeconomicpolicies. He regarded industry as an integral and significant part of Indian economy,and he interacted with the chambers of industry and commerce quite well. But hekept a distance from government and politics. He perhaps felt that the role of a trueeconomic policy adviser is only to suggest the policy, while it is the responsibilityof the government to seek such advice from professional economists. He wasinvited often to the meetings of the Panel of Economists with the Union FinanceMinister before the budget preparation/presentation.
Brahmananda’s Work
Brahmananda read very widely and made contributions to different sub-fields in economics. His major interests were: classical models of production anddistribution, monetary economics, development economics, Indian economics,business economics, and international liquidity problems. Given the time and spaceconstraints I will comment only briefly on some of his works.
Not very long ago when I was reviewing the evolution of plan models andplanning strategies I wanted to read Vakil and Brahmananda’s highly acclaimedbook on the wage-goods model4. As that book was not available in the local librariesof major research institutions I borrowed his personal copy and read it with awe and
126 Journal of Social and Economic Development Jan. - June 2003

appreciation. Brahmananda had written most of it, that too when he was in histwenties! It was an excellent and very lucid exposition of an open economy generalequilibrium model with capital and money in the classical (Ricardian/Hayekian)mode, made applicable to an underdeveloped economy. He, however, distinguishedbetween two types of capital, physical capital and circulating capital or the wagegoods, and emphasised the importance of the latter over the former in a developingcountry with a high degree of unemployment and poverty. He argued thatunemployment in India was due to the wage goods gap and suggested thatinvestment be directed towards producing wage goods, i.e., to agriculture and ruralindustries.
When I met Brahmananda next to return the book, I chose the occasion toseek an answer to a question that had been on my mind for a long time: ‘As a co-author of that book and as a member of the panel of economists that was calledupon by the then Finance Minister C.D. Deshmukh to discuss and endorseMahalanobis’s draft plan, why did Vakil not record a dissent?’5 As a follow-up tomy question, I proceeded to say. ‘You know that some of you, including Vakil, hada definite alternative model. But by remaining silent, you made a serious professionalcompromise that could have adversely affected the course of India’s economicdevelopment and growth?’ Brahmananda was very moved when I made these harshremarks. He admitted that he was then only a junior colleague of Vakil, and that thelatter had gone along with Gadgil who drafted the memorandum approving of thedraft plan document. As we could see, from his reverence to Professor Vakil in lateryears as well, that he had neither ill will nor bitterness towards his teacher and co-author for not supporting his wage goods model at the meeting of the panel ofeconomists.6
He was one of the very few people who could foresee the internationalliquidity crisis of the early seventies, Robert Triffin being another. Brahmananda’sexplorations of the problems of international liquidity, made as early as 1968, werequite ahead of the times. He had recognised the need for proper internationalpolicy coordination through an open macro-economy model as the followingquotation reveals: ‘To this writer, it appears that Keynes then was, and Friedmannow is, wide of the target. Both the Keynesian and Chicago School theorists neglectthe vital fact that monetary (and/or fiscal) expansion would simply aggravate thedisequilibrium between the demand for (real) international liquidity and the supplyof such liquidity. Any country undertaking the Keynes-Friedman policy wouldhave simply landed itself in a more severe balance of payments gap. Pigou was atleast more realistic than Keynes; and Friedman simply forgets that the U.S.A. thenwas, and now is, a part of the international trading system.’7
Among the many examples of his scholarship are his explorations of theNew Classical Theory of Political Economy (Brahmananda 1967, 1974). Brahmananda
Vol. V, No.1 Kumar: P. R. Brahmananda — His Work, and Beyond 127
said, in the preface to his 1967 book on New Classical Theory, that his critique ofSraffa was well received and appreciated or commented upon by distinguishedscholars such as R.F. Kahn, Joan Robinson, Gottfried Haberler, and most significantlyJacob Viner.8 Brahmananda must have felt very happy when the work of his student,Krishna Bhardwaj, on Sraffa became more popular than his own on the subject.Brahmananda had an immense fascination for monetary theory and policy. He wasquite critical of excessive money supply through RBI credit to the Government.This was quite vividly explained in his book, Growth-less Inflation with StocklessMoney.
As in developed economies such as U.S.A., India too experienced economicstagnation and inflation in the early seventies. As I mentioned earlier, he tried tokeep a distance from the Government. However, in the seventies, when inflationwas running around 20 per cent, he and C.N. Vakil felt they should influence thepolicy. Instead of hobnobbing with those in power they got about 140 professionaleconomists to rally behind them to submit a memorandum to the Prime Minister.Vakil and Brahmananda formulated a plan in 1974 that came to be known as‘SEMIBOMBLA’ to tackle the problems of stagnation and inflation.9 It proposedfloating of government bonds to meet the government expenditure instead ofborrowing from the central bank. The latter approach followed by governmentwould increase the money supply and would cause inflation. It was considered asignificant intervention on the part of economists in the country to improve theeconomy.
His recent monumental work on monetary history of India in the 19th centuryand his writings on monetary economics and monetary policy in India make himIndia’s equivalent of Milton Friedman (Brahmananda 2001a). His edited work withL.K. Deshpande and E.A.G Robinson on employment policy in India is anothersignificant research monograph published by the International EconomicAssociation in two volumes (Robinson et al 1983).
His earlier theoretical studies of the sixties and seventies were based onhis scholarship starting from classical economics to marginalist revolution followedby Keynesian and Monetarist theories. He demonstrated such a scholarship onceagain by writing about the evolution of economic theories and methods centredaround the contributions made by Nobel-prize winning economists and those ofwhat he aptly called ‘Nobel peers’ who should have received such honours if theprize were to exist prior to 1969 (Brahmananda 2001b).
Brahmananda presided over the diamond jubilee meetings of IndianEconomic Association in 1976 and served that Association and managed its officialjournal for several decades until his death.
The brief discussion above on his work explains why Brahmananda wasunanimously elected as Honorary President of the International Economic
128 Journal of Social and Economic Development Jan. - June 2003

Association at its 13th World Congress held at Lisbon, in September 2002. Onlythree other Indian economists have earned that distinction before him: C.N.Vakil,Sukhamoy Chakravarty, and Amartya Sen.
Towards an Ideal Professional Tribute
The life and works of Brahmananda raise several interesting questions. Iwish to raise some of them and suggest ways of answering them by setting up anagenda for future research that could be a fitting tribute to Brahmananda.10 It is nowa standard part of business curriculum to study what underlying causes are behindsuccess and failure of business organizations. Such knowledge helps businessesto benchmark their performance and excel. Perhaps this kind of thinking was behinda provocative suggestion made by the late Prof. V.K.R.V. Rao. Just a few monthsbefore his death, V.K.R.V. Rao addressed a group of college lecturers at ISEC andsaid: economists study how consumers behave, how entrepreneurs behave, andhow investors behave, but they do not study how economists behave. He said itwould be useful to take up that as a research topic.
The above remark made by V.K.R.V. Rao and a review of Brahmananda’swork suggests that we must ask the following questions: (i) why did Brahmanandawork and produce the research that he did? (ii) why was he not successful ingetting his wage-goods model accepted by the panel of economists over that ofMahalanobis’ model? (iii) how can economists work further on his ideas to make hiswork more significant and relevant?
Why did Brahmananda and Vakil not succeed in selling their wage-goodsmodel? Recall my question to Brahmananda on why Vakil had not recorded hisdissent. I had told Brahmananda that I was puzzled why Gadgil—who made animportant observation that the draft plan document was silent on how relativeprices (that determine economic incentives) were determined—had approved thedraft plan. It is my opinion that effective advocacy should be a part of an economist’stools. It must be based on scientific principles of logical consistency and credibleevidence. I had met Professor P.C. Mahalanobis a few times, and had read many ofhis writings. I have written about his life and works (Kumar 1992, 1994, 1997). Inspite of the current fashion of Nehru-Mahalanobis-bashing, I am of the opinionthat Mahalanobis was quite effective in his advocacy of his draft plan. He did theneeded homework better than Vakil, Brahmananda, Gadgil and the host of the panelof economists.11
There are four different ingredients of an economic policy model. Theseare: (i) the social welfare function or the objective function, (ii) the institutionalenvironment under which the economic agents function such as the marketmechanism, government regulations, technology available etc. (iii) a description ofhow the macroeconomic aggregates are related to each other—or a macroeconomic
Vol. V, No.1 Kumar: P. R. Brahmananda — His Work, and Beyond 129
model, and (iv) constraints imposed on the system which are external to the economicpolicy model, constraints such as self-reliance, foreign exchange constraints,dependence on weather, etc. 12 A normative policy model will have all these fourcomponents, while a positive model will have all except the first ingredient, thewelfare objective function.
I have demonstrated elsewhere (Kumar 1997) that Mahalanobis statedquite clearly all the four components of the policy model. Through counterfactualsimulations he obtained, corresponding to alternative feasible policies, a set ofincome and employment targets at the end of the perspective plan period andshowed empirically that one of them was the best. Vakil and Brahmananda did nothave such a quantitative and empirical model to demonstrate their point of view.Had they shown empirically, through counterfactual simulations, what would bethe growth and distribution of income and the relative prices under the two alternativemodels and challenged Mahalanobis with a viable alternative the situation couldhave been much different. 13
I shall now return to Brahmananda’s last comment published in BusinessLine on introducing competitive economic ideologies with differences in economicobjectives and choice of different policy instruments. It must be remembered thatNehru and the leading Congress party gave the policy objectives and constraintsto Mahalanobis. They were not what Mahalanobis chose from his Soviet bookshelf.The mechanical model for generating the income growth was chosen by Mahalanobis,possibly from his Soviet bookshelf. But did anyone confront him with an alternativethen? One cannot judge the plan strategy of Mahalanobis with today’s objectivesand today’s constraints and today’s model of the mechanics of development.Economists cannot impose their objectives on the economy. They should interactwith the political parties and advocate the desirability of having some economicobjectives and pursue them by means of certain policy instruments. Differenteconomists with different ideological leanings can attempt to influence differentpolitical parties. Finally, in a democratic set-up it is the political platform of thedominant coalition that will dictate what policy objectives are chosen and whatinstruments are chosen. It is this point of view that Brahmananda seems to have forthe interaction between economics and politics in his last contribution to BusinessLine. It is a laudable agenda that economists and political parties must followtogether.
After reading Brahmananda’s work, and that of Gadgil and Asok Rudra, Istrongly feel that there could have been an alternative model, ingredient (iii) in theabove structure of a policy model, which could have been used to describe theworking of the Indian economy at that time (1957–72).
Brahmananda was an erudite scholar, no doubt, but there were some gapsin his arsenal for effective advocacy. One might sometimes wonder, as I do, if the
130 Journal of Social and Economic Development Jan. - June 2003

arguments he advanced are logical and consistent throughout. This is due toBrahmananda’s style of keeping everything that seemed to matter in his mind andnot to use mathematical formulation. Brahmananda could have said that themathematical method tries to choose an abstraction to reduce everything to symbolsand equations. One is then limited in his abilities to abstract the reality by hismathematical skills. The questions to ask then are: (i) how much is lost in simplifiedmathematical abstraction limited by one’s mathematical skills? and how much is lostin the form of logical inconsistency between parts of a more complex verbaldescription? His models must be examined carefully with respect to their internalconsistency through a rigorous mathematical reformulation. They must be checkedagainst the facts through econometric testing. This should be done.
There are controversies in economic theories. Theories evolve. A theorythat once was rejected comes back into circulation in a different enriched form. Atheory that is found to be relevant at one time and place may be found to beinadequate at some other time and place as the four components of the policymodel listed above differ from place to place and from time to time.14 We musttherefore examine different theories and models continuously, try to enrich them bytaking the best features of each, and come up with the best possible product that isthe need of the times. Is it not what we say that characterises technologicalinnovation? And is it not what a patent examiner looks for before awarding a patentto a new innovation?
We must learn from the past through a systematic examination of failuresand successes. Brahmananda’s wage goods model has elements of Hayek’sproduction and prices. Brahmananda dealt with the Hayek-Keynes debate onproduction and prices in his contributions described above. That debate is stillgoing on!15 We must have a similar debate between the alternative paradigmsdescribing the mechanics of Indian economic growth and the economic policystrategies that arise from each.
The above remarks suggest that there is a need to establish a researchprogramme that can benefit from economies of scale and scope by drawing theresources of different institutions with which Brahmananda was associated—Bombay University’s Department of Economics, Institute for Social and EconomicChange, Indira Gandhi Institute for Development Research, and the Reserve Bankof India. This can be done through formation of a consortium. The objective of thisconsortium should be to initiate and promote research on Theoretical and EmpiricalStudies on Indian Economy. As a regular feature this consortium may organise onenational seminar every year around December to review the Indian economy and topresent its recommendations for the budget of the following year. Itsrecommendations will then have a definite impact on the budget proposals of the
Vol. V, No.1 Kumar: P. R. Brahmananda — His Work, and Beyond 131
Government. This Centre may be named after Brahmananda. That, in my opinion, isa fitting tribute to Brahmananda and to others who participated in this giant trialand error exercise of framing economic policies for the country, both from withinand outside the government. As a first step, ISEC may consider organizing a nation-wide seminar to start the debate on the relevance of Brahmananda, Mahalanobisand planning.
Notes
1. Some of the good obituaries are written by S.S. Tarapore, former Deputy Governor ofRBI, in Financial Express, and Jayaram Ramesh in The Economic Times.
2. I will return to this view of Brahmananda later to make some observations of my own.
3. See his piece ‘The Study of Economics: A Revolution in the Offing?’ Business Line,October 3, 2001.
4. Planning for an Expanding Economy, Bombay: Vora & Company, 1956.
5. B. R. Shenoy had recorded his dissent.
6. As I will comment later, Brahmananda was perhaps not fully convinced at that stagethat he had a better model than that of Mahalanobis.
7. See Brahmananda (1969: 227). One may argue that the stagflation and Phillips’ curveparadox is also due to this error of using closed economy models when countries facedprice shocks on traded inputs (oil).
8. His paper ‘A Ricardo-Jevons Type Critique of the Sraffian System: The Vision of aNew Foundation,’ a typescript, is in the Sraffa collection of papers at Trinity College,Cambridge, along with five documents showing the correspondence Brahmananda hadwith Sraffa.
9. SEMIBOMBLA stands for Scheme of Economists for Monetary Immobilizationthrough Bond Medallions and Blocked Assets. See Vakil (1974).
10. Although some of my comments below seem critical of Brahmananda’s work, those areconstructive criticisms. My ultimate aim is to enhance the significance and relevance ofBrahmananda’s wage-goods model by suggesting further research on the topic.
11. It must be noted, however, that Mahalanobis had much more resources than all theeconomists put together had. In addition, I wonder if all those economists suffered fromany conscious or subconscious feeling that economics and economists are inferior tophysics and physicists! For effective advocacy one must rid oneself of such a feeling ofinferiority and must cultivate an ability to argue and debate with credible evidence.
12. This basic structure of a policy model is either not known to economists, who are oneither side of a policy debate, or they deliberately ignore it. There are three types ofeconomists, (i) those who change with changing views and theories of economics,
132 Journal of Social and Economic Development Jan. - June 2003
picking the best and the most relevant; (ii) those who change their views to suit thoseof the government and thus become the core-group economists for governmental policy;and (iii) those that do not change their views and remain either sterile or dogmatic.
13. Based on a recent conversation with eleven eminent Indian economists regarding thepre-reform and post-reform scenarios in India, the editor/moderator of thoseconversations says: ‘The economic philosophy and policies that India’s economistsshaped were conditioned by the prevailing ideology and orthodoxy during the decadesof the fifties and the sixties.’ ‘For all its faults Nehru’s development strategy was nota total failure; it did deliver moderate growth with stability until the early sixties.’ SeeIntroduction in V. N. Subramanyam, Conversations with Indian Economists, Macmillan,2001. Brahmananda was one of those eleven economists interviewed. Brahmanandapraised Mahalanobis for his vision, while advocating the usefulness of his wage-goodsmodel. This seems to suggest that Brahmananda was not fully convinced that his modelwas better than that of Mahalanobis.
14. This is why we hear people say that Keynes is not a Keynesian and that Mahalanobiswould have disagreed with his own strategies in the context of India that prevailed in1990.
15. See Volume IX of Hayek’s collected works, Bruce Caldwell (Editor), Hayek ContraKeynes and Cambridge, 1995; John P. Cochran and Fred R. Glahe, The Hayek-KeynesDebate-Lessons for Current Business Cycle Research, Lewiston, New York, The Edwin-Mellen Press, 1999.
References
Brahmananda, P.R. (1967). The New Classical Versus the Neo-Classical Economics Standpointsat the Glow of a Circular Revolution. Prasaranga, University of Mysore.
——— (1969). The Gold-Money Rift. Mumbai: Popular Prakashan.
——— (1974). Explorations in the New Classical Theory of Political Economy. Bombay:Allied Publishers.
——— (2001a). Money, Income, Prices in 19th Century India: A Historical, Quantitativeand Theoretical Study. Mumbai: Himalaya Publishing House.
——— (2001b). Nobel Economics — A Historical Commentary from the Classical Angle.Mumbai: Himalaya Publishing House.
Desai, Meghnad (1999). PRB: An Appreciation of Brahmananda. Foreword in Vasudevan,A.; Nachane, D.; Karnik, A. V. (eds.). Fifty Years of Development Economics:Essays in Honour of Professor P. R. Brahmananda. Mumbai: Himalaya PublishingHouse.
Vol. V, No.1 Kumar: P. R. Brahmananda — His Work, and Beyond 133
Kumar, T. Krishna (1992). Forgetting to Remember. Economic and Political Weekly, Oct 17.
——— (1994). Mahalanobis’ Contributions to Economic Planning. Economie Appliquee:131-51.
——— (1997). An Unfinished Biography: Prasanta Chandra Mahalanobis. Economic andPolitical Weekly, June 7.
Robinson, E.A.G., P.R. Brahmananda, and L.K. Deshpande (eds.) (1983). EmploymentPolicy in a Developing Country: A Case-Study of India (Pune, India, 1980), Vols.1 and 2, Macmillan.
Vakil, C.N. (1974). Memorandum on a Policy to Contain Inflation. Bombay: Vora & Company.
134 Journal of Social and Economic Development Jan. - June 2003
40th ANNUAL CONFERENCE OFTHE INDIAN ECONOMETRIC SOCIETY (TIES)
ANNOUNCEMENT AND CALL FOR PAPERS
The 40th Annual Conference of the Indian Econometric Society is scheduledto be held at Institute for Social and Economic Change, Bangalore, fromFebruary 13–15, 2004. Those submitting papers for the conference shouldsend an abstract (300 words), two copies of the full paper along with adiskette to the Convenor (Programme Committee):Dr. Arup Mitra, Institute of Economic Growth, University of Delhi Enclave,Delhi - 110 007. e-mail: [email protected] mark a copy of the abstract and paper to the President of the Society:Prof. B. B. Bhattacharya, Director, Institute of Economic Growth, Delhi - 110007.The last date for submission of papers is December 15, 2003. Communicationof paper acceptance will be conveyed to the authors in the first week ofJanuary 2004.

Book Reviews
Maarten Bavinck. Marine Resource Management: Conflict andRegulation in the Fisheries of the Coromandel Coast. Livelihoodand Environment – 5. New Delhi: Sage Publications. 2001. Pp.395.Rs.595 (Hardback).
In the emerging globalised, unipolar and increasingly inequitable worldorder, any study on the marginalised and particularly indigenous communities isnot only a worthy academic pursuit but also a genuine response to the stillunquenched longing for a just and humane world order. The book under review ispart of the ‘Livelihood and Environment’ Series, which tries to ‘describe the strategiesadopted towards livelihood maintenance at the levels of the individual, householdand other organised groups of people.’
Marine fisherfolk are a besieged lot. All around the world, from the coldestArctic regions to the warmest tropical seas, there is a crisis in fisheries. There aretoo many people chasing too few fish. The coastal ecosystem in many places isclose to ruin. There is now severe competition for the use of coastal areas by newentrants like ports, tourism projects and so on. Of the many manifestations of thiscrisis the conflict between the artisanal fisherfolk and the mechanised sector hasbeen the most visible. Maarten Bavinck argues in this book that the inevitablecollision of traditional modern fishing is not merely technological. It involvesconverging, antagonistic systems of sea tenure. Sea tenure issues are the core offishermen’s livelihood (p.24).
The author examines three tenurial systems, the age-old territorial claimsand fishery regulations of the artisanal fishing community, the rule systemestablished by the newcomers, the trawler owners and the legal conventions of theState. The analysis of these tenure systems is based on the assumption that seatenure systems form a special class of legal systems and that a constellation of seatenure systems can be analysed as a manifestation of legal pluralism. The locationof the study is the Coromandel Coast of Tamil Nadu, and specifically Royapuramharbour and Chingleput District.
The study explores a relatively unexplored area. The questions raised aresharp and relevant. The question whether the inshore fisheries of the Coromandelcoast actually have the three systems of sea tenure, and if so how they are structuredleads to a lucid presentation of the artisanal fishing sector with analysis ofoccupational diversification, social stratification, sexual division of labour, thegovernment administration and the social and cultural entity of the village understudy. Along with the documentation on the artisanal economic activity and itsrelation to trawlers, there is a graphic exploration of the social and economic structureof the village, the story of change and transformation.

The author identifies two important components of the artisanal tenuresystem: a notion of open access to fishing grounds and a sense of territoriality. Therestrictive measures are based on three conceptions of harm: harm to the fishinggrounds, to the majority style of fishing, and to the community as a social entity.The artisanal tenurial system emphasises both the regulatory prerogative with aparticular sea territory and the long-term survival of the fishing community. Thepanchayat set-up has demonstrated an extraordinary capacity for operating thistenure system.
However, into the relative smooth system of artisanal fishing came themechanised boat fishermen challenging the artisanal system. In the context of legalpluralism, the second major research question is asked. What kind of relationshipsexist among people who identify themselves with a particular sea tenure system?And how do the systems interrelate? This question leads to an elaborate analysisof the mechanised sector in Royapuram and their rule system, though the author isof the opinion that unlike in the artisanal sector the boat-owner associations havelimited control over their members as well as over the boat fishing industry.
The latest arrival on the scene is the State, through the fisheries department.The author’s analysis spans the official policy and an implicit set of conventions,highlighting the fact that it is fragmentary and incomplete. He acknowledges thatthe situation is complex owing to the political equations, the dissonance betweenthe Act and the enforcement capabilities, and the opposition from the surroundingboat fishing population. Eventually, the fisheries department strives to let fishermenmanage their own affairs, even if their solutions contradict official marine regulationpolicy. Only in certain circumstances, when conflict erupts into the open, does thedepartment intervene. The fisheries department’s incidental involvement in artisanalfisheries regulation and structured participation in the regulation of mechanisedboat fishing is due to a combination of external exigencies, including the two sectors’leverage in government circles.
The author argues that the three parties have, over a period of time, becomeaccustomed to the existence of the other tenure systems. All parties have realizedthat the others are here to stay and they have learned to accommodate. There is adynamic nature to their interaction. The conflict between the three actors is notnecessarily the automatic result of a collision of sea tenure systems, but ratherdepends on a variety of conditions. The intensity with which fishing practicesconverge is a factor. The higher the rate of convergence, the more the conflicts thatare likely to occur. A second factor is the development of landing prices for seafood.Third, the existence of positive ties between the antagonistic parties may bluntwhatever conflicts may arise, whereas their absence may encourage disputes. Fourth,the duration of the conflict has some predictive value for the chance that adjustmentswill occur. Fifth, the extent to which the parties have organised themselves and thestate of this organisation have an impact on the conflicts (p.360).
136 Journal of Social and Economic Development Jan. - June 2003
Methodologically, the author breaks new paths. His use of theory, linkingof sea tenure studies and legal pluralism, mix of quantitative and qualitative dataand moving away from a naïve dualistic thinking (e.g. artisanal fishermen are non-capitalist whereas boat owners are capitalist; artisanal fishermen are moreconservation-sensitive, whereas boat owners are more profit-oriented and marketguided; artisanal fishermen are guided by a sense of ‘limited good’ whereas boatowners subscribe to a ‘myth of superabundance’ etc.) make this study a uniquecontribution.
Ultimately, the issues of the fisheries sector boil down to a matter ofsustainable fisheries management. Fisheries management, in the final analysis, is apolitical issue. And the big question that remains is whether there is enough politicalwill in this country to put into practice the insights generated by such insightfulstudies.
Department of Sociology M. K. GeorgeLoyola College of Social SciencesThiruvananthapuram
Ariel Dinar (ed). The Political Economy of Water Pricing Reforms.New York: Oxford University Press. 2000. Pp.405.
This volume brings together edited papers from a Workshop on PoliticalEconomy of Water Pricing organised by the World Bank in 1998. They fall into threebroad categories: (1) those highlighting limitations of the market mechanism fordetermining water prices and allocations and the need for institutional arrangements;(2) broad issues of pricing reform emphasising the importance of political-economyfactors; (3) case studies of attempts at water pricing reforms and restructuring ofwater management institutions.
Many contributors examine why viable and efficient water markets are notfeasible: The very nature of water makes it difficult to ensure well-defined andtradeable property rights; individual right holders cannot have independent controlover their supply; individual water sellers cannot ensure buyers get the wateraccording to contract; pervasive predatory appropriation of entitlements. Thesefeatures are due to the fact that users get their supply from a common sourcemarked by indivisibilities and scale economies. It is therefore necessary that waterallocation and pricing be subject to administrative regulation.
Prices are obviously an important instrument for influencing user behaviour.A major reform of the pricing system to reduce subsidies and correct distortions inthe pricing structure is essential to induce more efficient use of water. Some believethat water markets could play some role in rationalising water prices, and that wateragencies can choose ‘market mimicking’ regimes. But they all recognise that pricing
Vol. V, No.1 Book Reviews 137
has to be combined with other instruments. The choice of instruments is, however,constrained by incomplete and asymmetric information and transaction costs. Theseare compounded when the water agency has to address issues regarding equitabledistribution of the common resource, externalities in its use and long-termsustainability, none of which can be mediated by the market. They call for collectivedecision making through multilateral bargaining, and negotiation involving allstakeholders.
Key issues of urban water pricing and its reform are reviewed by severalpapers — some in general terms and others in specific contexts. A variety of schemesare in vogue. Single and two or even multi-tier tariffs, uniform rates for differentclasses of users based on cost of service and various schemes of discriminatorypricing favouring poor consumers on equity considerations (increasing block tariffs),differential costs of supply and monitoring between large and small users (decreasingblock tariffs) and seasonally differentiated rates (to reflect seasonal differences insupply-demand conditions). Hewitt reports that the majority of US water utilitiesuse discriminatory pricing schemes. Increasing block tariffs are widely advocatedand practised in developing countries on equity grounds. This is questioned, basedon evidence from a study in Flanders, Belgium. It has also been argued (Boland andWhittington) that the equity goal can be better achieved by a simpler scheme ofuniform volumetric pricing coupled with a uniform lumpsum rebate to all. Many callfor better data on the price sensitivity of water consumption of different users indesigning rate structures to realise the given revenue objective.
Marginal cost pricing, advocated by neoclassical economists, has nothad many takers partly because of inadequate and unreliable data on costs anddifficulties of allocating joint costs to different users but also because it is indifferentto distributional considerations. Hall recounts how and why the Los Angeles waterauthority switched over from historical cost-based design to marginal cost-baseddesign with differential rates varying with expected consumption and by season.The paper attempts to explain both the original design and acceptance of change interms of the relative power of different interest groups (consumers, water agencyofficials and the political leaders).
The case studies of the political economy of water pricing reform in specificsituations are a mixed bag. In the Moroccan case, Diao and Roc argue that a strategyof combining trade reform with creation of a market in tradeable water rights hasbetter chances of success than changing administered water prices. A generalequilibrium model is used to show that trade reform will significantly alter therelative returns in favour of crops that use water more efficiently and that byintroducing water market in that context will facilitate the reallocation of water tomore efficient uses.
Case studies of the experience with water pricing reforms in specific
138 Journal of Social and Economic Development Jan. - June 2003

countries underline the importance of both informational and analytical basis forproposed changes, as well as of securing a broad-based political consensus amongthe stakeholders. For example in Dakar (Cueva and Lauria) rate revisions werelimited to households and ignored the politically powerful non-household segments(gardens and public fountains) who accounted for a major part of water use. Evenin the case of households, the sensitivity of consumption of public water supply ofdifferent categories of households to rate changes was ignored, thereby risking theprospects of achieving the revenue target.
In the case of Honduras, Strand lists the various interests groups concernedwith water and their attitude to reform. Attitudes vary widely from mild interest tostrong opposition. So do the resources they have to influence policy. But hardlyany of them shows a strong interest in pushing for reform. Whatever reform wasattempted was under inducement (loans) and pressure from the World Bank. Buteven strong external pressure will not work unless internal circumstances areconducive and a political consensus is forged through widespread, informedconsultation of all interests.
This message is further underscored by the experience of attempts atpricing and institutional reforms in relation to irrigation and overall water resourcemanagement. In all the six countries reviewed in this connection (Australia, Brazil,Mexico, Morocco, Pakistan and Yemen), the need for reform, including large increasesin water prices and their rationalisation, improving efficiency and sustainability arecompellingly evident. In practically all of them, governments have declared theircommitment to reform and also introduced legislation for radical restructuring ofthe organisational structure for water resource management involving the creationof unified basin organizations, stakeholder representation in management, creating‘independent’ regulatory bodies, clearer definition of water rights and, in somecases, enabling trade in these rights. But except in Australia, this was a ‘top-down’process led by senior officials and political leadership without any serious effort toconsult stakeholders and forging a broad-based political consensus on reforms.Interestingly in all these cases except Australia, external pressure, mainly from theWorld Bank through loans and loan conditions, helped to set this top-down processin motion. Progress at the ground level has everywhere been slow owing toopposition from vested interests.
From the evidence cited in the papers, the impact on the water fisc and useefficiency can hardly be called significant. Politicians and water managers are loathto confront difficult issues, especially of internal restructuring of water utilities.Increasing water rates is a political hot potato. The papers on Morocco and Yemengrossly oversimplify the problem by suggesting that the needed changes in thewater price structure can be wrought by combining trade liberalisation with legalchanges to confer well-defined and tradeable water rights to users and permitting
Vol. V, No.1 Book Reviews 139
them to be traded.The Australian case shows the importance of internal pressures for reform.
Environmentalists stirred up public awareness of the deleterious effects of the waywater resources were being managed and priced. Attention was called to the growingstrain on the governmental fisc and the realisation that water subsidies were animportant factor and water sector reforms were a necessary part of fiscal strategy.Water utilities also needed more resources for investments to improve watermanagement, check deterioration in water quality and address increasingly insistentenvironmental concerns. These forces were mobilised not only to educate publicopinion, widen the constituency for reform, but also to get the issues and possiblesolutions studied by independent professionals, and have them discussed in openforums with all stakeholders to arrive at a broad enough consensus to get politiciansto act. The Australian experience, like that of Los Angeles, shows that this isfeasible, given concerted mobilisation within civil society; and also that the process,though tedious and protracted, can significantly improve the chances of gettingwider acceptance of reforms and support for their implementation. It is also clearthat this is not a one-shot affair in the face of resistance from strong vested interests.
The main message of this collection is that the scope of water sectorreforms must go beyond pricing to address equity, environmental requirements andsustainability, as well as restructuring institutions for wider and meaningfulstakeholder participation both in water policy reforms and in water management.Equally important is the message that the market cannot handle the tasks of efficient,equitable and sustainable water uses, and institutional restructuring must be basedon the recognition of water as a common pool resource to be managed collectivelythrough public enterprise institutions and that decisions must be the result ofnegotiated compromises between the stakeholders. That these messages comefrom the World Bank is significant and hopefully will temper the zealousness of itsadvocates of privatisation and marketisation of water.
Madras Institute of Development Studies A. VaidyanathanChennai
Thomas Fisher and M.S. Sriram. Beyond Micro-Credit: PuttingDevelopment Back into Micro-Finance. New Delhi: Vistaar Publi-cations. 2002. Pp.390. Rs.340.
Microcredit has become widely accepted as a development tool all overthe world and has grown significantly as a sector within India. More and moreNGOs have begun to engage in microfinance, commonly understood as small loansgiven to women’s groups, normally formed of 15 to 35 women, and referred to as selfhelp groups (SHGs). The women members of such groups pool their savings at
140 Journal of Social and Economic Development Jan. - June 2003
weekly or monthly intervals and often rotate it among one another as small loans.They also access external finances either through a Non-Governmental Organiza-tion (NGO), Microfinance Organization (MFO) or a bank.
A large number of organizations, including NGOs, MFOs, NBFCs andformal financial institutions, have begun to add micro credit to their activities andsome have become specialized MFOs. Some of these have development objec-tives, others aim to achieve financial sustainability through achieving scale econo-mies and charging comparatively high rates of interest. Thus the Indian scenariospans a multitude of organizations that offer a range of financial services throughdiversified organizational forms, using varied methodologies and having differentscales of outreach, products, and costs returns. As a result, each organization isdifferent in the way it envisages development impact and seeks to achieve it.
The Indian scenario offers diversity and a unique set of experiences fromwhich to learn. Equally, there are several questions that the MF sector in India hasfar from resolved. The book under review identifies and analyses several of thesequestions.
First, it raises the question of whether organizations that provide micro-financial services are also developmental, and how microfinance can be combinedwith development objectives. It includes several case studies along with analyticalchapters. It arises from an organizational development project managed by theNew Economic Foundation (NEF) in London, that involved working with SewaBank, PRADAN, CDF and BASIX.
The first chapter of the book outlines the aspects, which the book pro-ceeds to address in the following chapters. It challenges a narrow focus on the‘technical’ aspects of the MF sector, as well as weak performance. It challenges‘some of the ideals of local democratic organization by looking at the hard realities’(25) of how SHGs work. Also, it raises the question of collective ownership oforganizations delivering microfinancial services. Chapter 2 provides a chronologi-cal account of the development of the microfinance sector in India, and the differenttypes of organizations that it comprises.
Chapter 3 discusses the issue of social and economic security of poorwomen in the light of the experiences of SEWA Bank. The organizational analysisbrings out the financial benefits of such linkages, in terms of access to savings ofthe women, as well as the major strength of the bank, which is to offer women a widerange of financial services, appropriate to the needs of the women. The financialservices are offered within a coherent development framework that seeks to reducewomen’s vulnerability to shocks. However, important lessons derived from women’sownership of the bank, their participation in giving it direction, and how this mayhave changed the functioning of the bank and led to the empowerment of women,have not been touched upon.
Vol. V, No.1 Book Reviews 141
The fourth chapter utilizes the experience of BASIX to highlight the po-tential of integration of provision of microfinancial services with a wider range oftechnical assistance and support services. As BASIX has, ‘livelihoods promotion’of people as its development objective, it has engaged in projects that enhancelivelihoods in different ways such as reviving rural infrastructure, dry-land agricul-ture productivity improvement, inter-borrower expertise exchange, and market link-age programs. BASIX has attempted several innovative approaches with the ob-jective of making a significant impact on the local economy through multipliereffects. The book cautions, however, that disparate support activities may not addup to a coherent livelihoods promotion strategy and calls for strategic thinkingabout non-financial activities. The analysis does not, however, deal with WHY theinnovations of BASIX have been disparate. The answer may lie in the fact thatdevelopment organizations often need to make funding partnerships that are timebound and project bound, and may or may not have a link with the overall strategyof an organization. However, it may also be that MFOs are so preoccupied withattaining financial sustainability that designing a coherent and long-term strategyfor clients sometimes takes a back seat to the ultimate prerogative of securingprofits.
The next chapter examines the potential of MF as a tool to build socialcapital. The experiences of the Cooperative Development Foundation (CDF) areanalyzed, and placed alongside lessons from the experiences of MYRADA andPRADAN. These lessons relate to questions of accountability, management, con-trol and ownership of assets and profits of a MFO. The authors believe thatpeople’s ownership of a MFO should not be seen as conflicting with financialefficiency parameters.
Chapter 6 continues to examine another challenge for MFOs—environ-mental issues. SEWA followed a strategy to promote recognition and rights of poorself-employed women, whilst DHAN and BASIX follow a strategy of saturating anarea with SHGs in order to have a significant impact on the economy. Meanwhile,Sa-Dhan, a network of Indian MFOs, seeks to influence policy and the regulatoryenvironment, and CDF’s struggle, campaigning and research, led to change in thelegal environment in which cooperatives function, not only in Andhra Pradesh, butin other states as well. Indeed, the campaigning still continues. The book alsocautions that organizations that begin to get absorbed in leading system-widechange tend to have less time for internal organizational issues. In addition, theymust also face pressures of organizing networks and steering the diverse organiza-tions in these networks towards cooperative relationships.
The next chapter compares SHGs with the Grameen bank type groups. Itcompares costs of forming and managing these groups, the products they offer,flexibility in the group mechanism and how tasks, as well as profits, are shared.
142 Journal of Social and Economic Development Jan. - June 2003
While it appreciates the democratic processes in SHGs and recognizes their poten-tial for empowerment, it also rightly cautions that these groups are vulnerable toexploitation by local leaders or politicians. Those familiar with the IRDP experienceknow that the nexus between politicians, government officials, bureaucracy andbanks can defeat the objectives of any development plan.
Mathew Titus discussed this issue further in Chapter 8 in an analysis ofthe experiences of groups in urban areas, through SHARAN, an NGO-MFO basedin Delhi. He categorizes costs incurred due to losses caused by non-repayment ofloans and misappropriation of savings or insurance instalments, and emphasizesthe risk caused by imperfect information. He highlights the inadequacy of skillswithin NGOs and SHGs in managing groups as well as financial transactions lead-ing up to a case for capacity building.
Chapter 9 the different stages of development of SHGs. The tasks, pro-cesses, leadership and traits of leaders are analyzed in the context of social entre-preneurship. The experience of PRADAN in promoting leaders in Hazaribagh andLohardaga districts of Bihar (now Chattisgarh) is described most candidly. Theauthor tempers the expectations from SHGs with realism and highlights the need forcapacity building of both staff of NGOs and promoters/ leaders of groups. He failsto see that just as NGOs need to invest the time and effort to promote leaders, thereis also a need for investment in capacity building and articulation of group mem-bers, so that they may be able to demand good leadership and hold their leadersaccountable.
Frances and Sinha, in Chapter 11, summarize the experience of MCRIL inrating MFOs and of EDA Rural Systems in impact assessment. They find thefinancial performance of Indian MFOs rather weak and suggest that Indian MFOnot only need to improve their capacity to be financially sustainable, but must alsoput in more effort to measure and assess the impact they make.
Titus, in chapters 12 and 13, discusses the need to address the issuesraised in the book as the MF sector has a critical role to play in the country and forwhich stakeholders’ support is crucial. He calls for the government to withdrawfrom the implementation of MF and concentrate on creating a conducive policyenvironment. He outlines the policy framework and regulatory environment inIndia and calls for freeing up the circumstances under which cooperatives function.He rightly points to the need for some regulation of SHGs, which are currentlyunregulated, making women members vulnerable to their leaders who may be inca-pable, inefficient or corrupt in the handling of financial affairs of SHGs. He laysdown a role for apex organizations and donors. The paucity of resources for capac-ity building is stressed, especially for those who are facilitator NGOs and not MFOsthemselves, and is in line with recent critiques of donor funding in the microfinancesector (See Premchander 2002).
Vol. V, No.1 Book Reviews 143

The final chapter points to the need to view MF services as a means to anend and not an end in themselves, and advocates the adaptation of MF to context.It also recognizes the distinct role of NGOs in providing a value base, as well astaking up developmental tasks, for example, through attracting grant funding. Itemphasizes the potential for NGOs and the need for MFOs to create a more condu-cive work environment and thus engage with larger systems, including economicsub-sectors and banking structures.
The book calls for an approach that combines efficient financial serviceprovision with development objectives; for one that creates competencies amongstaff and SHGs and also creates space for an organization and its field staff toengage in practice and reflection. It also advocates working towards resolvingissues around ownership and control, and to develop innovative ways for capacitybuilding.
The book also outlines the current institutional structure, but does notcritically analyse the lessons that the MF sector needs to take on board from theexperiences of related sectors. For instance, an analysis of the experiences of thebanking sector would offer several lessons regarding organizational and institu-tional issues. Meanwhile, an exploration of the cooperative sector would shed lighton further issues such as outreach, effectiveness and system-wide change. TheNGO/MFO sector has mostly sought to reinvent the wheel and learn lessons longknown to the Indian banking sector about costs, risks, managerial and organiza-tional issues in MF and so on. The mainstream is questioned and criticized but nolegitimate lessons are drawn to prevent potentially wasted sector-wide efforts to-wards what is termed ‘innovation.’
However, the book makes several valuable contributions. It examines bothnegative and positive experiences and draws lessons from these, for either capacitybuilding or attention to issues like organization forms that are equitable to poorwomen. It adds to the debate among those involved in the MF sector and offersvaluable suggestions for those concerned with its development and the path ittakes in the future. It will be of interest to NGOs, MFOs, apex and formal financialorganizations, government and donors.
References
Premchander 2002. Empowering People or Empowering Institutions: VIEWS 6. Bangalore:Sampark.
Sampark Smita PremchanderBangalore
144 Journal of Social and Economic Development Jan. - June 2003

Mahajan Gurpreet. The Multicultural Path: Issues of Diversityand Discrimination in Democracy. New Delhi: Sage Publications.2002. Pp.240. Rs.280.
The problems associated with the coexistence of diverse cultures andethnic groups in democratic societies have provided a basis for vigorous scholarlydebate. Multiculturalism, as an approach to addressing these issues is of relativelyrecent origin. In the book under review, the author makes a comprehensive analysisof the ideas and issues related to multiculturalism.
The book is divided into eight chapters, the first three of which explain thedistinctiveness of multiculturalism against ideas such as liberalism and pluralism.The first chapter aims to affirm the core idea of multiculturalism, namely, that itseeks equality of diverse cultures in public arenas, not merely their plurality. Thesecond chapter points to the problem of homogenization of state policies andargues that cultural community membership is a prerequisite for the protection ofminority culture. The next chapter focuses on diversity. Making a distinction betweenplurality and diversity, it argues for the latter. The next chapter examines the idea ofdifferentiated citizenship and examines different types of special rights that enablethe individuals of the minority community to preserve their culture. The followingtwo chapters represent a feminist and liberal critique of the multicultural positions.An attempt is made to respond to these criticisms in the next chapter. The lastchapter attempts to put forward the agenda of replacing the multicultural reading ofcommunity identity and membership with the idea of non-conformity membership.
Multiculturalist theory is founded on the assumption that the culturalminorities are discriminated against in a democratic system and that the State,despite its claim of neutrality, often reflects the hegemony of the majority community.Based on this, multiculturalists argue that cultural diversity must be ensured. Henceit becomes imperative to provide them with cultural rights to ensure their equalparticipation in the public arenas and their protection and sustenance. These specialrights for the communities are classified into (1) cultural rights in the form ofexemptions, assistance and recognition, (2) self-government rights and (3) specialrepresentation rights.
These special provisions, especially the concept of cultural rights ofmulticultural theory, have attracted severe criticisms from two quarters, feminismand liberalism. While feminism agrees with the basic tenet of ensuring diversity, ithas serious problems with the question of women within these minority communities.Protecting a minority culture through these cultural rights invariably meansprotecting the prevailing community practices, which are mostly patriarchal andagainst the interests of women. They maintain that multiculturalism fails to addressthe power relations that set and perpetuate certain traditions within the minority
Vol. V, No.1 Book Reviews 145
community. Another front where multiculturalism fails to respond to criticism is theissue of minority discrimination within polity because the multicultural understandingof discrete minorities is far from the reality as their minority status is never static.Similarly, multiculturalism fails to understand the instrumentality inherent in minoritypolitics where the elite of the minority community invokes these conceptions ofrights for political advantages.
In chapter seven, which is devoted to responses to the criticisms, theauthor explains the positions of many recent theorists. For example, Kymlicka upholdsthe concept of special rights against group rights, which address the question ofinter-group relations within the community. Another position that Kymlicka adoptsis that these special rights need to be given only to the national minorities, not tothe emigrant minorities. A different line of thinking discernible in multicultural writingsis the position that all cultural diversities cannot be protected by the State, hencethe concept of ‘Limit of permissible diversity’. Bhikku Parekh, one such proponent,argues that ‘operative public values enshrined in the Constitution’ can be used asthe basis for ascertaining whether a particular cultural practice can be permitted ornot. Yet another major concern in multicultural circles is the nature of the rights tobe protected. Should all the elements of minority culture be protected or selectedones? Here Mahajan examines the arguments of Carens, who recommends acontextual approach. That means the claim of each minority has to be examinedindividually and cultural rights may be granted accordingly.
Mahajan, in her last chapter, correctly points out one of the basic butserious features of minority discrimination that has eluded the multiculturaldiscourse. Often it is not the nation state alone that discriminates; other majoritycommunities can be potential discriminators. The author invokes the examples ofShiva Sena who targeted South Indians in Mumbai to prove this point. She arguesthat in such situations the emphasis should be on the rights of individuals ascitizens. Here, State should ensure the basic rights of all citizens against any kind ofviolence from the other community. But the post-Gujarat riots in India seriouslyquestion this stand. What has multiculturalism to offer to minorities where Stateand majority communities together practised discrimination and unleashed violenceby subverting both community rights and individual rights as citizens of India?
Mahajan offers another significant insight, which is pertinent to one ofthe basic ethics of multiculturalism—that the minority culture has to be preservedto prevent discrimination. Here, the author analyses the dynamics of cultural identityand points out that there is a distinction between valuing an identity or practicesand symbols and seeking to preserve it. She explains that members of a communitydo develop an identity with their fundamental distinctiveness but various practicesand symbols are constantly in the process of selection, omission and modification.Here, the attempt to preserve certain cultural practices by multiculturalism becomes
146 Journal of Social and Economic Development Jan. - June 2003

futile. The author brings forth the most significant argument, namely, special rightsfor promoting non-conformist membership. This proposition is the result of therealisation that promoting cultural diversity is not an answer to culturaldiscrimination. The author argues that special rights for minorities are not grantedto protect minority culture or enhance diversity but with a view to sustainingoptions for internal members to continue with this cultural way of life. That meansthe special rights must be given not to the community as such but to the individualsof the minority, as they can carry on the way of life they want. The author calls thisthe special right to non-conformist membership. But this position raises seriousquestions. Do our minority communities give that much freedom to their membersto carry on with the ways of life they think feasible? Even with the assistance ofspecial rights can individuals or groups of individuals resist the hegemonic tendencyfrom within the community? These questions assume significance in the light of theincreasing power of caste and religious organisations and their tightening grip overthe members. Can these cultural rights of non-conformist membership resist theprocess of homogenisation characteristic of the present community identities?Another impression is that though the theoretical arguments of multiculturalismstart with the critique of liberalism as giving undue importance to the individual andoverlooking community, it appears that the author also leans toward a liberal positionin putting forward the idea of non-conformist membership.
Overall, this book is the outcome of a commendable effort to give acomprehensive overview of the theoretical debates within multiculturalism.
Ph.D. Scholar R. SanthoshISEC
K. P. Kannan and N. Vijayamohanan Pillai. Plight of the PowerSector in India —Inefficiency, Reform and Political Economy.Thiruvananthapuram: Centre for Development Studies. 2002. Rs.400.
The electricity sector in India is large (though there is nowhere a calculationavailable about its rupee turnover). It is fundamental to the country’s economicgrowth and prosperity. Yet, this sector has seen little study and research by scholarsfrom other social sciences. The book under review is an important contribution inthis respect. After the Rajadhyaksha Committee Report on Power (1980), it is thefirst to analyse in (even greater) detail the issues that hinder the efficient developmentof the power sector in India. It is a useful introduction to the subject for the explodingnumber of electricity regulators, engineer-dominated utilities, generalist policymakers, the large tribe of consultants, merchant bankers and rating agencies.
Vol. V, No.1 Book Reviews 147

The book is organised into four parts and ten chapters. The first part,titled ‘national scenario’, meaningfully introduces the basic concepts in electricityand provides useful data and analysis of the physical and financial performance ofthe SEBs (state electricity boards). The second part is a diagnostic analysis of thepower sector in Kerala. There is also a good survey of electricity demand analysisand forecasting and of the econometric tools and techniques. It also provides anexcellent framework for analysing time and cost overruns of power projects andtheir effect on costs, transmission and distribution losses and different pricingmodels. The third part is about the surge of reforms in the sector. It gives a usefulreview of the experiences from abroad and then discusses the reforms of the powersector in India. The final part is on political economy of public utilities. It ends witha set of proposals for improving the power sector in Kerala.
There is a marked ambivalence in the book. The data and diagnosis arethorough but the opinions and prescriptions appear to be affected by ideologicalbias. For example, the authors say: ‘However, a further shift in the policy of capacityaddition towards the private sector in line with the liberalisation drives of the 1990shas left this decade “wasted”, with very little investment coming on stream in all thethree sectors, Central, state and private.’ This is surprising. Generation capacityadditions in any sector would only have added to the woes of governments alreadyburdened with the rising part of their financial deficits being accounted for byelectricity. It would have further added to the mountains of receivables in thissector. Indeed, this chapter concludes thus: ‘The Indian power sector, characterisedby inadequate capacity, its under-utilisation, and high level of losses, remains poorin its supply.’
The chapter on financial performance of SEBs analyses the effects of timeoverruns of power projects and concludes that they involve ‘manifold and thusheavy costs—besides incurring the cost escalation of the projects and the powerpurchase costs’; ‘the system also is forced to forgo additional sales revenueobtainable’. The book gives an interesting calculation (Page 90) that estimates theunit costs savings from efficiency improvements on account of operational efficiencyimprovement resulting in reduced power purchase, reduction in over-manning,resulting in savings on establishment and administration expenses, and in interestpayments by introduction of a 1:1 debt-equity ratio. They show that in 1997–98 theall-India system would have gained Rs.94,588.25 million.
They question the value of simple extrapolation of historical trends inforecasting electricity demand growth, better explained as an ‘econometric functionof four “causal” factors; population, per capita personal income, and the prices ofelectricity and natural gas.’ These factors ignore one more. In recent years, developedeconomies have shown significant economic growth accompanied by very lowenergy demand growth due to measures for improving energy efficiencies and
148 Journal of Social and Economic Development Jan. - June 2003
conservation in production, distribution and equipment in use. They suggest thatin less developed power systems like India, ‘growth of demand for power is generallyassumed to be determined by the growth of number of (connected) consumers andthat of intensity of their power consumption (i.e., electricity consumption percustomer), as also the interaction between these two factors.’ They conclude:‘Reliance on past demand data for forecasting purposes thus becomes grosslyerroneous and highly questionable’. A valuable contribution to forecasters is thedetailed methodology and calculations using different forecast models.
The authors cite lack of a commercial mindset and of professionalmanagement for the time and cost overruns in electricity projects in Kerala. Theysay: ‘It is not that the government has no resources meant for power development,because it is actually overspending; the problem is in the inefficiency of management,coupled with the political economy of corruption.’ They suggest some solutions:‘the construction contracts be so structured as to make the contractors liable forstringent penalties in case of non-performance such as time overruns’. They haveestimated the extra energy and revenue realisable as well as the capital cost savingsfrom timely completion of projects.
The authors appear to suggest a link between the incentives offered bythe central government in 1989 for reduction of T & D losses and the manipulationof data including by concealment of these losses under agricultural consumption,in order to win awards. They submit detailed estimates of the savings realisable if T& D losses were reduced to more reasonable levels.
The authors overlook the series of consultation papers issued by theCERC and some State ERCs and their numerous Orders incorporating new principlesfor tariff regulation and determination. For example, the CERC has issued orders onAvailability Based Tariff, which for the first time anywhere, uses a commercialmechanism to improve power frequencies and to bring a better matching of loadand generation forecasts to actual demand and generation. CERC issued the firstever consultation paper on bulk tariffs and a series of papers on risk and return inelectricity, depreciation norms, etc., which were then incorporated in a major orderon tariff norms and principles. CERC also imposed a charge for use of reactivepower with a view to bringing voltage levels under some control. Similarly, someSERCs have attempted to estimate the costs of serving different consumer categoriesand determined tariffs for each. They have used performance-based tariff regulationto target for efficiency improvements especially on reduction of T & D losses. Itwould have been useful to review this work and see whether there are principles forgeneral application.
One ‘of the most pronounced effects of liberalisation of the power sector’that the authors cite from these country experiences is the ‘improved power supplyposition in those countries where power shortage as a major problem was one of
Vol. V, No.1 Book Reviews 149
the primary causalities for the opening up of the power sector to IPPs’. They findthe evidence on efficiency inconclusive, but fail to support such a conclusion. Thechapter gives an excellent analysis of competition in the power sector, a subject onwhich there is little knowledge in the state-owned monopoly situation of India.
However, the chapter on reforms in the power sector in India again paysscant attention to the role of the regulatory commissions. Not to discuss theirperformance, assess their powers and evaluate their effectiveness is a major gap inan otherwise comprehensive study.
The book ends on an ideological note: ‘Privatisation of electricity sectorin the Indian context is obviously ominous of disaster. ..The whole assets,accumulated by two generations of tax payers over a period of half-a-century,would be lost for a one-time paltry payment to the then government to squander.’The authors do not say how the many excellent measures that they suggest onPages 443–450 for improving the electricity sector are likely to be given effect tounder government ownership since governments have shown no ability to introduceany such measures in the past. The results of half a century of government ownershipare well documented in the book. The authors allow their hope that the samegovernment ownership will suddenly do the right things to overcome the excellentanalysis in the book. Further, they make no effort to look at the different privatisationmodels, even in India, to evaluate whether there are safeguards against the dangersthat they fear.
This is an excellent and timely book. It brings scholarship and hard workto bear on a sector hitherto neglected by competent economists. It is a valuableaddition to the literature and deserves to be studied by anyone connected to andinterested in the power sector.
Chairman S. L. RaoForum of Indian RegulatorsBangalore
Amitabh Kundu and Alak N. Sharma (eds). Informal Sector inIndia: Perspectives and Policies. New Delhi: Institute for HumanDevelopment. 2001. Pp.440. Rs.650.
With the adoption of economic reforms in India in 1991 and following asharp decline in employment growth as a consequence, informal sector has emergedas an important source of employment to the poor and the not so poor. Hence,academic attention is being focussed on this sector in recent times. The interest inthe study of informal sector dates back to the early seventies when the ILO carriedout extensive studies in Africa and Latin America. Subsequently, a number ofstudies were completed by researchers and doctoral students in South Asia including
150 Journal of Social and Economic Development Jan. - June 2003

India. But many of these studies were city-based using primary data; not manyattempts were made to carry out national and state-level studies using the vastsecondary data available. That explains why rigorous policy making was not attractedby the informal sector.
The focus of earlier studies was primarily on definition, identification andsize of the informal sector, its linkages with the formal sector and the nature andstructure of the urban informal labour market. But subsequent studies have focusedon many other issues such as wages, productivity, employment, support systemfor the growth of the sector and social security for workers. The book under review,which contains largely the papers presented in a seminar held in December 1997 inDelhi and edited by two eminent economists — one being an expert in urbaneconomics and the other in labour economics — makes a comprehensive effort tocover the various issues relevant to the informal sector. The papers included in thevolume are brought under several thematic groups such as those which deal with:
• conceptual and methodological issues relating to definition and identificationof the informal sector;
• trends and structure of informal sector growth;• wages/earnings, productivity, macro-micro linkages including prospects of
growth of informal sector;• nature of labour market discrimination including gender discrimination;• the support system needed to develop the informal sector; and• the social protection system for the benefit of the workers engaged in this
sector.As for the identification and size of the informal sector, the two papers
included in the volume rightly point to the need for resorting more and more to thesecondary data sources like the economic census, NSS, NIC and EMI. They alsounderstandably refer to the limitations of these sources and the need for improvingtheir coverage and precision. The suggestion of the editors that if to the householdsector under the system of National Accounts the enterprises of informal employersare added it is possible to arrive at a rough national-level informal sector profile isworth considering. For, that will to a great extent coincide with the so-called residualapproach followed to identifying the informal sector.
Notwithstanding the limitations of data, many writers had concluded thatthe informal sector in India had a significant size, employing well over 90 per cent ofthe total work force and contributing over half of the GDP. But an unfortunateposition taken by some that this sector was only transitory and as such wouldeventually disappear had stalled a serious support system for it. The editors rightlyhold that this was an untenable position and that with the liberalisation processthis sector has grown in size. It may not be out of line to mention that this reviewer,as far back as 1984, based on his Bangalore city study, had argued that the informal
Vol. V, No.1 Book Reviews 151
sector would not only stay but also grow for various reasons. Hence, a plea hadbeen made then for a supportive policy in favour of this sector.
The macro-level papers on informal-formal sector linkage come out with astartling finding that the proportion of informal sector workers varies inversely withurbanisation as well as with industrialisation. This questions the proposition thatthe unorganised sector is strongly linked to formal industries. Many of the earlierstudies had affirmed the strong linkage. Then, where did things go wrong? Theanswer is simple. That is, as urbanisation and industrialisation go apace, the formalsegment (i.e., registered informal sector enterprises) expanded at a much faster rate.As these enterprises do not get captured in the counting, it gives the impressionthat the informal sector employment as a whole is declining in proportion!
It is a known fact that due to low levels of capital and skills the wages/earnings in the informal sector are lower. But the fact that the wages are much lowerthan the minimum wages needs to be explained. The micro-level papers included inthe volume refer to factors that contribute to extremely inadequate remuneration.These factors are: the presence of exploitative traders and merchant manufacturerson the one hand and lack of organisation among workers; the increased vulnerabilityof workers due to debt borrowing from employers, prevalence of such contractwork to own account workers who lack alternative job opportunities, presence of alarge number of housewives who are too willing to use their spare time for even asmall wage and the like.
The increased vulnerability of women to labour market exploitationfollowing reforms is vividly brought out by the papers dealing with women workersin the informal sector. It is quite revealing that there has been feminisation of labourforce with a rising proportion of women workers. But on the negative side, wenotice casualisation of work among them, leading to increased uncertainty in workand income, and increased resort by women to take up home-based outsourcedemployment as a survival strategy, which is exploitative in monetary terms. It is alsofound that in some lines of activity women are subject to social deprivation insofaras they are expected to work for long hours and are assigned jobs of lower socialstatus than those which men are unwilling to take up.
The problems of the informal sector, particularly those of low productivityand the consequent low wages and earnings, are attributed to the prevalence of apoor support system. The support system both on the demand side, like lack ofproper and adequate market, and on the supply side, like skills, technology andcredit, make the informal sector enterprises vulnerable to the vicissitudes of themarket forces. Hence the set of papers on the support system make a fervent pleafor providing institutional finance, skills and capabilities, and market support. Therole of NGOs in creating awareness and building skills and capabilities is alsoemphasised. But what the authors seem to have missed is the role of input and
152 Journal of Social and Economic Development Jan. - June 2003
output interlinkages between informal and formal sectors that may reduce thevulnerability of the enterprises in the former.
The exploitative market system, which has produced extremely low wagesand earnings, certainly calls for efforts at organising the informal sector workerswith a view to improving their bargaining strength. But considering their widespreadscatter, low educational levels, etc., the task of bringing them under an organisationis an extremely difficult job. The suggestion that the Kerala model of organising theunorganised workers is welcome. But to say that the State should take some initiativein this effort does not make any sense to this reviewer. The emphasis on acomprehensive social security system to meet contingencies like ill health, maternity,loss of work, and retirement is welcome. Apart from Kerala, other states like Karnatakaare on the way to providing social security to the unorganised workers. As statedby the editors, the coverage of these benefits must be extended even to the contractlabourers and those attached to small enterprises.
On the whole, the book under review is an excellent compendium of wellresearched and well thought out papers which give a detailed account and analysisof the various dimensions of the informal sector. For the development and laboureconomists reading of this book is a must. The policy maker too will get usefulinsights into the problems of the informal sector workers, and that will facilitateformulation of appropriate policy measures for ameliorating the working and livingconditions.
Former Professor Abdul AzizISEC
Angus Maddison, D. S. Prasada Rao, and William F. Shepherd(ed). The Asian Economies in the Twentieth Century. Cheltenham,U.K.: Edward Elgar Publishing Limited. 2002. Pp. 250. Hardback.
Development strategies governing economic growth of nations haveundergone considerable change in the twentieth century. It is from one of market-led growth until the Great Depression in the 1930s to the supremacy of state-ledgrowth until the mid-twentieth century and to the resurgence of market-drivengrowth in the later part of the century (World Development Report 1996). The worldis currently tending towards one global economic entity with opening up ofeconomies, and major policy changes across nations. These changes have had far-reaching consequences. Some countries have had rapid economic growth. Anunderstanding of growth processes, factors responsible for such growth and itsmeasurement is of benefit to other countries engaged in similar pursuits. The bookunder review captures the long-term growth experience of some of the successfuleconomies in the twentieth century.
Vol. V, No.1 Book Reviews 153

‘The Asian Economies in the Twentieth Century’ is an edited volume withnine chapters. Maddison, one of the editors, provides a brief introduction, which issomewhat disappointing. This is especially true of the papers on six Asian economies.It briefly states the broad focus of each of the papers without providing an adequateoverview of the important issues emerging from them. While measurement aids inunderstanding growth performance and needs to be studied, the factors that hampermeasurement cannot be ignored. In this regard, an important omission is thediscussion on the dataset referred to in the papers. Accuracy of measurementlargely depends on the statistics used for the purpose. The paper on Chinaextensively discusses the data problems and the strong assumptions made in lieuof it. As a result, the author himself is not very sure of the accuracy of the newestimates made. He states ‘…it is possible that there have been changes in theaggregate input-output ratio for industry in the 45-year period covered. If the ratioof value added to gross output has been falling over time, our estimates will overstatethe growth of value added and if the ratio has been rising, they will understate it.’(Wu 2002, p.93)
Measurement issues apart, there are certain interesting observations madein most of the papers that growth is more due to input accumulation. Whether suchgrowth is sustainable is an issue that needs to be adequately addressed. Theseissues completely escape the attention of the editor in the introduction.
Three of the essays that follow dwell at length on the methodology andissues of international comparisons of aggregate as well as sectoral (agriculture,industry and services) real output. Measurement issues attain special significancein all comparative studies. Nations are not comparable for their national economicindicators (GDP, sectoral aggregates) with those of other nations. In this contextone recognises the need for a common monetary unit to facilitate meaningful inter-country comparisons. The book has devoted three full-length papers to a discussionof the methodology and its application to arrive at some empirical results. Theauthors have given a detailed outline of the methodology adopted, and the estimatesare done proficiently. In this regard the book is very helpful to researchersundertaking comparative studies.
Four essays address the issues of economic performance in the twentiethcentury in Asian economies: China, India, Indonesia, and Japan; the fifth essaycompares South Korea and Taiwan.
Harry X. Wu’s paper assesses industrial output and labour productivityin China during 1949–94. It subscribes to the prevailing view that reforms havehelped in the improvement of China’s industrial performance. The author hasconstructed an independent growth index for the industrial sector and makes itcompatible for international comparison of output and productivity. This effort iswelcome, as it is widely held that official estimates are upward biased and a need is
154 Journal of Social and Economic Development Jan. - June 2003

felt for accurate estimation. However, whether the author’s new estimates havehelped serve this purpose remains a big question. The estimates are based onunrealistic assumptions such as ratio of gross value added to gross value of outputremaining constant over a long time. Value addition can be influenced by factorssuch as size of the firm, technology, etc. In addition, Chinese industry experiencedstructural shifts from heavy industry to light and labour-intensive industry. Thesechanges also impact upon value addition. Though the author is aware of theseconstraints, this does not ensure flawless estimates.
The paper on Indian economic performance by Siva Sivasubramoniancovers the period 1900–97. This is a division of time period in terms of pre-1946 andpost- 1947. Comparison of India between these two periods is not meaningful sincethe former refers to undivided India and the latter to contemporary India. Theauthor takes the readers on a tour of Indian growth performance from that of astagnant economy in the colonial period to that of high growth. However, thediscussion is restricted to a mere description of growth by sectors rather than ananalysis of the factors or an explanation of differences in the performance over timeor regions. To elaborate, the paper reports an impressive performance of themanufacturing sector between 1913 and 1938, which was considered better than theworld average. Issues such as the factors responsible for such growth and thereasons why the manufacturing sector trailed behind during other times are veryimportant to draw policy lessons from the growth experience within the country.Discussion on the growing inter-state imbalances lacks clarity and is better addressedby using simple statistical tools like coefficient of variation.
Pierre van der Eng’s discussion on Indonesia’s economic growthperformance for 1900–1997 deals with the issue in a comprehensive manner. Byexamining the consistent real GDP data for the period 1990–97 the paper identifiesdifferent patterns in growth: the slow growth (1900–29) and high growth phases(1967–97). Further, it explains the differential growth phases by examining the possiblesources of growth on the output and demand side and addresses issues of regionaldiscrepancies. Some important lessons emerge from Indonesia’s growth performance,although not explicitly stated by the author. One such lesson pertains to the patternof educational attainment levels and its importance in the growth performance.Indonesia had immense gains from primary education initially and secondaryeducation later in response to the changes in the demands of the labour market.This pattern is observed to be prevalent in the other successful Asian economiesalso (Mingat 1995). Thus, the sequencing appears to be of considerable importancein the pursuit of growth. Another lesson pertains to the increased participation ofthe Indonesian government in the development of infrastructure. Governmentproductively used increased revenue on account of flow of resources from oil andgas exports during 1967–98 to promote infrastructure development. In turn, it helped
Vol. V, No.1 Book Reviews 155
improve the mobility of factors of production and goods, thus laying open moreavenues for development. The paper also brings out clearly the role of economicpolicy in attracting foreign investment. The evidence had it that it was only duringthe 1980s that net foreign direct investment increased remarkably under theconditions of reduced inward looking stance in economic policy.
The long-term performance of the Japanese economy is dealt with at lengthin chapter eight by Dirk Pilat, covering the period 1885 to 1997. The paper identifiesfactors that have contributed to the peaks and troughs in the economic performance.An interesting finding of the paper is that the rapid growth phase in Japan wascharacterised by positive saving in the government sector. This finding supportsthe current thinking that high levels of fiscal deficit of respective governments canhamper the economic growth of a nation. This is observed to be true of some otherAsian economies too such as China, Korea etc., wherein their restrained publicexpenditure coupled with surplus or low deficit budgets have helped them maintainlow levels of inflation (Rao 1995). There are also important lessons that emerge fromthe discussion such as the role of state in building appropriate economic and socialinfrastructure in promoting growth.
Bart van Ark and Marcel P. Timmer attempt analysis of the long-termgrowth performance of South Korea and Taiwan in a comparative perspective.They use growth accounting framework to understand the factors responsible forthe growth in these nations. Growth in these nations is observed to be more anoutcome of the input accumulation rather than that of total factor productivity;however, this is more so in the case of South Korea than Taiwan.
To sum up, the papers are a good addition to the existing literature interms of discussion on the growth processes and its measurement. The book isparticularly useful to academicians and policy makers for the methodology relatedto growth comparisons and the statistics for long periods made available in oneplace. However, by enhancing the scope of the study, the value of the book can besubstantially enriched. This can be attempted by addressing the lessons that eachof the countries can learn from their own past achievements/ failures which in turnwould help in identifying the policy prescriptions for promoting/sustaining growth.This is not a difficult task given the long period that each of the papers hasconsidered.
References
Mingat, Alain (1998). The Strategy Used by High-Performing Asian Economies in Education:Some Lessons for Developing Countries. World Development, 26(4): 695–715.
Rao, M.Govinda (1998). Accommodating Public Expenditure Policies: The Case of FastGrowing Asian Economies. World Development, 26(4): 673–94.
156 Journal of Social and Economic Development Jan. - June 2003
The World Bank (1996). From Plan to Market. World Development Report. Washington,D.C.
Associate Professor K. GayithriEconomics Unit, ISEC
Kunibert Raffer and H.W. Singer. The Economic North-SouthDivide: Six Decades of Unequal Development. Cheltenham, UK;Northampton MA, USA: Edward Elgar. 2001. Pp. ix + 291.
This is a distinguished book written by two distinguished analysts of, andcommentators on, the outcomes and processes that have dominated the evolutionof the global economic order over the last sixty years. The picture that emerges —one of immiserization and illfare for the vast majority of the earth’s population, andan increasing relative concentration of power, wealth and welfare in the hands of afew countries — is as unflattering to a romantic view of humanity as it is familiar.The polarisation of the world into ‘North’ and ‘South’ is well enough known for itto be ignored, by perpetrators and victims alike, as an ever-present and routineaspect of the Facts of Life. The great contribution of the book under review is itssuccess in forcing attention on, and engagement with, the unsavoury realities ofinternational economic relations which have simply been taken for granted, forreasons of the common tendency to be blind to what is staring one in the face, orweariness, or resignation, or complaisance, as the case may be. The book achievesits end through patient scholarship, an implacable insistence on detail, and anuntiring exploration of facts and issues governing the sorry state of the politicaleconomy of the world.
The UNDP’s annual Human Development Report, the UNICEF’s State ofthe World’s Children, and many allied manuals of data and commentary, are — forthose who would care to consult them — continuous and major sources ofinformation on the economic and social dimensions of how the world is faring.Consider the following aspects of global deprivation and disparity towards the endof the millennium. A little over a fifth of the world’s adult population is illiterate. Theadult illiteracy rate is as low as 1 per cent in thirty countries of the ‘North,’ and inexcess of 50 per cent in twenty-six countries of the ‘South.’ The under-5 mortalityrate describes a spectrum from around 4 per 1,000 live births in the Scandinaviancountries to a corresponding figure in excess of 300 in Sierra Leone and Niger. Theaverage per capita global GDP, in purchasing power parity dollars, is in the region of6,000. Take one half of this — PPP$3,000— as a global relative poverty line. Then,68 countries, accounting for 39 per cent of the world’s countries, turn out to beincome-poor. Poverty can be wiped off the face of the earth if only 1,070 million ofthe people inhabiting the poor countries of the world would understandingly curl
Vol. V, No.1 Book Reviews 157

up and die. The Gini coefficient of inequality in the cross-country distribution ofincomes (measured in PPP$) is of the order of 0.55: equivalently, it is as if the worldwere divided into two entitites, ‘North’ and ‘South’, of which ‘North’ claims 77 percent of the world’s income, and ‘South’ is permitted to retain 23 per cent.
Nearly 80 per cent of the 68 poor countries of the world have had a historyof colonialism. A major instrument of post-colonial imperialism has been internationaltrade, as an unfolding of the histories of GATT and WTO will reveal. The burdensof international debt and unproductive military spending have cripplingly cementedthe fate of those countries of the ‘South’ which emerged into ‘freedom’ fromcolonialism. That famous model of Crime and Punishment, more polysyllabicallyknown as Structural Adjustment and Macroeconomic Stabilisation, has added animpressive number of nails to the coffin. International aid, in respect of quantum,caprice, and intent, has been a joke in bad taste.
Raffer and Singer chronicle the outcomes and processes reflected in theabove selective, capsule picture of global poverty and inequality, by submitting tocareful analysis a number of issues relating to the global experience of economicdevelopment and policies, divergence between the ‘North’ and the ‘South’, theunderstanding — or rather lack of it — of these phenomena yielded by differentstrands of ‘establishment’ development thinking, neoliberalism and the WashingtonConsensus, the oil crisis, the Asian Tigers’ debacle, colonialism and ‘reparation,’and the role of institutions like the Bretton Woods twins and the WTO in thescheme of things. The authors also suggest specific ways and means of mitigatingthe severity of the ‘North’-‘South’ divide. The tone is cool and the treatmentdispassionate, avoiding the excesses of stridency and predictability. This bookpossesses a virtue rarely to be found in contemporary academic writings: the virtueof wisdom.
The authors end with the hope that their ideas for rectification of a deeplyflawed global economic order are not as ‘utopian’ as they had feared at the outset.‘utopianism’ typically fails to respect feasibility. ‘Feasibility’, in turn, is a matter ofwhat agents can do, and what they are willing to do. Judged in terms of the ‘can’category, there is nothing utopian in the authors’ prescriptions. But judged in termsof the ‘willingness’ category, one is up against a bleak and forbidding wall. Thisbook, if one is to put it bluntly, is a chronicle of the arbitrary exercise of power by afew over the many, in the cause of deception and theft. We are now so far removedfrom a willingness on the part of the powerful to engage in sane moral reasoningthat even the fig-leaf of anti-colonial modernism has been dispensed with: the US-UK attack on Iraq, driven by the desire to commandeer oil resources, is an atavisticreturn to outright violation of territorial sovereignty through forceful and violentoccupation. It is the arbitrary exercise of power in the cause of deception, theft and
158 Journal of Social and Economic Development Jan. - June 2003

murder. Against such brute unwillingness, and without the countervailing force ofpublic moral outrage, any counsel of sanity must be seen to be utopian.
Professor S. SubramanianMadras Institute of Development StudiesChennai
N. V. Varghese and Arun C. Mehta. Investment Priorities and CostAnalysis: A Study of Upper Primary Education in India. NewDelhi: Vikas Publishing House Pvt. Ltd. 2001. Pp. 200. Rs. 275(paper).
The book under review looks into a less explored area in education, viz.,upper primary education. Within the context of universalization of elementary edu-cation (UEE), examining investments and costs relating to the upper primary stageassumes significance with almost universalization of enrolment and schooling pro-vision at the lower primary level becoming a reality in India. The present book is anoutcome of a study conducted by Dr. N. V. Verghese and Dr. Arun C. Mehta at theinstance of the DPEP Bureau, Department of Education, MHRD, Government ofIndia. The book deals mainly with empirical analyses of both secondary data fromphase-1 and primary data under phase-2 collected from eight blocks across fourdistricts of Kerala, Madhya Pradesh, Maharashtra, and Uttar Pradesh.
The book has nine chapters. Chapter 1 deals with introduction whereinthe authors present arguments in favour of investments in basic education usingeconomic, social and human development paradigms. Later, while discussing theimplications of UEE for the upper primary level, the authors rightly argue thatuniversal enrolment at this level is more a function of the successful completion ofthe lower primary level of education (Class I-V). In this chapter, the authors de-scribe the methodology used for the present study in terms of objectives, datasource and sampling design.
Chapter 2 presents district profiles wherein certain demographic, eco-nomic and educational characteristics of each sample district are discussed. Per-haps a study of shift in educational scenario during the pre- and post-DPEP stageswould have enriched the district analyses. In Chapter 3, the authors analyse school-ing provisions at the upper primary stage by examining patterns of expansion of theupper primary schools across sample districts. It would have been better if theauthors had examined the expansion of the upper primary stage against populationnorms and demand ratios as upper primary schools are by and large upgradedprimary schools and not necessarily independent schools, as the authors them-selves reveal (Table 3.8). The authors present viewpoints of teachers with regard to
Vol. V, No.1 Book Reviews 159
viability of having upper primary classes either in primary or secondary schools.However, it would have been better if the authors had also looked into anotherimportant management issue — teacher-class ratio in the context of a large majorityof teachers in upper primary schools engaging in higher primary classes rather thanlower primary classes, thereby resulting in poor instructional quality at the lowerlevels. Similarly, transition rates could also have been examined with respect tosingle-sex and mixed-sex schools in order to obtain a better picture of gender differ-entials in the same.
In Chapter 4, the authors examine the infrastructural facilities in the sampleschools across the four districts as well as within the sample blocks. The presenceof a large number of untrained teachers and gross underrepresentation of womenteachers (Table 4.9) within the DPEP context is a worrisome issue. It would havebeen better if the authors had attempted analysis of the academic facilities in termsof classrooms, physical and academic facilities and teaching-learning facilities sepa-rately for upper primary schools in the sample schools in order to arrive at certaindistinguishable patterns.
In Chapter 5, the authors examine the patterns of student enrolment andtransition rates in upper primary classes with respect to certain variables. From theanalysis, the authors infer that the repetition is a bigger problem at the upperprimary level than dropout and that there are better chances of survival if childrenare ‘enrolled’ in upper primary classes. What needs to be noted here is that there isno such thing as enrolment at the upper primary level; rather it is the retention andsurvival of children from primary classes.
In Chapter 6, the authors present teacher profile based on a sample of1,391 teachers as against a total of 1,792 teachers working in the sample of 285upper primary schools across four districts. While examining the professional back-ground of teachers, the analysis reveals that almost all teachers have some kind ofteacher training qualification in all the districts (Table 6.16). However, it is not clearwhether the questionnaire was administered to only trained teachers in the sub-sample as elsewhere it is noticed that less than half the teachers in Moradabad andonly 69.3 per cent in Bilaspur were trained (Table 4.9). In this section, one alsonotices a sort of correlation between specialization of teachers (Table 6.15) andsubjects taught by teachers (Table 6.19). The percentage of teachers with special-ization in Mathematics is notoriously small in all the districts. Similar is the casewith Science specialization, with Moradabad and Aurangabad revealing a mere 3.4per cent and 7.1 per cent of Science teachers respectively. This could also be one ofthe reasons for allocating less instructional time in the school curriculum for thesetwo subjects. Although the authors do reveal that teachers at the upper primarystage also teach primary and secondary classes to a small extent, yet the analysisfails to point out how many teachers teach more than one class and more than one
160 Journal of Social and Economic Development Jan. - June 2003

subject within the upper primary stage.In Chapter 7, the authors discuss the pattern of school management across
four sample districts. Considering the heavy administrative responsibilities forteachers at this stage, the authors argue not only for a separate head teacher at theupper primary stage, but also for a lesser teaching load. In Chapter 8, the authorsexamine the cost pattern with respect to management types (Table 8.1). However,the tables indicate neither the periodicity nor the reference year. The higher expen-diture incurred by private unaided schools for ‘other’ items (31.18 per cent) in thecase of Bilaspur and for ‘student incentives’ (7.79 per cent) in the case of Moradabadneeds further explanation. Although the authors attribute low per-student cost inprivate unaided schools to lower salary rates as compared with government schools,one tends to think that such a general pattern also indicates that private unaidedschools are least expensive as compared with government and aided schools. Per-haps if the authors had also attempted to estimate the private cost incurred bystudents across different management type schools, deeper insights could havebeen obtained. However, a basic question that remains is, how is it possible toestimate the cost/expenditure exclusively for the upper primary stage, when themajority of the schools are integrated either with primary or secondary?
In Chapter 9, the authors conclude that the cost of universalizing upperprimary education is less in less educationally developed centres and that inte-grated upper primary schools are least expensive as compared with independentupper primary schools. In this context they argue for additional investment forcreation of additional school facilities rather than opening of new upper primaryschools.
In sum, the authors deserve compliments for their exhaustive analyses.The book is indeed a significant addition to the literature on primary education, andwould be of interest to both scholars and functionaries in education.
Associate Professor M. D. UshadeviEducation UnitISEC
Vol. V, No.1 Book Reviews 161
Books Received
Hans, Asha and Annie Patri (2003). Women, Disability and Identity. New Delhi:Sage Publications.
Jaitly, Jaya (2002) Visvakarma’s Children: Stories of India’s Craftspeople. Instituteof Social Sciences and Concept Publishing Company.
Kumar, Somesh (2002). Methods for Community Participation: A Complete Guidefor Practitioners. New Delhi: Vistaar Publications.
Ruth, Michele and Gamburd (2002). Transnationalism in Sri Lanka’s MigrantHousemaids: The Kitchen Spoon’s Handle. New Delhi: Vistaar Publications.
Schuurman, Frans J. (2002). Globalisation and Development Studies: Challengesfor the 21st Century. New Delhi: Vistaar Publications.
Shah, Ghanshyam and D. C. Shah (2002). Land Reforms in India, Vol.8 – Performanceand Challenges in Gujarat and Maharashtra. New Delhi: SagePublications.
Shah, Ghanshyam, Mario Rutten and Hein Streefkerk (2002). Development andDeprivation in Gujarat (In honour of Jan Breman). New Delhi: SagePublications.
Shinoda, Takashi (2002). The Other Gujarat: Social Transformations among WeakerSections. Mumbai: Popular Prakashan.
Shiva, Vandana and Gitanjali Bedi (2002). Sustainable Agriculture and FoodSecurity: The Impact of Globalisation. New Delhi: Sage Publications.
Velden, Fons van der and Lan Schulpen (2002). Private Development Aid inTransition. New Delhi: Concept Publishing Company.
Verma, Archana B. (2002). The Making of Little Punjab in Canada: Patterns ofImmigration. New Delhi: Sage Publications.
Zakaria, Rafiq (2002). Communal Rage in Secular India. Mumbai: Popular Prakashan.
162 Journal of Social and Economic Development Jan. - June 2003
Printed and Published by Gopal K. Kadekodi, on behalf of the Institute for Social andEconomic Change, Prof. V. K. R. V. Rao Avenue, Nagarabhavi P.O., Bangalore 560 072,and Printed at Shreeniketan Graphic Impressions, #210, 2nd Main Road, MahalakshmiLayout (Pura), Bangalore - 560 086.
Editor: Gopal K. Kadekodi.
ISEC Working Paper SeriesRecent Contributions
107*. Education, Agriculture and Rural Development — A Study of Two Villages inSouthern India ... D V GOPALAPPA and R S DESHPANDE
108*. Decentralised Governance: A Review of the Idea and Issues ...MD. NAZRUL ISLAM and AMITAYUSH VYAS
109*. Land Transaction in Tribal Economies: A Study From the Scheduled Areas ofOrissa ... AMALENDU JYOTHISHI and R S DESHPANDE
110*. Monitoring Poverty and Human Development Indicators: A Framework ...R S DESHPANDE and K V RAJU
111. Action Research for Poverty Alleviation ... D RAJASEKHAR112*. Fixers, Patronage, ‘Fixing’, and Local Governance in Karnataka ... ANAND
INBANATHAN and D V GOPALAPPA113. State Finances in India: A Critical Review ... M GOVINDA RAO114. People, Government and the NGOs ... D RAJASEKHAR and R R BIRADAR115. Economic Growth in India: Does Foreign Direct Investment Inflow Matter?
... DUKHABANDHOO SAHOO and M K MATHIYAZHAGAN116. Credit Flow to Indian Agriculture: Trends and Contributing Factors ... GAGAN
BIHARI SAHU and D RAJASEKHAR117. Joint Forest Management in Orissa: Challenges and Opportunities ...
SATYAPRIYA ROUT118. Trade Policy and Determinants of Trade in Agriculture ... DEEPIKA M G and
R S DESHPANDE119. Rural Poor’s Participation in Decentralised Multilevel Planning and
Development ... SITAKANTA SETHY120. Emerging Development Issues in a Resource Region ... G S SASTRY and
R JAGANNATHA RAO121. Collusion in Corrupt System: A Game Theoretic Approach ... MEENAKSHI
RAJEEV122. Theories of Failure, Failure of Theories and Non-Market Valuation: A Survey
... L VENKATACHALAM123. Factors Affecting Household Willingness to Pay for Water: A Case Study ...
L VENKATACHALAM124. Who Benefits from Industrial Incentives? A Study of Capital Investment
Subsidy in Karnataka ... K GAYITHRI125. Accountability and Governance: Local Government in Kerala and Karnataka
... V VIJAYALAKSHMI126. Protecting Drinking Water Sources: A Sub-Basin View ... SHASHI KOLAVALLI
and K V RAJU

127. Reducing Fiscal Deficit: Canadian Experiment and Lessons for India ...K GAYITHRI
128. Scheduled Tribes and Gender: Development Perceptions from Karnataka ...V VIJAYALAKSHMI
129. A Search for a Theory of Entrepreneurship: A Case Study of the FoundryIndustry in Howrah and Coimbatore ... MEENAKSHI RAJEEV
130. Does Labour Force Participation Enhance Autonomy of Poor Women? Evi-dence from Tamil Nadu, India ... M SIVAKAMI
131. Decentralised Governance and People’s Participation: Lessons from WestBengal ... MD. NAZRUL ISLAM and S N SANGITA
132. Land Resources and Policy in Karnataka ... R S DESHPANDE and M J BHENDE133. Sensitizing Panchayats on Health Issues through Television: Experiences of
a Pilot Project ... T V SEKHER134. Small-Scale Industries in the Era of Globalisation: An Explorative Study ...
M JAYA KRISHNA135. Interaction between Twin Deficits: Indian Experience in the Macroeconomic
Reform Period ... HRUSHIKESH MALLICK
* Papers are out of stock. But photocopy versions may be made available.

2. Subscription SchemeThe following payment options are available depending on thenature of the organisation concerned.1. Deposit scheme for ICSSR institutes, academic and otherresearch institutes, colleges, Government Departments, RBI, RBIRegional Offices, NABARD.Deposit = Rs.4,000 for 130 Working Papers (no extra postalcharges).
2. Deposit Scheme for universities.
Deposit = Rs.3,000 for 100 Working Papers (no extra postalcharges).
Cheques/Demand Drafts may be made in favour of The Regis-trar, Institute for Social and Economic Change. Outstationcheques will not be accepted.
1. For Specific Working PapersEach working paper costs Rs.30/-. Add Rs.10/- for postal chargesif less than 5 copies are ordered.
Working Paper Nos. (and no. of copies in brackets) .......
......................................................., DD/Cheque No. ..............
Dated ............... for Rs. .............. (Rupees ............................
..................) drawn on ................................... .
Signature
For enquiries contact:
Mr. Anil Mascarenhas, Associate Editor, Journal of Social andEconomic Development, Institute for Social and Economic Change,Dr. V K R V Rao Avenue Road, Nagarabhavi P O, BANGALORE -560 072.
Phone: 080 - 3215468 Extn. 138; Fax: 080 - 3217008E-mail: [email protected]

INDIAN JOURNAL OF AGRICULTURAL ECONOMICS
(Organ of the Indian Society of Agricultural Economics)
Vol. 58 OCTOBER - DECEMBER 2003 No. 4
CONTENTSARTICLES
Modelling Household Economy of Agroforestry Based Resource D. Suresh KumarPoor Farmers: A Case of Silvipastoral System and C. RamasamyFunctioning of Agricultural Labour Market: Micro Evidence from H.R. Sharma andan Agriculturally Developed Region of Himachal Pradesh Virender KumarThe Process of Interactions between Industry and Agriculture in Sunil AshraIndia: Evidence based on a Multivariate Cointegration and Error-Correction Modeling ApproachIs India Self-Sufficient in Livestock Food Products? M. B. Dastagiri
RESEARCH NOTES
Market Integration: An Application of Error Correction Model Jyotish Prakashto Potato Market in Hooghly District, West Bengal Basu and
SoumyanandaDinda
Development Perspective of Goat Rearing in India: Status, Issues Shalander Kumar &and Strategies K. P. PantMeasuring and Explaining Techical Efficiency in Crop Production C.A. Rama Raoin Andhra Pradesh K.R. Chowdry
Y.V.R. Reddy andG.V. Krishna Rao
Prospects of Agricultural Exports in India: A Composite Index Keher Singh andApproach Inder JainPrice Spread of Pomegranate M.S. Ladaniya
Vinod Wanjari andBipin ChandraMahalle
Technical Efficiency in Aquaculture in Oyo State, Nigeria T. T. AwoyemiJ.O. Amao andN.C. ehirim
BOOK REVIEWS* PUBLICATIONS RECEIVED*ABSTRACT OF PH.D THESIS IN AGRICULTURAL ECONOMICS* NEWS*INDEX TO IAJE, VOL. 58, 2003* OBITUARY*
Annual Subscription RatesIndividual Membership Fee : Rs.300.00; $ 75.00Life Membership Fee : Rs.3,000; $ 750.00Institutional Subscription : Rs.600.00; $ 125.00
Please address correspondence to the Hon. Secretary & Treasurer, The Indian Society ofAgricultural Economics, 46-48, Esplanade Mansions, M.G. Road, Mumbai-400 001 (India).Telephone: 022-22842542 Fax: 091-022-22838790 email: [email protected]
INDIAN ASSOCIATION OF SOCIAL SCIENCE INSTITUTIONS(IASSI)
VOL.20 JANUARY - MARCH 2002 NO. 3
CONTENTS
Man as Demiourgos A. K. Saran
Culture, Society and Violence: Emerging Issues Birinder Pal Singh
Sustainable Development: From Concept to Reality Jose J. Naduthotty
New Mothers and Family Planning at a Glance Sudhir Ranga
Agricultural Extension throught Interactive Multimedia N. Anandaraja,Compact Disc (IMCD) K. Chandrakandan &
C. Karthikeyan
Disturbing Trends in India’s Economy Baidyanath Misra
A Probe into the Child Right and Development Situation Niaz Ahmed Khan andin the Chittagong Hill Tracts, Bangladesh Abul Farah M. Saleh
Development of Scheduled Castes: An Overview B. B. Mohanty
Employment Assurance Scheme in Tamil Nadu: B. Sambi ReddyPerformance and Impact Assessment
Gifted Science Writer and Innovator in Operations Tarlok SinghResearch: Dr. Jagjit Singh (1912 - 2002)
Book ReviewsMember-Institutions
SUBSCRIPTION RATES
For India and SAARC Countries, including postage: Rs.250/- for one year.Single copy Rs.70/-
For other countries: US $ 40 per year or equivalent, including postage by surface mail, andUS $ 50 by airmail. Single copy US $ 15 by Airmail and US $ 12 by Surface mail.
Enquiries and Correspondence should be addressed to Member-Secretary, Indian Associationof Social Science Institutions (IASSI) care Institute of Applied Manpower Research,Indraprastha Estate, New Delhi - 110 002.
(Tel: 2331-5284, 2335 6834, 2332 4581, Fax: 011-2331-5284; E-mail:[email protected])
Articles
VINOD THOMAS, YAN WANG and XIBO FAN: Measuring EducationInequality: Gini Co-efficients of Education for 140 Countries (1960-2000)A NARAYANAMOORTHY and B N KAMBLE: Trends and Determinants ofRural Literacy Among Scheduled Caste PopulationJANDHYALA B. G. TILAK: Vocational Education and Training in AsiaA. R. VASAVI and ARCHANA MEHENDALE: Out-of-School Children
Perspective
H. S. BHOLA: Policy: A Holistic Perspective
Book Reviews
JACOB AIKARA: Equity and Access to Education (W. O. Lee); P.RADHAKRISHNAN: Labouring to Learn (Angela W. Little); ERROL D’SOUZA:Organised Labour in the 21st Century (A. V. Jose); R. P. SINGH: Values in Educationfor Dynamic Societies (W. K. Cummings et al, ed.); M. C. REDDEPPA REDDY:The Literacy Movement in West Godavari District (A. Mathew); SUDHANSHUBHUSHAN: Positioning Secondary School Education in Developing Countries (D.B. Holsinger & R. N. Cowell); VANDANA SIPAHIMALANI RAO: India EducationReport (R. Govinda, ed.); TAPAN R. MOHANTY: Education and Training Strategiesfor Disadvantaged Groups in Thailand (P. Smarnjit & K. Sen) [and] AlternativeEducation for Disadvantaged Youth in Indonesia (P. Irwanto et al); V. V. BHANOJIRAO: Impact of the Economic Crisis on Higher Education in East Asia (N. V.Varghese); JANDHYALA B. G. TILAK: Agencies in Foreign Aid (G. Hyden & R.Mukandala)
JOURNAL OFEDUCATIONAL PLANNING AND ADMINISTRATION
Editor : Jandhyala B. G. Tilak
Volume XVII Number 1 January 2003
CONTENTS
Annual Subscription Rates
Individuals: Rs.120/US $ 50 (Airmail extra US $10)Institutions: Rs.250/US $ 75 (Airmail extra US $10)
Advertisement Tariff
Full page: Rs.2000/ US $ 100 Half page: Rs.1100/US $ 55
National Institute of Educational Planning and Administration17-B, Sri Aurobindo Marg, New Delhi 110016 (India)
Phone: 91-11-26861320, 26863562, 26962120; Fax: 91-11-26853041, 26865180E-mail: [email protected] (or) [email protected]
Website: http://www.niepa.org
Page
5
35
53 69
85
105
JOURNAL OF RURAL COOPERATION
Vol. 31 No.1 2003
CONTENTS
1. Cooperatives, Agrotourism and Women’s Role: A selection of articles from theICA Research Forum Conference held in Naoussa Imathias/Thessaloniki, Greece(9-12 May, 2002) on Local Society and Global Economy: The Role of Cooperatives.
Editorial
Tourism and the Construction of Community Boundaries in a Galilee KibbutzGrossman, R.Women’s Cooperatives in Greece and the Niche Market ChallengeKazakopoulos, L. and Gidarakou, I.Women’s Cooperatives in Greece: An On-going Story of Battles, Successes andProblemsKoutsou, S., Iakovidou, O. and Gotsinas, N.Agritourism – In Search of QualityKovani, H.Cooperatives and Ecotourism: Complementarities and LimitationsLevi, Y.
2. BOOK REVIEWS
Chomel, A. (ed.) Coopération et économie sociale au “second” XXesiècle: Claude Vienney (1929-2001)(les cahiers de l’économie sociale – No.1)Y. Levi
McDonagh, A.J. Renegotiating Rural Development in IrelandM. Sofer
Suvantola, J. Tourist’s Experience of PlaceS. Krakover
3. CURRENT INFORMATION Dissertation Abstracts
Editor: Dr. Yair LeviEditorial Assistant: Daphna Bar-Nes
Information for Subscribers: The Journal of Rural Cooperation is a semi-annualperiodical, aimed at the pursuit of research in the field of rural cooperation.Editorial enquiries and other correspondence should be addressed to: CIRCOM,Yad Tabenkin, Ramat Efal 52960, Israel(Fax: +972-3-5346376; E-mail: [email protected]).Subscription rate: $28 per annum + $3.00 sea mail; $6.00 airmail.
SUBSCRIPTION FORM
Please find enclosed a sum of Rs.___________________________(______ ) by Cheque/Bank Draft No. _________________being the annual subscription for the JOURNAL OF SOCIAL ANDECONOMIC DEVELOPMENT (for two issues) for the year ______
Name_________________________________________________(Block Letters)
Address_____________________________________________________________________________________________________Pin Code__________
Date: Signature
Cheque/Bank Draft drawn in favour of the Registrar, Institute for Socialand Economic Change, should be sent to the Editor, Journal of Social andEconomic Development, Institute for Social and Economic Change, Prof.V. K. R. V. Rao Avenue, Nagarabhavi P.O., Bangalore 560 072, India.Outstation cheques will not be accepted.
SUBSCRIPTION RATES
SAARC Countries Annual : Indian Rs.200 for InstitutionsIndian Rs.120 for Individuals
Single : Indian Rs.100
Foreign (by Air Mail) Annual : U S $50 for InstitutionsU S $25 for Individuals
Single : U S $25

Guidelines for Contributors
• Only articles/research notes/book reviews not published and not under review forpublication elsewhere should be sent; a declaration to this effect should accompany themanuscript.
• Manuscripts should be submitted in duplicate, in a maximum of 30 pages (of A-4 size),typed double-spaced in 12-point font (Times New Roman); 15 pages of similar specifica-tions for research notes. These limits are inclusive of tables, figures and references. Once anarticle is accepted, the author is required to provide the final version both in hard copy andon a floppy disk (3.5”) prepared in MS Word.
• Manuscripts should be accompanied by an Abstract of less than 150 words. Illustra-tions, figures, maps, graphs, etc., should be submitted on separate sheets, and should be keptto the minimum.
• Single quotes should be used for all quotations; double quotes only within single quotes.Non-English words should be underlined or in italics; spellings of such terms should beconsistent in the article.
• All notes should be numbered consecutively and appear as end notes; notes for tablesshould be marked with (*), @, #, etc., and should appear at the bottom of the table. Sourcesof data, if from other than one’s own research, should be listed below each table.
• References should follow the author-date system, e.g., Rao (1974:78) or (Rao 1974:78).The list of references should be in alphabetical order, multiple references to the same authorfor the same date should be distinguished by suffixing a, b, c, etc., to the date. (e.g., Rao1974a:78; 1974b:106–7). The style of referencing should be as follows:
Beteille, Andre (1996). Sociology and Common Sense. Economic and Political Weekly, 31(35–7):2361–5.
Govil, Kailash Chandra (1991). Why do Farmers Plant Trees? — A Temporal and SpatialAnalysis for Uttar Pradesh, India. A Ph.D. Dissertation, Berkeley: University of California.Unpublished.
Rao, V. K. R. V. (1983). India’s National Income 1950–1980. New Delhi: Sage.
Srinivas, M. N. (ed.) (1996). Caste — Its Twentieth Century Avatar. New Delhi: Viking,Penguin India.
• Authors should ensure that References have all the necessary details and are accurate inrespect of the spellings of authors, volume and issue number of journals and pagenumbers cited.
• Material should be arranged under appropriate sub-headings and not section numbers.

Registration No: KARENG/1999/3287ISSN 0972 – 5792
Journal of Social and Economic Development is published biannually, in Januaryand July. Annual subscription (two issues) is as follows:
SAARC Countries Annual : Indian Rs. 200 for InstitutionsIndian Rs. 120 for Individuals
Single : Indian Rs. 100
Foreign (by Air Mail) Annual : US $50 for InstitutionsUS $25 for Individuals
Single : US $25
Subscription Cheques/Bank Drafts drawn in favour of The Registrar, Institutefor Social and Economic Change, should be sent to the Editor, Journal ofSocial and Economic Development, Institute for Social and Economic Change,Prof. V. K. R. V. Rao Avenue, Nagarabhavi P. O., Bangalore 560 072, India.Outstation cheques will not be accepted.
Website: www.isec.ac.in/journal
Printed and Published by Gopal K. Kadekodi, on behalf of the Institute forSocial and Economic Change, Prof. V. K. R. V. Rao Avenue, Nagarabhavi P.O.,Bangalore 560 072, and Printed at Shreeniketan Graphic Impressions, #210, 2ndMain Road, Mahalakshmi Layout (Pura), Bangalore - 560 086.
Editor: Gopal K. Kadekodi.