Embed Size (px)
Citation preview
Journal of Social Policyhttp://journals.cambridge.org/JSP
Additional services for Journal of Social Policy:
Email alerts: Click hereSubscriptions: Click hereCommercial reprints: Click hereTerms of use : Click here
Combating In-Work Poverty in ContinentalEurope: An Investigation Using the Belgian Case
IVE MARX, JOSEFINE VANHILLE and GERLINDE VERBIST
Journal of Social Policy / Volume 41 / Issue 01 / January 2012, pp 19 - 41DOI: 10.1017/S0047279411000341, Published online: 15 June 2011
Link to this article: http://journals.cambridge.org/abstract_S0047279411000341
How to cite this article:IVE MARX, JOSEFINE VANHILLE and GERLINDE VERBIST (2012). CombatingIn-Work Poverty in Continental Europe: An Investigation Using the Belgian Case.Journal of Social Policy, 41, pp 19-41 doi:10.1017/S0047279411000341
Request Permissions : Click here
Downloaded from http://journals.cambridge.org/JSP, IP address: 131.130.109.88 on 10 Oct 2014
Jnl Soc. Pol. (2012), 41, 1, 19–41 C© Cambridge University Press 2011
doi:10.1017/S0047279411000341
Combating In-Work Poverty in ContinentalEurope: An Investigation Using the BelgianCase
IVE MARX∗, JOSEFINE VANHILLE∗∗ and GERLINDE VERBIST∗∗∗
∗[corresponding author] Herman Deleeck Centre for Social Policy, University of Antwerp,Belgiumemail: [email protected]∗∗Herman Deleeck Centre for Social Policy, University of Antwerp, Belgiumemail: [email protected]∗∗∗Herman Deleeck Centre for Social Policy, University of Antwerp, Belgiumemail: [email protected]
AbstractRecent studies find in-work poverty to be a pan-European phenomenon. Yet in-work
poverty has come to the fore as a policy issue only recently in most continental Europeancountries. Policies implemented in the United States and the United Kingdom, most notablyin-work benefit schemes, are much discussed. This article argues that if it comes to preventingand alleviating poverty among workers, both the policy options and constraints facingContinental European policymakers are fundamentally different from those facing Anglo-Saxon policymakers. Consequently, policies that work in one setting cannot be simply emulatedelsewhere. We present microsimulation derived results for Belgium to illustrate some of thesepoints. Policy options discussed and simulated include: higher minimum wages, reductions inemployee social security contributions, tax relief for low-paid workers and the implementationof a stylised version of the British Working Tax Credit. The latter measure has the strongestimpact on in-work poverty, but in settings where wages are compressed, as in Belgium, a severetrade-off between coverage and budgetary cost presents itself. The article concludes that lookingbeyond targeted measures to universal benefits and support for employment of carers may beimportant components of an overall policy package to tackle in-work poverty.
IntroductionCombating in-work poverty is an issue that affects all of Europe, including thecountries where the fight against unemployment and poverty out of work remainsthe bigger challenge (Andreβ and Lohmann, 2008; OECD, 2009; Eurofound,2010). There already exists a substantial literature on policies to combat in-workpoverty in Anglo-Saxon countries, in part because of a longer standing awarenessabout this issue. In the United States, the 1993 expansion of the Earned Income TaxCredit (EITC) turned it into the country’s pre-eminent anti-poverty program forfamilies of working age. The EITC, in combination with other policy reforms and
20 ive marx, josefine vanhille and gerlinde verbist
several increases in the minimum wage, produced some striking results, includingmarked increases in labour market participation and declines in poverty amongsome segments of the population, especially single-parent households (Hotz andScholz, 2003; Eissa and Hoynes, 2004).
The United Kingdom has also implemented and extended several schemes,culminating in the Working Tax Credit (WTC) of 2003 (Brewer et al., 2006).Elsewhere in Europe, concern for the ‘working poor’ has emerged as a policyissue only recently. The policy solutions implemented in the United States andthe United Kingdom garner considerable interest. Several European countrieshave contemplated introducing Anglo-Saxon-style tax credits, or are presentlydoing so. Interestingly, some countries have already backed away from the ideaor implemented a watered-down version, perhaps to show their commitmentto ‘Third Way’ or ‘Active Welfare State’ ideas. Examples here include the ‘PrimePour l’Emploi’ (PPE) and the Revenue de Solidarite Active (rSa) in France, the‘Combination Credit’ in the Netherlands, and a ‘Low Wage Tax Credit’ in Belgium(Marx and Verbist, 2008a). As we will illustrate for Belgium in some detail, theBelgian tax credit only exhibits a faint resemblance to the EITC or the WTC. Thisis also the case for the French and Dutch schemes. The UK Working Tax Credit,to be replaced by the Universal Credit, remains the most important measure ofits kind in Europe, both in terms of scope and budget. Interest remains strong,in the public debate and in the academic literature (Kenworthy, 2011).
This brings us to the core theme of this article. When it comes to preventingand alleviating poverty among workers, both the policy options and constraintsfacing Continental European policymakers are different from those facing Anglo-Saxon policymakers. To start with, effective minimum wages are, generallyspeaking, already comparatively high relative to median wages, suggesting amore limited scope for policy action on this front. At the same time, taxes andsocial security contributions are more significant in many Continental Europeancountries, making it more likely that workers are ‘taxed into poverty’. Thepotential scope for improving worker’s living standard through tax relief andreductions in social security contributions may be more substantial for thatreason.
The political and governance constraints are also fundamentally differentin the predominantly Bismarckian Continental European settings (Palier, 2010;Streeck, 2009). Within Bismarckian social protection systems, there are specificlimits to the extent to which need-based elements can be introduced. While,for example, targeted social contribution reductions may make sense from apoverty reduction viewpoint, the primacy of the contributory and equivalenceprinciples may limit the extent to which this is feasible. And while social policyis predominantly government controlled in the Anglo-Saxon countries, allowingfor coordination with tax and other income policies (like minimum wages), socialsecurity and wage setting remain largely the prerogative of the social partners in
combating in-work poverty in continental europe 21
Continental Europe. This implies that the coordination of wage, social transferand tax policies may be more difficult and that poverty alleviation has to bereconciled with other considerations and interests. This article considers thespecific policy issues in relation to combating in-work poverty in ContinentalEurope. Specifically, this article will look at what higher minimum wages and(targeted) tax reductions can do to reduce in-work poverty. It also considers thepotential impact of a UK-style tax credit. A general discussion is complementedwith microsimulation analyses for Belgium that serve to illustrate the pointsmade.
Belgium represents an interesting case for a number of reasons. First, and aswe will document in more detail below, Belgium has one of the lowest in-workpoverty rates in the European Union with around 5 per cent of workers livingin financial poverty in 2008, relative to the 60 per cent of median equivalenthousehold income threshold. Nevertheless, in-work poverty accounts for abouta third of the population at working age living in poverty. Around 50 per cent ofworking poor households are households with children.
Belgium also has a comparatively compressed wage structure. According tothe OECD’s data base on earnings, Belgium has just about the lowest incidenceof relatively low-paid work in the OECD area (OECD, 2010). Less than 6 percent of Belgium’s workers earn less than 67 per cent of median earnings. TheOECD26 average is 16 per cent. At the same time, taxes and social securitycontributions on wages are on the highest side of the spectrum (Immervoll,2007). In that sense, it combines two contextual features that make many ofthe Continental European welfare states substantially different from the Anglo-Saxon countries that have received significantly more attention in the literature.That is not to say that Belgium is a ‘typical’ Continental European case. Whilelow-paid work is less prevalent in countries such as Belgium or France, Germanyis a case where low-paid work is as frequent, relatively speaking, as in the UnitedKingdom or Ireland. In Poland and some of the Baltic countries, it appears tobe even more widespread. Similarly, in terms of the overall tax burden put onworkers, including social security contributions, the picture across ContinentalEurope is actually quite varied. What makes Belgium interesting, we wouldargue, is that on two key dimensions – wage compression and taxation – itis at the extreme end of the spectrum and for that reason particularly worthlooking at.
The article starts with a discussion of the data, definitions and methods.It continues with a brief sketch of the extent and specific nature of in-workpoverty in Continental European welfare states and in Belgium in particular.The focus then turns to an examination of alternative policy options: (a)raising minimum wages and effective wage floors, (b) reductions in personalincome taxes and social security contributions for low-wage workers and (c)the introduction of the UK-style tax credit. A final section discusses the key

22 ive marx, josefine vanhille and gerlinde verbist
elements of a suitable policy mix for combating in-work poverty in ContinentalEurope.
Data and methodsFor this paper, we use EU-SILC for 2006 to identify those in work the previousyear, and living in a household with a total disposable household income belowthe commonly used 60 per cent of median equivalent income threshold, using theOECD modified equivalence scale.1 We use microsimulation modelling for theempirical assessment of policy options in Belgium. This technique is particularlywell-suited to investigate the consequences of policy changes as these interactwith the existing tax-benefit structure. The method has already been used tostudy the impact of alternative policies for combating in-work poverty (see e.g.Sutherland (2001) for the UK, Muller and Steiner (2008) for Germany, Figari(2009) for Southern European countries, Formby et al. (2010) for the US).
We use the microsimulation model MISIM (see Verbist, 2003). MISIM(MicroSImulationModel) is a static tax-benefit model designed to evaluate policyalternatives in the field of social security and personal income taxation. Themodel covers personal income taxes, social security contributions and part ofsocial benefits. MISIM can provide as output both the budgetary consequencesof policy measures as well as the impact on the income distribution andpoverty.
Simulation models have some inherent limitations. This method usesempirical data that are either obtained by means of surveys or from administrativesources. As such, the accuracy of the results depends on the quality of the data(e.g. adequate information about the relevant socio-economic characteristics,a sufficiently large sample). Our model runs on the Belgian EU-SILC 2006survey data for a representative sample of the Belgian population. We usethe Belgian version rather than the uniformed EUROSTAT version, because itcontains a number of more detailed variables required to simulate the tax-benefitsystem accurately. Apart from socio-economic characteristics corresponding tothe moment of the interview in 2006, EU-SILC-2006 captures incomes andincome-relevant variables, such as labour market status for the entire year 2005.As a consequence, the presented figures pertain to the Belgian situation in 2005.While in a number of countries concern has been raised about the data qualityof the EU-SILC (see e.g. Hauser, 2008), the available evidence suggests thatthe Belgian component of EU-SILC performs relatively well at both internaland external coherence (Lusyne, 2007). The sample contains 14,329 individualsin 5,860 households, and is representative for the Belgian population living inprivate households.
The model MISIM assumes full take-up of benefits and no tax evasion. Asthe simulations in this article basically relate to personal income taxes and social
combating in-work poverty in continental europe 23
contributions, the issue of non-take-up is not relevant here; moreover, means-tested benefits make up only a small fraction of social benefits in Belgium. Taxevasion may be an issue, but the possible extent of it is unknown and cannotbe estimated due to lack of information. However, as documented in Verbist(2003), the Belgian personal tax system is well covered by MISIM, and outcomesare in line with administrative tax information. Consequently, MISIM basedsimulations can be considered sufficiently reliable first-order estimates.
In this article, only first-order effects are considered, so no account is takenof possible labour supply effects. Some microsimulation studies do model thebehavioural response in terms of labour supply and find that the effects ofpotential second round effects are relatively limited (see e.g. Bargain and Orsini,2007, who use EUROMOD to model the introduction of an Anglo-Saxon typeof working tax credits in three European countries).
Previous microsimulation studies reveal the existence of a trade-off betweenthe work incentive and the redistributive effects of measures aiming to ‘makework pay’. While efforts targeted at low-paid workers may make perfect sensefrom the perspective of increasing work incentives, this does not imply thatthe redistributive effects are as desirable as one might want them to be. Manylow-paid workers potentially affected by financial disincentives are not at thebottom of the distribution in terms of their disposable income at the householdlevel; in many instances, they are in fact relatively high up the household incomedistribution. Efforts to remove potential dependency traps may effectively involveredistribution to households relatively high up the income distribution. Hence,the effectiveness of the measures on both fronts crucially depends on their design(and particularly whether the measures are aimed at individuals with low earningsor in low-income households) and also on the interactions with the tax-benefitsystems in place (Sutherland, 2001; Muller and Steiner, 2008; Figari, 2009).
In-work poverty in Continental Europe and BelgiumGauging from the EU Social Inclusion Indicators database derived from EU-SILC, the extent of in-work poverty in 2008 ranges from a low of 4−5 per cent inBelgium and the Netherlands, to around 6−8 per cent in Austria, Germany andFrance, and over 12 per cent in Spain, Portugal and Greece.
In-work poverty is clearly significant across the EU. It is quite clear that theextent of in-work poverty is not reflective of how widespread relatively low-paidwork is, defined as two-thirds of the median monthly wage. In Ireland and theUnited Kingdom, earnings are considerably more dispersed and relatively low-paid work more widespread (Blau and Kahn, 2008; Lucifora and Salverda, 2008).Yet, with poverty rates for workers at 6 per cent in Ireland and 9 per cent inthe United Kingdom, in-work poverty is not more widespread than elsewhere inEurope.
24 ive marx, josefine vanhille and gerlinde verbist
In framing effective policy responses, it is essential to understand that low-paid work and in-work poverty are largely separate phenomena. Various studieshave demonstrated that the overlap between low pay and poverty is weak – in theorder of 5−10 per cent in most industrialised economies (Nolan and Marx, 2000).This is because poor households generally do not contain an employee, whetherlow paid or not, while most low-paid workers live in households with more thanone earner. A crucial influence is thus the extent to which the household relies onthe earnings of this low-paid worker. Particularly for low-paid women and youngpeople, their earnings most often constitute a secondary or even tertiary sourceof income for the household. In some cases, accepting a low-paid job helps tolift household income above the poverty threshold (Gardiner and Millar, 2006).Low-paid workers who are not primary earners are often reasonably high up theincome distribution.
While the low paid do still comprise a substantial proportion of the workingpoor, many – often a majority – of the working poor are not below conventionallow pay thresholds. The core of the working poor consists of workers who aresole earners and have a family to support. Even a moderately well-paid job maynot suffice to meet household income needs, depending on the extent of thoseneeds and the other sources of income available to the household.
What matters is the combined labour market position of householdmembers. Having only one earner in the household has become a poverty riskin an era in which the average living standard, and hence the relative povertythreshold, is increasingly determined by the dual-earner living standard. Thishelps to explain why in-work poverty is pervasive across Europe, and why itsextent does not simply reflect the size of the low-wage sector. In-work povertyis more strongly associated with the prevalence of single earnership than it iswith the size of the low-paid work force, and is thus a problem associated witha multiplicity of institutional factors (e.g. labour market regulation, child caresupport, tax incentives, etc.) that influence a household’s capacity for acquiringmultiple incomes in an era in which multiple household incomes are usuallyrequired to attain a decent standard of living. Lohmann and Marx (2008),comparing the EU-15 countries, argue that these institutional factors are mostfavourably aligned in the Nordic countries and least favourably in the South, whilethe institutional constellations in the Anglo-Saxon and Continental Europeancountries have mixed and sometimes contradictory effects.
In Belgium, the labour market and the welfare state remain to someextent geared towards the breadwinner model (Marx and Verbist, 2008b).With an implicit breadwinner bias still present in wage-setting institutionsand elements of labour market regulation, the size of the low-wage labourmarket remains comparatively limited. Job security protection remains elaborate,derived social security rights remain substantial and the tax system supports thesole breadwinner model to some extent. At the same time, however, childcare
combating in-work poverty in continental europe 25
provisions for working parents are extensive, making Belgium a case in pointof what has been called ‘optional familialism’, where the care-giving family issupported, but at the same time families are also given the option of being (atleast partially) unburdened from childcare responsibilities (Leitner, 2005).
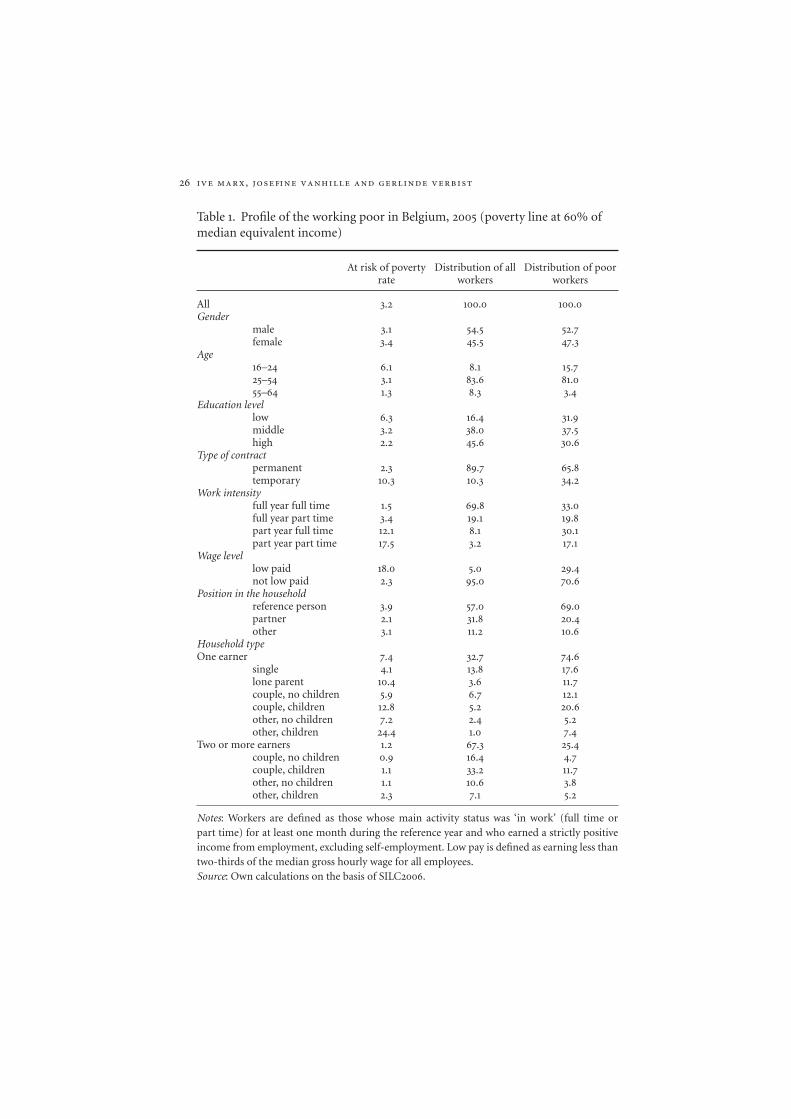
Table 1 shows the extent and structure of in-work poverty in Belgium. Itis primarily a phenomenon affecting prime-age workers. There is no stronggender bias, with male and female workers equally affected. Workers of alleducation levels are confronted with in-work poverty, albeit those with lowereducation levels relatively more strongly. The overlap with low-pay employmentis relatively limited. There is a strong association with work intensity in thatfull-year, full-time workers are considerably less likely to be confronted within-work poverty than part-year, part-time workers. Particularly important is theincidence and distribution of in-work poverty across household configurations.Employed lone parents and single-earner couples with dependent children aremost at risk of poverty. Single persons have a lower poverty risk, but becauseof their population share they constitute a significant share of poor workers.Among dual-earner households without children, in-work poverty is virtuallynon-existent. Yet a small but significant proportion of dual-earner householdswith dependent children have insufficient combined earnings to live free fromfinancial poverty. Hence, the population of workers confronted with poverty is aheterogeneous one, which is clearly important when it comes to framing policies.
Increasing minimum wagesMinimum wages in generalThe number of European countries with a national wage, set by law or
through collective bargaining at the national level, has increased over the pasttwo decades (Vaughan-Whitehead, 2010). The early 1990s saw the introduction ofminimum wages in the formerly Communist countries that are now part of theEuropean Union. The United Kingdom introduced a national minimum wage in1999, Ireland introduced one a year later and Austria in 2009. In 2010, nineteenMember States of the European Union had a national minimum wage, set bygovernment, often in cooperation with or on the advice of the social partners,or by the social partners themselves in a national agreement.2 In a number ofcountries where no national minimum wage exists, such as in Germany andthe Nordic countries, workers are protected by collective agreements set at theindustry or firm level. These vary considerably in coverage and in level.
Both EUROSTAT and OECD data show increases in real minimum wagesin all but a few EU countries. The most significant real term increases have byand large occurred in the EU12 countries. However, these real increases translateinto a more diverse picture if it comes to relative trends. Mostly on the basis ofEurostat data complemented with national sources, Vaughan-Whitehead (2010)
26 ive marx, josefine vanhille and gerlinde verbist
Table 1. Profile of the working poor in Belgium, 2005 (poverty line at 60% ofmedian equivalent income)
At risk of povertyrate
Distribution of allworkers
Distribution of poorworkers
All 3.2 100.0 100.0Gender
male 3.1 54.5 52.7female 3.4 45.5 47.3
Age16–24 6.1 8.1 15.725–54 3.1 83.6 81.055–64 1.3 8.3 3.4
Education levellow 6.3 16.4 31.9middle 3.2 38.0 37.5high 2.2 45.6 30.6
Type of contractpermanent 2.3 89.7 65.8temporary 10.3 10.3 34.2
Work intensityfull year full time 1.5 69.8 33.0full year part time 3.4 19.1 19.8part year full time 12.1 8.1 30.1part year part time 17.5 3.2 17.1
Wage levellow paid 18.0 5.0 29.4not low paid 2.3 95.0 70.6
Position in the householdreference person 3.9 57.0 69.0partner 2.1 31.8 20.4other 3.1 11.2 10.6
Household typeOne earner 7.4 32.7 74.6
single 4.1 13.8 17.6lone parent 10.4 3.6 11.7couple, no children 5.9 6.7 12.1couple, children 12.8 5.2 20.6other, no children 7.2 2.4 5.2other, children 24.4 1.0 7.4
Two or more earners 1.2 67.3 25.4couple, no children 0.9 16.4 4.7couple, children 1.1 33.2 11.7other, no children 1.1 10.6 3.8other, children 2.3 7.1 5.2
Notes: Workers are defined as those whose main activity status was ‘in work’ (full time orpart time) for at least one month during the reference year and who earned a strictly positiveincome from employment, excluding self-employment. Low pay is defined as earning less thantwo-thirds of the median gross hourly wage for all employees.Source: Own calculations on the basis of SILC2006.
combating in-work poverty in continental europe 27
finds, for the period 1995–2007, declines relative to average wages in seven outof twenty EU countries included in the study, and relative rises elsewhere. Overa shorter period (2000–2005), the OECD finds a similarly mixed picture. Less isknown about actual coverage and enforcement of minimum wages (Immervoll,2007).
Do higher minimum wages still have much to offer as a strategy for tacklingin-work poverty? The argument that minimum wages destroy jobs or stifle jobgrowth is as old as the notion of the minimum wage itself, but it is also now arguedthat they have become a particularly ineffective if not counter-productive policyinstrument in the fight against poverty due to the combined impact of the demandshift against the less-skilled and the demise of the breadwinner model (Iversenand Wren, 1998; Esping-Andersen et al., 2002). Female employment rates remaincomparatively low in many European countries, and this could be partly becauseinstitutionally compressed wages limit the expansion of suitable employment.This is not the place to review the extensive literature on the employment effects ofminimum wages and wage-setting institutions, but research generally shows thatthe minimum wage floors as they actually exist tend to have limited demonstrableeffects on employment, although particular groups like young people or womenmay be more substantially affected (Dolado et al., 1996, 2000; OECD, 1998, 2004;Kenworthy, 2004).
A potentially more powerful argument against employing minimum wagesor equivalent strategies as a strategy against in-work poverty is that becauseof the very limited overlap between low pay and poverty, any policy aimed atimproving the earnings of the low paid will directly benefit only a minority ofpoor households (Nolan and Marx, 2000). Studies suggest that even in thosecases where the overlap between low pay and household poverty is the greatest,as is the case in the United States, increases in the minimum wage have a relativelylimited impact on poverty or income inequality and a substantial spill-over to thenon-poor (see, for example, Horrigan and Mincey, 1993; Neumark and Wascher,1997; Formby et al., 2005, 2010). Similarly, Gosling (1996) and Sutherland (2001)found the potential poverty-reducing effect of the national minimum wage inthe UK context to be very small.
Wage-setting institutions and minimum wage protection in BelgiumWage setting in Belgium is a matter in which unions and employers have
a large degree of autonomy. Although an initial round of bargaining at thenational level sets the parameters every two years, actual wage bargaining takesplace at the industry level, where collective agreements are negotiated in overone hundred parity commissions, some covering specific subsectors with onlya few hundred workers. Another notable feature is Belgium’s automatic wageindexation system, which guarantees that wages are automatically adjusted toprice increases. There is no statutory minimum wage in Belgium, but there is a
28 ive marx, josefine vanhille and gerlinde verbist
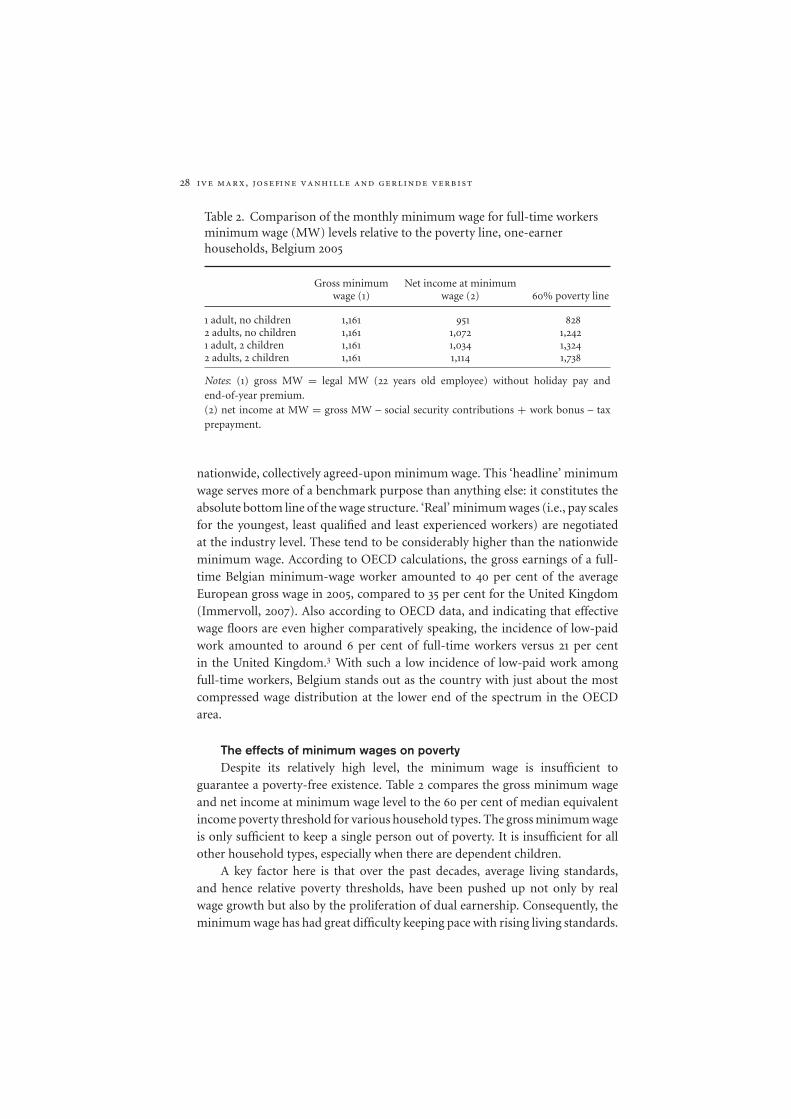
Table 2. Comparison of the monthly minimum wage for full-time workersminimum wage (MW) levels relative to the poverty line, one-earnerhouseholds, Belgium 2005
Gross minimumwage (1)
Net income at minimumwage (2) 60% poverty line
1 adult, no children 1,161 951 8282 adults, no children 1,161 1,072 1,2421 adult, 2 children 1,161 1,034 1,3242 adults, 2 children 1,161 1,114 1,738
Notes: (1) gross MW = legal MW (22 years old employee) without holiday pay andend-of-year premium.(2) net income at MW = gross MW – social security contributions + work bonus – taxprepayment.
nationwide, collectively agreed-upon minimum wage. This ‘headline’ minimumwage serves more of a benchmark purpose than anything else: it constitutes theabsolute bottom line of the wage structure. ‘Real’ minimum wages (i.e., pay scalesfor the youngest, least qualified and least experienced workers) are negotiatedat the industry level. These tend to be considerably higher than the nationwideminimum wage. According to OECD calculations, the gross earnings of a full-time Belgian minimum-wage worker amounted to 40 per cent of the averageEuropean gross wage in 2005, compared to 35 per cent for the United Kingdom(Immervoll, 2007). Also according to OECD data, and indicating that effectivewage floors are even higher comparatively speaking, the incidence of low-paidwork amounted to around 6 per cent of full-time workers versus 21 per centin the United Kingdom.3 With such a low incidence of low-paid work amongfull-time workers, Belgium stands out as the country with just about the mostcompressed wage distribution at the lower end of the spectrum in the OECDarea.
The effects of minimum wages on povertyDespite its relatively high level, the minimum wage is insufficient to
guarantee a poverty-free existence. Table 2 compares the gross minimum wageand net income at minimum wage level to the 60 per cent of median equivalentincome poverty threshold for various household types. The gross minimum wageis only sufficient to keep a single person out of poverty. It is insufficient for allother household types, especially when there are dependent children.
A key factor here is that over the past decades, average living standards,and hence relative poverty thresholds, have been pushed up not only by realwage growth but also by the proliferation of dual earnership. Consequently, theminimum wage has had great difficulty keeping pace with rising living standards.
combating in-work poverty in continental europe 29
The increases in the minimum wage required to keep a sole breadwinnerhousehold with children relying on it above the poverty threshold would havehad to significantly exceed the rise in average wages. Consequently, the increasesin the minimum wage required to eliminate in-work poverty in most Europeanwelfare states are now quite substantial.
Using microsimulation, we evaluate the distributional and poverty-reducingimpact of some very substantial minimum wage increases. First, we simulate ascenario where all workers are paid at least the current minimum wage in orderto rule out possible effects of undeclared employment or mismatches betweenreported values for income and working hours. Then three alternative scenariosare simulated: the minimum wage is lifted to 110, 120 and 130 per cent of its currentlevel. For each person employed at a wage lower than the respective threshold,gross employment income is brought up to the level where all hours workedare remunerated at the higher hourly wage. The microsimulation model MISIMallows calculating the resulting net income, taking into account the features ofthe Belgian tax-benefit system, such as eligibility for wage subsidies or tax credits,and the progressive structure of income taxation. This means that first-roundeffects are included, while second-round effects that may occur following theintroduction of an elevated minimum wage are not accounted for.4 The effectof the minimum wage increases on the relative poverty threshold is taken intoaccount.
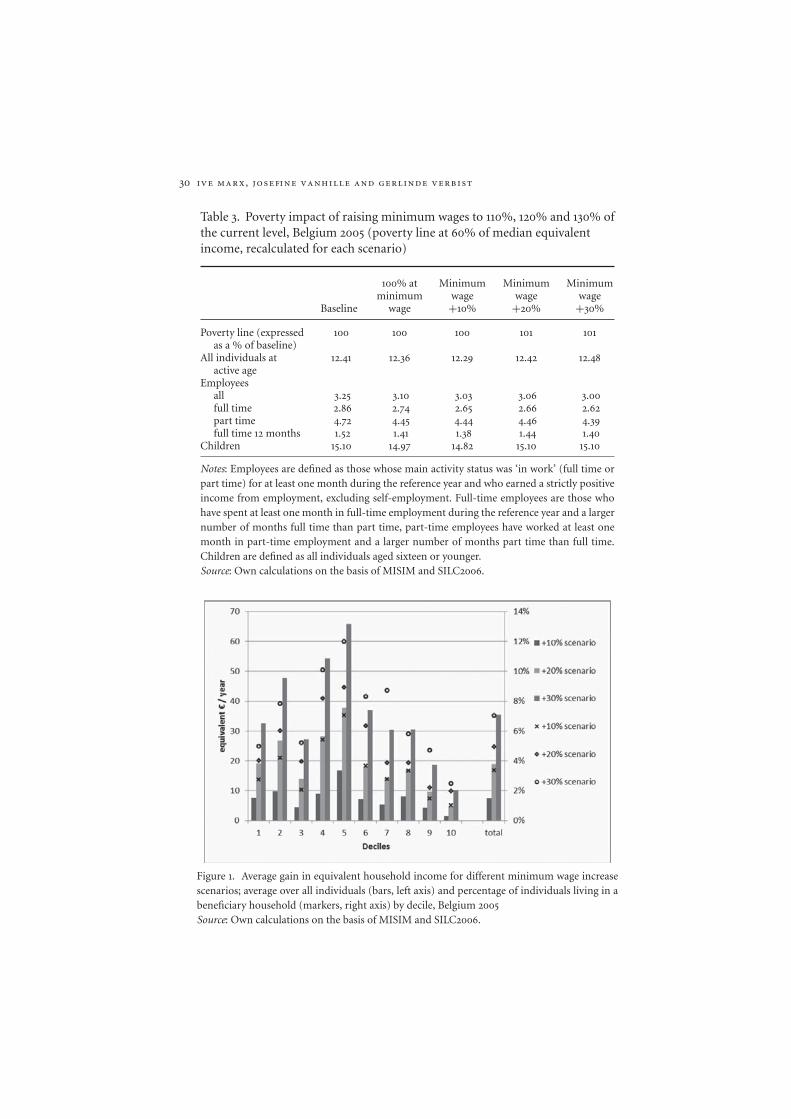
Figure 1 presents the average gain in equivalent household income resultingfrom each of the three alternative scenarios in comparison to the baseline scenario(where every working individual earns at least the minimum hourly wage). Thebars express the averages over the total population, while the markers show thepercentage of individuals living in a household that benefits from the policymeasure.
The concentration of extra income is highest in the middle of the incomedistribution: average gains are highest in the fourth and fifth decile (left axis).This distribution is largely driven by the proportion of beneficiaries per decile(right axis). Only 3 (+10%-scenario) to 5 (+30%-scenario) per cent of individualssituated in the first decile live in a household with a worker benefiting from thewage increase. The net gain for those who actually benefit from the respectivemeasures is comparable or even higher in the lowest deciles than for those higherup the income distribution. But because relatively few workers are to be found inthe lower deciles, the average gain is higher towards the middle of the householdincome distribution. This distributional pattern points to the marginal impactof these measures in terms of poverty reduction (see Table 3). Persons at risk ofpoverty are situated in the lowest deciles, where the percentage of gainers remainsrelatively limited. At the same time, about 70 per cent of the employees at risk ofpoverty are not low paid, which means they are not benefiting from a minimumwage increase.
30 ive marx, josefine vanhille and gerlinde verbist
Table 3. Poverty impact of raising minimum wages to 110%, 120% and 130% ofthe current level, Belgium 2005 (poverty line at 60% of median equivalentincome, recalculated for each scenario)
Baseline
100% atminimum
wage
Minimumwage+10%
Minimumwage+20%
Minimumwage+30%
Poverty line (expressed 100 100 100 101 101as a % of baseline)
All individuals at 12.41 12.36 12.29 12.42 12.48active age
Employeesall 3.25 3.10 3.03 3.06 3.00full time 2.86 2.74 2.65 2.66 2.62part time 4.72 4.45 4.44 4.46 4.39full time 12 months 1.52 1.41 1.38 1.44 1.40
Children 15.10 14.97 14.82 15.10 15.10
Notes: Employees are defined as those whose main activity status was ‘in work’ (full time orpart time) for at least one month during the reference year and who earned a strictly positiveincome from employment, excluding self-employment. Full-time employees are those whohave spent at least one month in full-time employment during the reference year and a largernumber of months full time than part time, part-time employees have worked at least onemonth in part-time employment and a larger number of months part time than full time.Children are defined as all individuals aged sixteen or younger.Source: Own calculations on the basis of MISIM and SILC2006.
Figure 1. Average gain in equivalent household income for different minimum wage increasescenarios; average over all individuals (bars, left axis) and percentage of individuals living in abeneficiary household (markers, right axis) by decile, Belgium 2005Source: Own calculations on the basis of MISIM and SILC2006.
combating in-work poverty in continental europe 31
About 3 (+10%-scenario) to 6.5 (+30%-scenario) per cent of Belgianemployees would benefit from a net nominal gain in disposable income of justover €1,500 per year on average over the different scenarios. In gross terms,this corresponds to a rise of about €2,600 per year. The increase in labourcosts for the employer would exceed this amount by a substantial marginbecause of the additional employer social insurance contributions.5 Note thatthis is yet another reason why the policy option of raising minimum wagesis particularly constrained in many Continental European countries – non-wage costs in the form of additional social security contributions by employersare significant. According to OECD calculations for 2005, payroll taxes andemployer contributions at minimum wage level amounted to around 15−17per cent in Belgium, France and the Netherlands, and to around 30 per centor more in Spain, Italy and Greece (Immervoll, 2007). By contrast, in Irelandand Britain the additional cost to employers at minimum wage level was around7−8 per cent.
These calculations for Belgium suggest that a minimum wage increase wouldcome at a substantial additional cost to employers, with a very limited directimpact on poverty and with the bulk of the gains going to middle-income families.Hence we can safely conclude that raising minimum wages as an isolated measureis relatively ineffective and cost-inefficient as a way to reduce poverty amongworkers.
Reducing social security contributions and taxes on low wagesThe taxation of low wagesOECD tax calculations for 2005 (Immervoll, 2007) show that the average tax
rate on full-time minimum wages is considerable in most Continental Europeancountries. Personal income taxes and employees social contributions amount to18.8 per cent in Belgium, 17.6 per cent in France and even 23.8 per cent in theNetherlands. For Ireland and the United Kingdom, the figures are 3.8 per centand 11 per cent.
These high levels indicate that in many countries there is still substantialscope for improving the income position of low-wage households through cutsin employee social contributions and personal income taxes. Many countrieshave effectively introduced reductions of employees’ social contributions on lowwages, thus increasing the income progressivity of social contributions and taxes(Immervoll, 2007). The prime objective here, however, has not been to alleviatein-work poverty but to increase work incentives, particularly the net pay-off tomaking the transition from dependence on a social assistance or unemploymentbenefit to a low-paid job. The question we are interested in is whether suchreductions also help in reducing or preventing in-work poverty.
32 ive marx, josefine vanhille and gerlinde verbist
The taxation of low wage workers in BelgiumBelgium can be noted for its comparatively high level of taxes on wages.
Belgium not only has one of the highest tax burdens on average and higher wagesin the OECD area, but on low wage levels as well (Immervoll, 2007). Going back toTable 2, we see that with the gross minimum wage insufficient to guarantee a lifefree from financial poverty (except for single persons), taxation (personal incometaxes and employee social security contributions) aggravates the situation. Overthe last years, Belgium has made efforts to reduce its tax burden on wages,especially for those at the lower end of the income distribution. With the 2001 taxreform, a general tax cut was introduced along with a refundable low-wage taxcredit. This tax credit, amounting at its peak in 2005 to €540 per year, was appliedto individual net taxable income from employment before any family-relatedtaxation rules were taken into account. Structural reductions of employee socialinsurance contributions for low-wage earners were also introduced, as well as avariety of reductions in employers’ social insurance contributions. One of themore recent measures intended to increase the net wages of low-wage workersis the ‘Work Bonus’. This was introduced in January 2005, gradually replacingthe structural reductions of employee contributions and the low-wage tax credit.The employee social security contribution reduction can amount to €150 permonth for a low-wage worker; it is tapered away as the wage level increases.Contrary to the low-wage tax credit, it also takes into account the employee’swork intensity. In the case of people earning the lowest wages, this measure canreduce the amount of social insurance contributions payable by half.
In the following sections, we study the poverty impact of tax and socialsecurity reductions for low wages by comparing three different policy measures,namely (1) the Work Bonus, (2) the Belgian Individual Tax Credit for Low Wagesand (3) the hypothetical introduction of a UK-style Working Tax Credit. All threescenarios are set in such a way that they require the same overall expenditure,thus making it possible to compare their poverty impact. Their design and theamounts used in the simulation to attain the budget-neutrality are summarisedin Table 4.
The Work Bonus and the Individual Tax CreditSince its introduction in 2005, the Work Bonus was repeatedly extended in
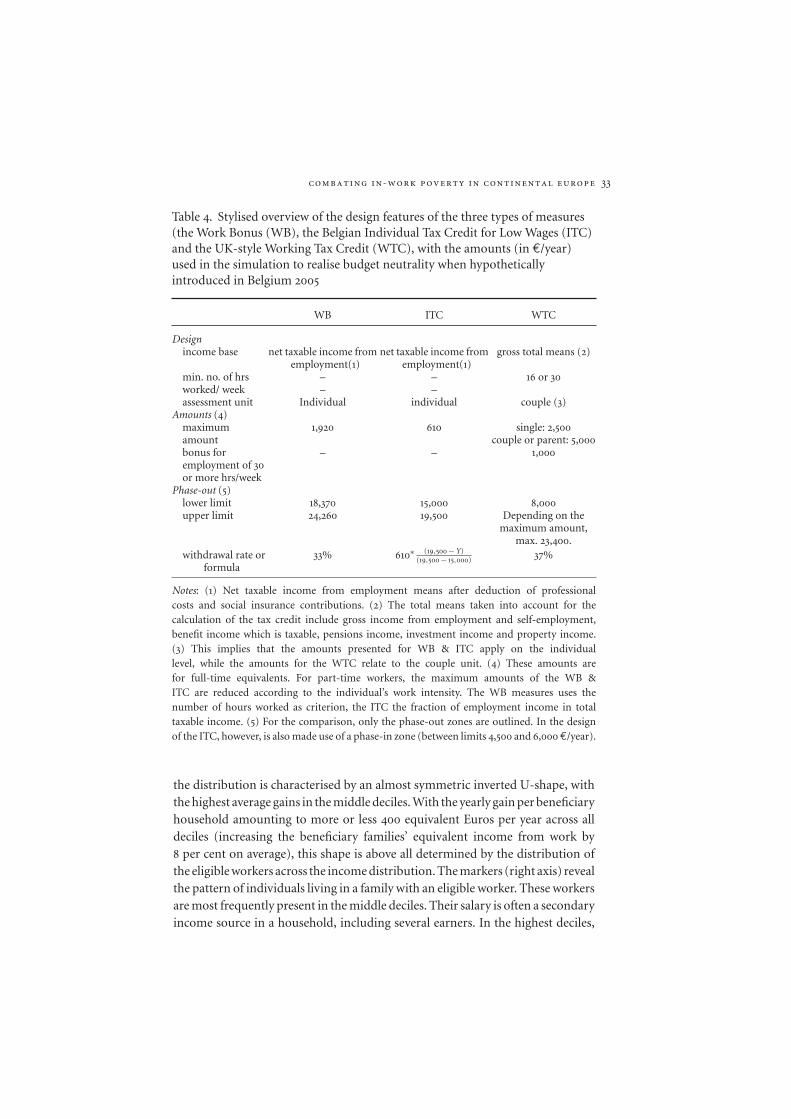
scope, reaching its highest level in 2009. It is the latter version we simulate,by ‘backrating’ the 2009 amounts to their comparable level in 2005, usingthe harmonised index of consumer prices. The budgetary mass thus obtainedamounts to about 7 per cent of total employee social security contributions,a ratio that corresponds to the administrative statistics for 2009 (FOD SocialSecurity, 2010). Figure 2 presents the distribution of the net gains in equivalenthousehold income. Over the whole population (bars, left axis), the Work Bonusgain averages 100 equivalent Euros per year. As for the minimum wage simulation,
combating in-work poverty in continental europe 33
Table 4. Stylised overview of the design features of the three types of measures(the Work Bonus (WB), the Belgian Individual Tax Credit for Low Wages (ITC)and the UK-style Working Tax Credit (WTC), with the amounts (in €/year)used in the simulation to realise budget neutrality when hypotheticallyintroduced in Belgium 2005
WB ITC WTC
Designincome base net taxable income from net taxable income from gross total means (2)
employment(1) employment(1)min. no. of hrs – – 16 or 30worked/ week – –assessment unit Individual individual couple (3)
Amounts (4)maximumamount
1,920 610 single: 2,500couple or parent: 5,000
bonus for – – 1,000employment of 30or more hrs/week
Phase-out (5)lower limit 18,370 15,000 8,000upper limit 24,260 19,500 Depending on the
maximum amount,max. 23,400.
withdrawal rate orformula
33% 610∗ (19,500 − Y)(19,500 − 15,000) 37%
Notes: (1) Net taxable income from employment means after deduction of professionalcosts and social insurance contributions. (2) The total means taken into account for thecalculation of the tax credit include gross income from employment and self-employment,benefit income which is taxable, pensions income, investment income and property income.(3) This implies that the amounts presented for WB & ITC apply on the individuallevel, while the amounts for the WTC relate to the couple unit. (4) These amounts arefor full-time equivalents. For part-time workers, the maximum amounts of the WB &ITC are reduced according to the individual’s work intensity. The WB measures uses thenumber of hours worked as criterion, the ITC the fraction of employment income in totaltaxable income. (5) For the comparison, only the phase-out zones are outlined. In the designof the ITC, however, is also made use of a phase-in zone (between limits 4,500 and 6,000€/year).
the distribution is characterised by an almost symmetric inverted U-shape, withthe highest average gains in the middle deciles. With the yearly gain per beneficiaryhousehold amounting to more or less 400 equivalent Euros per year across alldeciles (increasing the beneficiary families’ equivalent income from work by8 per cent on average), this shape is above all determined by the distribution ofthe eligible workers across the income distribution. The markers (right axis) revealthe pattern of individuals living in a family with an eligible worker. These workersare most frequently present in the middle deciles. Their salary is often a secondaryincome source in a household, including several earners. In the highest deciles,
34 ive marx, josefine vanhille and gerlinde verbist
Figure 2. Average gain in equivalent household income due to the Work Bonus by decile,Belgium 2005Source: Own calculations on the basis of MISIM and SILC2006.
the presence of low-paid workers is substantially smaller. These upper deciles areto a considerable extent populated by dual-earner households accumulating twosalaries. In the lower deciles, finally, the percentage of individuals living with aneligible worker is as low as in the upper deciles. Although about half of employeessituated at the lower end of the income distribution is low paid and eligible forthe Work Bonus, these deciles are overwhelmingly populated by inactive persons,resulting in low average gains.
Next, the Individual Tax Credit for low wages is simulated in its 2005configuration. For the simulation, the amounts and brackets were slightlyuprated in order to achieve budget-neutrality with the Work Bonus measure. Theamounts used as well as a summary of the main design features can be found inTable 4.
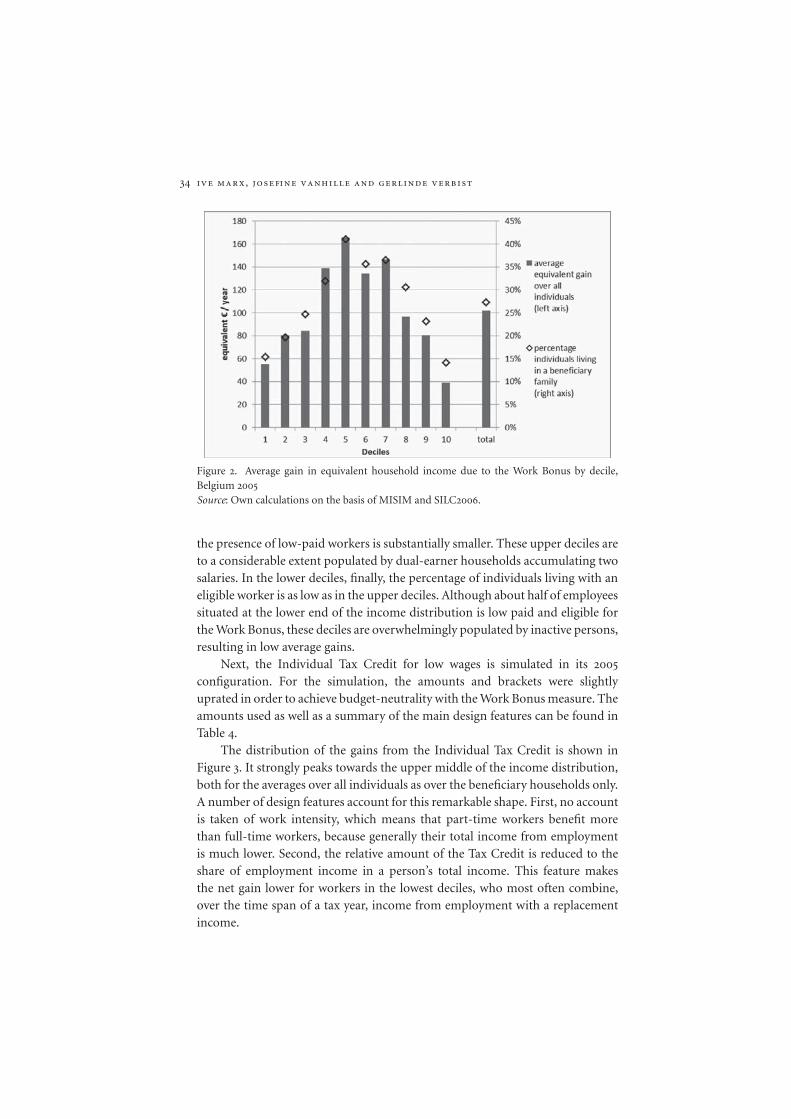
The distribution of the gains from the Individual Tax Credit is shown inFigure 3. It strongly peaks towards the upper middle of the income distribution,both for the averages over all individuals as over the beneficiary households only.A number of design features account for this remarkable shape. First, no accountis taken of work intensity, which means that part-time workers benefit morethan full-time workers, because generally their total income from employmentis much lower. Second, the relative amount of the Tax Credit is reduced to theshare of employment income in a person’s total income. This feature makesthe net gain lower for workers in the lowest deciles, who most often combine,over the time span of a tax year, income from employment with a replacementincome.
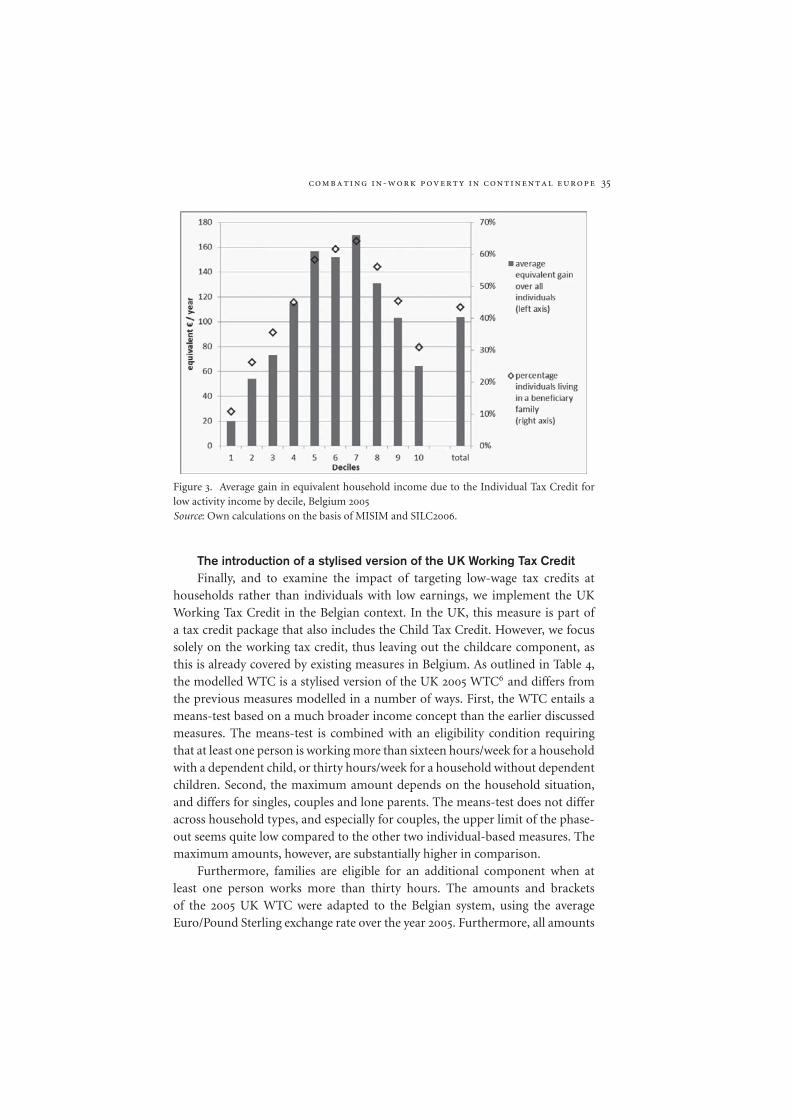
combating in-work poverty in continental europe 35
Figure 3. Average gain in equivalent household income due to the Individual Tax Credit forlow activity income by decile, Belgium 2005Source: Own calculations on the basis of MISIM and SILC2006.
The introduction of a stylised version of the UK Working Tax CreditFinally, and to examine the impact of targeting low-wage tax credits at
households rather than individuals with low earnings, we implement the UKWorking Tax Credit in the Belgian context. In the UK, this measure is part ofa tax credit package that also includes the Child Tax Credit. However, we focussolely on the working tax credit, thus leaving out the childcare component, asthis is already covered by existing measures in Belgium. As outlined in Table 4,the modelled WTC is a stylised version of the UK 2005 WTC6 and differs fromthe previous measures modelled in a number of ways. First, the WTC entails ameans-test based on a much broader income concept than the earlier discussedmeasures. The means-test is combined with an eligibility condition requiringthat at least one person is working more than sixteen hours/week for a householdwith a dependent child, or thirty hours/week for a household without dependentchildren. Second, the maximum amount depends on the household situation,and differs for singles, couples and lone parents. The means-test does not differacross household types, and especially for couples, the upper limit of the phase-out seems quite low compared to the other two individual-based measures. Themaximum amounts, however, are substantially higher in comparison.
Furthermore, families are eligible for an additional component when atleast one person works more than thirty hours. The amounts and bracketsof the 2005 UK WTC were adapted to the Belgian system, using the averageEuro/Pound Sterling exchange rate over the year 2005. Furthermore, all amounts
36 ive marx, josefine vanhille and gerlinde verbist
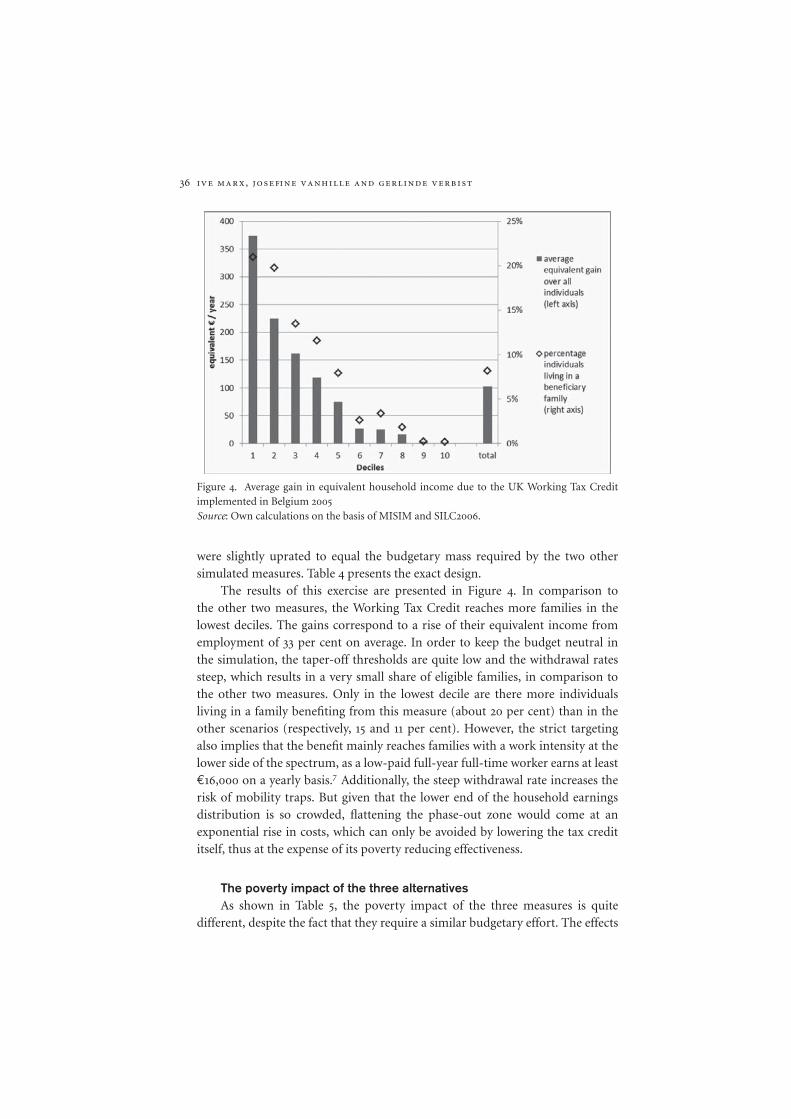
Figure 4. Average gain in equivalent household income due to the UK Working Tax Creditimplemented in Belgium 2005Source: Own calculations on the basis of MISIM and SILC2006.
were slightly uprated to equal the budgetary mass required by the two othersimulated measures. Table 4 presents the exact design.
The results of this exercise are presented in Figure 4. In comparison tothe other two measures, the Working Tax Credit reaches more families in thelowest deciles. The gains correspond to a rise of their equivalent income fromemployment of 33 per cent on average. In order to keep the budget neutral inthe simulation, the taper-off thresholds are quite low and the withdrawal ratessteep, which results in a very small share of eligible families, in comparison tothe other two measures. Only in the lowest decile are there more individualsliving in a family benefiting from this measure (about 20 per cent) than in theother scenarios (respectively, 15 and 11 per cent). However, the strict targetingalso implies that the benefit mainly reaches families with a work intensity at thelower side of the spectrum, as a low-paid full-year full-time worker earns at least€16,000 on a yearly basis.7 Additionally, the steep withdrawal rate increases therisk of mobility traps. But given that the lower end of the household earningsdistribution is so crowded, flattening the phase-out zone would come at anexponential rise in costs, which can only be avoided by lowering the tax credititself, thus at the expense of its poverty reducing effectiveness.
The poverty impact of the three alternativesAs shown in Table 5, the poverty impact of the three measures is quite
different, despite the fact that they require a similar budgetary effort. The effects
combating in-work poverty in continental europe 37
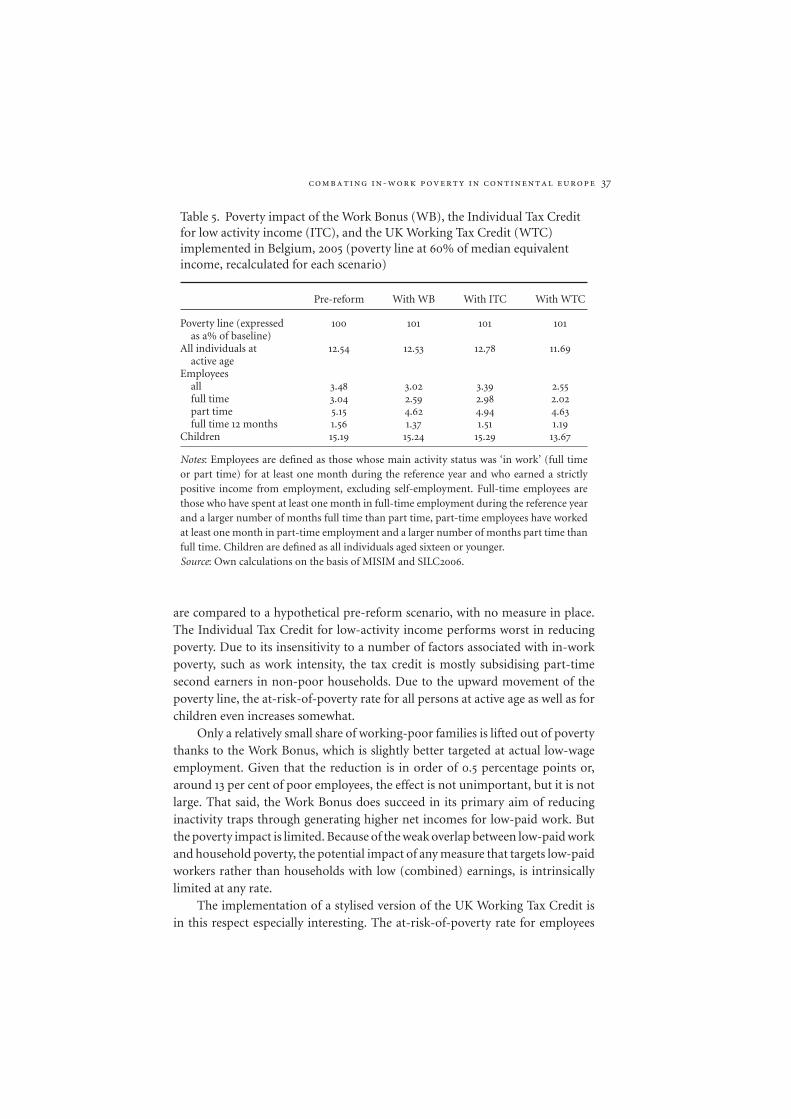
Table 5. Poverty impact of the Work Bonus (WB), the Individual Tax Creditfor low activity income (ITC), and the UK Working Tax Credit (WTC)implemented in Belgium, 2005 (poverty line at 60% of median equivalentincome, recalculated for each scenario)
Pre-reform With WB With ITC With WTC
Poverty line (expressed 100 101 101 101as a% of baseline)
All individuals at 12.54 12.53 12.78 11.69active age
Employeesall 3.48 3.02 3.39 2.55full time 3.04 2.59 2.98 2.02part time 5.15 4.62 4.94 4.63full time 12 months 1.56 1.37 1.51 1.19
Children 15.19 15.24 15.29 13.67
Notes: Employees are defined as those whose main activity status was ‘in work’ (full timeor part time) for at least one month during the reference year and who earned a strictlypositive income from employment, excluding self-employment. Full-time employees arethose who have spent at least one month in full-time employment during the reference yearand a larger number of months full time than part time, part-time employees have workedat least one month in part-time employment and a larger number of months part time thanfull time. Children are defined as all individuals aged sixteen or younger.Source: Own calculations on the basis of MISIM and SILC2006.
are compared to a hypothetical pre-reform scenario, with no measure in place.The Individual Tax Credit for low-activity income performs worst in reducingpoverty. Due to its insensitivity to a number of factors associated with in-workpoverty, such as work intensity, the tax credit is mostly subsidising part-timesecond earners in non-poor households. Due to the upward movement of thepoverty line, the at-risk-of-poverty rate for all persons at active age as well as forchildren even increases somewhat.
Only a relatively small share of working-poor families is lifted out of povertythanks to the Work Bonus, which is slightly better targeted at actual low-wageemployment. Given that the reduction is in order of 0.5 percentage points or,around 13 per cent of poor employees, the effect is not unimportant, but it is notlarge. That said, the Work Bonus does succeed in its primary aim of reducinginactivity traps through generating higher net incomes for low-paid work. Butthe poverty impact is limited. Because of the weak overlap between low-paid workand household poverty, the potential impact of any measure that targets low-paidworkers rather than households with low (combined) earnings, is intrinsicallylimited at any rate.
The implementation of a stylised version of the UK Working Tax Credit isin this respect especially interesting. The at-risk-of-poverty rate for employees
38 ive marx, josefine vanhille and gerlinde verbist
drops by almost one percentage point, and at the same time the poverty rate forthe whole population of active age, as well as for children, diminishes. With thegiven budget, this measure has the most efficient poverty reduction capacity. Itsreach, however, remains too small to eliminate in-work poverty, at least withinthe budgetary constraints we impose for the purpose of making the simulatedpolicy alternatives comparable.
DiscussionWe have demonstrated that, at least in Belgium, even substantially higherminimum wages would have a limited impact on in-work poverty, and at the costof rises in labour costs and significant spill-overs to households in the middle andupper regions of the income distribution. Moreover, given that in the recent pastmedian living standards and hence relative poverty thresholds have been pushedup, not only by rising wages but also by the proliferation of dual earnership,the increases in minimum wages required to keep workers solely relying onit above the poverty threshold are by now so substantial that they are hardlyconceivable. Yet minimum wages still constitute the foundation of minimumincome protection for workers. They do not have a budgetary cost, as long asthey do not destroy jobs and cause people to become dependent on benefits. Thereis no hard empirical evidence that this is the case at currently prevailing levels,but such effects cannot be excluded at the levels we have simulated. Minimumwages do increase the consumer cost of certain products or services, but here it isuseful to keep in mind that often this entails a redistribution between relativelyhighly paid consumers of services to relatively lower-paid providers (Freeman,1996). Moreover, in an encompassing anti-poverty strategy, minimum wages canplay a crucial role in dampening the possible wage erosion effects of in-workbenefits and tax credits. This points to the importance of maintaining minimumwages and making sure that these keep pace with average wage growth.
Reduced social security contributions and well-targeted individual taxcredits increase the net pay of low-paid workers, but since most of them donot live in a household with a combined disposable income below the povertyline, the impact on poverty is again very limited. There are other considerations.A further shift from proportional to progressive contributions clashes withthe insurance rationale of the Bismarckian systems prevalent in ContinentalEurope. This implies that the approach of reducing employees’ contributionsand deviating further from the equivalence principle has its limits.
The fundamental problem with both policy options from a poverty reductionviewpoint is that they are targeted at low-paid workers, not households withinsufficient combined earnings. What then about tax relief for households ratherthan individuals on low earnings? As we have demonstrated for Belgium, in orderto be effective as an anti-poverty device, such tax measures need to be strongly
combating in-work poverty in continental europe 39
targeted. But strong targeting at households with low earnings is bound to createmobility traps. These can be avoided if taper-off rates are sufficiently flat, butthat comes at a very considerable cost given that the lower end of the householdearnings distribution is so densely populated in most Continental Europeancountries. This cost can only be avoided by making the amount of the tax credititself smaller, but in that case the anti-poverty effect is reduced. In addition, fromthe perspective of horizontal equity and public support for the system, there areprobably limits to strongly targeted tax measures.
Finally, there are policy options that do not seek to target specific segmentsamong the poor. Universal child benefits, for example, have an immediateimpact on poverty – both among those who depend on earnings and thoseon replacement benefits – without adversely affecting work incentives. This isimportant given that there is a very significant overlap between child povertyand in-work poverty. Corak et al. (2005) show that the best performing countriesin terms of poverty reduction tend to have systems of universal child benefitsand tax concessions that are not particularly strongly targeted at low-incomechildren. Yet within universal systems, there still is scope for targeting resourcesproportionally more at the poorest. Together with policies that facilitate andsupport dual earnership, particularly the employment of carers, such universalbenefits are bound to constitute a key component of any effective policy packageto tackle in-work poverty.
AcknowledgementsWe would like to thank two anonymous referees for their valuable comments.
Notes1 The modified OECD equivalence scale gives a weight of 1.0 to the first household member
aged fourteen or over; 0.5 to each additional household member aged fourteen or moreand 0.3 to every member younger than fourteen.
2 The EU countries with a national minimum wage, set by government of by a generallybinding collective agreement include: Austria, Belgium, Spain, Estonia, Greece, France,Hungary, Ireland, Latvia, Lithuania, Luxembourg, Malta, the Netherlands, Poland, Portugal,Slovakia, Slovenia, Czech Republic and the United Kingdom.
3 The incidence of low pay refers to the share of full-time workers earning less than two-thirdsof median earnings.
4 Possible effects might include an adjustment of the entire wage structure to the newbenchmark, or the pressure of increased labour costs on employment rates.
5 Assuming that the cost is not shifted to the worker as a further round effect.6 The degree of detail available in the data did not allow us to model all features of the measure.
The disability conditions and the 50+–component of the UK WTC were therefore left outin the measure modeled.
7 Earning twelve months the full-time minimum wage, plus holiday payment and end-of-yearbonus.
40 ive marx, josefine vanhille and gerlinde verbist
ReferencesAndreβ, H. J. and Lohmann, H. (2008), The Working Poor in Europe, London: Edward Elgar.Bargain, O. and Orsini, K. (2007), ‘Beans for breakfast? How exportable is the British workfare
model?’, in O. Bargain (ed.), Microsimulation in Action: Policy Analysis in Europe usingEUROMOD, Research in Labour Economics, vol. 25, Oxford: Elsevier.
Blau, F. and Kahn, L. (2008), ‘Inequality and earnings distribution’, in W. Salverda, B. Nolan andT. Smeeding (eds.), Oxford Handbook of Economic Inequality, Oxford: Oxford UniversityPress.
Brewer, M., Duncan, A., Shephard, A. and Suarez, M. J. (2006), ‘Did working families’ taxcredit work? The impact of in-work support on labour supply in Great Britain’, LabourEconomics, 13: 6, 699–720.
Corak, M., Lietz, C. and Sutherland, H. (2005), ‘The impact of tax and transfer systems onchildren in the European Union’, IZA Discussion Paper 1589, Bonn: IZA.
Dolado, J., Kramarz, F., Machin, S., Manning, A., Margolis, D. and Teulings, K. (1996), ‘Theeconomic impact of minimum wages in Europe’, Economic Policy, 11: 23, 319–72.
Dolado, J., Felgueroso, F. and Jimeno, J. (2000), ‘The role of the minimum wage in the welfarestate: an appraisal’, IZA Discussion Paper 152, Bonn: IZA.
Eissa, N. and Hoynes, H. (2004), ‘Taxes and the labor market participation of married couples:the Earned Income Tax Credit’, Journal of Public Economics, 88: 9–10, 1931–58.
Esping-Andersen, G., Gallie, D., Hemerijck, A. and Myles, J. (2002), Why We Need a New WelfareState, Oxford: Oxford University Press.
Eurofound (2010), Working Poor in Europe, Dublin: Eurofound.Figari, F. (2009), ‘Can in-work benefits improve social inclusion in the Southern European
countries?’, EUROMOD Working Paper EM4/09, ISER, University of Essex.FOD Social Security (2010), Vademecum van de financiele en statistische gegevens over de
sociale bescherming in Belgie. Brussel: Directie-generaal Beleidsondersteuning en Directie-generaal Sociaal Beleid – Federale Overheidsdienst Sociale Zekerheid.
Formby, J., Bishop, J. and Kim, H. (2005), Minimum Wages and Poverty: An Evaluation ofAlternatives, Amsterdam: Elsevier.
Formby, J., Bishop, J. and Kim, H. (2010), What’s Best at Reducing Poverty? An Examinationof the Effectiveness of the 2007 Minimum Wage Increase, Washington DC: EmploymentPolicies Institute.
Freeman, R. (1996), ‘The minimum wage as a redistributive tool’, Economic Journal, 106: 436,639–49 and 842–9.
Gardiner, K. and Millar, J. (2006), ‘How low-paid employees avoid poverty: an analysis byfamily type and household structure’, Journal of Social Policy, 35, 351–69.
Gosling, A. (1996), ‘Minimum wages: possible effects on the income distribution’, Fiscal Studies,17: 4, 31–48.
Hauser, R. (2008), Problems of the German Contribution to EU-SILC – a Research Perspective,Comparing EU-SILC, Microcensus and SOEP, SOEPpapers 86, Berlin: DIW Berlin.
Horrigan, M. and Mincey, R. (1993), ‘The minimum wage and earnings and income inequality’,in S. Danziger and P. Gottschalk (eds.), Uneven Tides: Rising Inequality in America, NewYork: Russell Sage Foundation, pp. 251–75.
Hotz, V. J. and Scholz, J. K. (2003), ‘The earned income tax credit’, in R. Moffit (ed.),Means-tested Transfer Programs in the US, Chicago: University of Chicago Press,pp. 141–98.
Immervoll, H. (2007), Minimum Wages, Minimum Labour Costs and the Tax Treatment of Low-Wage Employment, OECD Social, Employment and Migration Working Papers 46, Paris:OECD.
Iversen, T. and Wren, A. (1998), ‘Equality, employment and budgetary restraint, the trilemmaof the service economy’, World Politics, 50: 4, 507–46.
Kenworthy, L. (2004), Egalitarian Capitalism? Jobs, Incomes and Inequality in Affluent Countries,New York: Russell Sage Foundation.
Kenworthy, L. (2011), Progress for the Poor, Oxford: Oxford University Press.
combating in-work poverty in continental europe 41
Leitner, S. (2005), ‘Conservative familialism reconsidered: the case of Belgium’, Acta Politica,40: 419–39.
Lohmann, H. and Marx, I. (2008), ‘The different faces of in-work poverty across welfare stateregimes’, in H. J. Andreβ and H. Lohmann (eds.), The Working Poor in Europe, London:Edward Elgar.
Lucifora, C. and Salverda, W. (2008), ‘Low pay’, in W. Salverda, B. Nolan and T. Smeeding(eds.), Oxford Handbook of Economic Inequality, Oxford: Oxford University Press.
Lusyne, P. (2007), ‘Een analyse naar de coherentie van de resultaten van de EU-SILC enquete’,Brussel: ADSEI – Federale Overheidsdienst Economie.
Marx, I. and Verbist, G. (2008a), ‘Combating in-work poverty in Continental Europe: the policyoptions assessed’, in H. J. Andreβ and H. Lohmann (eds.), The Working Poor in Europe,London: Edward Elgar.
Marx, I. and Verbist, G. (2008b), ‘When famialism fails: in-work poverty in Belgium’, in H. J.Andreβ and H. Lohmann (eds.), The Working Poor in Europe, London: Edward Elgar.
Muller, K.-U. and Steiner, V. (2008), ‘Would a legal minimum wage reduce poverty? Amicrosimulation study for Germany’, DIW Discussion Paper 791, Berlin.
Neumark, D. and Wascher, W. (1997), Do Minimum Wages Fight Poverty?, Working Paper 6127,Cambridge: National Bureau of Economic Research.
Nolan, B. and Marx, I. (2000), ‘Low pay and household poverty’, in:M. Gregory et al. (eds.),Labour Market Inequalities: Problems and Policies of Low-wage Employment in InternationalPerspective, Oxford: Oxford University Press.
OECD (1998), Employment Outlook, Paris: Organisation for Economic Co-operation andDevelopment.
OECD (2004), Employment Outlook, Paris: Organisation for Economic Co-operation andDevelopment.
OECD (2009), Employment Outlook, Paris: Organisation for Economic Co-operation andDevelopment.
OECD (2010), Employment Outlook, Paris: Organisation for Economic Co-operation andDevelopment.
Palier, B. (2010), The Politics of Reform in Bismarckian Welfare States, Amsterdam: AmsterdamUniversity Press.
Streeck, W. (2009), Reforming Capitalism: Institutional Change in the German Political Economy,Oxford: Oxford University Press.
Sutherland, H. (2001), The National Minimum Wage and In-Work Poverty, DAE Working PapersMU0102, Cambridge: University of Cambridge.
Vaughan-Whitehead, D. (2010), The Minimum Wage Revisited in the Enlarged EU, Cheltenham:Edward Elgar.
Verbist, G. (2003), ‘MISIM, een microsimulatiemodel voor personenbelasting en socialezekerheid’, Maandschrift Economie, 67, 451–73.