Embed Size (px)
Citation preview
lable at ScienceDirect
Journal of Structural Geology 32 (2010) 1834–1849
Contents lists avai
Journal of Structural Geology
journal homepage: www.elsevier .com/locate/ jsg
Clay smear in normal fault zones – The effect of multilayers and clay cementationin water-saturated model experiments
J. Schmatz a,*, P.J. Vrolijk b, J.L. Urai a
a Structural Geology, Tectonics and Geomechanics, Geological Institute, RWTH Aachen University, Lochnerstrasse 4-20, 52056 Aachen, Germanyb ExxonMobil Upstream Research Co., P.O. Box 2189, Houston, TX, USA
a r t i c l e i n f o
Article history:Received 29 April 2009Received in revised form10 December 2009Accepted 13 December 2009Available online 4 January 2010
Keywords:Clay smearFault sealMechanical layeringCompetence contrastExperimental model
* Corresponding author. Fax: þ49 80 92358.E-mail addresses: [email protected]
exxonmobil.com (P.J. Vrolijk), [email protected]
0191-8141/$ – see front matter � 2009 Elsevier Ltd.doi:10.1016/j.jsg.2009.12.006
a b s t r a c t
We studied the evolution of fault zones in water-saturated model experiments consisting of sand andclay layers above a normal fault dipping 70� in a stiff basal layer. The model is bounded below by a rigidmetal basement with a pre-cut 70� fault and above by a metal plate, also with a 70� cut, aligned in thesame plane as the basement fault. Quantitative analysis of particle displacements was undertaken withPIV (Particle Image Velocimetry) software. In these models, the structure of initial localized deformationevolves into a kinematically favorable fault zone. This evolution, which produces releasing or restrainingrelays across the clay layer, has a major role in controlling fault-zone structure. We show that a highcompetence contrast between sand and clay leads to a more complex fault zone due to the formation ofsecondary shear zones and segmentation-induced fault lenses. A high competence contrast alsopromotes a more complex temporal evolution of those shear zones. Weak clay layers are preferentiallyenriched in fault zones, whereas strong, brittle clay initially fractures and forms clay boudins that rotatein the deforming sand. With progressive deformation these boudins are abraded and transformed intoa soft-clay gouge. Thin, weak clays deform continuously over large displacements, and the volume ofclay-rich gouge increases as sand mixes into clay at the margins of the shear zone. Thus, we observea wide range of fault zone and fault gouge evolution by adjusting the mechanical properties of the clay.Further physical insights into fault processes like those reached here may yield predictive models offault-zone evolution that will transcend empirical methods (e.g., shale-gouge ratio, SGR).
� 2009 Elsevier Ltd. All rights reserved.
1. Introduction
Fault networks have a major effect on hydromechanical processesin sedimentary basins. We have a basic understanding of the basicphysical processes of fault sealing, but the complex geometries andmany feedback processes make quantitative prediction difficult.Fault zones have been widely investigated in field studies, experi-mental models and numerical simulations to better understandtheir transport and sealing properties (e.g., Weber et al., 1978; Leh-ner and Pilaar, 1991, 1997; Antonellini et al., 1994; Fulljames et al.,1997; Clausen and Gabrielsen, 2002; James et al., 2004; Egholm et al.,2008; Mair and Abe, 2008; Urai et al., 2008).
Much of the research on faults in sand–clay sequences is focusedon predicting the amount of clay incorporated into the fault gouge,commonly called clay smear. Clay smear, a loosely defined term usedin hydrocarbon geology, describes the processes in which clay from
(J. Schmatz), [email protected] (J.L. Urai).
All rights reserved.
the wall rock is incorporated in a fault zone (Yielding et al., 1997). Insubsurface studies, numerous statistical algorithms are used for claysmear analysis: clay-smear potential, shale-smear factor and shale-gouge ratio (Lindsay et al., 1993; Fristad et al., 1997; Fulljames et al.,1997; Yielding et al., 1997; Yielding, 2002). Most of these methodsare based on the assumption that fault gouge consists of a reworkedequivalent of the wall rocks offset by a fault (Holland et al., 2006)without the addition or removal of material (van Gent et al., in press).Because this method averages over the lithologic interval offset bythe fault, it fails to accurately predict the spatial distribution of clayalong the fault plane. In addition, the mechanical properties of therocks in the wall rock and fault zone are neglected. Clearly, a betterunderstanding of the processes involved during faulting wouldimprove the quality of fault-seal predictions.
When a segmented normal fault cuts heterogeneously layeredsequences with competence contrast, (e.g., clay and sand), the faultdevelops a steeper dip in layers with a higher friction angle anda shallower dip in layers with a lower friction angle (Peacock andSanderson, 1992). This results in vertically segmented faults withsteps at lithologic/competency boundaries (Childs et al., 1996).
a
b
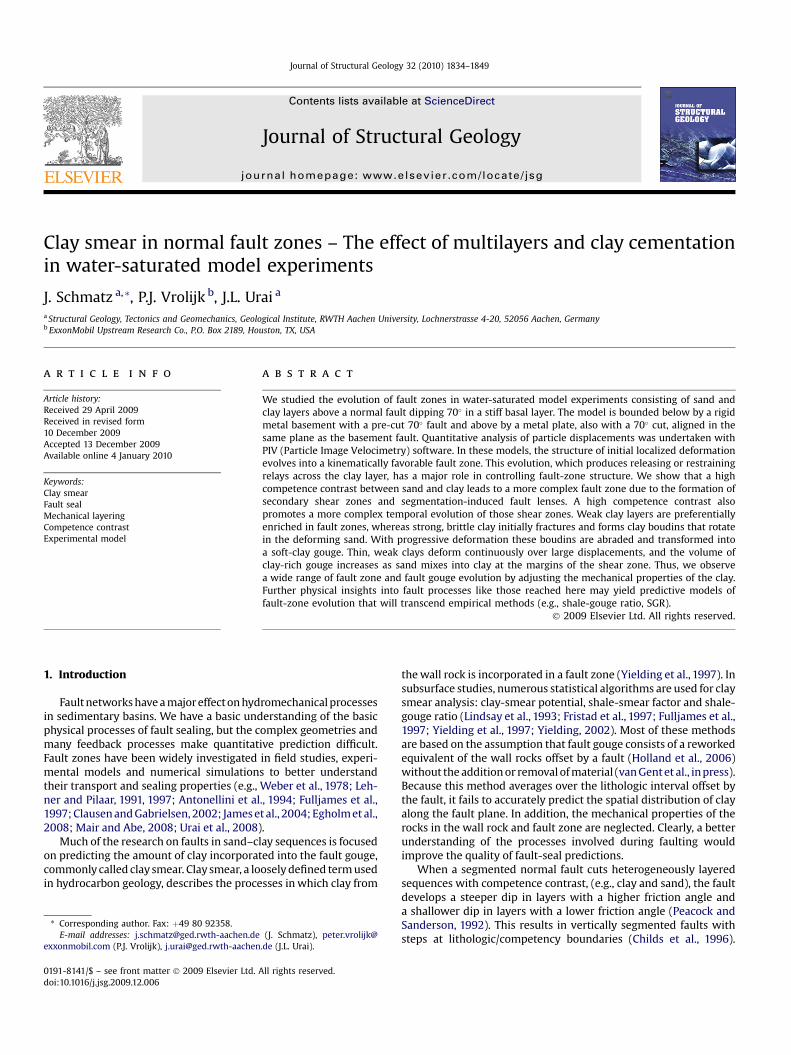
Fig. 1. (a) Sketch showing boundary conditions and fault evolution in an experimentwith a free surface. The steep precursor fault is shown with a dashed line. The faultrotates into its kinematically favored position (bold line). Compare to Schmatz et al.(2010). (b) Sketch showing boundary conditions and fault evolution in an experimentwith rigid top plates. Two precursor faults develop, initiating at the tip of the faults inthe basement and top plates. With progressive deformation, the zone of deformationmigrates into the center of the model (bold line).
J. Schmatz et al. / Journal of Structural Geology 32 (2010) 1834–1849 1835
Other authors (e.g., Lehner and Pilaar, 1997; Van der Zee et al.,2003) postulated that ‘‘clay injection’’ is able to enrich the faultwith clay over the amount expected by lithologic offset. The clayinjection mechanism proposed by Lehner and Pilaar (1997)contains two essential elements: (1) a pull-apart structure formswhen the fault crosses a clay layer. (2) The clay bed is injected intothis pull-apart structure and subsequently sheared to form a thickclay gouge. The injection process requires significantly weaker claythan the surrounding sand layers (Van der Zee et al., 2003). vanGent et al. (in press) describe a fundamentally different process ofclay enrichment, which involves the vertical transport of clay alongdilatant fractures in brittle carbonates.
Experiments by Sperrevik et al. (2000) and Clausen and Gabri-elsen (2002) showed a strong dependency of clay smear on themechanical properties of the materials. They used a ring-shearapparatus to deform clay and sand layers to high strains at variablenormal stresses. They observed pronounced clay smear withincreasing stresses and decreasing clay strength. In a preliminaryset of experiments of layered sand–clay sequences, Schmatz et al.(2010) varied the clay-layer proportions, clay-layer thickness andspacing, and clay composition; normal faulting created continuoussmear in weak, under-consolidated clay; in contrast, a strong, over-consolidated clay first deforms in a brittle mode and then some-times becomes reworked to form a soft-clay gouge. Here wepresent the results of water-saturated experiments with the addedboundary condition of a strong top layer containing a pre-cut faultin a kinematically favorable orientation to the basement fault, andinvestigate the effect of different multilayer configurations and claycementation on the structure of the evolving fault zone.
In experiments with a free top surface, deformation is less local-ized at the top of the model (Fig.1). Pilot experiments (Schmatz et al.,2010) show that a top plate and basement fault acting together formtwo precursor faults: one initiating at the tip of the basement fault,and one at the tip of the fault in the top plate (cf. quadshear, Welchet al., 2009). With progressive deformation they link up across themodel to form a kinematically favored zone of deformation.
2. Methods
2.1. Setup
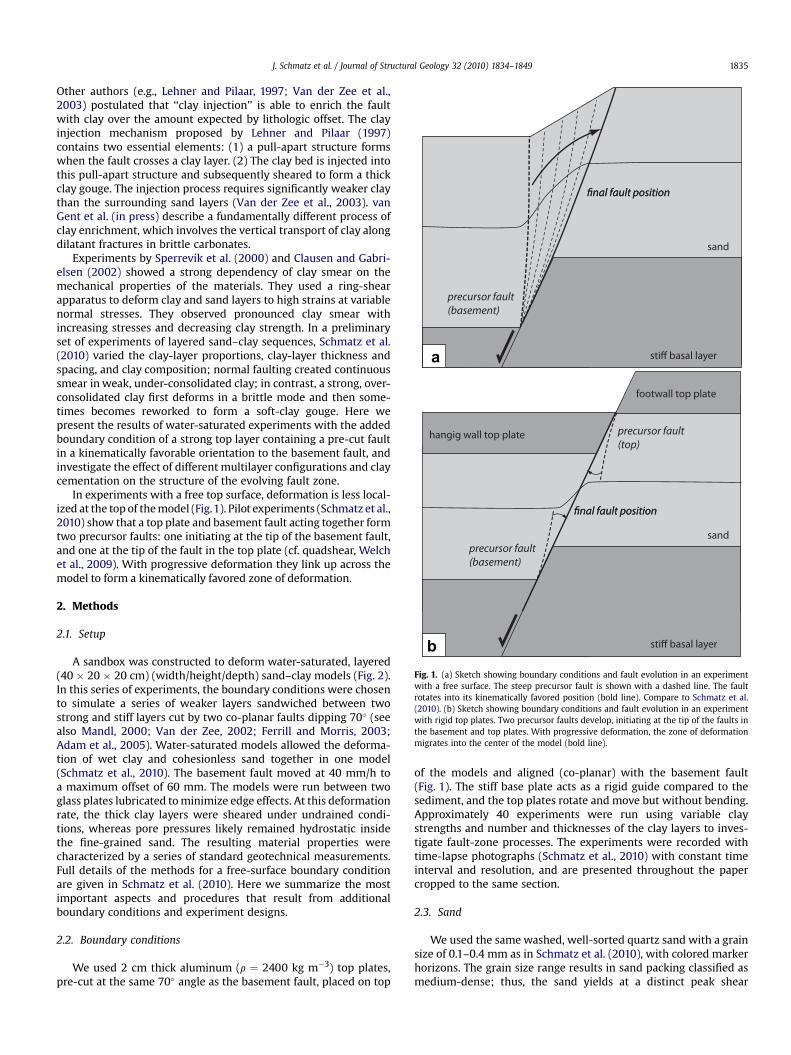
A sandbox was constructed to deform water-saturated, layered(40 � 20 � 20 cm) (width/height/depth) sand–clay models (Fig. 2).In this series of experiments, the boundary conditions were chosento simulate a series of weaker layers sandwiched between twostrong and stiff layers cut by two co-planar faults dipping 70� (seealso Mandl, 2000; Van der Zee, 2002; Ferrill and Morris, 2003;Adam et al., 2005). Water-saturated models allowed the deforma-tion of wet clay and cohesionless sand together in one model(Schmatz et al., 2010). The basement fault moved at 40 mm/h toa maximum offset of 60 mm. The models were run between twoglass plates lubricated to minimize edge effects. At this deformationrate, the thick clay layers were sheared under undrained condi-tions, whereas pore pressures likely remained hydrostatic insidethe fine-grained sand. The resulting material properties werecharacterized by a series of standard geotechnical measurements.Full details of the methods for a free-surface boundary conditionare given in Schmatz et al. (2010). Here we summarize the mostimportant aspects and procedures that result from additionalboundary conditions and experiment designs.
2.2. Boundary conditions
We used 2 cm thick aluminum (r ¼ 2400 kg m�3) top plates,pre-cut at the same 70� angle as the basement fault, placed on top
of the models and aligned (co-planar) with the basement fault(Fig. 1). The stiff base plate acts as a rigid guide compared to thesediment, and the top plates rotate and move but without bending.Approximately 40 experiments were run using variable claystrengths and number and thicknesses of the clay layers to inves-tigate fault-zone processes. The experiments were recorded withtime-lapse photographs (Schmatz et al., 2010) with constant timeinterval and resolution, and are presented throughout the papercropped to the same section.
2.3. Sand
We used the same washed, well-sorted quartz sand with a grainsize of 0.1–0.4 mm as in Schmatz et al. (2010), with colored markerhorizons. The grain size range results in sand packing classified asmedium-dense; thus, the sand yields at a distinct peak shear
a
b
Fig. 2. (a) Sketch of the underwater experimental apparatus with: 1) water-saturatedapparatus (inside), 2) waterproof container (outside), 3) rigid basement bottom withdrain perforation, 4) motor-driven fault offset, 5) basement fault dipping 70� , 6)movable glass plate (inside), 7) movable glass plate (outside). (b) Sketch of setupshowing alternating layers of sand and clay overlying stiff basal block, covered withpre-cut aluminum top plates. Red area indicates kinematically favored position of thefault. (For interpretation of the references to colour in this figure legend, the reader isreferred to the web version of this article.)
J. Schmatz et al. / Journal of Structural Geology 32 (2010) 1834–18491836
strength and forms a localized shear band in the experimentalmodel.
2.4. Clay
The clay is a quartz (46.8%)–kaolinite (42.0%) mixture withwater contents of w30, 40 and 50 wt.%, representing over-consol-idated (firm), normal-consolidated (normal) and under-consoli-dated (soft) clay, respectively. Direct shear tests indicate a ten timeshigher undrained shear strength for firm clay than for soft clay(Schmatz et al., 2010). In some experiments, small amounts (0.25–10 wt.%) of Portland cement were added to the soft clay. Thecement hardened (while water-saturated) the clay in w17 h.Geotechnical measurements show undrained shear strength witha linear increase from 2.6 kPa (1.0 wt.% cement) to 27 kPa (5.0 wt.%cement). By comparison, firm but uncemented clay has a shearstrength of w2.4 kPa. To ensure that the cemented clay wascompletely cured, most of the models were left overnight beforestarting the deformation experiment.
2.5. Particle image velocimetry (PIV)
Time-lapse series of high-resolution digital images were pro-cessed into movies and analyzed using PIV (e.g., Wolf et al., 2003;Adam et al., 2005; Steingart and Evans, 2005; Holland et al., 2006; vanGent et al., in press). The PIV analysis documents displacements ofa granular structure on the particle scale and gives detailed velocityfields. The resolution is given by an interrogation window size of 128� 128 pixels decreasing to a window of 32� 32 pixels with an overlap
of 75% producing a final window size of 8 � 8 pixels, which corre-sponds to approximately 16 sand grains in our experiments (Adamet al., 2005; Schmatz et al., 2010). Movies of all experiments areavailable at www.ged.rwth-aachen.de.
3. Experimental results
In this study we undertook nine systematic experimental series.Parameters studied include: clay strength, layer thickness, and thenumber of layers. To allow comparison with experiments withouttop plates, we repeated a number of earlier experiments both withand without the top plate. The full series of experiments issummarized in Table 1. Here we describe a number of these in detail(Figs. 3–16). To check the reproducibility of the experiments, one ofthe experiments presented here (R-2-s-tp, Fig. 7, Table 1) wasrepeated four times under identical conditions. We reproducemany first-order fault structures in these repeat experiments, butsometimes small variations arise.
3.1. Effect of top plates
Counterclockwise rotation of the hanging wall top plate up to1.8� was observed in most of the experiments. Measurements ofrotation show no correlation to the clay setup, clay type or layerthickness.
3.1.1. Sand onlyOur reference experiment is a water-saturated, sand-only model
(Fig. 3, Table 1, experiment P-1) with a base area of 40 � 20 cm and15 cm high, with free surface, comparable to the boundary condi-tion used in Horsfield (1977) and also discussed in Adam et al.(2005). Initial displacement along the basement fault createsa ‘precursor’ fault (Mandl, 2000) which migrates through thematerial into a kinematically favorable position forming a trian-gular shear zone (e.g., Erslev, 1991; Zehnder and Allmendinger,2000; Cardozo et al., 2003; Fig. 3a and b). PIV visualization of theincremental strain field eyx (Fig. 3b) shows the migration of locali-zation through the material and formation of a stable planardeformation zone at a displacement of w14�mm. Adding the pre-cut aluminum plates produces significantly different results (Fig. 4,Table 1, experiment P-2-tp). A precursor fault initiates from thebasement fault tip, dipping at approximately 45� in the direction ofthe hanging wall. Almost immediately after 2 mm displacement onthe basement fault, deformation is also localized at the base of thefault between the top plates, propagating downwards. Withprogressive deformation these two zones interact, the precursorfault becomes inactive, and deformation is localized in a stable,planar deformation zone in the plane of the basement fault.Localization is thus much more rapid than in the experiment witha free top surface (displacement of w7�mm).
3.1.2. Sand and clayAdding a 30 mm thick layer of firm clay to the model (Fig. 5,
Table 1, experiment N-9-f) has a major impact on the fault-zoneevolution. The experiment with a free surface is comparable to Figs.9 and 11 of Schmatz et al. (2010). Here the fault-zone evolution iscomplex. The steep precursor fault fails to propagate across the claylayer, which instead deforms by bending. Fractures initiate at theclay–sand interface at locations of high curvature and extension.With increasing deformation the layer breaks into fragments ofvarious sizes which then rotate and become reworked into a ductileclay gouge. The flow of sand grains along clay asperities is associ-ated with asperity abrasion and mixing of sand and clay. Secondaryfaults propagate from fractures in the clay across the sand. A stable,distinct planar fault plane fails to form for offset >30 mm (Fig. 5b).
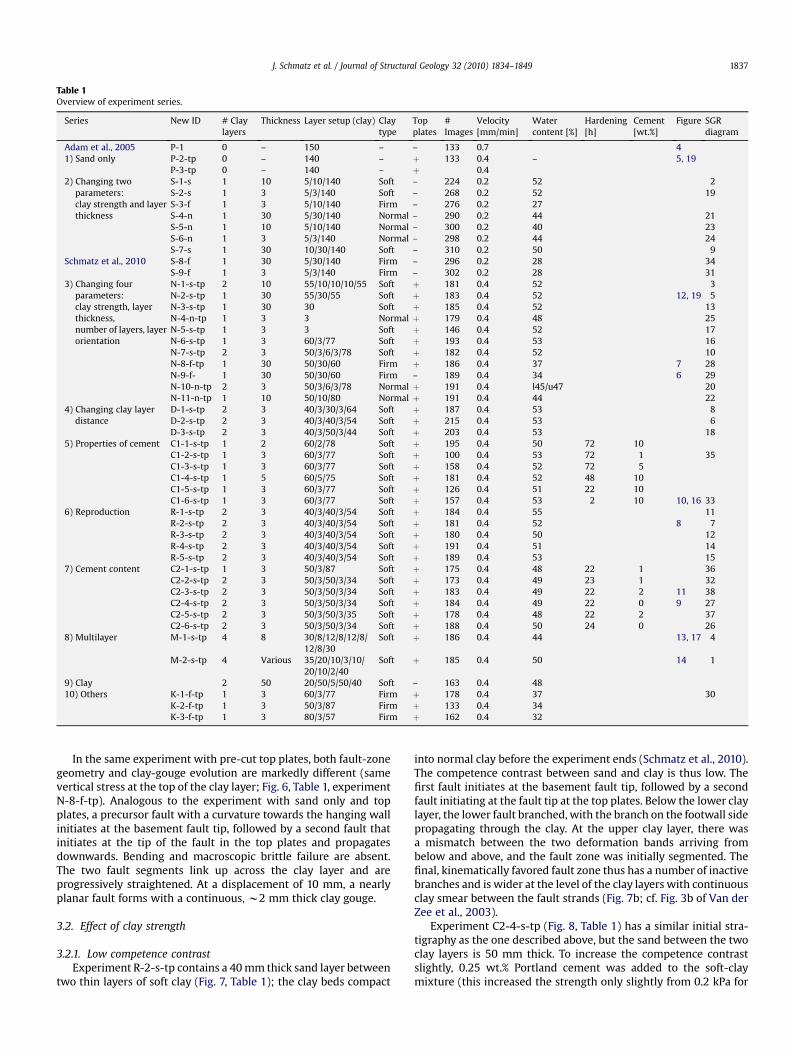
Table 1Overview of experiment series.
Series New ID # Claylayers
Thickness Layer setup (clay) Claytype
Topplates
#Images
Velocity[mm/min]
Watercontent [%]
Hardening[h]
Cement[wt.%]
Figure SGRdiagram
Adam et al., 2005 P-1 0 – 150 – – 133 0.7 41) Sand only P-2-tp 0 – 140 – þ 133 0.4 – 5, 19
P-3-tp 0 – 140 – þ 0.42) Changing two
parameters:clay strength and layerthickness
S-1-s 1 10 5/10/140 Soft – 224 0.2 52 2S-2-s 1 3 5/3/140 Soft – 268 0.2 52 19S-3-f 1 3 5/10/140 Firm – 276 0.2 27S-4-n 1 30 5/30/140 Normal – 290 0.2 44 21S-5-n 1 10 5/10/140 Normal – 300 0.2 40 23S-6-n 1 3 5/3/140 Normal – 298 0.2 44 24S-7-s 1 30 10/30/140 Soft – 310 0.2 50 9
Schmatz et al., 2010 S-8-f 1 30 5/30/140 Firm – 296 0.2 28 34S-9-f 1 3 5/3/140 Firm – 302 0.2 28 31
3) Changing fourparameters:clay strength, layerthickness,number of layers, layerorientation
N-1-s-tp 2 10 55/10/10/10/55 Soft þ 181 0.4 52 3N-2-s-tp 1 30 55/30/55 Soft þ 183 0.4 52 12, 19 5N-3-s-tp 1 30 30 Soft þ 185 0.4 52 13N-4-n-tp 1 3 3 Normal þ 179 0.4 48 25N-5-s-tp 1 3 3 Soft þ 146 0.4 52 17N-6-s-tp 1 3 60/3/77 Soft þ 193 0.4 53 16N-7-s-tp 2 3 50/3/6/3/78 Soft þ 182 0.4 52 10N-8-f-tp 1 30 50/30/60 Firm þ 186 0.4 37 7 28N-9-f- 1 30 50/30/60 Firm – 189 0.4 34 6 29N-10-n-tp 2 3 50/3/6/3/78 Normal þ 191 0.4 l45/u47 20N-11-n-tp 1 10 50/10/80 Normal þ 191 0.4 44 22
4) Changing clay layerdistance
D-1-s-tp 2 3 40/3/30/3/64 Soft þ 187 0.4 53 8D-2-s-tp 2 3 40/3/40/3/54 Soft þ 215 0.4 53 6D-3-s-tp 2 3 40/3/50/3/44 Soft þ 203 0.4 53 18
5) Properties of cement C1-1-s-tp 1 2 60/2/78 Soft þ 195 0.4 50 72 10C1-2-s-tp 1 3 60/3/77 Soft þ 100 0.4 53 72 1 35C1-3-s-tp 1 3 60/3/77 Soft þ 158 0.4 52 72 5C1-4-s-tp 1 5 60/5/75 Soft þ 181 0.4 52 48 10C1-5-s-tp 1 3 60/3/77 Soft þ 126 0.4 51 22 10C1-6-s-tp 1 3 60/3/77 Soft þ 157 0.4 53 2 10 10, 16 33
6) Reproduction R-1-s-tp 2 3 40/3/40/3/54 Soft þ 184 0.4 55 11R-2-s-tp 2 3 40/3/40/3/54 Soft þ 181 0.4 52 8 7R-3-s-tp 2 3 40/3/40/3/54 Soft þ 180 0.4 50 12R-4-s-tp 2 3 40/3/40/3/54 Soft þ 191 0.4 51 14R-5-s-tp 2 3 40/3/40/3/54 Soft þ 189 0.4 53 15
7) Cement content C2-1-s-tp 1 3 50/3/87 Soft þ 175 0.4 48 22 1 36C2-2-s-tp 2 3 50/3/50/3/34 Soft þ 173 0.4 49 23 1 32C2-3-s-tp 2 3 50/3/50/3/34 Soft þ 183 0.4 49 22 2 11 38C2-4-s-tp 2 3 50/3/50/3/34 Soft þ 184 0.4 49 22 0 9 27C2-5-s-tp 2 3 50/3/50/3/35 Soft þ 178 0.4 48 22 2 37C2-6-s-tp 2 3 50/3/50/3/34 Soft þ 188 0.4 50 24 0 26
8) Multilayer M-1-s-tp 4 8 30/8/12/8/12/8/12/8/30
Soft þ 186 0.4 44 13, 17 4
M-2-s-tp 4 Various 35/20/10/3/10/20/10/2/40
Soft þ 185 0.4 50 14 1
9) Clay 2 50 20/50/5/50/40 Soft – 163 0.4 4810) Others K-1-f-tp 1 3 60/3/77 Firm þ 178 0.4 37 30
K-2-f-tp 1 3 50/3/87 Firm þ 133 0.4 34K-3-f-tp 1 3 80/3/57 Firm þ 162 0.4 32
J. Schmatz et al. / Journal of Structural Geology 32 (2010) 1834–1849 1837
In the same experiment with pre-cut top plates, both fault-zonegeometry and clay-gouge evolution are markedly different (samevertical stress at the top of the clay layer; Fig. 6, Table 1, experimentN-8-f-tp). Analogous to the experiment with sand only and topplates, a precursor fault with a curvature towards the hanging wallinitiates at the basement fault tip, followed by a second fault thatinitiates at the tip of the fault in the top plates and propagatesdownwards. Bending and macroscopic brittle failure are absent.The two fault segments link up across the clay layer and areprogressively straightened. At a displacement of 10 mm, a nearlyplanar fault forms with a continuous, w2 mm thick clay gouge.
3.2. Effect of clay strength
3.2.1. Low competence contrastExperiment R-2-s-tp contains a 40 mm thick sand layer between
two thin layers of soft clay (Fig. 7, Table 1); the clay beds compact
into normal clay before the experiment ends (Schmatz et al., 2010).The competence contrast between sand and clay is thus low. Thefirst fault initiates at the basement fault tip, followed by a secondfault initiating at the fault tip at the top plates. Below the lower claylayer, the lower fault branched, with the branch on the footwall sidepropagating through the clay. At the upper clay layer, there wasa mismatch between the two deformation bands arriving frombelow and above, and the fault zone was initially segmented. Thefinal, kinematically favored fault zone thus has a number of inactivebranches and is wider at the level of the clay layers with continuousclay smear between the fault strands (Fig. 7b; cf. Fig. 3b of Van derZee et al., 2003).
Experiment C2-4-s-tp (Fig. 8, Table 1) has a similar initial stra-tigraphy as the one described above, but the sand between the twoclay layers is 50 mm thick. To increase the competence contrastslightly, 0.25 wt.% Portland cement was added to the soft-claymixture (this increased the strength only slightly from 0.2 kPa for
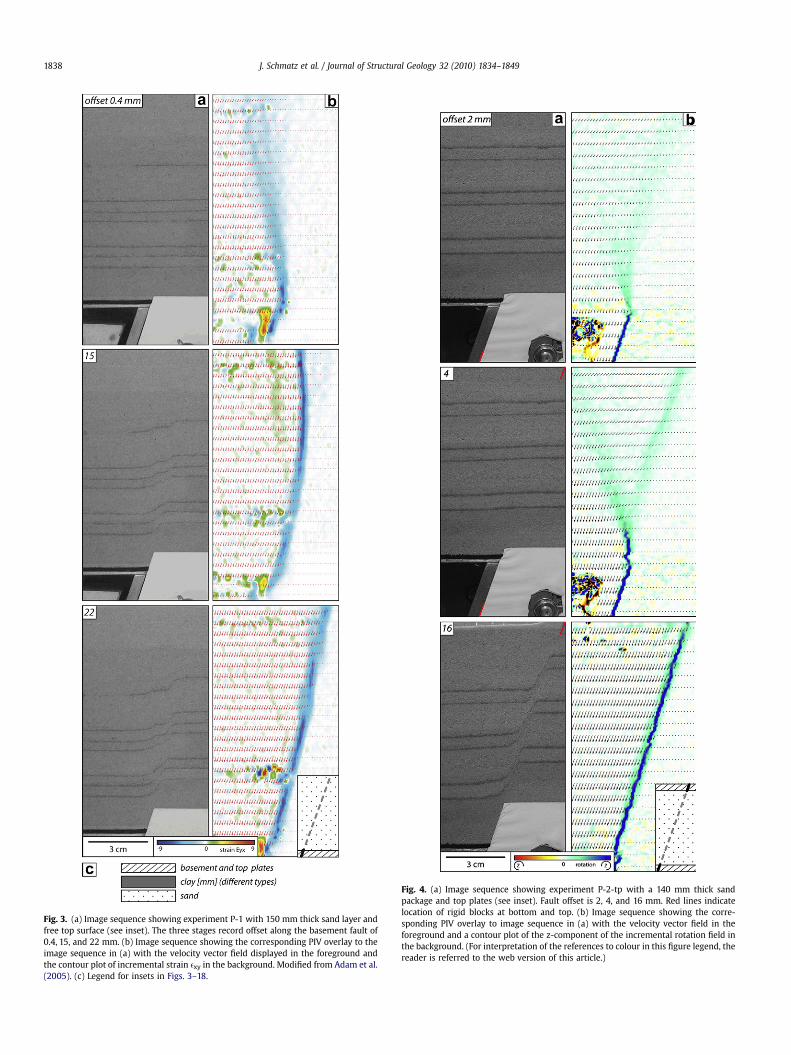
Fig. 3. (a) Image sequence showing experiment P-1 with 150 mm thick sand layer andfree top surface (see inset). The three stages record offset along the basement fault of0.4, 15, and 22 mm. (b) Image sequence showing the corresponding PIV overlay to theimage sequence in (a) with the velocity vector field displayed in the foreground andthe contour plot of incremental strain exy in the background. Modified from Adam et al.(2005). (c) Legend for insets in Figs. 3–18.
Fig. 4. (a) Image sequence showing experiment P-2-tp with a 140 mm thick sandpackage and top plates (see inset). Fault offset is 2, 4, and 16 mm. Red lines indicatelocation of rigid blocks at bottom and top. (b) Image sequence showing the corre-sponding PIV overlay to image sequence in (a) with the velocity vector field in theforeground and a contour plot of the z-component of the incremental rotation field inthe background. (For interpretation of the references to colour in this figure legend, thereader is referred to the web version of this article.)
J. Schmatz et al. / Journal of Structural Geology 32 (2010) 1834–18491838
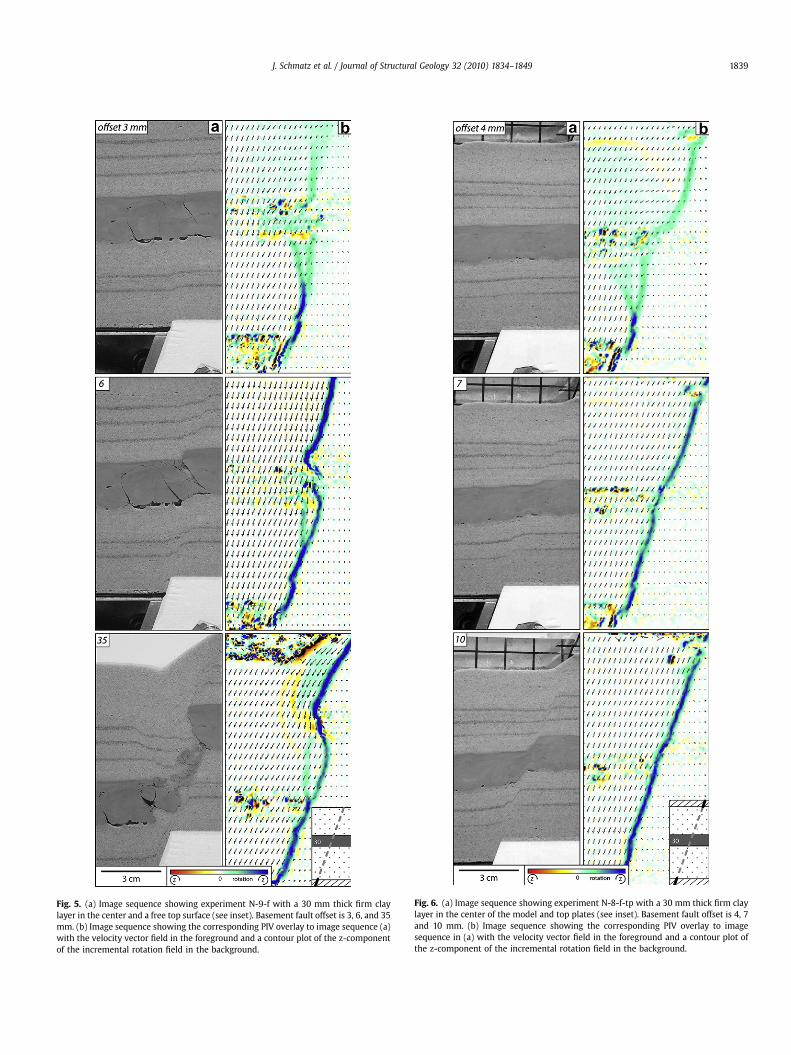
Fig. 5. (a) Image sequence showing experiment N-9-f with a 30 mm thick firm claylayer in the center and a free top surface (see inset). Basement fault offset is 3, 6, and 35mm. (b) Image sequence showing the corresponding PIV overlay to image sequence (a)with the velocity vector field in the foreground and a contour plot of the z-componentof the incremental rotation field in the background.
Fig. 6. (a) Image sequence showing experiment N-8-f-tp with a 30 mm thick firm claylayer in the center of the model and top plates (see inset). Basement fault offset is 4, 7and 10 mm. (b) Image sequence showing the corresponding PIV overlay to imagesequence in (a) with the velocity vector field in the foreground and a contour plot ofthe z-component of the incremental rotation field in the background.
J. Schmatz et al. / Journal of Structural Geology 32 (2010) 1834–1849 1839
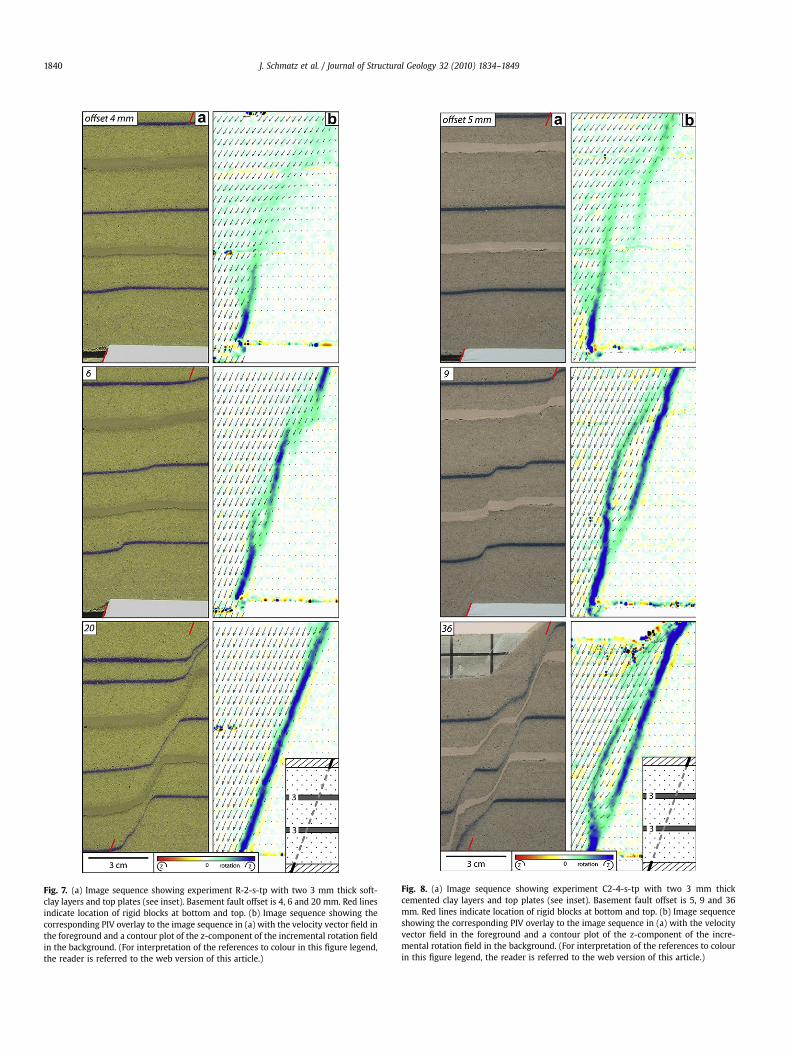
Fig. 7. (a) Image sequence showing experiment R-2-s-tp with two 3 mm thick soft-clay layers and top plates (see inset). Basement fault offset is 4, 6 and 20 mm. Red linesindicate location of rigid blocks at bottom and top. (b) Image sequence showing thecorresponding PIV overlay to the image sequence in (a) with the velocity vector field inthe foreground and a contour plot of the z-component of the incremental rotation fieldin the background. (For interpretation of the references to colour in this figure legend,the reader is referred to the web version of this article.)
Fig. 8. (a) Image sequence showing experiment C2-4-s-tp with two 3 mm thickcemented clay layers and top plates (see inset). Basement fault offset is 5, 9 and 36mm. Red lines indicate location of rigid blocks at bottom and top. (b) Image sequenceshowing the corresponding PIV overlay to the image sequence in (a) with the velocityvector field in the foreground and a contour plot of the z-component of the incre-mental rotation field in the background. (For interpretation of the references to colourin this figure legend, the reader is referred to the web version of this article.)
J. Schmatz et al. / Journal of Structural Geology 32 (2010) 1834–18491840
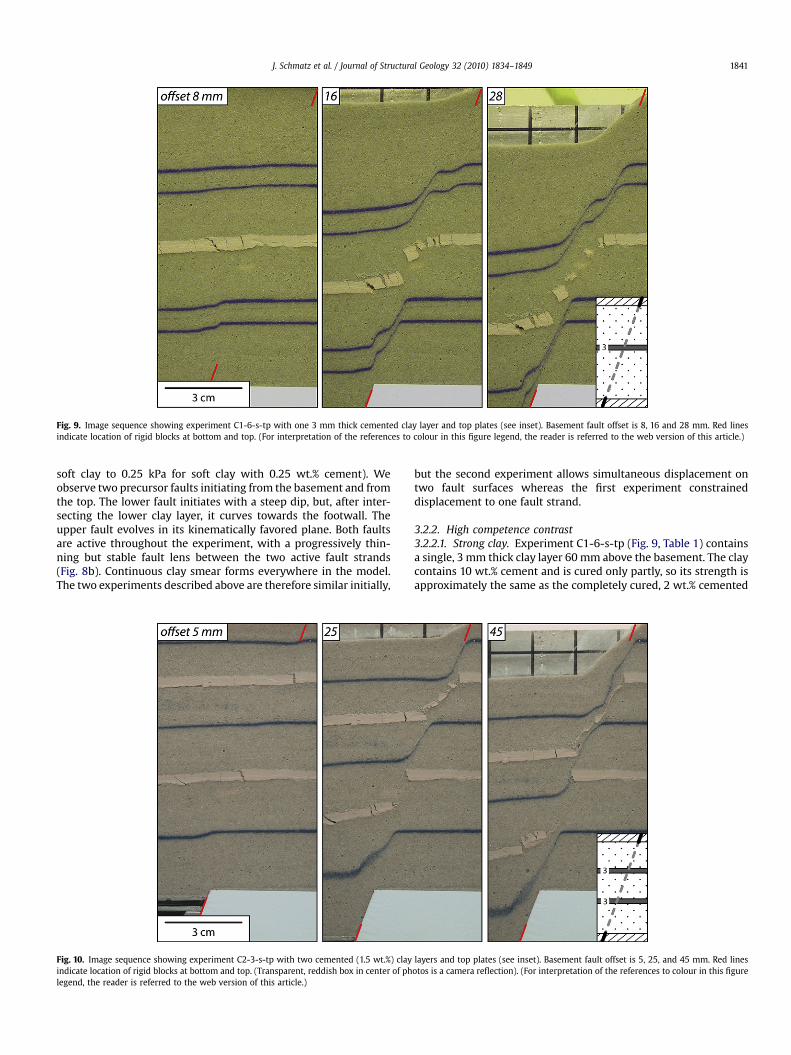
Fig. 9. Image sequence showing experiment C1-6-s-tp with one 3 mm thick cemented clay layer and top plates (see inset). Basement fault offset is 8, 16 and 28 mm. Red linesindicate location of rigid blocks at bottom and top. (For interpretation of the references to colour in this figure legend, the reader is referred to the web version of this article.)
J. Schmatz et al. / Journal of Structural Geology 32 (2010) 1834–1849 1841
soft clay to 0.25 kPa for soft clay with 0.25 wt.% cement). Weobserve two precursor faults initiating from the basement and fromthe top. The lower fault initiates with a steep dip, but, after inter-secting the lower clay layer, it curves towards the footwall. Theupper fault evolves in its kinematically favored plane. Both faultsare active throughout the experiment, with a progressively thin-ning but stable fault lens between the two active fault strands(Fig. 8b). Continuous clay smear forms everywhere in the model.The two experiments described above are therefore similar initially,
Fig. 10. Image sequence showing experiment C2-3-s-tp with two cemented (1.5 wt.%) clayindicate location of rigid blocks at bottom and top. (Transparent, reddish box in center of phlegend, the reader is referred to the web version of this article.)
but the second experiment allows simultaneous displacement ontwo fault surfaces whereas the first experiment constraineddisplacement to one fault strand.
3.2.2. High competence contrast3.2.2.1. Strong clay. Experiment C1-6-s-tp (Fig. 9, Table 1) containsa single, 3 mm thick clay layer 60 mm above the basement. The claycontains 10 wt.% cement and is cured only partly, so its strength isapproximately the same as the completely cured, 2 wt.% cemented
layers and top plates (see inset). Basement fault offset is 5, 25, and 45 mm. Red linesotos is a camera reflection). (For interpretation of the references to colour in this figure
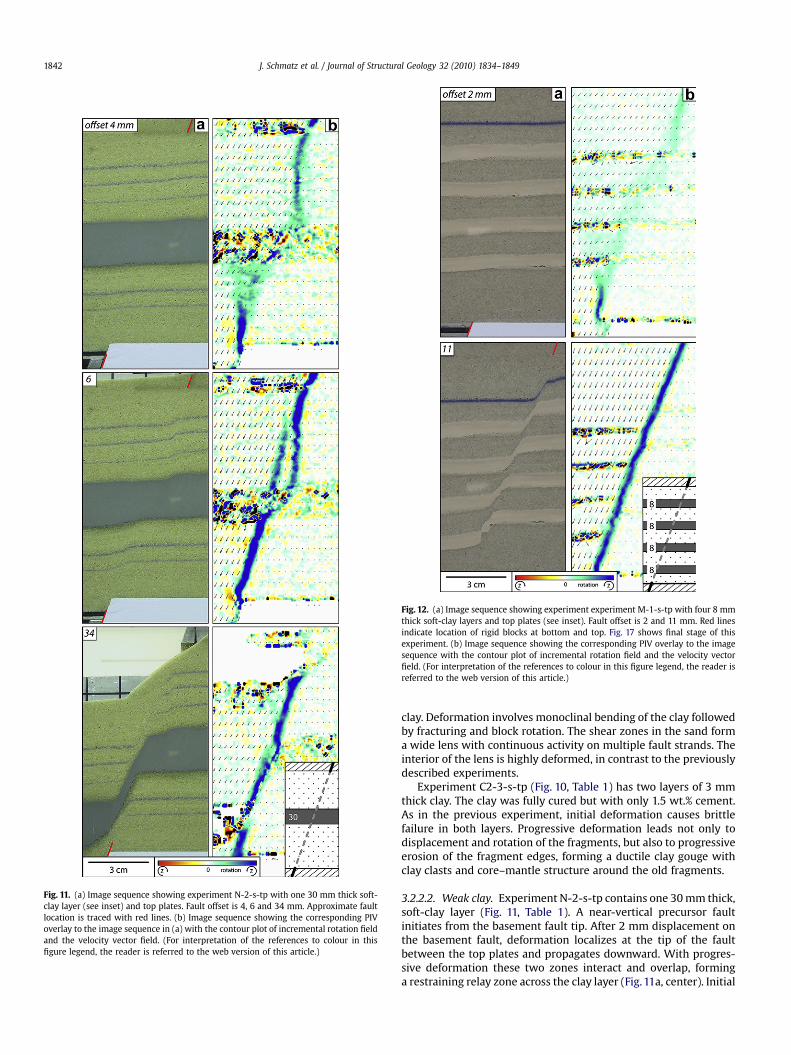
Fig. 11. (a) Image sequence showing experiment N-2-s-tp with one 30 mm thick soft-clay layer (see inset) and top plates. Fault offset is 4, 6 and 34 mm. Approximate faultlocation is traced with red lines. (b) Image sequence showing the corresponding PIVoverlay to the image sequence in (a) with the contour plot of incremental rotation fieldand the velocity vector field. (For interpretation of the references to colour in thisfigure legend, the reader is referred to the web version of this article.)
Fig. 12. (a) Image sequence showing experiment experiment M-1-s-tp with four 8 mmthick soft-clay layers and top plates (see inset). Fault offset is 2 and 11 mm. Red linesindicate location of rigid blocks at bottom and top. Fig. 17 shows final stage of thisexperiment. (b) Image sequence showing the corresponding PIV overlay to the imagesequence with the contour plot of incremental rotation field and the velocity vectorfield. (For interpretation of the references to colour in this figure legend, the reader isreferred to the web version of this article.)
J. Schmatz et al. / Journal of Structural Geology 32 (2010) 1834–18491842
clay. Deformation involves monoclinal bending of the clay followedby fracturing and block rotation. The shear zones in the sand forma wide lens with continuous activity on multiple fault strands. Theinterior of the lens is highly deformed, in contrast to the previouslydescribed experiments.
Experiment C2-3-s-tp (Fig. 10, Table 1) has two layers of 3 mmthick clay. The clay was fully cured but with only 1.5 wt.% cement.As in the previous experiment, initial deformation causes brittlefailure in both layers. Progressive deformation leads not only todisplacement and rotation of the fragments, but also to progressiveerosion of the fragment edges, forming a ductile clay gouge withclay clasts and core–mantle structure around the old fragments.
3.2.2.2. Weak clay. Experiment N-2-s-tp contains one 30 mm thick,soft-clay layer (Fig. 11, Table 1). A near-vertical precursor faultinitiates from the basement fault tip. After 2 mm displacement onthe basement fault, deformation localizes at the tip of the faultbetween the top plates and propagates downward. With progres-sive deformation these two zones interact and overlap, forminga restraining relay zone across the clay layer (Fig. 11a, center). Initial
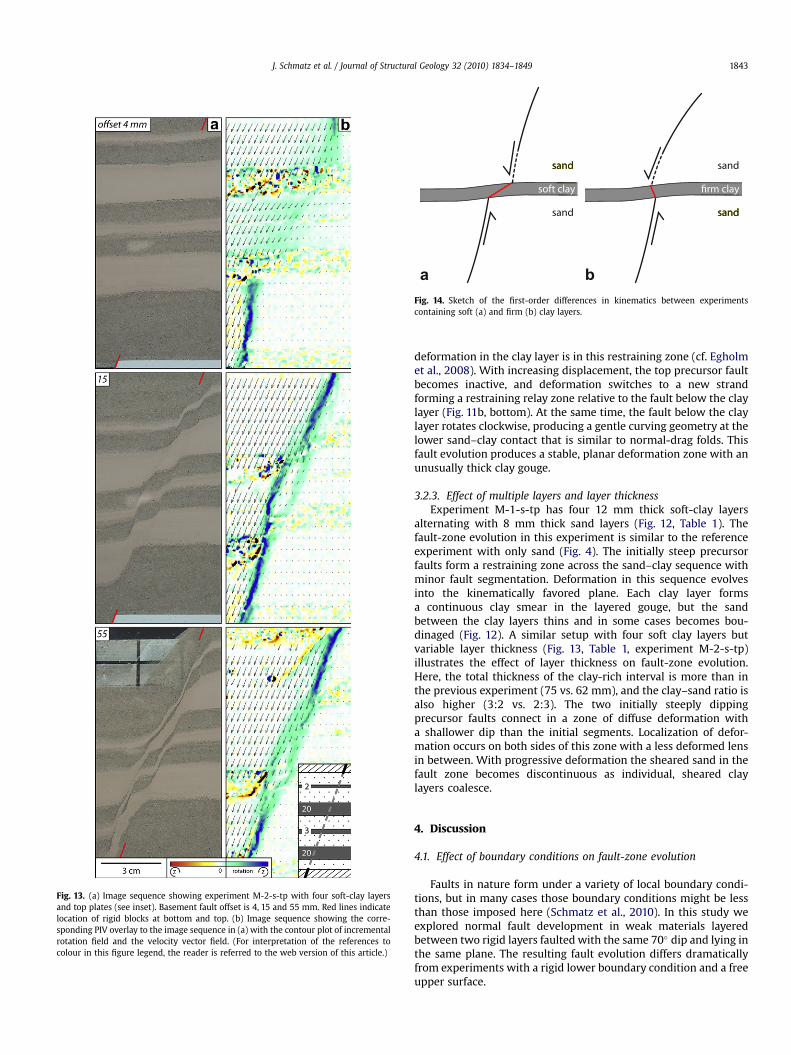
Fig. 13. (a) Image sequence showing experiment M-2-s-tp with four soft-clay layersand top plates (see inset). Basement fault offset is 4, 15 and 55 mm. Red lines indicatelocation of rigid blocks at bottom and top. (b) Image sequence showing the corre-sponding PIV overlay to the image sequence in (a) with the contour plot of incrementalrotation field and the velocity vector field. (For interpretation of the references tocolour in this figure legend, the reader is referred to the web version of this article.)
a b
Fig. 14. Sketch of the first-order differences in kinematics between experimentscontaining soft (a) and firm (b) clay layers.
J. Schmatz et al. / Journal of Structural Geology 32 (2010) 1834–1849 1843
deformation in the clay layer is in this restraining zone (cf. Egholmet al., 2008). With increasing displacement, the top precursor faultbecomes inactive, and deformation switches to a new strandforming a restraining relay zone relative to the fault below the claylayer (Fig. 11b, bottom). At the same time, the fault below the claylayer rotates clockwise, producing a gentle curving geometry at thelower sand–clay contact that is similar to normal-drag folds. Thisfault evolution produces a stable, planar deformation zone with anunusually thick clay gouge.
3.2.3. Effect of multiple layers and layer thicknessExperiment M-1-s-tp has four 12 mm thick soft-clay layers
alternating with 8 mm thick sand layers (Fig. 12, Table 1). Thefault-zone evolution in this experiment is similar to the referenceexperiment with only sand (Fig. 4). The initially steep precursorfaults form a restraining zone across the sand–clay sequence withminor fault segmentation. Deformation in this sequence evolvesinto the kinematically favored plane. Each clay layer formsa continuous clay smear in the layered gouge, but the sandbetween the clay layers thins and in some cases becomes bou-dinaged (Fig. 12). A similar setup with four soft clay layers butvariable layer thickness (Fig. 13, Table 1, experiment M-2-s-tp)illustrates the effect of layer thickness on fault-zone evolution.Here, the total thickness of the clay-rich interval is more than inthe previous experiment (75 vs. 62 mm), and the clay–sand ratio isalso higher (3:2 vs. 2:3). The two initially steeply dippingprecursor faults connect in a zone of diffuse deformation witha shallower dip than the initial segments. Localization of defor-mation occurs on both sides of this zone with a less deformed lensin between. With progressive deformation the sheared sand in thefault zone becomes discontinuous as individual, sheared claylayers coalesce.
4. Discussion
4.1. Effect of boundary conditions on fault-zone evolution
Faults in nature form under a variety of local boundary condi-tions, but in many cases those boundary conditions might be lessthan those imposed here (Schmatz et al., 2010). In this study weexplored normal fault development in weak materials layeredbetween two rigid layers faulted with the same 70� dip and lying inthe same plane. The resulting fault evolution differs dramaticallyfrom experiments with a rigid lower boundary condition and a freeupper surface.
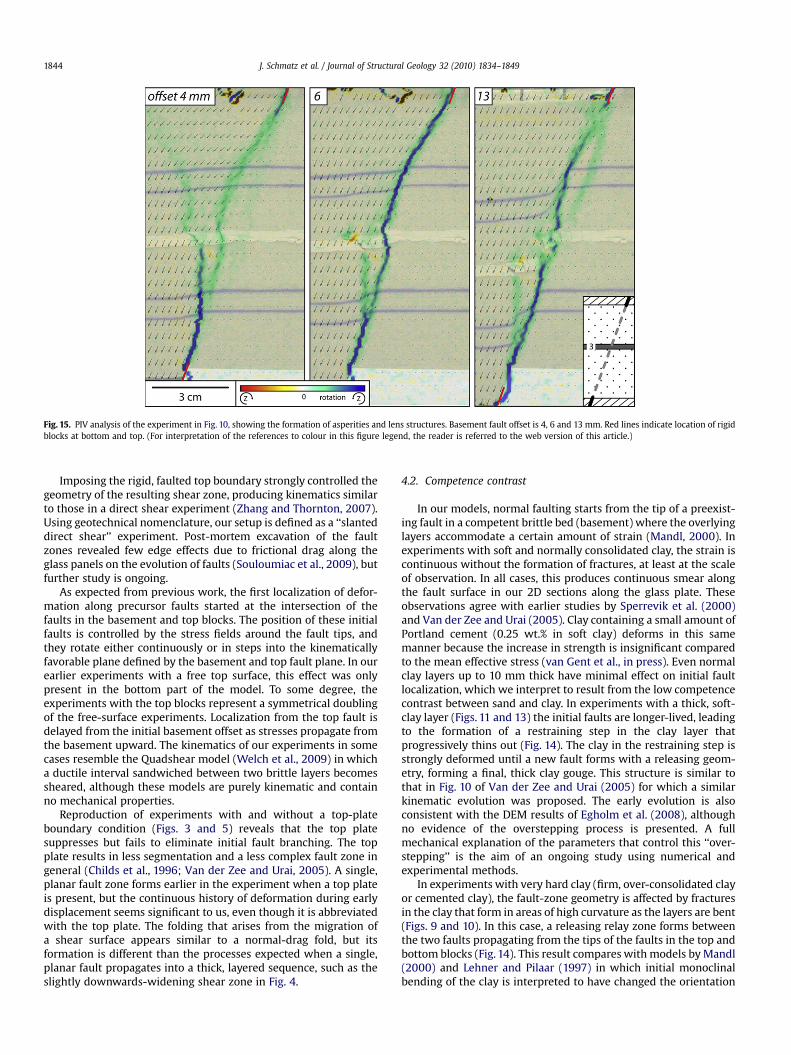
Fig. 15. PIV analysis of the experiment in Fig. 10, showing the formation of asperities and lens structures. Basement fault offset is 4, 6 and 13 mm. Red lines indicate location of rigidblocks at bottom and top. (For interpretation of the references to colour in this figure legend, the reader is referred to the web version of this article.)
J. Schmatz et al. / Journal of Structural Geology 32 (2010) 1834–18491844
Imposing the rigid, faulted top boundary strongly controlled thegeometry of the resulting shear zone, producing kinematics similarto those in a direct shear experiment (Zhang and Thornton, 2007).Using geotechnical nomenclature, our setup is defined as a ‘‘slanteddirect shear’’ experiment. Post-mortem excavation of the faultzones revealed few edge effects due to frictional drag along theglass panels on the evolution of faults (Souloumiac et al., 2009), butfurther study is ongoing.
As expected from previous work, the first localization of defor-mation along precursor faults started at the intersection of thefaults in the basement and top blocks. The position of these initialfaults is controlled by the stress fields around the fault tips, andthey rotate either continuously or in steps into the kinematicallyfavorable plane defined by the basement and top fault plane. In ourearlier experiments with a free top surface, this effect was onlypresent in the bottom part of the model. To some degree, theexperiments with the top blocks represent a symmetrical doublingof the free-surface experiments. Localization from the top fault isdelayed from the initial basement offset as stresses propagate fromthe basement upward. The kinematics of our experiments in somecases resemble the Quadshear model (Welch et al., 2009) in whicha ductile interval sandwiched between two brittle layers becomessheared, although these models are purely kinematic and containno mechanical properties.
Reproduction of experiments with and without a top-plateboundary condition (Figs. 3 and 5) reveals that the top platesuppresses but fails to eliminate initial fault branching. The topplate results in less segmentation and a less complex fault zone ingeneral (Childs et al., 1996; Van der Zee and Urai, 2005). A single,planar fault zone forms earlier in the experiment when a top plateis present, but the continuous history of deformation during earlydisplacement seems significant to us, even though it is abbreviatedwith the top plate. The folding that arises from the migration ofa shear surface appears similar to a normal-drag fold, but itsformation is different than the processes expected when a single,planar fault propagates into a thick, layered sequence, such as theslightly downwards-widening shear zone in Fig. 4.
4.2. Competence contrast
In our models, normal faulting starts from the tip of a preexist-ing fault in a competent brittle bed (basement) where the overlyinglayers accommodate a certain amount of strain (Mandl, 2000). Inexperiments with soft and normally consolidated clay, the strain iscontinuous without the formation of fractures, at least at the scaleof observation. In all cases, this produces continuous smear alongthe fault surface in our 2D sections along the glass plate. Theseobservations agree with earlier studies by Sperrevik et al. (2000)and Van der Zee and Urai (2005). Clay containing a small amount ofPortland cement (0.25 wt.% in soft clay) deforms in this samemanner because the increase in strength is insignificant comparedto the mean effective stress (van Gent et al., in press). Even normalclay layers up to 10 mm thick have minimal effect on initial faultlocalization, which we interpret to result from the low competencecontrast between sand and clay. In experiments with a thick, soft-clay layer (Figs. 11 and 13) the initial faults are longer-lived, leadingto the formation of a restraining step in the clay layer thatprogressively thins out (Fig. 14). The clay in the restraining step isstrongly deformed until a new fault forms with a releasing geom-etry, forming a final, thick clay gouge. This structure is similar tothat in Fig. 10 of Van der Zee and Urai (2005) for which a similarkinematic evolution was proposed. The early evolution is alsoconsistent with the DEM results of Egholm et al. (2008), althoughno evidence of the overstepping process is presented. A fullmechanical explanation of the parameters that control this ‘‘over-stepping’’ is the aim of an ongoing study using numerical andexperimental methods.
In experiments with very hard clay (firm, over-consolidated clayor cemented clay), the fault-zone geometry is affected by fracturesin the clay that form in areas of high curvature as the layers are bent(Figs. 9 and 10). In this case, a releasing relay zone forms betweenthe two faults propagating from the tips of the faults in the top andbottom blocks (Fig. 14). This result compares with models by Mandl(2000) and Lehner and Pilaar (1997) in which initial monoclinalbending of the clay is interpreted to have changed the orientation
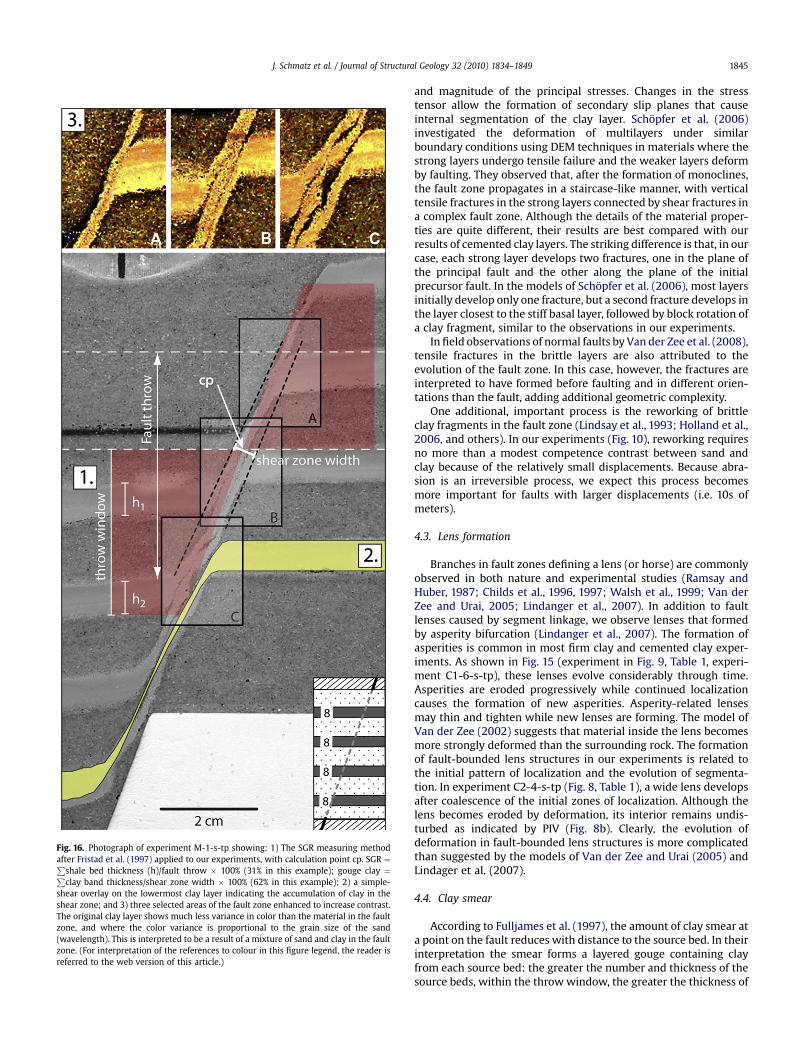
Fig. 16. Photograph of experiment M-1-s-tp showing: 1) The SGR measuring methodafter Fristad et al. (1997) applied to our experiments, with calculation point cp. SGR ¼P
shale bed thickness (h)/fault throw � 100% (31% in this example); gouge clay ¼P
clay band thickness/shear zone width � 100% (62% in this example); 2) a simple-shear overlay on the lowermost clay layer indicating the accumulation of clay in theshear zone; and 3) three selected areas of the fault zone enhanced to increase contrast.The original clay layer shows much less variance in color than the material in the faultzone, and where the color variance is proportional to the grain size of the sand(wavelength). This is interpreted to be a result of a mixture of sand and clay in the faultzone. (For interpretation of the references to colour in this figure legend, the reader isreferred to the web version of this article.)
J. Schmatz et al. / Journal of Structural Geology 32 (2010) 1834–1849 1845
and magnitude of the principal stresses. Changes in the stresstensor allow the formation of secondary slip planes that causeinternal segmentation of the clay layer. Schopfer et al. (2006)investigated the deformation of multilayers under similarboundary conditions using DEM techniques in materials where thestrong layers undergo tensile failure and the weaker layers deformby faulting. They observed that, after the formation of monoclines,the fault zone propagates in a staircase-like manner, with verticaltensile fractures in the strong layers connected by shear fractures ina complex fault zone. Although the details of the material proper-ties are quite different, their results are best compared with ourresults of cemented clay layers. The striking difference is that, in ourcase, each strong layer develops two fractures, one in the plane ofthe principal fault and the other along the plane of the initialprecursor fault. In the models of Schopfer et al. (2006), most layersinitially develop only one fracture, but a second fracture develops inthe layer closest to the stiff basal layer, followed by block rotation ofa clay fragment, similar to the observations in our experiments.
In field observations of normal faults by Van der Zee et al. (2008),tensile fractures in the brittle layers are also attributed to theevolution of the fault zone. In this case, however, the fractures areinterpreted to have formed before faulting and in different orien-tations than the fault, adding additional geometric complexity.
One additional, important process is the reworking of brittleclay fragments in the fault zone (Lindsay et al., 1993; Holland et al.,2006, and others). In our experiments (Fig. 10), reworking requiresno more than a modest competence contrast between sand andclay because of the relatively small displacements. Because abra-sion is an irreversible process, we expect this process becomesmore important for faults with larger displacements (i.e. 10s ofmeters).
4.3. Lens formation
Branches in fault zones defining a lens (or horse) are commonlyobserved in both nature and experimental studies (Ramsay andHuber, 1987; Childs et al., 1996, 1997; Walsh et al., 1999; Van derZee and Urai, 2005; Lindanger et al., 2007). In addition to faultlenses caused by segment linkage, we observe lenses that formedby asperity bifurcation (Lindanger et al., 2007). The formation ofasperities is common in most firm clay and cemented clay exper-iments. As shown in Fig. 15 (experiment in Fig. 9, Table 1, experi-ment C1-6-s-tp), these lenses evolve considerably through time.Asperities are eroded progressively while continued localizationcauses the formation of new asperities. Asperity-related lensesmay thin and tighten while new lenses are forming. The model ofVan der Zee (2002) suggests that material inside the lens becomesmore strongly deformed than the surrounding rock. The formationof fault-bounded lens structures in our experiments is related tothe initial pattern of localization and the evolution of segmenta-tion. In experiment C2-4-s-tp (Fig. 8, Table 1), a wide lens developsafter coalescence of the initial zones of localization. Although thelens becomes eroded by deformation, its interior remains undis-turbed as indicated by PIV (Fig. 8b). Clearly, the evolution ofdeformation in fault-bounded lens structures is more complicatedthan suggested by the models of Van der Zee and Urai (2005) andLindager et al. (2007).
4.4. Clay smear
According to Fulljames et al. (1997), the amount of clay smear ata point on the fault reduces with distance to the source bed. In theirinterpretation the smear forms a layered gouge containing clayfrom each source bed: the greater the number and thickness of thesource beds, within the throw window, the greater the thickness of
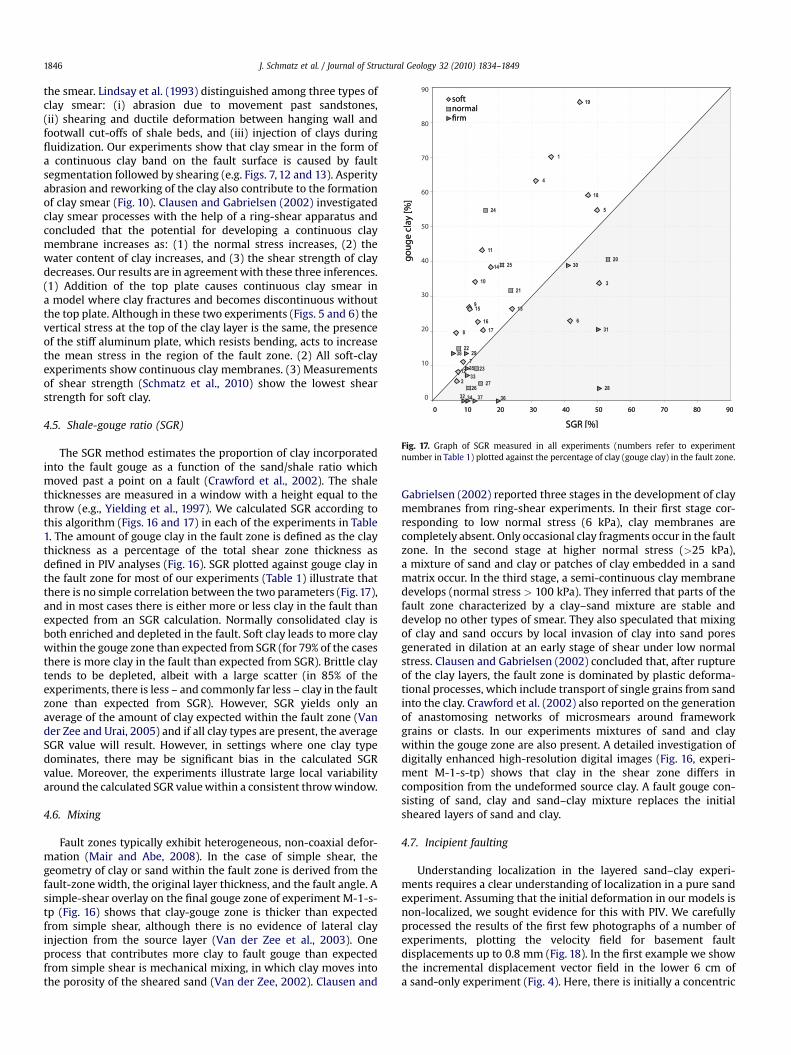
Fig. 17. Graph of SGR measured in all experiments (numbers refer to experimentnumber in Table 1) plotted against the percentage of clay (gouge clay) in the fault zone.
J. Schmatz et al. / Journal of Structural Geology 32 (2010) 1834–18491846
the smear. Lindsay et al. (1993) distinguished among three types ofclay smear: (i) abrasion due to movement past sandstones,(ii) shearing and ductile deformation between hanging wall andfootwall cut-offs of shale beds, and (iii) injection of clays duringfluidization. Our experiments show that clay smear in the form ofa continuous clay band on the fault surface is caused by faultsegmentation followed by shearing (e.g. Figs. 7, 12 and 13). Asperityabrasion and reworking of the clay also contribute to the formationof clay smear (Fig. 10). Clausen and Gabrielsen (2002) investigatedclay smear processes with the help of a ring-shear apparatus andconcluded that the potential for developing a continuous claymembrane increases as: (1) the normal stress increases, (2) thewater content of clay increases, and (3) the shear strength of claydecreases. Our results are in agreement with these three inferences.(1) Addition of the top plate causes continuous clay smear ina model where clay fractures and becomes discontinuous withoutthe top plate. Although in these two experiments (Figs. 5 and 6) thevertical stress at the top of the clay layer is the same, the presenceof the stiff aluminum plate, which resists bending, acts to increasethe mean stress in the region of the fault zone. (2) All soft-clayexperiments show continuous clay membranes. (3) Measurementsof shear strength (Schmatz et al., 2010) show the lowest shearstrength for soft clay.
4.5. Shale-gouge ratio (SGR)
The SGR method estimates the proportion of clay incorporatedinto the fault gouge as a function of the sand/shale ratio whichmoved past a point on a fault (Crawford et al., 2002). The shalethicknesses are measured in a window with a height equal to thethrow (e.g., Yielding et al., 1997). We calculated SGR according tothis algorithm (Figs. 16 and 17) in each of the experiments in Table1. The amount of gouge clay in the fault zone is defined as the claythickness as a percentage of the total shear zone thickness asdefined in PIV analyses (Fig. 16). SGR plotted against gouge clay inthe fault zone for most of our experiments (Table 1) illustrate thatthere is no simple correlation between the two parameters (Fig. 17),and in most cases there is either more or less clay in the fault thanexpected from an SGR calculation. Normally consolidated clay isboth enriched and depleted in the fault. Soft clay leads to more claywithin the gouge zone than expected from SGR (for 79% of the casesthere is more clay in the fault than expected from SGR). Brittle claytends to be depleted, albeit with a large scatter (in 85% of theexperiments, there is less – and commonly far less – clay in the faultzone than expected from SGR). However, SGR yields only anaverage of the amount of clay expected within the fault zone (Vander Zee and Urai, 2005) and if all clay types are present, the averageSGR value will result. However, in settings where one clay typedominates, there may be significant bias in the calculated SGRvalue. Moreover, the experiments illustrate large local variabilityaround the calculated SGR value within a consistent throw window.
4.6. Mixing
Fault zones typically exhibit heterogeneous, non-coaxial defor-mation (Mair and Abe, 2008). In the case of simple shear, thegeometry of clay or sand within the fault zone is derived from thefault-zone width, the original layer thickness, and the fault angle. Asimple-shear overlay on the final gouge zone of experiment M-1-s-tp (Fig. 16) shows that clay-gouge zone is thicker than expectedfrom simple shear, although there is no evidence of lateral clayinjection from the source layer (Van der Zee et al., 2003). Oneprocess that contributes more clay to fault gouge than expectedfrom simple shear is mechanical mixing, in which clay moves intothe porosity of the sheared sand (Van der Zee, 2002). Clausen and
Gabrielsen (2002) reported three stages in the development of claymembranes from ring-shear experiments. In their first stage cor-responding to low normal stress (6 kPa), clay membranes arecompletely absent. Only occasional clay fragments occur in the faultzone. In the second stage at higher normal stress (>25 kPa),a mixture of sand and clay or patches of clay embedded in a sandmatrix occur. In the third stage, a semi-continuous clay membranedevelops (normal stress > 100 kPa). They inferred that parts of thefault zone characterized by a clay–sand mixture are stable anddevelop no other types of smear. They also speculated that mixingof clay and sand occurs by local invasion of clay into sand poresgenerated in dilation at an early stage of shear under low normalstress. Clausen and Gabrielsen (2002) concluded that, after ruptureof the clay layers, the fault zone is dominated by plastic deforma-tional processes, which include transport of single grains from sandinto the clay. Crawford et al. (2002) also reported on the generationof anastomosing networks of microsmears around frameworkgrains or clasts. In our experiments mixtures of sand and claywithin the gouge zone are also present. A detailed investigation ofdigitally enhanced high-resolution digital images (Fig. 16, experi-ment M-1-s-tp) shows that clay in the shear zone differs incomposition from the undeformed source clay. A fault gouge con-sisting of sand, clay and sand–clay mixture replaces the initialsheared layers of sand and clay.
4.7. Incipient faulting
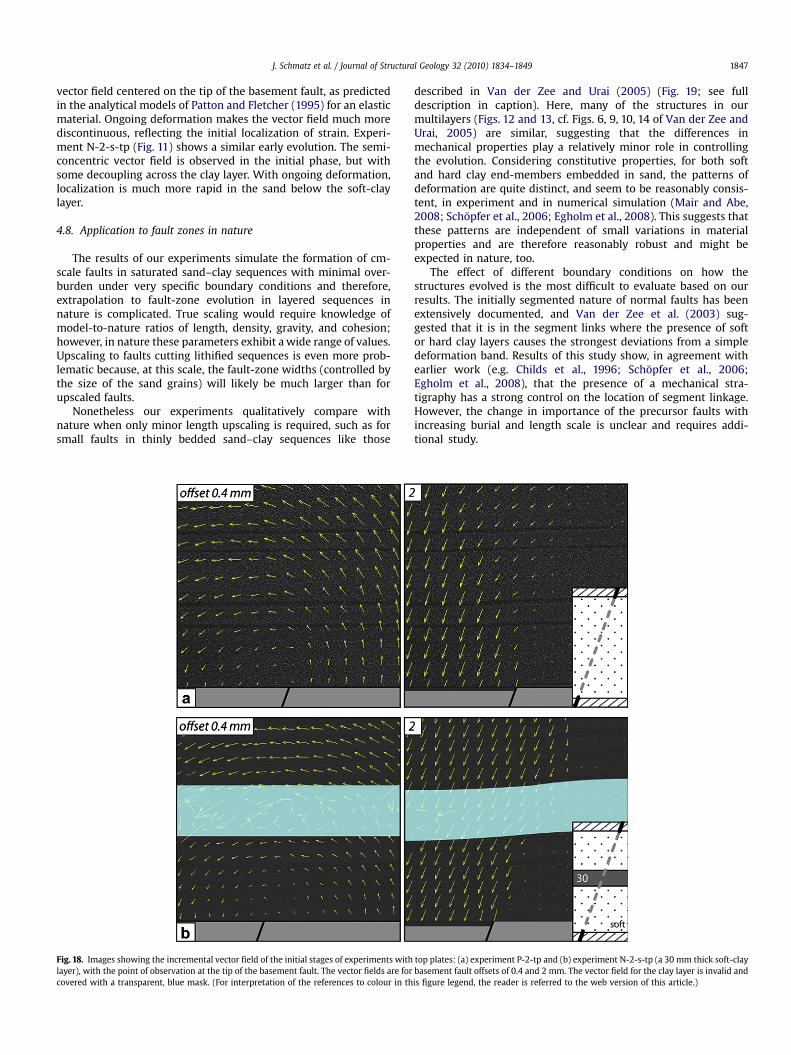
Understanding localization in the layered sand–clay experi-ments requires a clear understanding of localization in a pure sandexperiment. Assuming that the initial deformation in our models isnon-localized, we sought evidence for this with PIV. We carefullyprocessed the results of the first few photographs of a number ofexperiments, plotting the velocity field for basement faultdisplacements up to 0.8 mm (Fig. 18). In the first example we showthe incremental displacement vector field in the lower 6 cm ofa sand-only experiment (Fig. 4). Here, there is initially a concentric
J. Schmatz et al. / Journal of Structural Geology 32 (2010) 1834–1849 1847
vector field centered on the tip of the basement fault, as predictedin the analytical models of Patton and Fletcher (1995) for an elasticmaterial. Ongoing deformation makes the vector field much morediscontinuous, reflecting the initial localization of strain. Experi-ment N-2-s-tp (Fig. 11) shows a similar early evolution. The semi-concentric vector field is observed in the initial phase, but withsome decoupling across the clay layer. With ongoing deformation,localization is much more rapid in the sand below the soft-claylayer.
4.8. Application to fault zones in nature
The results of our experiments simulate the formation of cm-scale faults in saturated sand–clay sequences with minimal over-burden under very specific boundary conditions and therefore,extrapolation to fault-zone evolution in layered sequences innature is complicated. True scaling would require knowledge ofmodel-to-nature ratios of length, density, gravity, and cohesion;however, in nature these parameters exhibit a wide range of values.Upscaling to faults cutting lithified sequences is even more prob-lematic because, at this scale, the fault-zone widths (controlled bythe size of the sand grains) will likely be much larger than forupscaled faults.
Nonetheless our experiments qualitatively compare withnature when only minor length upscaling is required, such as forsmall faults in thinly bedded sand–clay sequences like those
Fig. 18. Images showing the incremental vector field of the initial stages of experiments withlayer), with the point of observation at the tip of the basement fault. The vector fields are forcovered with a transparent, blue mask. (For interpretation of the references to colour in th
described in Van der Zee and Urai (2005) (Fig. 19; see fulldescription in caption). Here, many of the structures in ourmultilayers (Figs. 12 and 13, cf. Figs. 6, 9, 10, 14 of Van der Zee andUrai, 2005) are similar, suggesting that the differences inmechanical properties play a relatively minor role in controllingthe evolution. Considering constitutive properties, for both softand hard clay end-members embedded in sand, the patterns ofdeformation are quite distinct, and seem to be reasonably consis-tent, in experiment and in numerical simulation (Mair and Abe,2008; Schopfer et al., 2006; Egholm et al., 2008). This suggests thatthese patterns are independent of small variations in materialproperties and are therefore reasonably robust and might beexpected in nature, too.
The effect of different boundary conditions on how thestructures evolved is the most difficult to evaluate based on ourresults. The initially segmented nature of normal faults has beenextensively documented, and Van der Zee et al. (2003) sug-gested that it is in the segment links where the presence of softor hard clay layers causes the strongest deviations from a simpledeformation band. Results of this study show, in agreement withearlier work (e.g. Childs et al., 1996; Schopfer et al., 2006;Egholm et al., 2008), that the presence of a mechanical stra-tigraphy has a strong control on the location of segment linkage.However, the change in importance of the precursor faults withincreasing burial and length scale is unclear and requires addi-tional study.
top plates: (a) experiment P-2-tp and (b) experiment N-2-s-tp (a 30 mm thick soft-claybasement fault offsets of 0.4 and 2 mm. The vector field for the clay layer is invalid andis figure legend, the reader is referred to the web version of this article.)
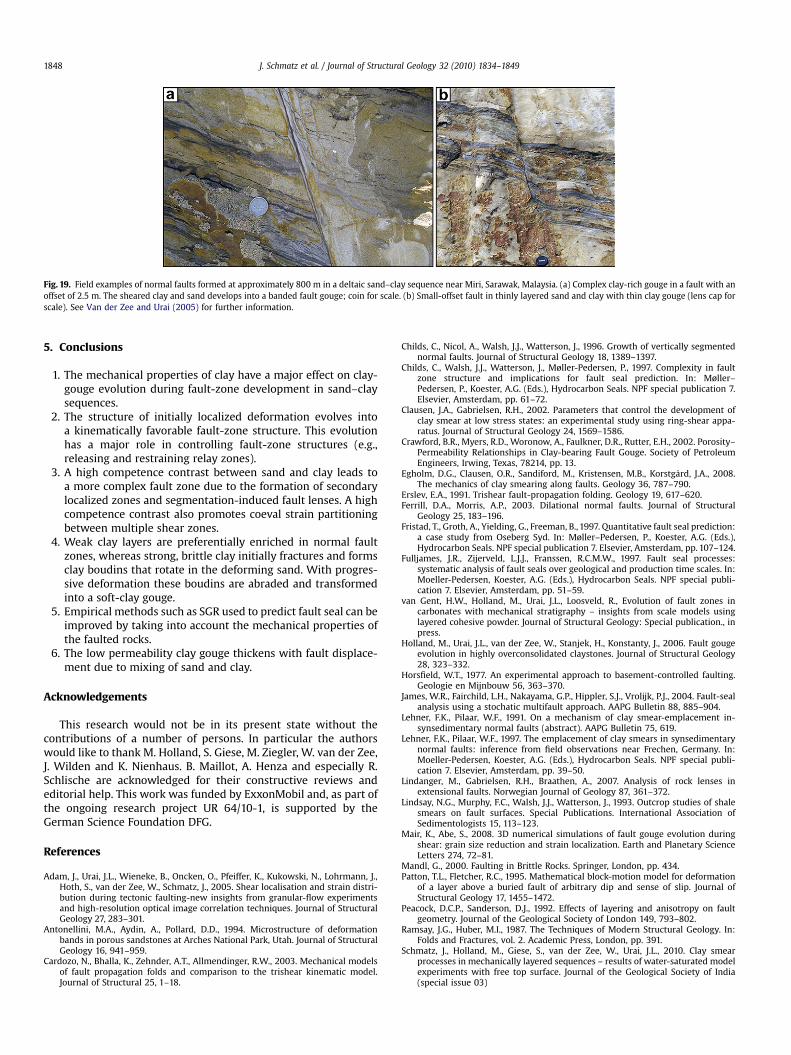
Fig. 19. Field examples of normal faults formed at approximately 800 m in a deltaic sand–clay sequence near Miri, Sarawak, Malaysia. (a) Complex clay-rich gouge in a fault with anoffset of 2.5 m. The sheared clay and sand develops into a banded fault gouge; coin for scale. (b) Small-offset fault in thinly layered sand and clay with thin clay gouge (lens cap forscale). See Van der Zee and Urai (2005) for further information.
J. Schmatz et al. / Journal of Structural Geology 32 (2010) 1834–18491848
5. Conclusions
1. The mechanical properties of clay have a major effect on clay-gouge evolution during fault-zone development in sand–claysequences.
2. The structure of initially localized deformation evolves intoa kinematically favorable fault-zone structure. This evolutionhas a major role in controlling fault-zone structures (e.g.,releasing and restraining relay zones).
3. A high competence contrast between sand and clay leads toa more complex fault zone due to the formation of secondarylocalized zones and segmentation-induced fault lenses. A highcompetence contrast also promotes coeval strain partitioningbetween multiple shear zones.
4. Weak clay layers are preferentially enriched in normal faultzones, whereas strong, brittle clay initially fractures and formsclay boudins that rotate in the deforming sand. With progres-sive deformation these boudins are abraded and transformedinto a soft-clay gouge.
5. Empirical methods such as SGR used to predict fault seal can beimproved by taking into account the mechanical properties ofthe faulted rocks.
6. The low permeability clay gouge thickens with fault displace-ment due to mixing of sand and clay.
Acknowledgements
This research would not be in its present state without thecontributions of a number of persons. In particular the authorswould like to thank M. Holland, S. Giese, M. Ziegler, W. van der Zee,J. Wilden and K. Nienhaus. B. Maillot, A. Henza and especially R.Schlische are acknowledged for their constructive reviews andeditorial help. This work was funded by ExxonMobil and, as part ofthe ongoing research project UR 64/10-1, is supported by theGerman Science Foundation DFG.
References
Adam, J., Urai, J.L., Wieneke, B., Oncken, O., Pfeiffer, K., Kukowski, N., Lohrmann, J.,Hoth, S., van der Zee, W., Schmatz, J., 2005. Shear localisation and strain distri-bution during tectonic faulting-new insights from granular-flow experimentsand high-resolution optical image correlation techniques. Journal of StructuralGeology 27, 283–301.
Antonellini, M.A., Aydin, A., Pollard, D.D., 1994. Microstructure of deformationbands in porous sandstones at Arches National Park, Utah. Journal of StructuralGeology 16, 941–959.
Cardozo, N., Bhalla, K., Zehnder, A.T., Allmendinger, R.W., 2003. Mechanical modelsof fault propagation folds and comparison to the trishear kinematic model.Journal of Structural 25, 1–18.
Childs, C., Nicol, A., Walsh, J.J., Watterson, J., 1996. Growth of vertically segmentednormal faults. Journal of Structural Geology 18, 1389–1397.
Childs, C., Walsh, J.J., Watterson, J., Møller-Pedersen, P., 1997. Complexity in faultzone structure and implications for fault seal prediction. In: Møller–Pedersen, P., Koester, A.G. (Eds.), Hydrocarbon Seals. NPF special publication 7.Elsevier, Amsterdam, pp. 61–72.
Clausen, J.A., Gabrielsen, R.H., 2002. Parameters that control the development ofclay smear at low stress states: an experimental study using ring-shear appa-ratus. Journal of Structural Geology 24, 1569–1586.
Crawford, B.R., Myers, R.D., Woronow, A., Faulkner, D.R., Rutter, E.H., 2002. Porosity–Permeability Relationships in Clay-bearing Fault Gouge. Society of PetroleumEngineers, Irwing, Texas, 78214, pp. 13.
Egholm, D.G., Clausen, O.R., Sandiford, M., Kristensen, M.B., Korstgård, J.A., 2008.The mechanics of clay smearing along faults. Geology 36, 787–790.
Erslev, E.A., 1991. Trishear fault-propagation folding. Geology 19, 617–620.Ferrill, D.A., Morris, A.P., 2003. Dilational normal faults. Journal of Structural
Geology 25, 183–196.Fristad, T., Groth, A., Yielding, G., Freeman, B., 1997. Quantitative fault seal prediction:
a case study from Oseberg Syd. In: Møller–Pedersen, P., Koester, A.G. (Eds.),Hydrocarbon Seals. NPF special publication 7. Elsevier, Amsterdam, pp. 107–124.
Fulljames, J.R., Zijerveld, L.J.J., Franssen, R.C.M.W., 1997. Fault seal processes:systematic analysis of fault seals over geological and production time scales. In:Moeller-Pedersen, Koester, A.G. (Eds.), Hydrocarbon Seals. NPF special publi-cation 7. Elsevier, Amsterdam, pp. 51–59.
van Gent, H.W., Holland, M., Urai, J.L., Loosveld, R., Evolution of fault zones incarbonates with mechanical stratigraphy – insights from scale models usinglayered cohesive powder. Journal of Structural Geology: Special publication., inpress.
Holland, M., Urai, J.L., van der Zee, W., Stanjek, H., Konstanty, J., 2006. Fault gougeevolution in highly overconsolidated claystones. Journal of Structural Geology28, 323–332.
Horsfield, W.T., 1977. An experimental approach to basement-controlled faulting.Geologie en Mijnbouw 56, 363–370.
James, W.R., Fairchild, L.H., Nakayama, G.P., Hippler, S.J., Vrolijk, P.J., 2004. Fault-sealanalysis using a stochatic multifault approach. AAPG Bulletin 88, 885–904.
Lehner, F.K., Pilaar, W.F., 1991. On a mechanism of clay smear-emplacement in-synsedimentary normal faults (abstract). AAPG Bulletin 75, 619.
Lehner, F.K., Pilaar, W.F., 1997. The emplacement of clay smears in synsedimentarynormal faults: inference from field observations near Frechen, Germany. In:Moeller-Pedersen, Koester, A.G. (Eds.), Hydrocarbon Seals. NPF special publi-cation 7. Elsevier, Amsterdam, pp. 39–50.
Lindanger, M., Gabrielsen, R.H., Braathen, A., 2007. Analysis of rock lenses inextensional faults. Norwegian Journal of Geology 87, 361–372.
Lindsay, N.G., Murphy, F.C., Walsh, J.J., Watterson, J., 1993. Outcrop studies of shalesmears on fault surfaces. Special Publications. International Association ofSedimentologists 15, 113–123.
Mair, K., Abe, S., 2008. 3D numerical simulations of fault gouge evolution duringshear: grain size reduction and strain localization. Earth and Planetary ScienceLetters 274, 72–81.
Mandl, G., 2000. Faulting in Brittle Rocks. Springer, London, pp. 434.Patton, T.L., Fletcher, R.C., 1995. Mathematical block-motion model for deformation
of a layer above a buried fault of arbitrary dip and sense of slip. Journal ofStructural Geology 17, 1455–1472.
Peacock, D.C.P., Sanderson, D.J., 1992. Effects of layering and anisotropy on faultgeometry. Journal of the Geological Society of London 149, 793–802.
Ramsay, J.G., Huber, M.I., 1987. The Techniques of Modern Structural Geology. In:Folds and Fractures, vol. 2. Academic Press, London, pp. 391.
Schmatz, J., Holland, M., Giese, S., van der Zee, W., Urai, J.L., 2010. Clay smearprocesses in mechanically layered sequences – results of water-saturated modelexperiments with free top surface. Journal of the Geological Society of India(special issue 03)
J. Schmatz et al. / Journal of Structural Geology 32 (2010) 1834–1849 1849
Schopfer, M.P.J., Childs, C., Walsh, J.J., 2006. Localisation of normal faults in multi-layer sequences. Journal of Structural Geology 28, 816–833.
Souloumiac, P., Leroy, Y.M., Maillot, B., Krabbenhøft, K., 2009. Predicting stressdistributions in fold-and-thrust belts and accretionary wedges by optimization.Journal of Geophysical Research 114 B09404.
Sperrevik, S., Faerseth, R.B., Gabrielsen, R.H., 2000. Experiments on clay smearformation along faults. Petroleum Geoscience 62, 113–123.
Steingart, D.A., Evans, J.W., 2005. Measurements of granular flows in two-dimen-sional hoppers by particle image velocimetry. Part I: experimental method andresults. Chemical Engineering Science 60, 589–598.
Urai, J.L., Nover, G., Zwach, C., Ondrak, R., Schoner, R., Kroos, B.M., 2008. Transportprocesses. In: Littke, R., Bayer, U., Gajewski, D., Nelskamp, S. (Eds.), Dynamics ofcomplex intracontinental basins: The Central European Basin System. Springer,Berlin Heidelberg, pp. 367–388.
Van der Zee, W., 2002. Dynamics of fault gouge development in Layers sand–claysequences. Shaker Verlag, Aachen, PhD thesis, pp. 155.
Van der Zee, W., Urai, J.L., Richard, P.D., 2003. Lateral clay injection into normalfaults. GeoArabia 8, 501–522.
Van der Zee, W., Urai, J.L., 2005. Processes of normal fault evolution in a siliciclasticsequence: a case study from Miri, Sarawak, Malaysia. Journal of StructuralGeology 27, 2281–2300.
Van der Zee, W., Wibberley, C.A.J., Urai, J.L., 2008. The influence of layering and pre-existing joints on the development of internal structure in normal fault zones:the Lodeve basin, France. In: Wibberley, C.A.J., Kurz, W., Imber, J.,
Holdworth, R.E., Collerrini, C. (Eds.), The Internal Structure of Fault Zones:Implications for Mechanical and Fluid-Flow Properties. Geological Society ofLondon Special Publications 299, pp. 57–74.
Walsh, J.J., Watterson, J., Bailey, W., Childs, C., 1999. Fault relays, bends and branch-lines. Journal of Structural Geology 21, 1019–1026.
Weber, K.J., Mandl, G., Pilaar, W.F., Lehner, F.K., Precious, R.G., 1978. The role of faultsin hydrocarbon migration and trapping in Nigerian growth fault structures. In:Proc. 10th Annual Offshore Technology Conference, Houston, Texas 4, 2643–2653.
Welch, M.J., Knipe, R.J., Souque, C., Davies, R.K., 2009. A Quadshear kinematic modelfor folding and clay smear development in fault zones. Tectonophysics,186–202.
Wolf, H., Konig, D., Triantafyllidis, T., 2003. Experimental investigation of shearband patterns in granular material. Journal of Structural Geology 25, 1229–1240.
Yielding, G., 2002. Shale Gouge Ratio – calibration by geohistory. In:Koester, A.G.H.R. (Ed.), Hydrocarbon Seal Quantification. NPF Special Publication11. Elsevier, Amsterdam, pp. 1–15.
Yielding, G., Freeman, B., Needham, D.T., 1997. Quantitative fault seal prediction.AAPG Bulletin 81, 897–917.
Zehnder, A.T., Allmendinger, R.W., 2000. Velocity field for the trishear model.Journal of Structural Geology 22, 1009–1014.
Zhang, L., Thornton, C., 2007. A numerical examination of the direct shear test.Geotechnique 57, 343–354.