Embed Size (px)
Citation preview
Journal of The Electrochemical Society, 160 (4) A697-A702 (2013) A6970013-4651/2013/160(4)/A697/6/$31.00 © The Electrochemical Society
Concentration Dependence of VO2+ Crossover of Nafionfor Vanadium Redox Flow BatteriesJamie S. Lawton,a Amanda Jones,a and Thomas Zawodzinskia,b,∗,z
aDepartment of Chemical and Biomolecular Engineering, University of Tennessee at Knoxville, Knoxville,Tennessee 37996, USAbMaterials Science and Technology Division, Oak Ridge National Laboratory, Oak Ridge, Tennessee 37831, USA
The VO2+ crossover, or permeability, through Nafion in a vanadium redox flow battery (VRFB) was monitored as a function ofsulfuric acid concentration and VO2+ concentration. A vanadium rich solution was flowed on one side of the membrane through aflow field while symmetrically on the other side a blank or vanadium deficit solution was flowed. The blank solution was flowedthrough an electron paramagnetic resonance (EPR) cavity and the VO2+ concentration was determined from the intensity of theEPR signal. Concentration values were fit using a solution of Fick’s law that allows for the effect of concentration change on thevanadium rich side. The fits resulted in permeability values of VO2+ ions across the membrane. Viscosity measurements of manyVO2+ and H2SO4 solutions were made at 30–60◦C. These viscosity values were then used to determine the effect of the viscosityof the flowing solution on the permeability of the ion.© 2013 The Electrochemical Society. [DOI: 10.1149/2.004306jes] All rights reserved.
Manuscript submitted December 5, 2012; revised manuscript received January 29, 2013. Published February 22, 2013.
The Vanadium Redox Flow Battery (VRFB) is an energy stor-age device consisting of flowing anolyte (V(II)/V(III)) and catholyte(VO2
+/VO2+) often separated by an ion exchange membrane, such asNafion.1 Across the literature on VRFBs there are many variations invanadium concentrations and H2SO4 concentrations used in batteryoperation.2–4 Vanadium diffusion through the membrane, or crossover,is a problem that leads to electrolyte imbalances and self dischargeof the battery.5 Many alternative membranes have been studied forapplications in VRFBs with a primary goals to minimize crossoverand cost.6 In addition to cross-over, internal cell resistance in high-performance cells is often dominated by the membrane resistance.Water and acid transport during cell operation also can be significant,leading to operational problems. Thus, probing and understandingmass transport effects in or through membranes is of great importanceto the advancement of the technology.
The uptake of water, acid and ions is the critical background onwhich any consideration of mass transport effects must be based. Ver-brugge and co-workers7,8 published experimental studies and modelsof sulfuric acid and water uptake and transport in Nafion and ob-served a drop in the diffusion coefficient of the bisulfate ion at aH2SO4 concentration of 3 M. A recent study characterizing the effectsof vanadium9 on Nafion have observed slower motional rates withhigher vanadium contents in the membrane. Experiments detailing theeffects of sulfuric acid interaction with the membrane have reportedmembrane dehydration at increasing sulfuric acid concentrations.7
One important use of uptake and mass transport data is as inputfor modeling of key phenomena occurring in the VRFB cells. Recentmodeling efforts have varied in their approach to the membrane andin their access to transport data.10–13 The data available as input isoften derived based on a partial or scattershot group of measurements.Typically, these data are not obtained from experiments taking intoaccount the nature of the transport problem in concentrated solutions.Values used do not always reflect the environment in the operatingcell or are based on measurements intended for fuel cell operations,which do not necessarily compare to VRFB conditions. Some modelshave focused on modeling the overall cell while downplaying themembrane-related aspects of operation. While such models, usuallybased on CFD calculations allow some consideration of the physicalaspects of the cell (mass transport in channels and in porous media),they are mostly simplistic in their consideration of membrane effects.Unfortunately, this limits the insight gained since several of the mostimportant aspects of cell performance are dominated by membranetransport phenomena.
The transport phenomena in the membranes used in VFRBs isextremely complex on the face of it. First, there are a large num-
∗Electrochemical Society Fellow.zE-mail: [email protected]
ber of components, all (more or less) present in the ‘concentratedsolution’ regime. This regime requires explicitly including variableactivity coefficient effects or inter-component interactions. With 4vanadium species, protons, bisulfate and water to consider, one wouldneed at least 21 independent parameters to fully describe the transportprocesses. Looked at in another way, the transport of each speciesinteracts with that of the others. In this light, measurements using asimple Fickian description of transport of a single component, the di-lute solution transport limit, provides diffusion data of limited utilityunless carried out over a wide range of systematically varied condi-tions.
This contribution is the first in a projected series of papers that willprovide data and analysis to support modeling and concentrated so-lution theory analysis of VRFB cell and membrane processes. Here,we report a primary set of data for diffusion of vanadium acrossNafion membranes using Electron Paramagnetic Resonance (EPR) asa detector of species concentrations. We have simplified the trans-port problem for this work to include only a single vanadium species(VO2+) in the presence of sulfuric acid. Even with just the single ionbeing considered, there are substantial complications in the descrip-tion of the transport process. We have carried out measurements overa range of concentrations of H2SO4 and VO2+. We provide empiricaldiffusion coefficients for these conditions in the hope of providinguseful data for modelers that goes substantially beyond the few piecesof diffusion data in the literature and that helps to understand thevariability in these data.
Though other researchers have reported cross-over of one or evenmultiple species through membranes,5,14,15 the analytical frameworkand experimental conditions were such that it is difficult to separatethe multiple interactions occurring when several species are present.By proceeding through experiments utilizing one species at a time,as presented and analyzed within, we hope to extract more generallyuseful coefficients that can be translated from system to system. In ad-dition, we report here a substantially wider range of compositions thathave been used elsewhere, which we hope will be useful to modelingactivities in the flow battery field. Such a range of data is often usefulwhen integrating over composition gradients that develop during anexperiment in the real system.
Experimental
An illustration of the experimental setup is shown in Figure 1.The cell used to monitor VO2+ permeability in this study was batterycell hardware purchased from Fuel Cell Technologies. A vanadiumrich solution was flowed on one side of the membrane through a flowfield while symmetrically on the other side a blank or vanadium deficitsolution was flowed. The solutions were flowed using a Masterflex L/S
) unless CC License in place (see abstract). ecsdl.org/site/terms_use address. Redistribution subject to ECS terms of use (see 160.36.178.25Downloaded on 2015-01-08 to IP
A698 Journal of The Electrochemical Society, 160 (4) A697-A702 (2013)
Figure 1. Illustration of experimental set up monitoring VO2+ crossover inthe flow battery cell showing the resultant 3D plot of the increasing vanadiumsignal from the EPR with time.
four channel peristaltic pump system at 25 mL/min. The membraneused was a Nafion 117 membrane pretreated by heating to 75◦C for1 hour in 3% hydrogen peroxide followed by 1 hour in deionizedwater, 1 hour in 0.5 M sulfuric acid, and 1 hour in deionized water.The active area of the membrane was 5 cm2. Teflon gaskets were usedto create a 1 mil pooling area for the solutions inside the cell, as noelectrodes were present.
Varying concentrations (0.1–0.8 M) of vanadyl sulfate (Alfa Ae-sar, 99.9%) were dissolved in varying concentrations (0.5–4 M) ofsulfuric acid. The vanadium solutions were flowed through the cellwith vanadium deficient solutions of sulfuric acid of a concentrationmatching the total cation concentration in the vanadium rich solution,taking into account the second dissociation constant of sulfuric acid.‘Cation concentration’ was used to maintain a distinct terminologybetween the concentration of VOSO4 and H2SO4, as opposed to re-ferring to sulfate concentration, which reflects on the concentrationsof both species together. The ion balance was maintained to minimizeosmotic pressure gradients. The volume of solution on both sidesof the cell was 45 mL and was collected in volumetric cylinders sothat any volume changes due to osmotic pressure driven water flowduring the experiment could be monitored. Between crossover mea-surements the cell and tubing was thoroughly rinsed with DI water.The cell temperature was maintained at 30◦C for all experiments.
The vanadium deficient side of the cell was flowed through thecavity of a Magnettech Miniscope EPR (Berlin, Germany). The VO2+
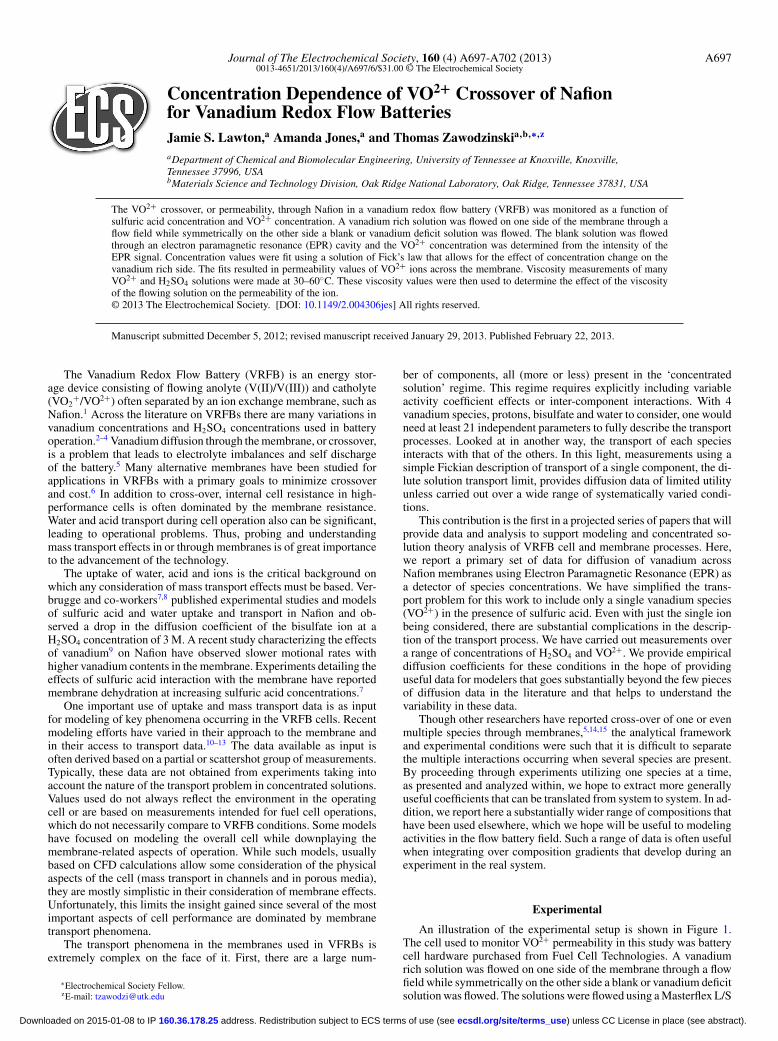
spectrum was monitored over time. Titration experiments shown inFigure 2, where the VO2+ concentration was increased over time andknown at all times, confirm that the doubly integrated intensity of theVO2+ spectrum is linearly related to the concentration of VO2+ insolution. A spectrum of a standard of known VO2+ concentration wastaken using the same parameters as the experiment to calculate theVO2+ concentrations from the EPR data. The EPR data was integratedand analyzed with scripts written in-house using the MathWorks’MATLAB software.
The viscosity measurements were taken of solutions prepared from0–2 M VOSO4 and 0–5 M H2SO4 at 30–60◦C. The viscometer usedincluded a transparent thermostat CT 52 from SI analytics and anoptical sensor.
Results
The doubly integrated intensity of the VO2+ spectra is linearlyrelated to the concentration of VO2+ in the solution (Figure 2). Figure 3shows an example of a crossover experiment monitored over long
Figure 2. Linear relationship between doubly integrated intensity of VO2+EPR signal and concentration from results of titration of VO2+.
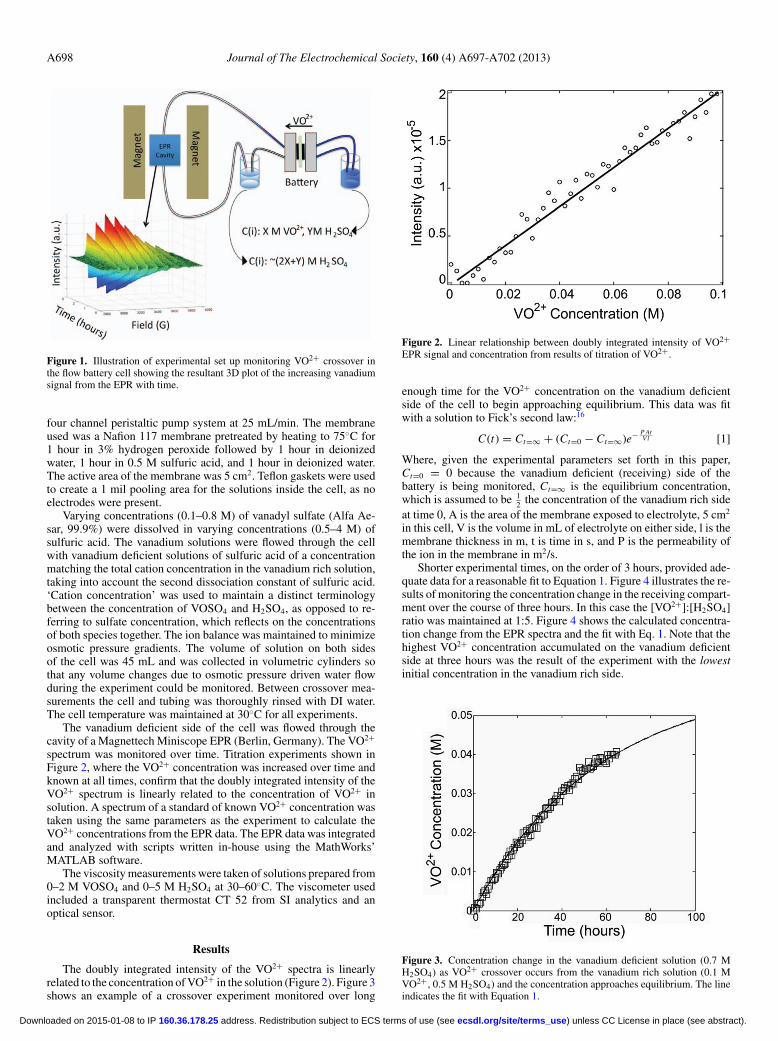
enough time for the VO2+ concentration on the vanadium deficientside of the cell to begin approaching equilibrium. This data was fitwith a solution to Fick’s second law:16
C(t) = Ct=∞ + (Ct=0 − Ct=∞)e− P AtV l [1]
Where, given the experimental parameters set forth in this paper,Ct=0 = 0 because the vanadium deficient (receiving) side of thebattery is being monitored, Ct=∞ is the equilibrium concentration,which is assumed to be 1
2 the concentration of the vanadium rich sideat time 0, A is the area of the membrane exposed to electrolyte, 5 cm2
in this cell, V is the volume in mL of electrolyte on either side, l is themembrane thickness in m, t is time in s, and P is the permeability ofthe ion in the membrane in m2/s.
Shorter experimental times, on the order of 3 hours, provided ade-quate data for a reasonable fit to Equation 1. Figure 4 illustrates the re-sults of monitoring the concentration change in the receiving compart-ment over the course of three hours. In this case the [VO2+]:[H2SO4]ratio was maintained at 1:5. Figure 4 shows the calculated concentra-tion change from the EPR spectra and the fit with Eq. 1. Note that thehighest VO2+ concentration accumulated on the vanadium deficientside at three hours was the result of the experiment with the lowestinitial concentration in the vanadium rich side.
Figure 3. Concentration change in the vanadium deficient solution (0.7 MH2SO4) as VO2+ crossover occurs from the vanadium rich solution (0.1 MVO2+, 0.5 M H2SO4) and the concentration approaches equilibrium. The lineindicates the fit with Equation 1.
) unless CC License in place (see abstract). ecsdl.org/site/terms_use address. Redistribution subject to ECS terms of use (see 160.36.178.25Downloaded on 2015-01-08 to IP
Journal of The Electrochemical Society, 160 (4) A697-A702 (2013) A699
Figure 4. A. The concentration of VO2+ in the vanadium deficient side overthree hours calculated from the doubly integrated EPR signal intensity for the[VO2+]:[H2SO4] = 1:5 experiments. Lines show fit with Equation 1.
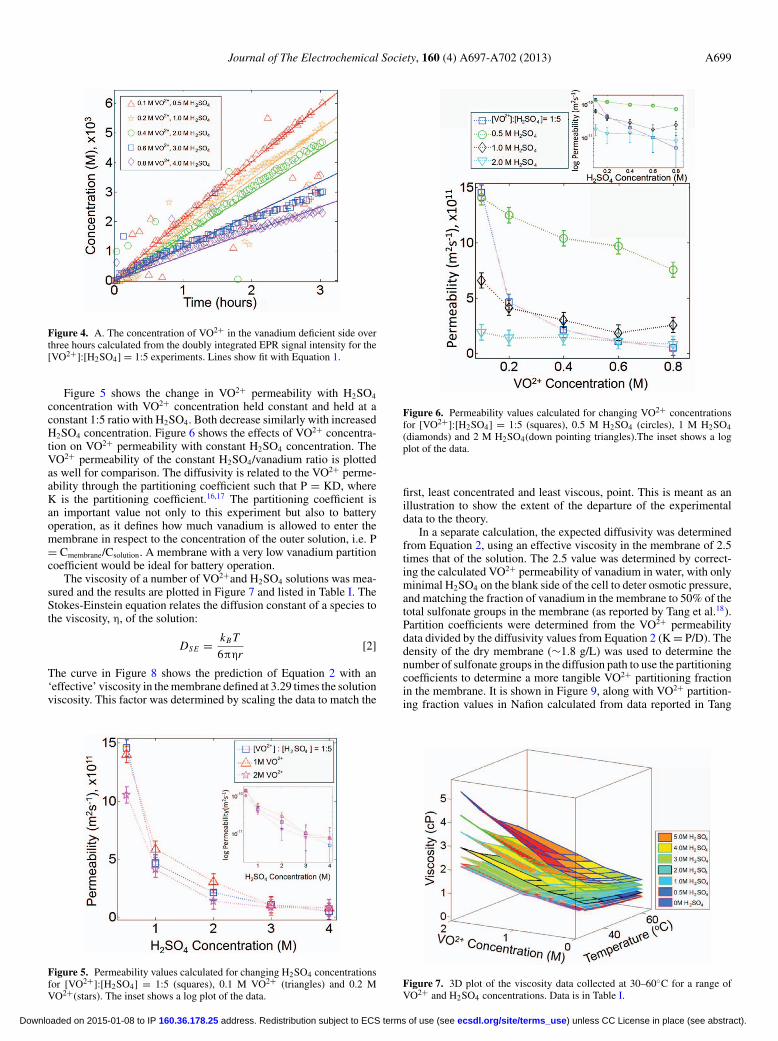
Figure 5 shows the change in VO2+ permeability with H2SO4
concentration with VO2+ concentration held constant and held at aconstant 1:5 ratio with H2SO4. Both decrease similarly with increasedH2SO4 concentration. Figure 6 shows the effects of VO2+ concentra-tion on VO2+ permeability with constant H2SO4 concentration. TheVO2+ permeability of the constant H2SO4/vanadium ratio is plottedas well for comparison. The diffusivity is related to the VO2+ perme-ability through the partitioning coefficient such that P = KD, whereK is the partitioning coefficient.16,17 The partitioning coefficient isan important value not only to this experiment but also to batteryoperation, as it defines how much vanadium is allowed to enter themembrane in respect to the concentration of the outer solution, i.e. P= Cmembrane/Csolution. A membrane with a very low vanadium partitioncoefficient would be ideal for battery operation.
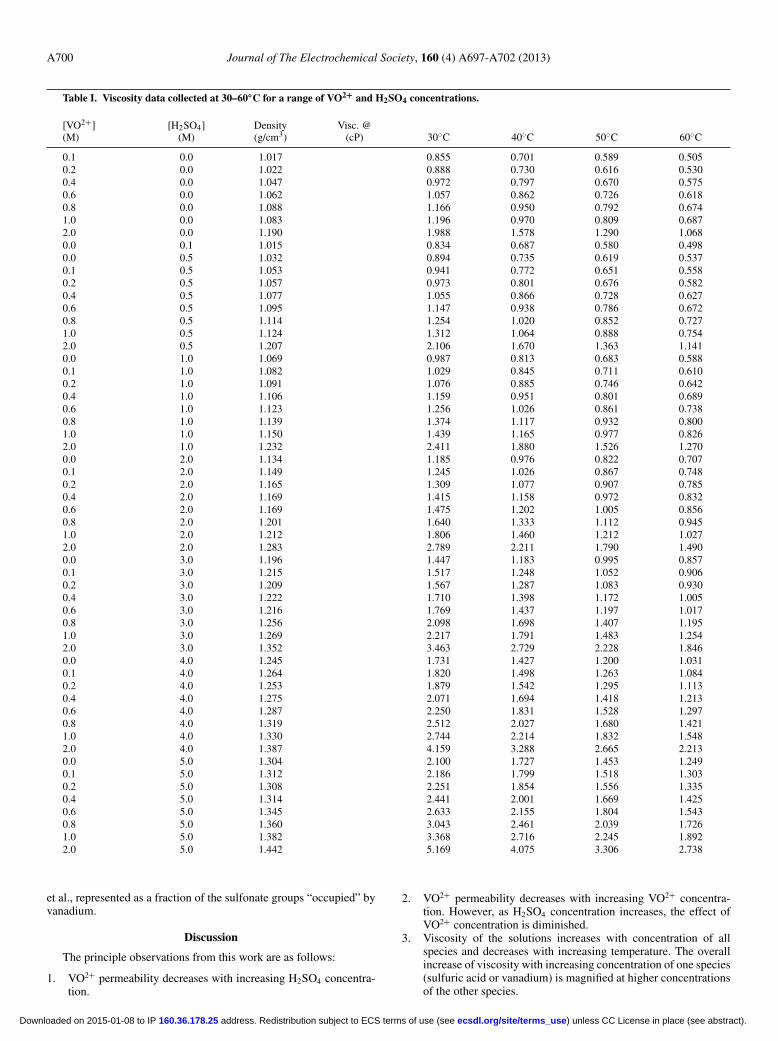
The viscosity of a number of VO2+and H2SO4 solutions was mea-sured and the results are plotted in Figure 7 and listed in Table I. TheStokes-Einstein equation relates the diffusion constant of a species tothe viscosity, η, of the solution:
DSE = kB T
6πηr[2]
The curve in Figure 8 shows the prediction of Equation 2 with an‘effective’ viscosity in the membrane defined at 3.29 times the solutionviscosity. This factor was determined by scaling the data to match the
Figure 5. Permeability values calculated for changing H2SO4 concentrationsfor [VO2+]:[H2SO4] = 1:5 (squares), 0.1 M VO2+ (triangles) and 0.2 MVO2+(stars). The inset shows a log plot of the data.
Figure 6. Permeability values calculated for changing VO2+ concentrationsfor [VO2+]:[H2SO4] = 1:5 (squares), 0.5 M H2SO4 (circles), 1 M H2SO4(diamonds) and 2 M H2SO4(down pointing triangles).The inset shows a logplot of the data.
first, least concentrated and least viscous, point. This is meant as anillustration to show the extent of the departure of the experimentaldata to the theory.
In a separate calculation, the expected diffusivity was determinedfrom Equation 2, using an effective viscosity in the membrane of 2.5times that of the solution. The 2.5 value was determined by correct-ing the calculated VO2+ permeability of vanadium in water, with onlyminimal H2SO4 on the blank side of the cell to deter osmotic pressure,and matching the fraction of vanadium in the membrane to 50% of thetotal sulfonate groups in the membrane (as reported by Tang et al.18).Partition coefficients were determined from the VO2+ permeabilitydata divided by the diffusivity values from Equation 2 (K = P/D). Thedensity of the dry membrane (∼1.8 g/L) was used to determine thenumber of sulfonate groups in the diffusion path to use the partitioningcoefficients to determine a more tangible VO2+ partitioning fractionin the membrane. It is shown in Figure 9, along with VO2+ partition-ing fraction values in Nafion calculated from data reported in Tang
Figure 7. 3D plot of the viscosity data collected at 30–60◦C for a range ofVO2+ and H2SO4 concentrations. Data is in Table I.
) unless CC License in place (see abstract). ecsdl.org/site/terms_use address. Redistribution subject to ECS terms of use (see 160.36.178.25Downloaded on 2015-01-08 to IP
A700 Journal of The Electrochemical Society, 160 (4) A697-A702 (2013)
Table I. Viscosity data collected at 30–60◦C for a range of VO2+ and H2SO4 concentrations.
[VO2+](M)
[H2SO4](M)
Density(g/cm3)
Visc. @(cP) 30◦C 40◦C 50◦C 60◦C
0.1 0.0 1.017 0.855 0.701 0.589 0.5050.2 0.0 1.022 0.888 0.730 0.616 0.5300.4 0.0 1.047 0.972 0.797 0.670 0.5750.6 0.0 1.062 1.057 0.862 0.726 0.6180.8 0.0 1.088 1.166 0.950 0.792 0.6741.0 0.0 1.083 1.196 0.970 0.809 0.6872.0 0.0 1.190 1.988 1.578 1.290 1.0680.0 0.1 1.015 0.834 0.687 0.580 0.4980.0 0.5 1.032 0.894 0.735 0.619 0.5370.1 0.5 1.053 0.941 0.772 0.651 0.5580.2 0.5 1.057 0.973 0.801 0.676 0.5820.4 0.5 1.077 1.055 0.866 0.728 0.6270.6 0.5 1.095 1.147 0.938 0.786 0.6720.8 0.5 1.114 1.254 1.020 0.852 0.7271.0 0.5 1.124 1.312 1.064 0.888 0.7542.0 0.5 1.207 2.106 1.670 1.363 1.1410.0 1.0 1.069 0.987 0.813 0.683 0.5880.1 1.0 1.082 1.029 0.845 0.711 0.6100.2 1.0 1.091 1.076 0.885 0.746 0.6420.4 1.0 1.106 1.159 0.951 0.801 0.6890.6 1.0 1.123 1.256 1.026 0.861 0.7380.8 1.0 1.139 1.374 1.117 0.932 0.8001.0 1.0 1.150 1.439 1.165 0.977 0.8262.0 1.0 1.232 2.411 1.880 1.526 1.2700.0 2.0 1.134 1.185 0.976 0.822 0.7070.1 2.0 1.149 1.245 1.026 0.867 0.7480.2 2.0 1.165 1.309 1.077 0.907 0.7850.4 2.0 1.169 1.415 1.158 0.972 0.8320.6 2.0 1.169 1.475 1.202 1.005 0.8560.8 2.0 1.201 1.640 1.333 1.112 0.9451.0 2.0 1.212 1.806 1.460 1.212 1.0272.0 2.0 1.283 2.789 2.211 1.790 1.4900.0 3.0 1.196 1.447 1.183 0.995 0.8570.1 3.0 1.215 1.517 1.248 1.052 0.9060.2 3.0 1.209 1.567 1.287 1.083 0.9300.4 3.0 1.222 1.710 1.398 1.172 1.0050.6 3.0 1.216 1.769 1.437 1.197 1.0170.8 3.0 1.256 2.098 1.698 1.407 1.1951.0 3.0 1.269 2.217 1.791 1.483 1.2542.0 3.0 1.352 3.463 2.729 2.228 1.8460.0 4.0 1.245 1.731 1.427 1.200 1.0310.1 4.0 1.264 1.820 1.498 1.263 1.0840.2 4.0 1.253 1.879 1.542 1.295 1.1130.4 4.0 1.275 2.071 1.694 1.418 1.2130.6 4.0 1.287 2.250 1.831 1.528 1.2970.8 4.0 1.319 2.512 2.027 1.680 1.4211.0 4.0 1.330 2.744 2.214 1.832 1.5482.0 4.0 1.387 4.159 3.288 2.665 2.2130.0 5.0 1.304 2.100 1.727 1.453 1.2490.1 5.0 1.312 2.186 1.799 1.518 1.3030.2 5.0 1.308 2.251 1.854 1.556 1.3350.4 5.0 1.314 2.441 2.001 1.669 1.4250.6 5.0 1.345 2.633 2.155 1.804 1.5430.8 5.0 1.360 3.043 2.461 2.039 1.7261.0 5.0 1.382 3.368 2.716 2.245 1.8922.0 5.0 1.442 5.169 4.075 3.306 2.738
et al., represented as a fraction of the sulfonate groups “occupied” byvanadium.
Discussion
The principle observations from this work are as follows:
1. VO2+ permeability decreases with increasing H2SO4 concentra-tion.
2. VO2+ permeability decreases with increasing VO2+ concentra-tion. However, as H2SO4 concentration increases, the effect ofVO2+ concentration is diminished.
3. Viscosity of the solutions increases with concentration of allspecies and decreases with increasing temperature. The overallincrease of viscosity with increasing concentration of one species(sulfuric acid or vanadium) is magnified at higher concentrationsof the other species.
) unless CC License in place (see abstract). ecsdl.org/site/terms_use address. Redistribution subject to ECS terms of use (see 160.36.178.25Downloaded on 2015-01-08 to IP
Journal of The Electrochemical Society, 160 (4) A697-A702 (2013) A701
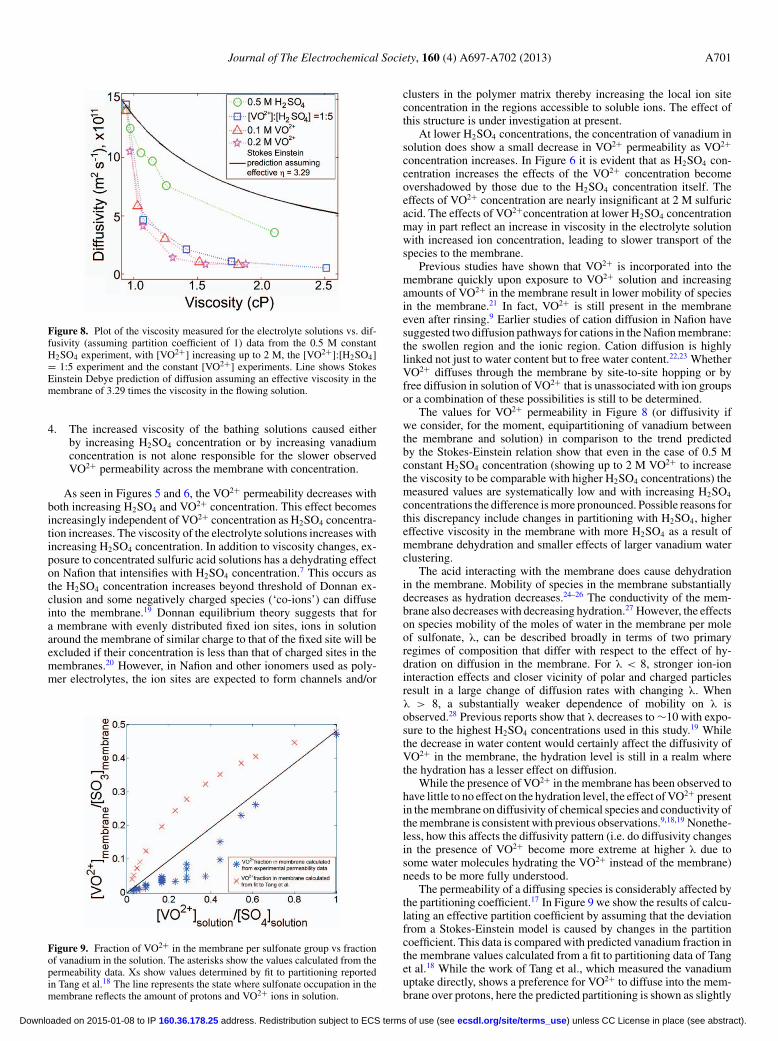
Figure 8. Plot of the viscosity measured for the electrolyte solutions vs. dif-fusivity (assuming partition coefficient of 1) data from the 0.5 M constantH2SO4 experiment, with [VO2+] increasing up to 2 M, the [VO2+]:[H2SO4]= 1:5 experiment and the constant [VO2+] experiments. Line shows StokesEinstein Debye prediction of diffusion assuming an effective viscosity in themembrane of 3.29 times the viscosity in the flowing solution.
4. The increased viscosity of the bathing solutions caused eitherby increasing H2SO4 concentration or by increasing vanadiumconcentration is not alone responsible for the slower observedVO2+ permeability across the membrane with concentration.
As seen in Figures 5 and 6, the VO2+ permeability decreases withboth increasing H2SO4 and VO2+ concentration. This effect becomesincreasingly independent of VO2+ concentration as H2SO4 concentra-tion increases. The viscosity of the electrolyte solutions increases withincreasing H2SO4 concentration. In addition to viscosity changes, ex-posure to concentrated sulfuric acid solutions has a dehydrating effecton Nafion that intensifies with H2SO4 concentration.7 This occurs asthe H2SO4 concentration increases beyond threshold of Donnan ex-clusion and some negatively charged species (‘co-ions’) can diffuseinto the membrane.19 Donnan equilibrium theory suggests that fora membrane with evenly distributed fixed ion sites, ions in solutionaround the membrane of similar charge to that of the fixed site will beexcluded if their concentration is less than that of charged sites in themembranes.20 However, in Nafion and other ionomers used as poly-mer electrolytes, the ion sites are expected to form channels and/or
Figure 9. Fraction of VO2+ in the membrane per sulfonate group vs fractionof vanadium in the solution. The asterisks show the values calculated from thepermeability data. Xs show values determined by fit to partitioning reportedin Tang et al.18 The line represents the state where sulfonate occupation in themembrane reflects the amount of protons and VO2+ ions in solution.
clusters in the polymer matrix thereby increasing the local ion siteconcentration in the regions accessible to soluble ions. The effect ofthis structure is under investigation at present.
At lower H2SO4 concentrations, the concentration of vanadium insolution does show a small decrease in VO2+ permeability as VO2+
concentration increases. In Figure 6 it is evident that as H2SO4 con-centration increases the effects of the VO2+ concentration becomeovershadowed by those due to the H2SO4 concentration itself. Theeffects of VO2+ concentration are nearly insignificant at 2 M sulfuricacid. The effects of VO2+concentration at lower H2SO4 concentrationmay in part reflect an increase in viscosity in the electrolyte solutionwith increased ion concentration, leading to slower transport of thespecies to the membrane.
Previous studies have shown that VO2+ is incorporated into themembrane quickly upon exposure to VO2+ solution and increasingamounts of VO2+ in the membrane result in lower mobility of speciesin the membrane.21 In fact, VO2+ is still present in the membraneeven after rinsing.9 Earlier studies of cation diffusion in Nafion havesuggested two diffusion pathways for cations in the Nafion membrane:the swollen region and the ionic region. Cation diffusion is highlylinked not just to water content but to free water content.22,23 WhetherVO2+ diffuses through the membrane by site-to-site hopping or byfree diffusion in solution of VO2+ that is unassociated with ion groupsor a combination of these possibilities is still to be determined.
The values for VO2+ permeability in Figure 8 (or diffusivity ifwe consider, for the moment, equipartitioning of vanadium betweenthe membrane and solution) in comparison to the trend predictedby the Stokes-Einstein relation show that even in the case of 0.5 Mconstant H2SO4 concentration (showing up to 2 M VO2+ to increasethe viscosity to be comparable with higher H2SO4 concentrations) themeasured values are systematically low and with increasing H2SO4
concentrations the difference is more pronounced. Possible reasons forthis discrepancy include changes in partitioning with H2SO4, highereffective viscosity in the membrane with more H2SO4 as a result ofmembrane dehydration and smaller effects of larger vanadium waterclustering.
The acid interacting with the membrane does cause dehydrationin the membrane. Mobility of species in the membrane substantiallydecreases as hydration decreases.24–26 The conductivity of the mem-brane also decreases with decreasing hydration.27 However, the effectson species mobility of the moles of water in the membrane per moleof sulfonate, λ, can be described broadly in terms of two primaryregimes of composition that differ with respect to the effect of hy-dration on diffusion in the membrane. For λ < 8, stronger ion-ioninteraction effects and closer vicinity of polar and charged particlesresult in a large change of diffusion rates with changing λ. Whenλ > 8, a substantially weaker dependence of mobility on λ isobserved.28 Previous reports show that λ decreases to ∼10 with expo-sure to the highest H2SO4 concentrations used in this study.19 Whilethe decrease in water content would certainly affect the diffusivity ofVO2+ in the membrane, the hydration level is still in a realm wherethe hydration has a lesser effect on diffusion.
While the presence of VO2+ in the membrane has been observed tohave little to no effect on the hydration level, the effect of VO2+ presentin the membrane on diffusivity of chemical species and conductivity ofthe membrane is consistent with previous observations.9,18,19 Nonethe-less, how this affects the diffusivity pattern (i.e. do diffusivity changesin the presence of VO2+ become more extreme at higher λ due tosome water molecules hydrating the VO2+ instead of the membrane)needs to be more fully understood.
The permeability of a diffusing species is considerably affected bythe partitioning coefficient.17 In Figure 9 we show the results of calcu-lating an effective partition coefficient by assuming that the deviationfrom a Stokes-Einstein model is caused by changes in the partitioncoefficient. This data is compared with predicted vanadium fraction inthe membrane values calculated from a fit to partitioning data of Tanget al.18 While the work of Tang et al., which measured the vanadiumuptake directly, shows a preference for VO2+ to diffuse into the mem-brane over protons, here the predicted partitioning is shown as slightly
) unless CC License in place (see abstract). ecsdl.org/site/terms_use address. Redistribution subject to ECS terms of use (see 160.36.178.25Downloaded on 2015-01-08 to IP

A702 Journal of The Electrochemical Society, 160 (4) A697-A702 (2013)
less preferential than the proton. A rationalization of this discrepancyis that a fraction of the VO2+ in the membrane is in fact immobilizedby interacting strongly with sulfonate sites and thus diffuses exceed-ingly slowly. This would make the apparent partitioning based on amobility comparison lower than what is observed when all vanadium(mobile and immobile) is stripped from the membrane, such as inTang et al. Anderson and coworkers17 reported similar observationsof mobile and immobile species in polyacrylamide gels.
Ultimately, to improve battery operation and efficiency, a mem-brane with high proton conductivity and low VO2+ permeability aswell as good stability is essential. In the case of the VRFBs, e.g.in comparison to the highly studied methanol crossover problem ofdirect methanol fuel cells, the membrane is exposed to a larger num-ber of different components. In the VRFB system, what we observewith increased exposure to vanadium and sulfuric acid can be causedby a) dehydration of the membrane, b) bisulfate and sulfate groupsdiffusing into the membrane c) vanadium exchanging with protonsat the fixed ion groups in the membrane or d) increases in the localviscosity in the membrane. From the data presented in this study, it isdifficult to sort amongst these possibilities to identify a root cause forour observations.
Determining what combination of these effects inhibits crossovercan ultimately guide membrane development for the specific appli-cation of VRFBS. Further understanding of viscosity and speciespartitioning/clustering in the electrolyte solutions as well as batteryperformance as a result of changing H2SO4 concentration are neededto continue to improve operation conditions. The crossover of ionspecies from one side to the other side of the membrane is linked withthe crossover of another species in the opposite direction. Characteri-zation of the permeability of all vanadium species in the battery in theabsence and presence of the other species is necessary.
Conclusions
Vanadium ion permeation through Nafion was studied as a functionof the composition of the bathing solution. The results indicate ratherslow permeation rates of vanadium ions through this membrane. TheH2SO4 concentration of the solution has a significant effect on ionpermeability in Nafion membranes. The effects of H2SO4 concentra-tions are so strong as to overshadow the effects of VO2+ concentrationand temperature as H2SO4 concentration approaches 2 M. While theacid effects that decrease permeability of the VO2+ are also expected
to negatively affect the conductivity, there may be a beneficial con-centration that balances these effects. Detailed, molecular level inter-pretation of these observations awaits further studies of partitioningand local mobility within the membrane.
References
1. M. Rychcik and M. Skyllas-Kazacos, Journal of Power Sources, 22, 59 (1988).2. D. S. Aaron, Z. Tang, A. B. Papandrew, and T. A. Zawodzinski, J. Appl. Electrochem.,
41, 1175 (2011).3. V. Haddadi-Asl, M. Kazacos, and M. Skyllas-Kazacos, J. Appl. Electrochem., 25, 29
(1995).4. J. Xi, Z. Wu, X. Teng, Y. Zhao, L. Chen, and X. Qiu, Journal of Materials Chemistry,
18, 1232 (2008).5. C. Sun, J. Chen, H. Zhang, X. Han, and Q. Luo, Journal of Power Sources, 195, 890
(2010).6. S. Kim, J. Yan, B. Schwenzer, J. Zhang, L. Li, J. Lui, Z. Yang, and M. Hickner,
Electrochemistry Communications, 12, 1650 (2010).7. M. W. Verbrugge and R. F. Hill, J. Phys. Chem., 92, 6778 (1988).8. M. W. Verbrugge and R. F. Hill, J. Electrochem. Soc., 137, 886 (1990).9. J. Lawton, D. S. Aaron, Z. Tang, and T. A. Zawodzinski, J. Mem. Sci., 428, 38 (2013).
10. A. A. Shah, H. Al-Fetlawi, and F. C. Walsh, Electrochimica Acta, 55, 1125 (2010).11. D. You, H. Zhang, and J. Chen, Electrochimica Acta, 54, 6827 (2009).12. A. A. Shah, M. J. Watt-Smith, and F. C. Walsh, Electrochimica Acta, 53, 8087
(2008).13. A. Tang, J. Bao, and M. Skyllas-Kazacos, J. Power Sources, 196, 10737 (2011).14. B. Schwenzer, S. Kim, M. Vijaykumar, Z. Yang, and J. Liu, J. Mem. Sci., 372, 11
(2011).15. K. W. Knehr, A. Ertan, C. R. Dennison, A. R. Kalidindi, and E. C. Kumbar, J. Elec-
trochem. Soc., 159, A1446 (2012).16. J. Crank, The Mathemaitcs of Diffusion, Oxford University Press, New York (1975).17. J. Tong and J. L. Anderson, Biophys. J., 70, 1505 (1996).18. Z. Tang and T. A. Zawodzinski (2012).19. Z. Tang, R. Keith, D. S. Aaron, J. Lawton, A. B. Papandrew, and T. A. Zawodzinski,
ECS Transactions, 41, 25 (2012).20. W. Y. Hsu and T. D. Gierke, J. Mem. Sci., 13, 307 (1983).21. R. C. Barklie, O. Girard, and O. Braddell, Journal of Physical Chemistry, 92, 1371
(1988).22. G. Pourcelly, P. Sistat, A. Chapotot, C. Gavach, and V. Nikonenko, J. Mem. Sci., 110,
69 (1996).23. M. A. Spitsyn, V. N. Andreev, V. E. Kazarinov, D. V. Kokoulina, and L. I. Krishtalik,
Elektrokhimiya, 20, 1063 (1984).24. S. J. Paddison, P. Reginald, and T. A. Zawodzinski, J. Chem. Phys., 115, 7753 (2001).25. J. S. Lawton and D. E. Budil, Journal of Physical Chemistry B, 113, 10679 (2009).26. T. A. Zawodzinski, M. Neeman, L. O. Sillerud, and S. Gottesfeld, J. Phys. Chem.,
95, 6040 (1991).27. G. Alberti, U. Costantino, M. Casciola, R. Ferroni, L. Massinelli, and P. Staiti, Solid
State Ionics, 145, 249 (2001).28. T. A. Zawodzinski, C. Derouin, S. Radzinski, R. J. Sherman, V. T. Smith,
T. E. Springer, and S. Gottesfeld, J. Electrochem. Soc., 140, 1041 (1993).
) unless CC License in place (see abstract). ecsdl.org/site/terms_use address. Redistribution subject to ECS terms of use (see 160.36.178.25Downloaded on 2015-01-08 to IP