Embed Size (px)
Citation preview
Language & Linguistics in Melanesia Vol. 35, 2017 ISSN: 0023-1959
www.langlxmelanesia.com www.langlxmelanesia.com www.langlxmelanesia.com
Journal of the Linguistic Society of Papua New Guinea
ISSN: 0023-1959
Vol. 35, 2017
Language & Linguistics in Melanesia Vol. 35, 2017 ISSN: 0023-1959
177
Effect of early language education on the academic performance of National High School (NHS) students in Papua New Guinea
Temple O.1*, Ezebilo E.2, Hane-Nou G.1, & Kamene S.1
1 – School of Humanities and Social Sciences, University of Papua New Guinea. 2 – Property Development Program, Papua New Guinea National Research Institute
*Corresponding author: Olga Temple, Linguistics, SHSS UPNG; email: [email protected]
Abstract In an effort to identify the causes of low levels of students’ academic achievement in the National High Schools (NHSs) of Papua New Guinea (PNG), this paper explores a possible effect of three factors in the students’ early language education backgrounds – 1) Age of Onset of English acquisition (AO); 2) Age at Literacy (AGELIT); and 3) Early Learning Language (ELL) – on their academic performance, measured by their English scores (%). Our 2016-2017 NHS survey yielded data on language education backgrounds of 2393/2928 (82%) of all NHS students in PNG. This information was coded and matched with the respective students’ English scores, forming our final dataset. Rigorous statistical data analysis revealed a clear link between the three predictors (AO, AGELIT, ELL) and NHS students’ academic performance.
Introduction Current government concern over ‘low and steadily declining quality of learning in basic education’
(Devete-Chee 2017) is justified: low quality of basic education ultimately translates into a serious
deficit of skilled human resources required to move the society forward, towards the stated goals of
Vision 2050. Government awareness of this situation has prompted some corrective action – the
focus on Schools of Excellence (SOEs, a.k.a. NHSs), and the implementation of Universal Basic
Education (UBE) /Tuition Fee Free Education (TFFE) in 2012. Considerable improvement in Access
and Retention were noted at PNGUpdate 2017 (Walton, G. et al; Devette-Chee, K.; Paraide, P.); yet,
Quality of learning at all levels of education remains a major, and growing, concern. This
collaborative research project sought to identify, amongst a multitude of complex socio-economic
and cultural influences, some concrete causes of this decline. We focused on three factors in NHS
students’ early language education backgrounds: the Age of Onset (AO) of English acquisition, the
Age at Literacy (AGELIT), and Early Learning Language (ELL), because the effects of these three
factors can be measured by the students’ current academic scores.
Theoretical Basis & Literature Review The widely accepted Critical Period Hypothesis (CPH) claims that human ability to acquire language is
biologically linked to age. First advanced by neurologists Wilder Penfield and Lamar Roberts in 1959,
it was refined and popularized by Eric Lenneberg – a linguist, psychologist and neuroscientist –
whose seminal work, Biological Foundations of Language (1967), sparked off a long-standing and
rigorous debate in linguistics and language acquisition over the extent to which the age factor affects
our ability to learn language. Despite limited empirical evidence (ethical considerations forbid
Language & Linguistics in Melanesia Vol. 35, 2017 ISSN: 0023-1959
178
experimenting on human babies), it is now almost axiomatic that First Language Acquisition (FLA)
becomes impossible after puberty; however, there is much less agreement on whether Second
Language Acquisition (SLA) potential is also age-dependent. Most linguists and TESOL/language
professionals argue that many complex cultural and socio-economic factors influence language
learning: biological /genetic traits, mother tongue, intelligence, learning environment, motivation,
emotions, teaching methods, etc. – the age is just one of them (Krashen, S.D. 1981; Marinova-Todd,
S.H. et al. 2000; Singleton A. 1995; 1997; 2001; 2004; 2007; Tokudome, M. 2010).
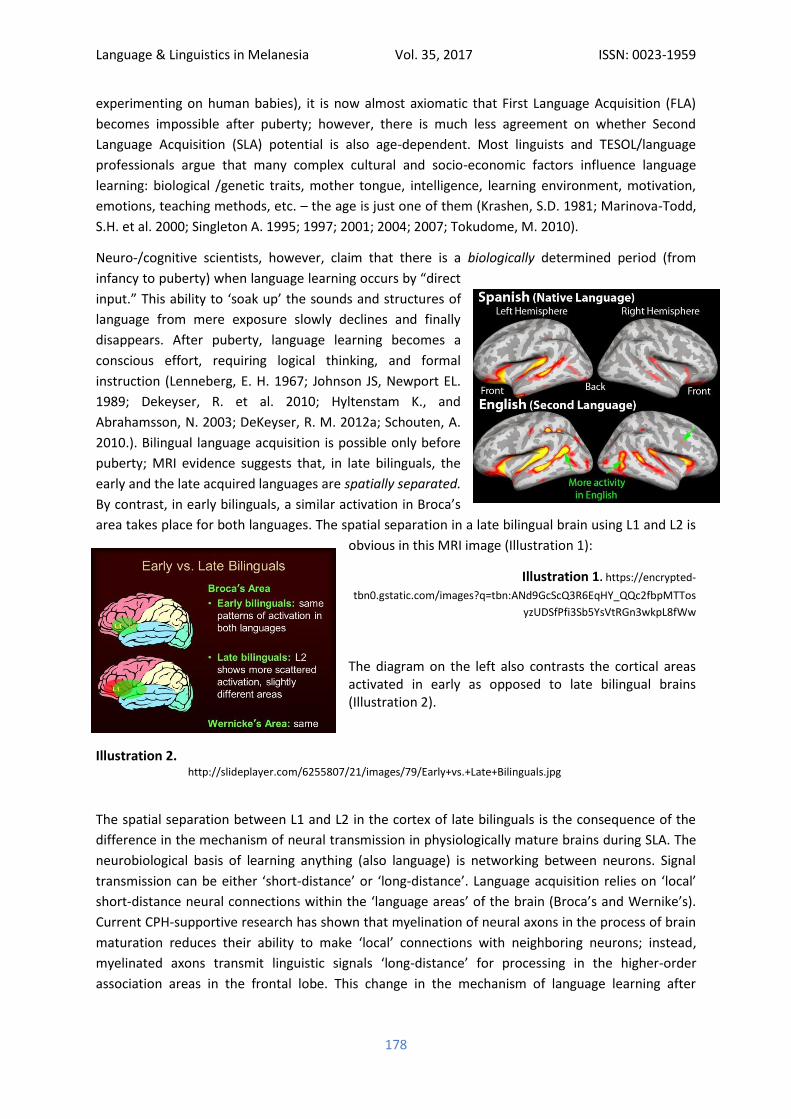
Neuro-/cognitive scientists, however, claim that there is a biologically determined period (from
infancy to puberty) when language learning occurs by “direct
input.” This ability to ‘soak up’ the sounds and structures of
language from mere exposure slowly declines and finally
disappears. After puberty, language learning becomes a
conscious effort, requiring logical thinking, and formal
instruction (Lenneberg, E. H. 1967; Johnson JS, Newport EL.
1989; Dekeyser, R. et al. 2010; Hyltenstam K., and
Abrahamsson, N. 2003; DeKeyser, R. M. 2012a; Schouten, A.
2010.). Bilingual language acquisition is possible only before
puberty; MRI evidence suggests that, in late bilinguals, the
early and the late acquired languages are spatially separated.
By contrast, in early bilinguals, a similar activation in Broca’s
area takes place for both languages. The spatial separation in a late bilingual brain using L1 and L2 is
obvious in this MRI image (Illustration 1):
Illustration 1. https://encrypted-
tbn0.gstatic.com/images?q=tbn:ANd9GcScQ3R6EqHY_QQc2fbpMTTos
yzUDSfPfi3Sb5YsVtRGn3wkpL8fWw
The diagram on the left also contrasts the cortical areas activated in early as opposed to late bilingual brains (Illustration 2).
Illustration 2. http://slideplayer.com/6255807/21/images/79/Early+vs.+Late+Bilinguals.jpg
The spatial separation between L1 and L2 in the cortex of late bilinguals is the consequence of the
difference in the mechanism of neural transmission in physiologically mature brains during SLA. The
neurobiological basis of learning anything (also language) is networking between neurons. Signal
transmission can be either ‘short-distance’ or ‘long-distance’. Language acquisition relies on ‘local’
short-distance neural connections within the ‘language areas’ of the brain (Broca’s and Wernike’s).
Current CPH-supportive research has shown that myelination of neural axons in the process of brain
maturation reduces their ability to make ‘local’ connections with neighboring neurons; instead,
myelinated axons transmit linguistic signals ‘long-distance’ for processing in the higher-order
association areas in the frontal lobe. This change in the mechanism of language learning after
Language & Linguistics in Melanesia Vol. 35, 2017 ISSN: 0023-1959
179
puberty renders ‘direct-input’ learning from mere exposure ineffective (Hyltenstam K. and
Abrahamsson, N. 2003; Temple 2016).
Over the past two decades, the CPH debate mainly centered around three issues (DeKeyser 2012a):
1. Linearity of the AO/UA (Age of Onset of SLA / Ultimate Attainment) function. Researchers on
both sides of the issue agree that there should be a breaking point in that function, to mark the
difference between pre- and post-CPH learning.
2. The relative effect size of AO, as compared to that of other variables (i.e., motivation, attitude,
quantity and quality of input, socio-economic and cultural influences, extent of schooling in L2, etc.).
Even if there is a break in the AO/UA function, it would not prove the existence of CPH, as any/all of
these other factors may cause discontinuity in the AO/UA function. Again, all researchers agree on
this point (e.g., DeKeyser & Larson-Hall, 2005; Flege, Yeni-Komshian, & Liu, 1999; Hakuta et al.,
2003).
3. The nature of maturational changes in the brain affecting UA: Both neuro-anatomical changes
and more subtle changes in cognitive functioning due to accumulated experience may play a role,
“although critics of the CPH have often equated it with a specific neurological interpretation, in
particular the link that Lenneberg [1967] made with the development of hemisphere dominance”
(DeKeyser 2012a). CPH-supportive neuroscience, however, basically equates maturation with
myelination of the brain, because it changes the neurobiological mechanisms of language acquisition
by blocking ‘short-distance’ connections between neurons within the ‘language areas’ (Hyltenstam &
Abrahamsson, 2003; Temple 2016).
Thus, the focus of most recent CPH research in the United States and Europe is on the nature of
AO/UA relationship and the possibility of attaining ‘native-like’ proficiency by late bilinguals. CPH
critics argue that, given the right conditions and teaching methodology, attainment of native-like
proficiency is, though rare, but possible at any age (Marinova-Todd 200; Tokudome 2010; Singleton
1995). This view, promoted and even championed by most linguistic societies around the world, and
advocated by major international agencies, such as UNICEF and World Bank, has influenced language
education policy in many multilingual nations around the world. It also resonated in Papua New
Guinea, where rapid socio-economic integration and change in people’s communication needs have
evoked feelings of insecurity and raised the fear of ‘losing’ the treasured vernacular languages.
Vernacular Education policy (VE), recommended by most Australian education experts at the time,
was adopted by the PNG Government in the mid-1990s; it defined Elementary education in PNG
until the end of 2012 when, under growing pressure from parents and the general public, it was
finally replaced by the Tuition Fee Free (TFF) Universal Basic Education (UBE). By mandating
vernacular-only use in the first 3-4 years of formal education, VE had effectively pushed children’s
AO of learning English to puberty, when SLA ‘becomes much more effortful with the process of
myelination in the language areas’ (Hyltenstam & Abrahamsson 2003). This is why the CPH debate
necessarily acquires a new dimension in Papua New Guinea, where Language Education policy has
far-reaching repercussions in all areas of socio-economic development and, thus, serious national
security implications. The Government of Papua New Guinea is acutely aware of the currently
prevailing low quality of education, as evidenced by the following statements in the 2009
Department of Education (DoE) National School of Excellence Policy:
Language & Linguistics in Melanesia Vol. 35, 2017 ISSN: 0023-1959
180
“Papua New Guinea (PNG) is currently experiencing some exciting as well as huge economic boom in the country as far as the Liquefied Natural Gas (LNG) project and other mining and agriculture projects are concerned. These developments will result in huge economic benefits for the country in the next 50 years and beyond. While the National Government welcomes these new economic developments taking place it is also mindful that Papua New Guinea lacks highly knowledgeable and skilled manpower in the areas of science, technical and technology. The Government realized that investments in the science, mathematics, information communication technology (ICT), chemistry, biology, geology, physics, environmental science, arts, agriculture and fisheries knowledge was lacking. The Government wants PNG to become self-reliant and advance in science, technical and technological fields. The Government wants to see its own citizens empowered to produce and sell computers, mobile phones, laptops, aero planes, ships, radios, etc. The government’s intention is for PNG to become a producer of technology and other scientific products rather than being a consumer of products imported from abroad. Therefore, in 2009, the National Executive Council (NEC) in its meeting in Wabag, Enga Province approved the National School of Excellence concept with the current National High Schools to begin the concept” (Department of Education National School of Excellence Policy, p. 4).
The goal of this study was to analyze some of the causes of NHS students’ poor academic
performance – to determine if (and if, then to what extent) the students’ AO of learning English
affected their current academic performance. As English is the language of instruction in all post-
elementary education in PNG, students’ English proficiency at the start of their Primary schooling is a
good predictor of their academic potential in later years. Thus, our concern in this study was not
with the native-likeness of NHS students’ Ultimate Attainment (UA), but rather with the functionality
of their English proficiency (and that can be measured by their English scores). Hence, we aimed to
verifiably measure the effect of 3 factors – (1) AO; (2) AGELIT; and (3) ELL – on the academic
performance of current NHS students. *
* Caveat: With these concrete goals set, we by no means underestimate the complex nature of all the chance, genetic, socio-economic, cultural and environmental influencing factors that shape human lives.
Subjects & Methods A survey of all six NHSs in PNG was conducted, using purposive sampling, from May 2016 to July
2017. A short pre-tested questionnaire (See sample in Appendix I) was used to elicit information on
(a) When, where, in which language students first learned to read & write and, crucially, (b) At what
age they learned English. Information obtained was entered into Excel spread sheets, coded and
matched with the respective students’ English scores,1 forming our final dataset. The total student
population of all six NHSs (2928 students) represents the top 5% of all Grade 10 graduates in PNG, as
only the best-performing students are selected for admission into NHSs. Thus, 82% (2393/2928) of
1 Students’ English scores for Term 1 2016/2017 were provided by the respective NHS administrations; in addition, four out of six NHSs (POMNATH, Sogeri, Aiyura and WAWIN) also provided their students’ Overall scores.
Language & Linguistics in Melanesia Vol. 35, 2017 ISSN: 0023-1959
181
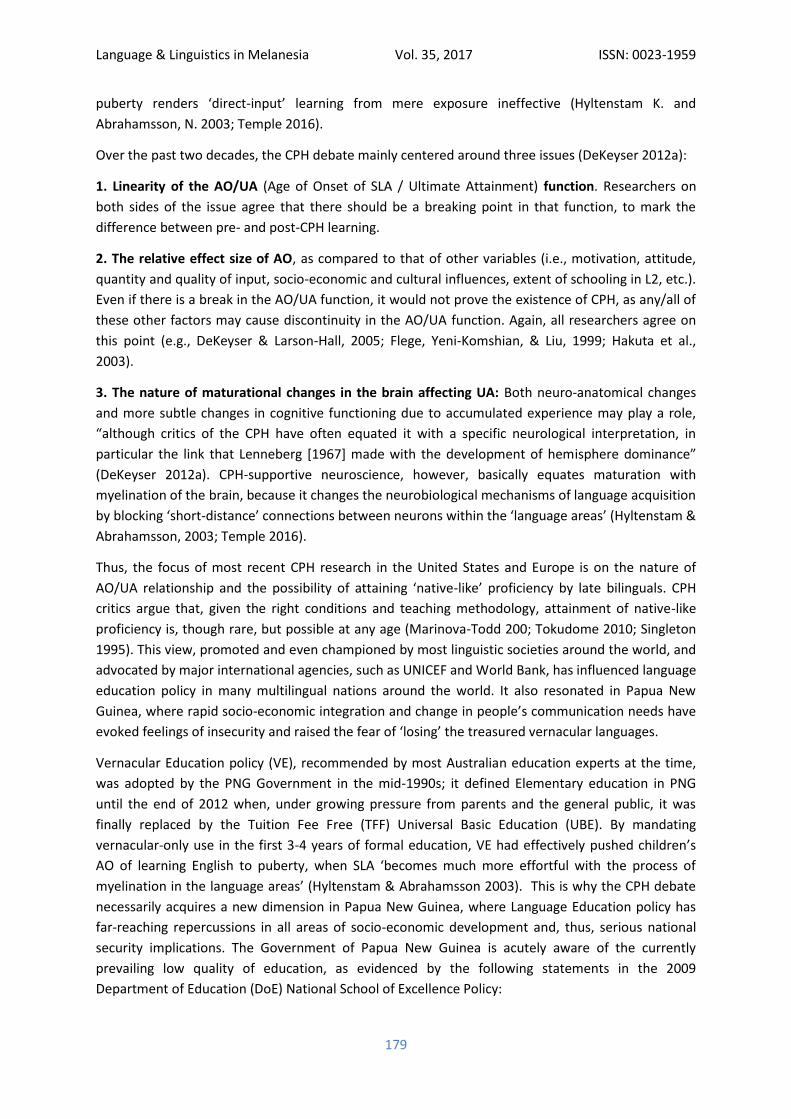
the best-performing students nation-wide responded to our questionnaire (Non-Response Rate:
18%):
SCHOOL
Response Total RRate
POMNATH G 11 279 330 85%
G 12 233 304 77%
Total 512 634 81%
SOGERI G 11 275 299 92%
G 12 267 292 91%
Total 542 591 92%
AIYURA G 11 231 290 80%
G 12 100 150 67%
Total 331 440 75%
PASSAM G 11 148 227 65%
G 12 122 157 78%
Total 270 384 70%
WAWIN G 11 155 235 66%
G 12 167 191 88%
Total 322 426 76%
KEREVAT G 11 259 268 97%
G 12 157 185 85%
Total 416 453 92%
ALL NHSs
2393 2928 82%
Fig. 1. Survey Response Rate
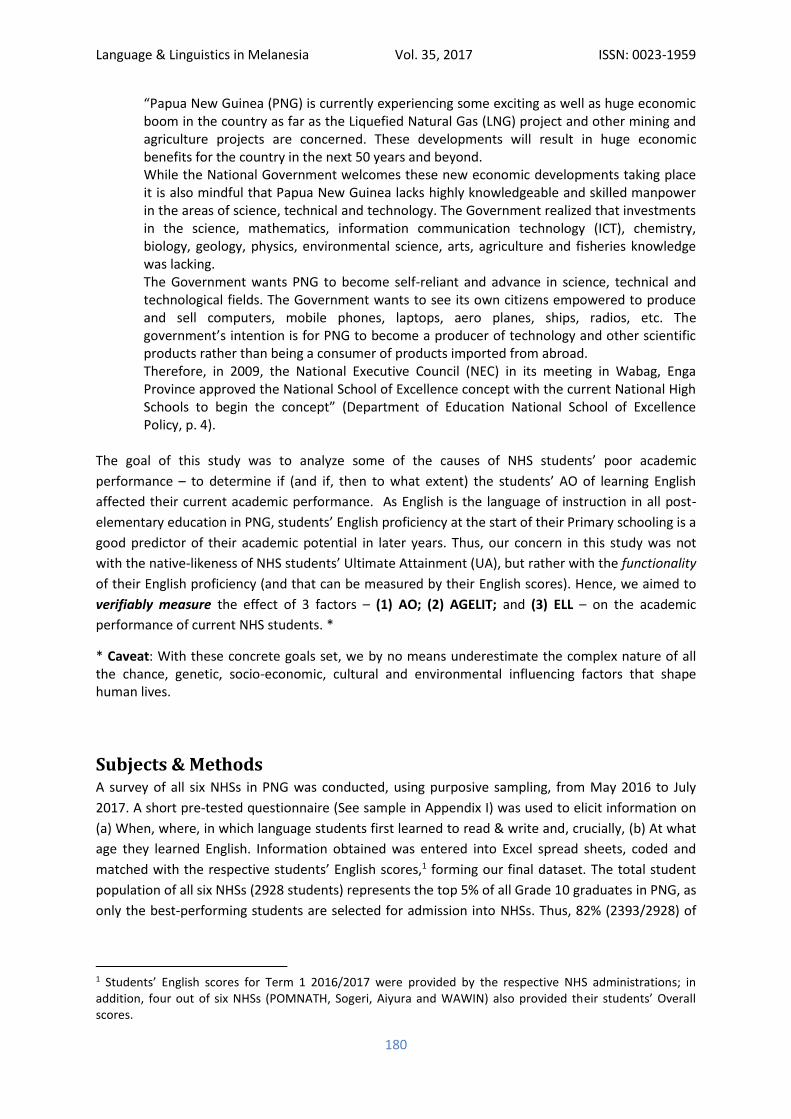
Brief Sample Description
Gender Distribution across all 6 NHSs
Female students: N = 1033 Male students: N = 1360 Total number of cases: N = 2393
Gender Parity Index: GPI = 0.76
Fig. 2 Gender Distribution
Home Language Distribution
Home language English: N = 146 Home language Tok Pisin: N = 1610 Home language Vernacular: N = 637
Fig. 3. Home Language Distribution
2393, 82%
535, 18%
Responses
No Response
Language & Linguistics in Melanesia Vol. 35, 2017 ISSN: 0023-1959
182
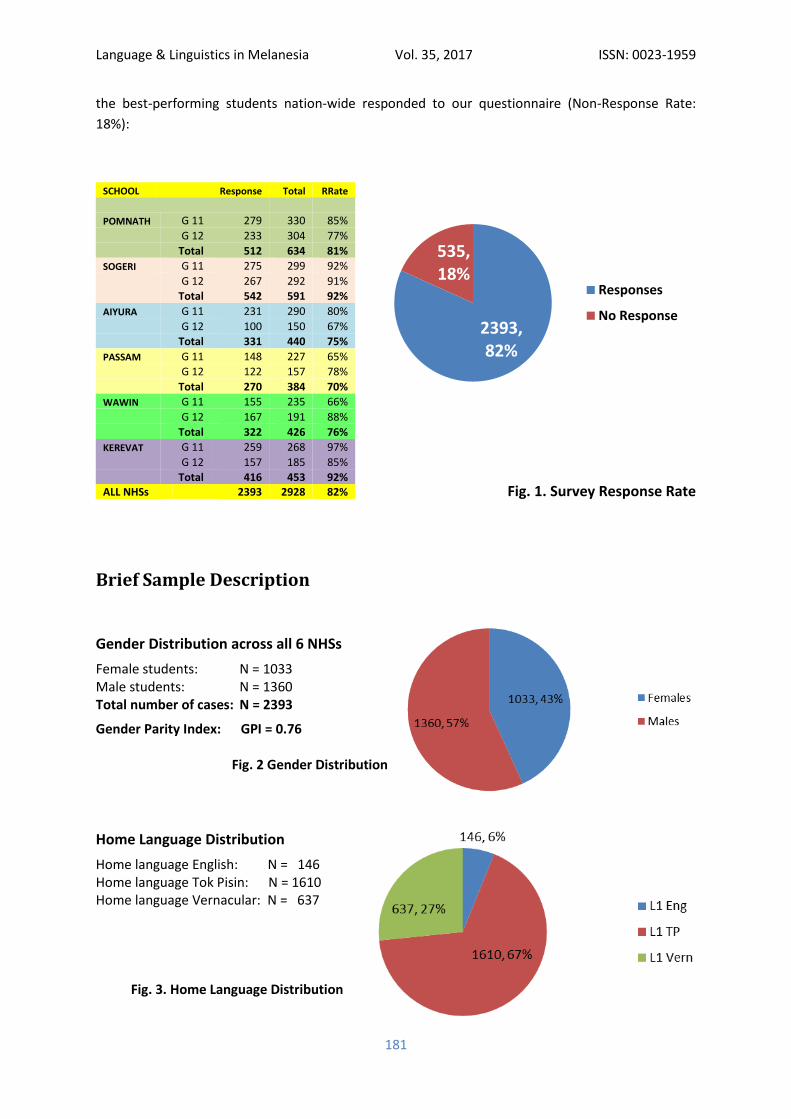
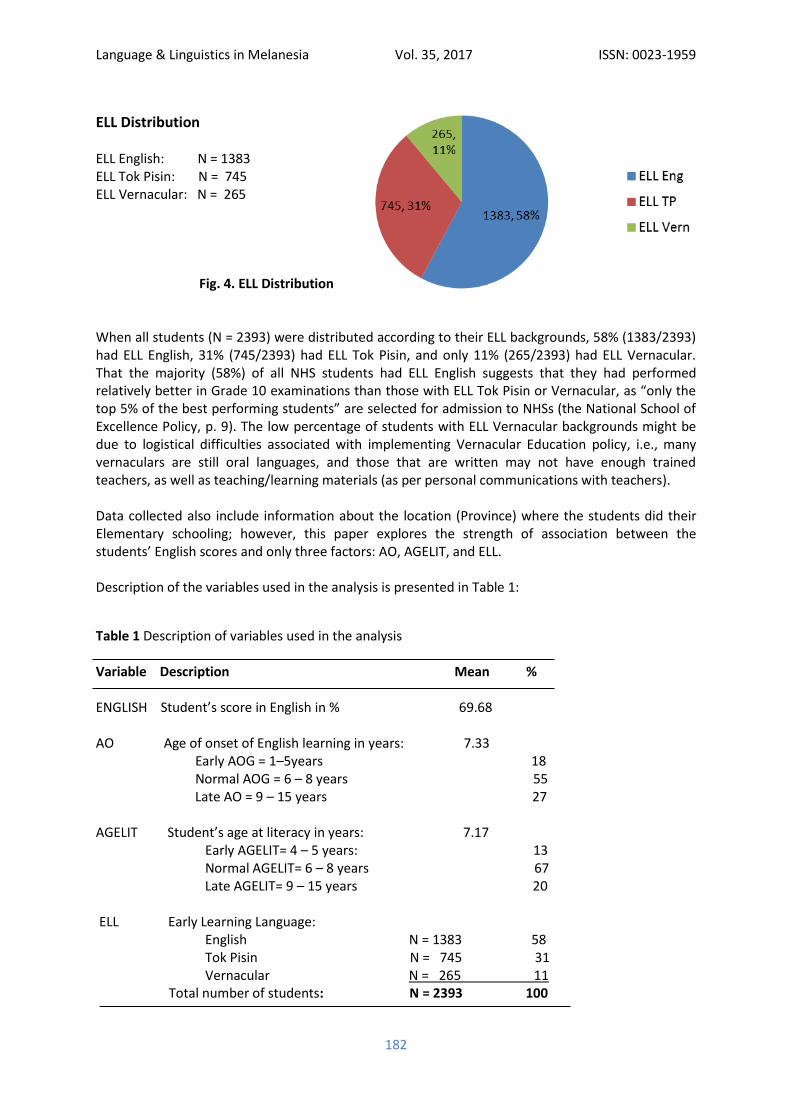
ELL Distribution ELL English: N = 1383 ELL Tok Pisin: N = 745 ELL Vernacular: N = 265
Fig. 4. ELL Distribution When all students (N = 2393) were distributed according to their ELL backgrounds, 58% (1383/2393) had ELL English, 31% (745/2393) had ELL Tok Pisin, and only 11% (265/2393) had ELL Vernacular. That the majority (58%) of all NHS students had ELL English suggests that they had performed relatively better in Grade 10 examinations than those with ELL Tok Pisin or Vernacular, as “only the top 5% of the best performing students” are selected for admission to NHSs (the National School of Excellence Policy, p. 9). The low percentage of students with ELL Vernacular backgrounds might be due to logistical difficulties associated with implementing Vernacular Education policy, i.e., many vernaculars are still oral languages, and those that are written may not have enough trained teachers, as well as teaching/learning materials (as per personal communications with teachers). Data collected also include information about the location (Province) where the students did their Elementary schooling; however, this paper explores the strength of association between the students’ English scores and only three factors: AO, AGELIT, and ELL. Description of the variables used in the analysis is presented in Table 1: Table 1 Description of variables used in the analysis Variable Description Mean % ENGLISH Student’s score in English in % 69.68 AO Age of onset of English learning in years: 7.33 Early AOG = 1–5years 18 Normal AOG = 6 – 8 years 55 Late AO = 9 – 15 years 27 AGELIT Student’s age at literacy in years: 7.17 Early AGELIT= 4 – 5 years: 13 Normal AGELIT= 6 – 8 years 67 Late AGELIT= 9 – 15 years 20 ELL Early Learning Language: English N = 1383 58 Tok Pisin N = 745 31 Vernacular N = 265 11 Total number of students: N = 2393 100
Language & Linguistics in Melanesia Vol. 35, 2017 ISSN: 0023-1959
183
Our Research Questions and Hypotheses were:
Q 1: Does AO affect NHS students’ academic performance, as measured by their English scores?
1st H0: AO has no effect on NHS students’ English scores (%). Q 2: Does AGELIT affect NHS students’ academic performance, as measured by their English scores?
2nd H0: AGELIT has no effect on NHS students’ English scores (%). Q 3: Does ELL affect NHS students’ academic performance, as measured by their English scores?
3rd H0: ELL has no effect on NHS students’ English scores (%). SPSS Version 20 software was used for descriptive statistics, comparison of means, ANOVA, correlation, linear regression and non-parametric analyses to test the validity of these hypotheses by measuring the strength of association between each of the three predictors (AO, AGELIT, and ELL) and the students’ English scores. The ordinary least squares (OLS) regression was used to examine the effect of age of onset (AO) and age at literacy (AGELIT) on individual students’ English scores. The OLS assumes that the error terms have the same variance, i.e. homoscedasticity (Verbeek, 2007). To explore whether our OLS models meet the assumption, the Breusch-Pagan tests (Greene, 2003) were conducted. The test statistic was 48.94 for AO and 37.11 for AGELIT. The critical value of chi-squared at two degrees of freedom at one percent statistical significance level was 9.21; thus, the null hypothesis of homoscedasticity was rejected. This indicates that the error terms in each of the models have unequal variance (heteroscedasticity). To correct for the heteroscedasticity, the log-log form of the OLS was explored. This involves the transformation of the variables to logarithms using the LIMDEP statistical package (Econometric Software, Inc. 2007). However, the log-log did not improve the goodness of fit (R2 and F value) of the models. For this reason, we continued the analysis with the linear form of the models. The results of the models were corrected for heteroscedasticity by means of White’s heteroscedasticity-consistent variance estimator (Greene, 2003). For ANOVA, the continuous variable AO was transformed into three AO of learning English Groups (AOG): Early (AO 1-5); Normal (AO 6-8); and Late (AO 9-15). Their percent distribution was 18%, 55%, and 27%, respectively (See Table 1). The AGELIT variable was also transformed into AGELIT Groups: Early (4-5); Normal (6-8); and Late (9-15). Their percent distribution was 13%, 67%, and 20%, respectively (See Table 1). For OLS, however, the AO and AGELIT were used as continuous variables.
Language & Linguistics in Melanesia Vol. 35, 2017 ISSN: 0023-1959
184
Findings & Discussion of Results
Tests of 1st H0 validity
1. Comparison of Means
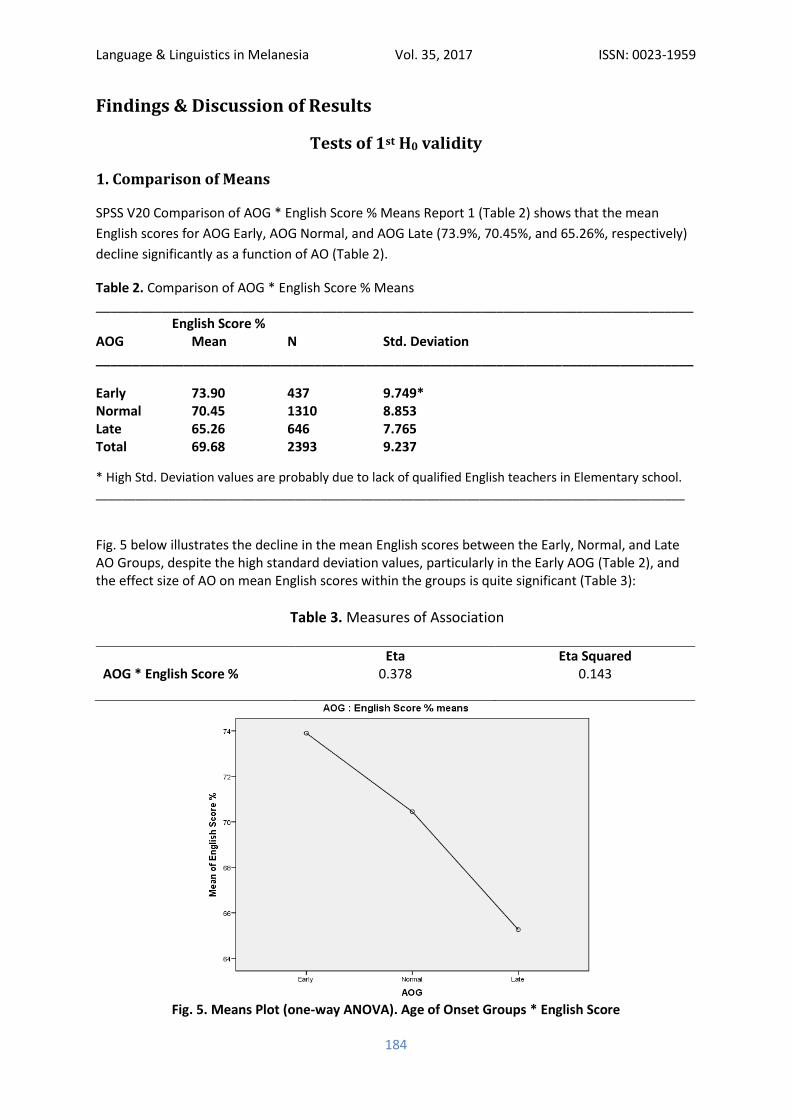
SPSS V20 Comparison of AOG * English Score % Means Report 1 (Table 2) shows that the mean
English scores for AOG Early, AOG Normal, and AOG Late (73.9%, 70.45%, and 65.26%, respectively)
decline significantly as a function of AO (Table 2).
Table 2. Comparison of AOG * English Score % Means __________________________________________________________________________________ English Score % AOG Mean N Std. Deviation __________________________________________________________________________________
Early 73.90 437 9.749* Normal 70.45 1310 8.853 Late 65.26 646 7.765 Total 69.68 2393 9.237
* High Std. Deviation values are probably due to lack of qualified English teachers in Elementary school. _________________________________________________________________________________________
Fig. 5 below illustrates the decline in the mean English scores between the Early, Normal, and Late AO Groups, despite the high standard deviation values, particularly in the Early AOG (Table 2), and the effect size of AO on mean English scores within the groups is quite significant (Table 3):
Table 3. Measures of Association
Eta Eta Squared AOG * English Score % 0.378 0.143
Fig. 5. Means Plot (one-way ANOVA). Age of Onset Groups * English Score
Language & Linguistics in Melanesia Vol. 35, 2017 ISSN: 0023-1959
185
Thus, comparison of means and ANOVA showed a medium strength association (Eta Squared = .143)
between AOG and English Score % variables, indicating a significant inverse correlation between the
age when the students started learning English, and their academic performance at NHS level.
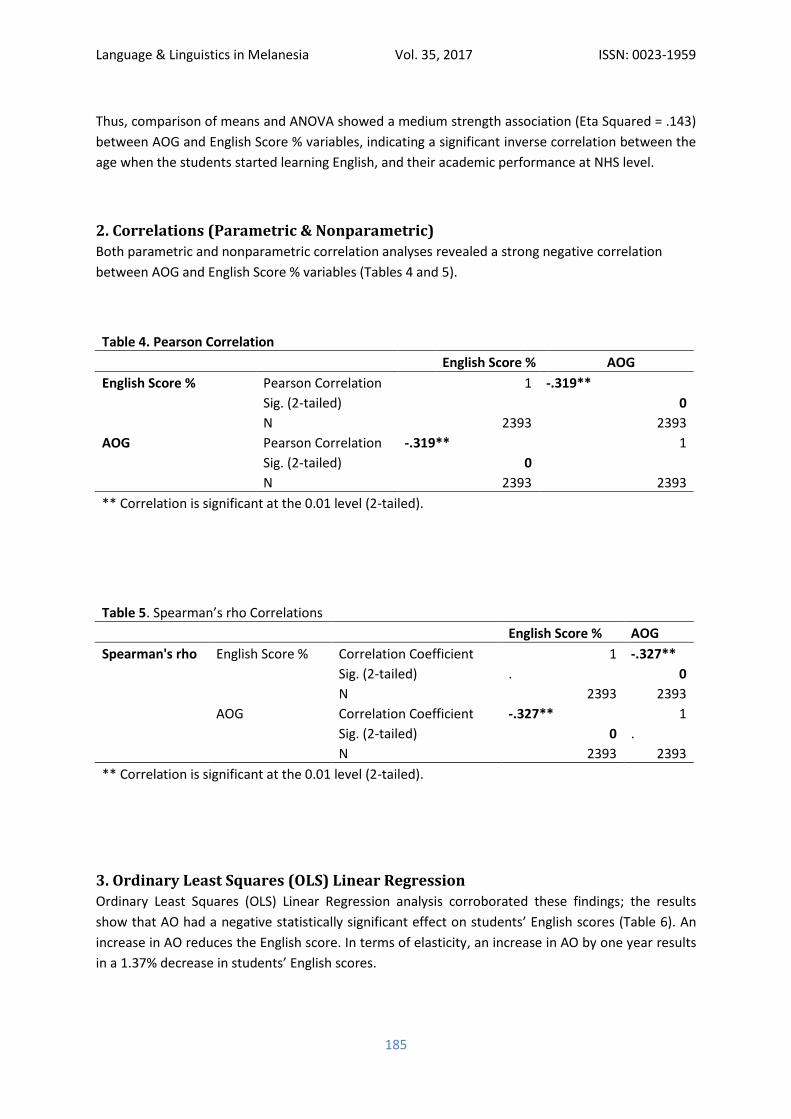
2. Correlations (Parametric & Nonparametric)
Both parametric and nonparametric correlation analyses revealed a strong negative correlation
between AOG and English Score % variables (Tables 4 and 5).
Table 4. Pearson Correlation
English Score % AOG
English Score % Pearson Correlation 1 -.319**
Sig. (2-tailed)
0
N 2393 2393
AOG Pearson Correlation -.319** 1
Sig. (2-tailed) 0
N 2393 2393
** Correlation is significant at the 0.01 level (2-tailed).
Table 5. Spearman’s rho Correlations
English Score % AOG
Spearman's rho English Score % Correlation Coefficient 1 -.327**
Sig. (2-tailed) . 0
N 2393 2393
AOG Correlation Coefficient -.327** 1
Sig. (2-tailed) 0 .
N 2393 2393
** Correlation is significant at the 0.01 level (2-tailed).
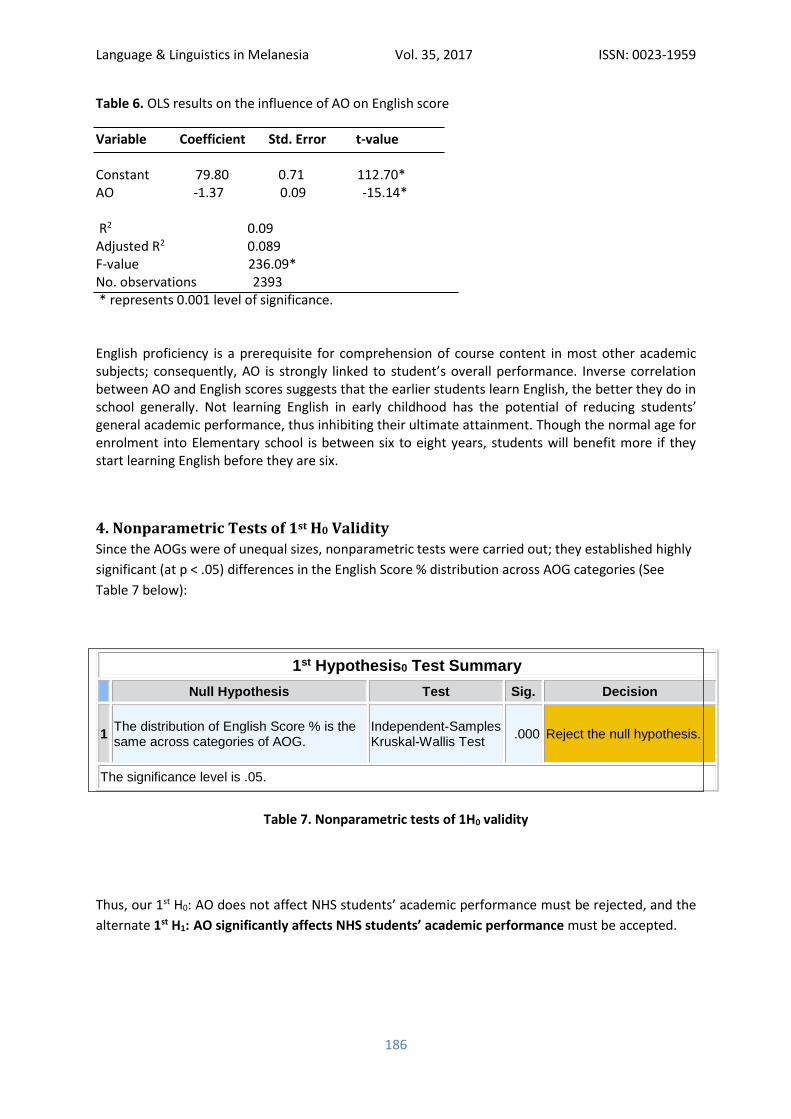
3. Ordinary Least Squares (OLS) Linear Regression
Ordinary Least Squares (OLS) Linear Regression analysis corroborated these findings; the results
show that AO had a negative statistically significant effect on students’ English scores (Table 6). An
increase in AO reduces the English score. In terms of elasticity, an increase in AO by one year results
in a 1.37% decrease in students’ English scores.
Language & Linguistics in Melanesia Vol. 35, 2017 ISSN: 0023-1959
186
Table 6. OLS results on the influence of AO on English score Variable Coefficient Std. Error t-value Constant 79.80 0.71 112.70* AO -1.37 0.09 -15.14* R2 0.09 Adjusted R2 0.089 F-value 236.09* No. observations 2393 * represents 0.001 level of significance. English proficiency is a prerequisite for comprehension of course content in most other academic subjects; consequently, AO is strongly linked to student’s overall performance. Inverse correlation between AO and English scores suggests that the earlier students learn English, the better they do in school generally. Not learning English in early childhood has the potential of reducing students’ general academic performance, thus inhibiting their ultimate attainment. Though the normal age for enrolment into Elementary school is between six to eight years, students will benefit more if they start learning English before they are six.
4. Nonparametric Tests of 1st H0 Validity
Since the AOGs were of unequal sizes, nonparametric tests were carried out; they established highly
significant (at p < .05) differences in the English Score % distribution across AOG categories (See
Table 7 below):
1st Hypothesis0 Test Summary
Null Hypothesis Test Sig. Decision
1 The distribution of English Score % is the same across categories of AOG.
Independent-Samples Kruskal-Wallis Test
.000 Reject the null hypothesis.
The significance level is .05.
Table 7. Nonparametric tests of 1H0 validity
Thus, our 1st H0: AO does not affect NHS students’ academic performance must be rejected, and the
alternate 1st H1: AO significantly affects NHS students’ academic performance must be accepted.
Language & Linguistics in Melanesia Vol. 35, 2017 ISSN: 0023-1959
187
Tests of 2nd H0 validity:
1. Comparison of Means
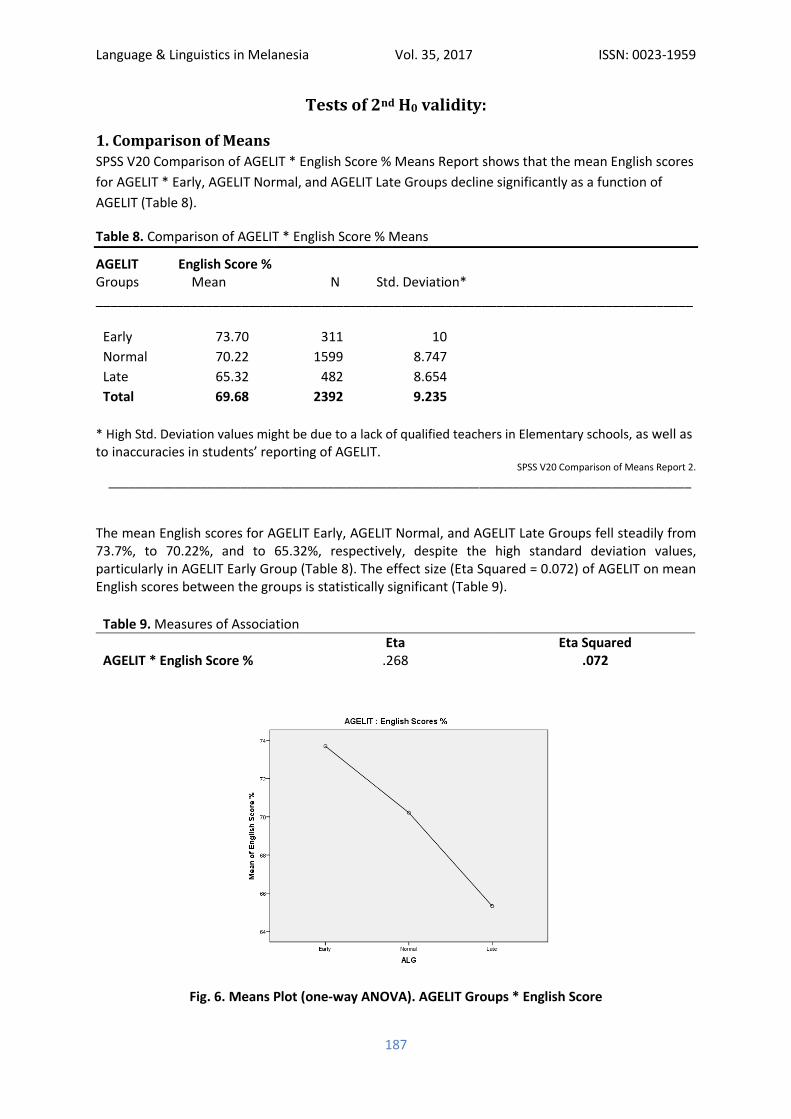
SPSS V20 Comparison of AGELIT * English Score % Means Report shows that the mean English scores
for AGELIT * Early, AGELIT Normal, and AGELIT Late Groups decline significantly as a function of
AGELIT (Table 8).
Table 8. Comparison of AGELIT * English Score % Means
AGELIT English Score % Groups Mean N Std. Deviation* __________________________________________________________________________________
Early 73.70 311 10
Normal 70.22 1599 8.747
Late 65.32 482 8.654
Total 69.68 2392 9.235
* High Std. Deviation values might be due to a lack of qualified teachers in Elementary schools, as well as to inaccuracies in students’ reporting of AGELIT.
SPSS V20 Comparison of Means Report 2.
________________________________________________________________________________________
The mean English scores for AGELIT Early, AGELIT Normal, and AGELIT Late Groups fell steadily from 73.7%, to 70.22%, and to 65.32%, respectively, despite the high standard deviation values, particularly in AGELIT Early Group (Table 8). The effect size (Eta Squared = 0.072) of AGELIT on mean English scores between the groups is statistically significant (Table 9).
Table 9. Measures of Association Eta Eta Squared AGELIT * English Score % .268 .072
Fig. 6. Means Plot (one-way ANOVA). AGELIT Groups * English Score
Language & Linguistics in Melanesia Vol. 35, 2017 ISSN: 0023-1959
188
Comparison of means and ANOVAs showed considerable strength of association (Eta Squared = .072)
between AGELIT and English Score % variables, indicating a significant inverse correlation between
the students’ age at literacy and their academic performance at NHS level.
2. Correlations (Parametric & Nonparametric)
Both parametric and nonparametric correlation analyses conducted indicated a significant negative
correlation between AGELIT and English Score % variables (Tables 10 and 11).
Table 10. Pearson Correlation
English Score % AGELIT Groups
English Score % Pearson Correlation 1 -.266**
Sig. (2-tailed)
0
N 2393 2392
AGELIT Groups Pearson Correlation -.266** 1
Sig. (2-tailed) 0
N 2392 2392
** Correlation is significant at the 0.01 level (2-tailed).
Table 11. Spearman’s rho correlation
English Score % AGELIT
Spearman's rho English Score % Correlation Coefficient 1 -.264**
Sig. (2-tailed) . 0
N 2393 2392
AGELIT Groups Correlation Coefficient -.264** 1
Sig. (2-tailed) 0 .
N 2392 2392
** Correlation is significant at the 0.01 level (2-tailed).
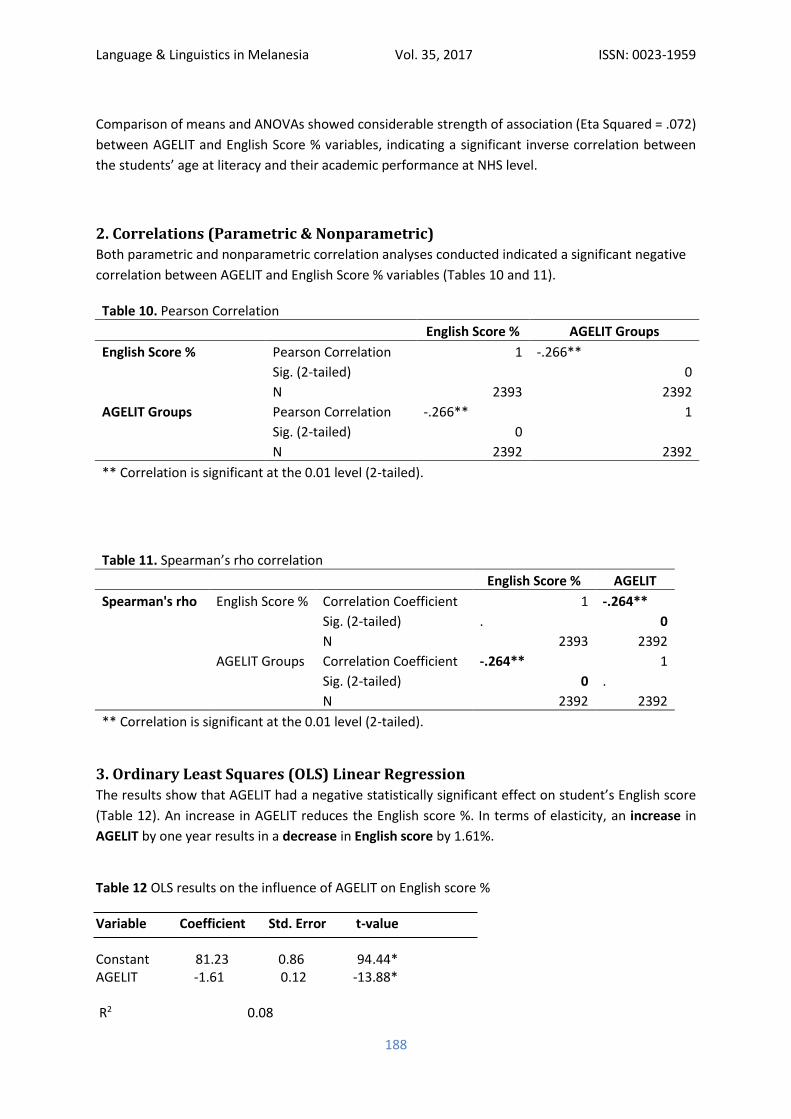
3. Ordinary Least Squares (OLS) Linear Regression
The results show that AGELIT had a negative statistically significant effect on student’s English score
(Table 12). An increase in AGELIT reduces the English score %. In terms of elasticity, an increase in
AGELIT by one year results in a decrease in English score by 1.61%.
Table 12 OLS results on the influence of AGELIT on English score % Variable Coefficient Std. Error t-value Constant 81.23 0.86 94.44* AGELIT -1.61 0.12 -13.88* R2 0.08
Language & Linguistics in Melanesia Vol. 35, 2017 ISSN: 0023-1959
189
Adjusted R2 0.08 F-value 198.07* No. observations 2393 * represents 0.001 level of significance.
If children are not taught to read and write in early childhood, their learning potential is likely to decrease. Therefore, students will benefit most, if they acquire English literacy skills in Elementary Prep or earlier, before they enrol into Primary school. Apart from potentially promoting learning among primary school pupils, this would also reduce the work burden of primary school teachers, and allow them to focus more on the actual content of the subjects they teach.
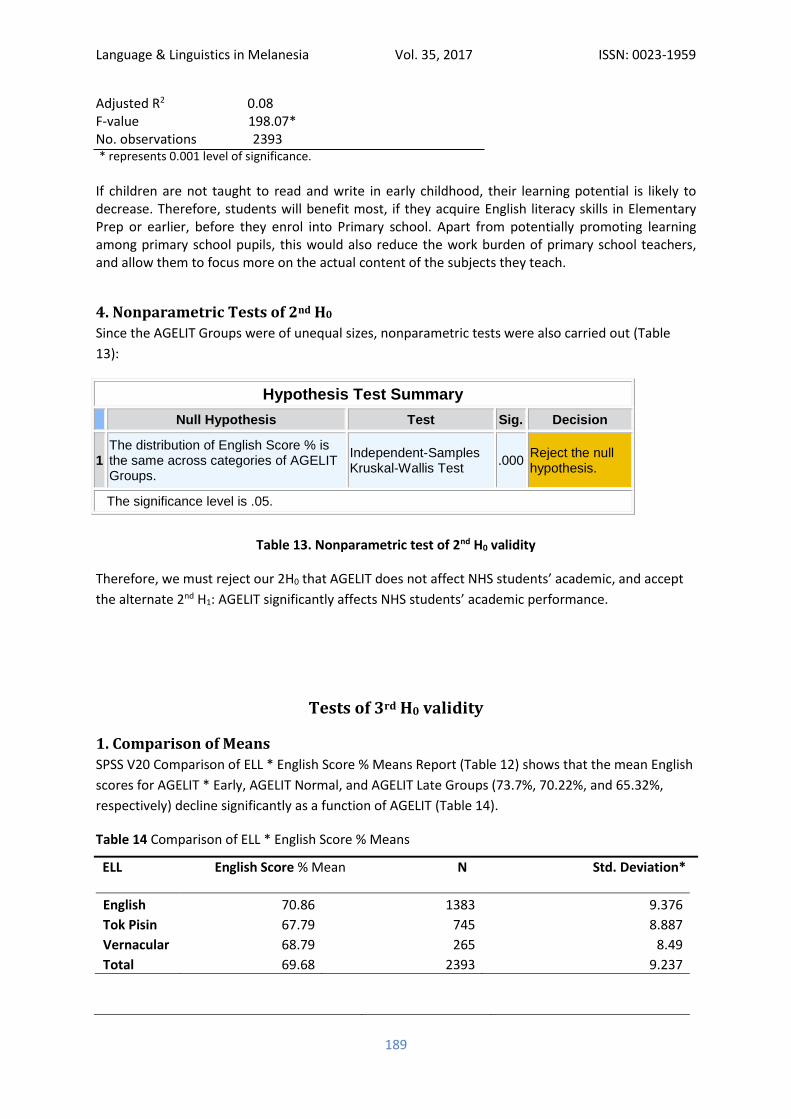
4. Nonparametric Tests of 2nd H0
Since the AGELIT Groups were of unequal sizes, nonparametric tests were also carried out (Table
13):
Hypothesis Test Summary
Null Hypothesis Test Sig. Decision
1 The distribution of English Score % is the same across categories of AGELIT Groups.
Independent-Samples Kruskal-Wallis Test
.000 Reject the null hypothesis.
The significance level is .05.
Table 13. Nonparametric test of 2nd H0 validity
Therefore, we must reject our 2H0 that AGELIT does not affect NHS students’ academic, and accept
the alternate 2nd H1: AGELIT significantly affects NHS students’ academic performance.
Tests of 3rd H0 validity
1. Comparison of Means
SPSS V20 Comparison of ELL * English Score % Means Report (Table 12) shows that the mean English
scores for AGELIT * Early, AGELIT Normal, and AGELIT Late Groups (73.7%, 70.22%, and 65.32%,
respectively) decline significantly as a function of AGELIT (Table 14).
Table 14 Comparison of ELL * English Score % Means
ELL English Score % Mean N Std. Deviation*
English 70.86 1383 9.376
Tok Pisin 67.79 745 8.887
Vernacular 68.79 265 8.49
Total 69.68 2393 9.237
Language & Linguistics in Melanesia Vol. 35, 2017 ISSN: 0023-1959
190
Table 15 Measures of Association
Eta Eta Squared
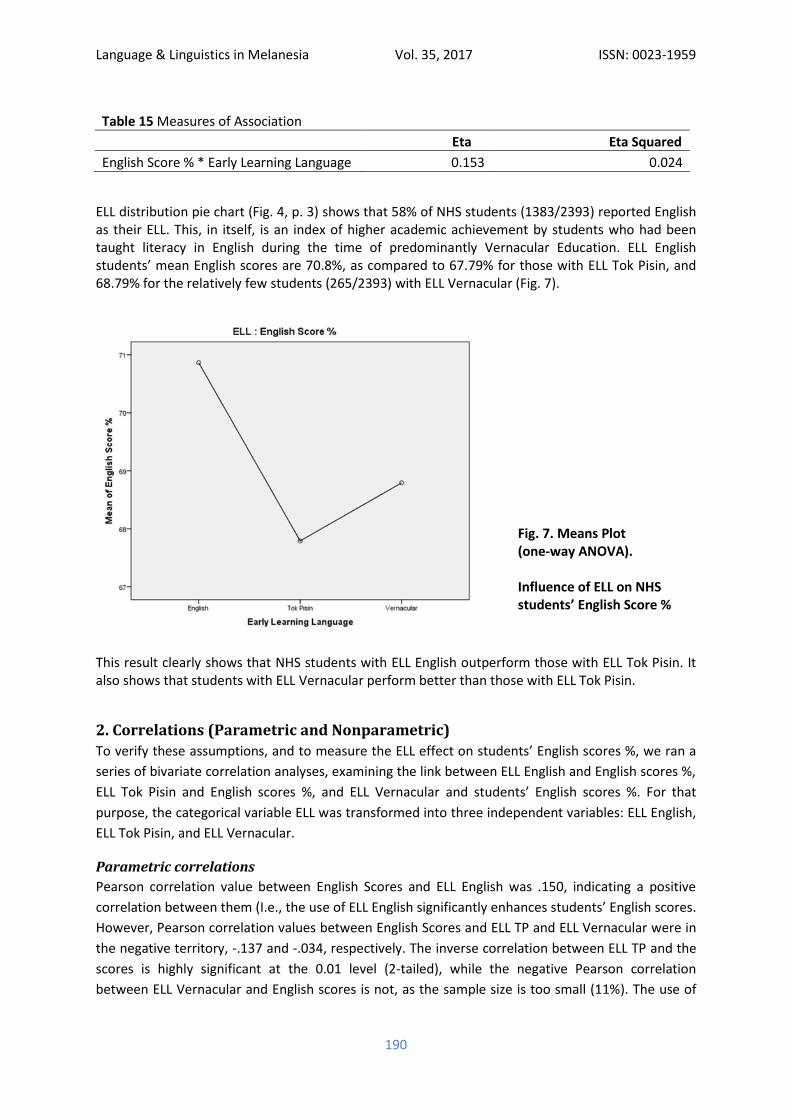
English Score % * Early Learning Language 0.153 0.024
ELL distribution pie chart (Fig. 4, p. 3) shows that 58% of NHS students (1383/2393) reported English as their ELL. This, in itself, is an index of higher academic achievement by students who had been taught literacy in English during the time of predominantly Vernacular Education. ELL English students’ mean English scores are 70.8%, as compared to 67.79% for those with ELL Tok Pisin, and 68.79% for the relatively few students (265/2393) with ELL Vernacular (Fig. 7).
Fig. 7. Means Plot (one-way ANOVA). Influence of ELL on NHS students’ English Score %
This result clearly shows that NHS students with ELL English outperform those with ELL Tok Pisin. It also shows that students with ELL Vernacular perform better than those with ELL Tok Pisin.
2. Correlations (Parametric and Nonparametric)
To verify these assumptions, and to measure the ELL effect on students’ English scores %, we ran a
series of bivariate correlation analyses, examining the link between ELL English and English scores %,
ELL Tok Pisin and English scores %, and ELL Vernacular and students’ English scores %. For that
purpose, the categorical variable ELL was transformed into three independent variables: ELL English,
ELL Tok Pisin, and ELL Vernacular.
Parametric correlations
Pearson correlation value between English Scores and ELL English was .150, indicating a positive
correlation between them (I.e., the use of ELL English significantly enhances students’ English scores.
However, Pearson correlation values between English Scores and ELL TP and ELL Vernacular were in
the negative territory, -.137 and -.034, respectively. The inverse correlation between ELL TP and the
scores is highly significant at the 0.01 level (2-tailed), while the negative Pearson correlation
between ELL Vernacular and English scores is not, as the sample size is too small (11%). The use of
Language & Linguistics in Melanesia Vol. 35, 2017 ISSN: 0023-1959
191
ELL Tok Pisin clearly appears to have the more negative effect on the students’ academic
performance.
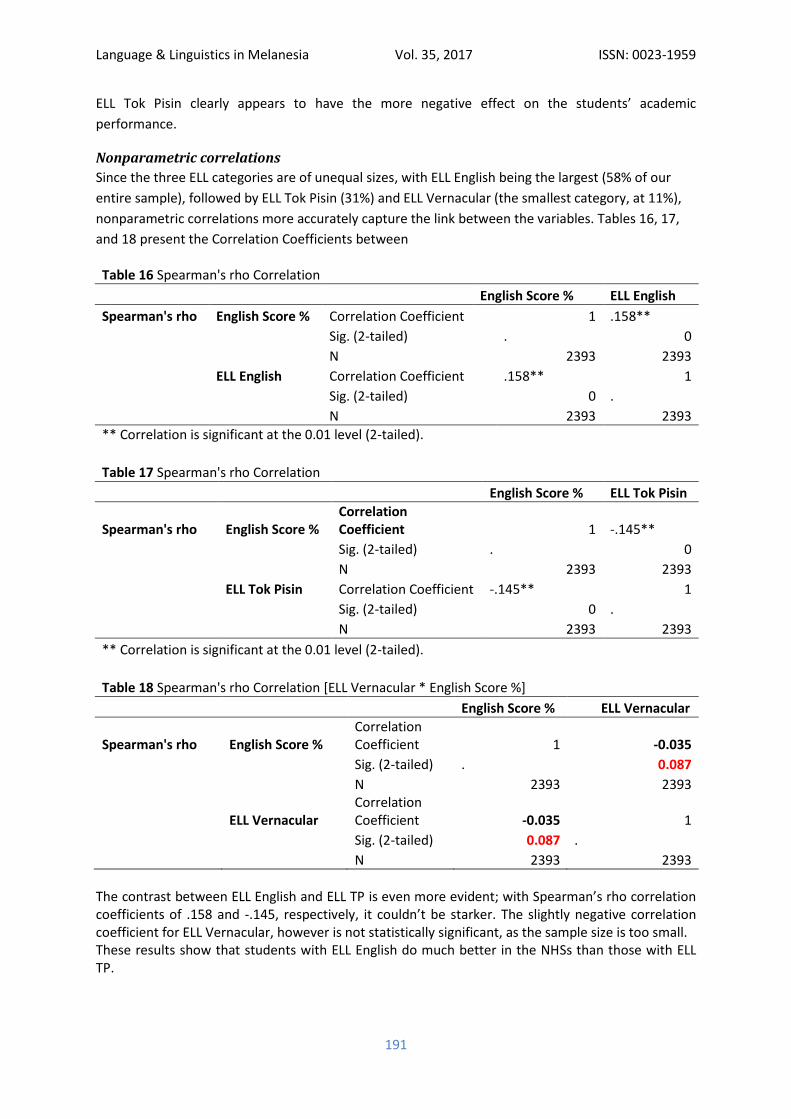
Nonparametric correlations
Since the three ELL categories are of unequal sizes, with ELL English being the largest (58% of our
entire sample), followed by ELL Tok Pisin (31%) and ELL Vernacular (the smallest category, at 11%),
nonparametric correlations more accurately capture the link between the variables. Tables 16, 17,
and 18 present the Correlation Coefficients between
Table 16 Spearman's rho Correlation
English Score % ELL English
Spearman's rho English Score % Correlation Coefficient 1 .158**
Sig. (2-tailed) . 0
N 2393 2393
ELL English Correlation Coefficient .158** 1
Sig. (2-tailed) 0 .
N 2393 2393
** Correlation is significant at the 0.01 level (2-tailed).
Table 17 Spearman's rho Correlation
English Score % ELL Tok Pisin
Spearman's rho English Score % Correlation Coefficient 1 -.145**
Sig. (2-tailed) . 0
N 2393 2393
ELL Tok Pisin Correlation Coefficient -.145** 1
Sig. (2-tailed) 0 .
N 2393 2393
** Correlation is significant at the 0.01 level (2-tailed).
Table 18 Spearman's rho Correlation [ELL Vernacular * English Score %]
English Score % ELL Vernacular
Spearman's rho English Score % Correlation Coefficient 1 -0.035
Sig. (2-tailed) . 0.087
N 2393 2393
ELL Vernacular
Correlation Coefficient -0.035 1
Sig. (2-tailed) 0.087 .
N 2393 2393
The contrast between ELL English and ELL TP is even more evident; with Spearman’s rho correlation coefficients of .158 and -.145, respectively, it couldn’t be starker. The slightly negative correlation coefficient for ELL Vernacular, however is not statistically significant, as the sample size is too small. These results show that students with ELL English do much better in the NHSs than those with ELL TP.
Language & Linguistics in Melanesia Vol. 35, 2017 ISSN: 0023-1959
192
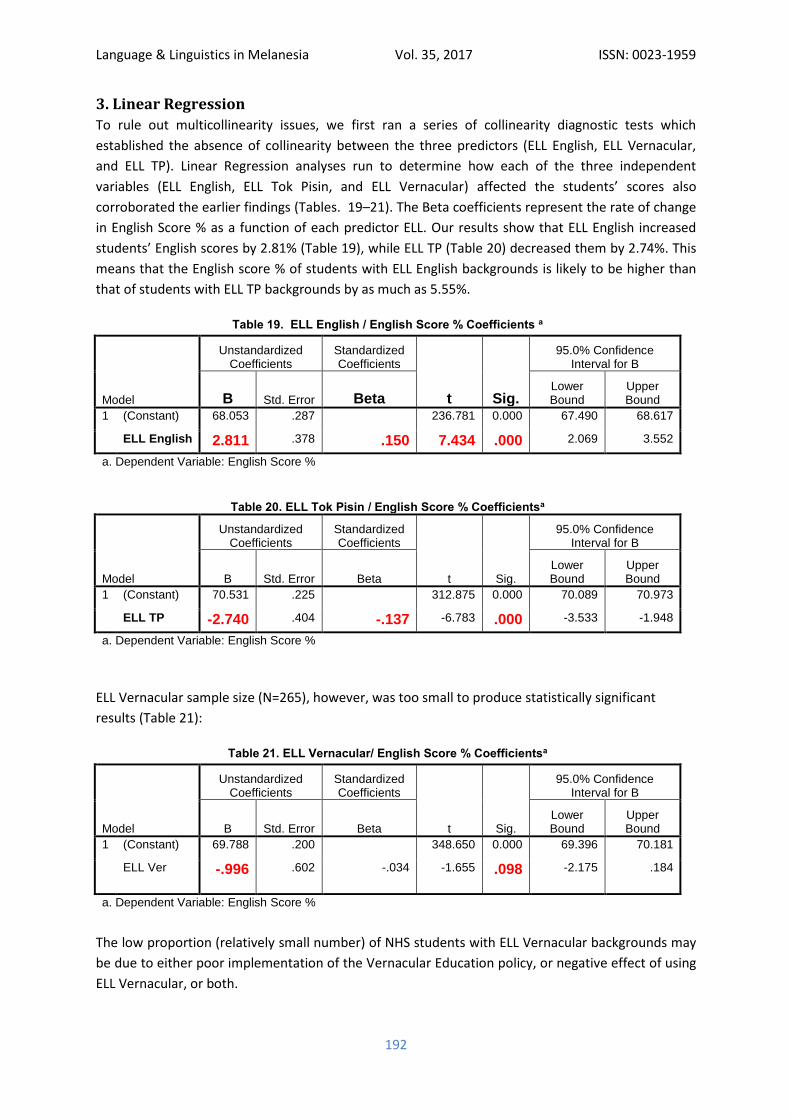
3. Linear Regression
To rule out multicollinearity issues, we first ran a series of collinearity diagnostic tests which
established the absence of collinearity between the three predictors (ELL English, ELL Vernacular,
and ELL TP). Linear Regression analyses run to determine how each of the three independent
variables (ELL English, ELL Tok Pisin, and ELL Vernacular) affected the students’ scores also
corroborated the earlier findings (Tables. 19–21). The Beta coefficients represent the rate of change
in English Score % as a function of each predictor ELL. Our results show that ELL English increased
students’ English scores by 2.81% (Table 19), while ELL TP (Table 20) decreased them by 2.74%. This
means that the English score % of students with ELL English backgrounds is likely to be higher than
that of students with ELL TP backgrounds by as much as 5.55%.
Table 19. ELL English / English Score % Coefficients a
Model
Unstandardized Coefficients
Standardized Coefficients
t Sig.
95.0% Confidence Interval for B
B Std. Error Beta Lower Bound
Upper Bound
1 (Constant) 68.053 .287 236.781 0.000 67.490 68.617
ELL English 2.811 .378 .150 7.434 .000 2.069 3.552
a. Dependent Variable: English Score %
Table 20. ELL Tok Pisin / English Score % Coefficientsa
Model
Unstandardized Coefficients
Standardized Coefficients
t Sig.
95.0% Confidence Interval for B
B Std. Error Beta Lower Bound
Upper Bound
1 (Constant) 70.531 .225 312.875 0.000 70.089 70.973
ELL TP -2.740 .404 -.137 -6.783 .000 -3.533 -1.948
a. Dependent Variable: English Score %
ELL Vernacular sample size (N=265), however, was too small to produce statistically significant
results (Table 21):
Table 21. ELL Vernacular/ English Score % Coefficientsa
Model
Unstandardized Coefficients
Standardized Coefficients
t Sig.
95.0% Confidence Interval for B
B Std. Error Beta Lower Bound
Upper Bound
1 (Constant) 69.788 .200 348.650 0.000 69.396 70.181
ELL Ver -.996 .602 -.034 -1.655 .098 -2.175 .184
a. Dependent Variable: English Score %
The low proportion (relatively small number) of NHS students with ELL Vernacular backgrounds may
be due to either poor implementation of the Vernacular Education policy, or negative effect of using
ELL Vernacular, or both.
Language & Linguistics in Melanesia Vol. 35, 2017 ISSN: 0023-1959
193
Linear Regression results therefore indicate that ELL English benefits the students most, as it gives
them those English skills they need in order to do well at all subsequent stages of their formal
education.
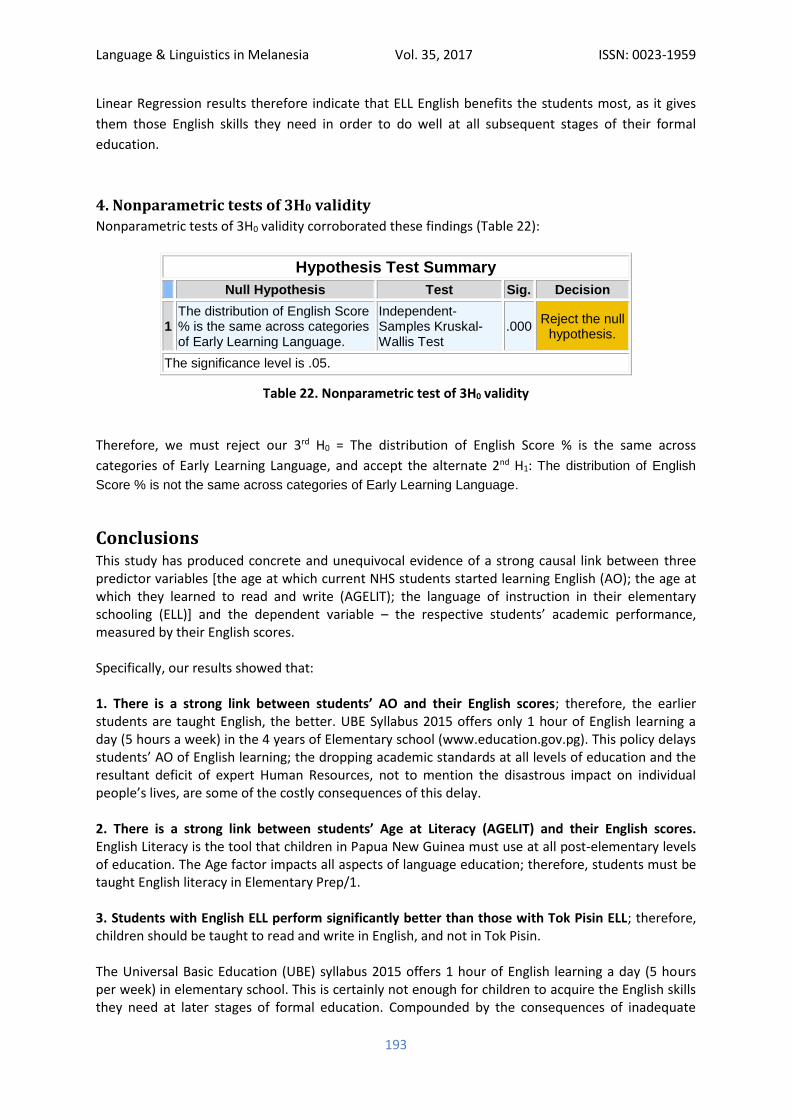
4. Nonparametric tests of 3H0 validity
Nonparametric tests of 3H0 validity corroborated these findings (Table 22):
Hypothesis Test Summary
Null Hypothesis Test Sig. Decision
1 The distribution of English Score % is the same across categories of Early Learning Language.
Independent-Samples Kruskal-Wallis Test
.000 Reject the null
hypothesis.
The significance level is .05.
Table 22. Nonparametric test of 3H0 validity
Therefore, we must reject our 3rd H0 = The distribution of English Score % is the same across
categories of Early Learning Language, and accept the alternate 2nd H1: The distribution of English
Score % is not the same across categories of Early Learning Language.
Conclusions This study has produced concrete and unequivocal evidence of a strong causal link between three predictor variables [the age at which current NHS students started learning English (AO); the age at which they learned to read and write (AGELIT); the language of instruction in their elementary schooling (ELL)] and the dependent variable – the respective students’ academic performance, measured by their English scores. Specifically, our results showed that: 1. There is a strong link between students’ AO and their English scores; therefore, the earlier students are taught English, the better. UBE Syllabus 2015 offers only 1 hour of English learning a day (5 hours a week) in the 4 years of Elementary school (www.education.gov.pg). This policy delays students’ AO of English learning; the dropping academic standards at all levels of education and the resultant deficit of expert Human Resources, not to mention the disastrous impact on individual people’s lives, are some of the costly consequences of this delay. 2. There is a strong link between students’ Age at Literacy (AGELIT) and their English scores. English Literacy is the tool that children in Papua New Guinea must use at all post-elementary levels of education. The Age factor impacts all aspects of language education; therefore, students must be taught English literacy in Elementary Prep/1. 3. Students with English ELL perform significantly better than those with Tok Pisin ELL; therefore, children should be taught to read and write in English, and not in Tok Pisin. The Universal Basic Education (UBE) syllabus 2015 offers 1 hour of English learning a day (5 hours per week) in elementary school. This is certainly not enough for children to acquire the English skills they need at later stages of formal education. Compounded by the consequences of inadequate
Language & Linguistics in Melanesia Vol. 35, 2017 ISSN: 0023-1959
194
teacher education, the lack of focus on teaching English from Elementary Prep onwards results in students’ low academic performance at primary, secondary, and tertiary levels of education.
Potential strategies for moving quality of education forward Three facets of the multifaceted and complex problem should be addressed by policy-makers as a matter of priority: Elementary School Curriculum: The main objective of the Elementary school curriculum should be to equip the children with the English skills required in post-elementary education. To achieve this goal, English should be used as the language of instruction right from Elementary Prep, when children are more receptive to language learning (direct-input learning ability decreases with age). Local Tok Ples should be used as an aid in learning English. To promote social cohesion and integration, local Tok Ples should be taught to all students (not just wantoks) as a subject, 1 hour a day. Teacher Training: Adequate investment in teacher training must be made, to ensure that all PNG teachers have the knowledge and means necessary to teach effectively. Teacher training is key to improving the quality of education in PNG. Teacher motivation: By shaping the minds of children, teachers shape the future of our society. They must be given quality teacher training opportunities and proper incentives (remuneration and benefits) to perform to the best of their ability. These measures will also serve to attract talented people to the teaching profession. A delay in learning English has proven to be too costly for PNG students, their families, and the entire nation. English proficiency is a prerequisite for all learning in PNG High schools, colleges and universities. Equipping children with English skills at a young age will enhance their academic performance in post-elementary education and, thus, enable them to contribute meaningfully to the socio-economic development of Papua New Guinea.
Specific Recommendations
The Government must invest in education, to ensure that – Teacher-training colleges produce adequate numbers of quality English teachers to service
all elementary schools; – Incentives (i.e., better salaries and allowances, housing, health insurance, etc.) must be used
to raise the social status of teachers and attract the best minds to the teaching profession – Supply of quality teaching/learning materials satisfies the demand for them in rural, as well
as urban areas; – School infrastructure is adequate.
Bilingual education is definitely recommended, but with emphasis on English acquisition; local vernaculars should be used as an aid to English instruction; they should also be taught as a subject, to promote social cohesion in Papua New Guinea.
Language & Linguistics in Melanesia Vol. 35, 2017 ISSN: 0023-1959
195
Final Comments We recognize the complexity of the issues at hand, so well described by Carmen Miñoz:
“… the vast number of studies on age effects conducted in recent decades has enriched our
knowledge of the age factor while revealing a complexity that is greater than previously suspected.
In that respect, researchers from different perspectives have argued that initial age of learning may
be considered a macrovariable that includes, among other factors, state of neurobiological
maturation, stage of cognitive development, levels of L1 proficiency, L1 and L2 use, and language
dominance. In addition, a number of factors, such as the socio-cultural context, the quality of the L2
learning experience, and learners’ attitudes and orientations have been observed to combine with
initial age of learning, resulting in differences in L2 attainment. Hence, research is needed that
integrates quantitative and qualitative methods in order to better grasp the individual and social
determinants that interplay with age of learning. In the end, the isolation of age effects on L2
acquisition may be neither possible nor the most adequate aim in age-related investigation”
(Carmen Miñoz: Age Effects in SLA; Routledge Encyclopedia of SLA 2013, p. 14).
We agree that combining both quantitative and qualitative research methods would enhance our
understanding of the situation. However large research projects require a lot of collective effort and
adequate funding. We hope that a larger study of this kind will become feasible in the not-too-
distant future.
Acknowledgements:
This study would not have been possible without the cooperation of all the NHS students and the
support of the Principals (as well as Deputy Principals and teachers) of all six National High Schools in
Papua New Guinea. We are particularly grateful to Mr. Mathew Maito (Deputy Principal,
POMNATH); Mr. Ray Alo (Principal, KEREVAT); Mr. Kerembo (Principal, SOGERI); Mr. Bakavi
(Principal, PASSAM); Mr. Samson Pitiki (Deputy Principal, AYURA); Mr. Pu (Principal, WAWIN).
Language & Linguistics in Melanesia Vol. 35, 2017 ISSN: 0023-1959
196
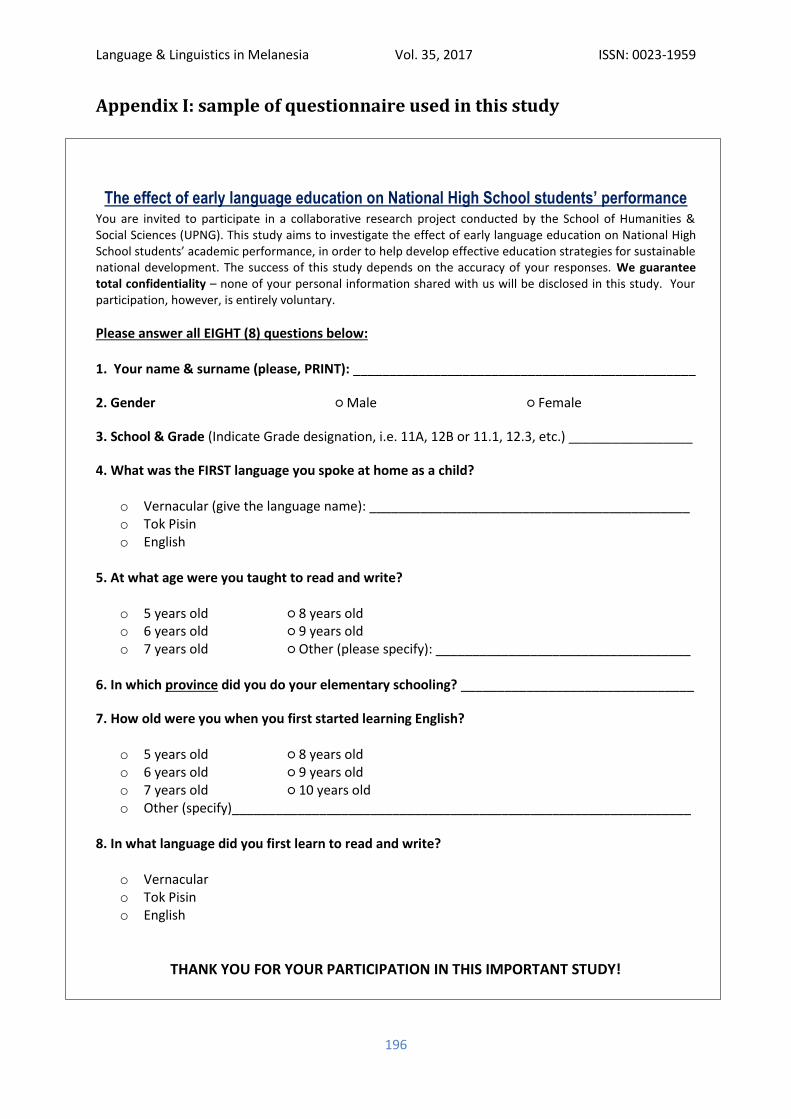
Appendix I: sample of questionnaire used in this study
The effect of early language education on National High School students’ performance You are invited to participate in a collaborative research project conducted by the School of Humanities & Social Sciences (UPNG). This study aims to investigate the effect of early language education on National High School students’ academic performance, in order to help develop effective education strategies for sustainable national development. The success of this study depends on the accuracy of your responses. We guarantee total confidentiality – none of your personal information shared with us will be disclosed in this study. Your participation, however, is entirely voluntary.
Please answer all EIGHT (8) questions below: 1. Your name & surname (please, PRINT): _______________________________________________
2. Gender ○ Male ○ Female
3. School & Grade (Indicate Grade designation, i.e. 11A, 12B or 11.1, 12.3, etc.) _________________
4. What was the FIRST language you spoke at home as a child?
o Vernacular (give the language name): ____________________________________________ o Tok Pisin o English
5. At what age were you taught to read and write?
o 5 years old ○ 8 years old o 6 years old ○ 9 years old o 7 years old ○ Other (please specify): ___________________________________
6. In which province did you do your elementary schooling? ________________________________
7. How old were you when you first started learning English?
o 5 years old ○ 8 years old o 6 years old ○ 9 years old o 7 years old ○ 10 years old o Other (specify)_______________________________________________________________
8. In what language did you first learn to read and write?
o Vernacular o Tok Pisin o English
THANK YOU FOR YOUR PARTICIPATION IN THIS IMPORTANT STUDY!
Language & Linguistics in Melanesia Vol. 35, 2017 ISSN: 0023-1959
197
References Abrahamsson, N., & Hyltenstam, K. 2009. Age of onset and nativelikeness in a second language:
Listener perception versus linguistic scrutiny. Language Learning, 59, 249–306 Bialystok, E. & Hakuta, K. 1999. Confounded Age: Linguistic and Cognitive Factors in Age Differences
for Second Language Acquisition. Ch. 7 in Birdsong, D. (Ed.) 1999. Second Language Acquisition and the Critical Period Hypothesis. Mahwah, NJ: Lawrence Erlbaum Associates ISBN 0-8058-3084-7. (pp. 161-181)
Birdsong, D. (Ed.) 1999. Second Language Acquisition and the Critical Period Hypothesis. Mahwah, NJ: Lawrence Erlbaum Associates ISBN 0-8058-3084-7
Birdsong, D. 2006. Age and second language acquisition and processing: A selective overview. Language Learning, 56, 9-49. doi: 10.1111/j.1467-9922.2006.00353.x
DeKeyser, R. M., & Larson-Hall, J. (2005). What does the critical period really mean? In J. F. Kroll & A. M. B. de Groot (Eds.), Handbook of bilingualism: Psycholinguistic approaches (pp. 89–108). Oxford, UK: Oxford University Press.
DeKeyser, R. M. 2009. Cognitive-psychological processes in second language learning. In M. H. Long & C. J. Doughty (Eds.), Handbook of second language teaching (pp. 119–138). Oxford, UK: Wiley-Blackwell.
Dekeyser, R., Alfi-Shabtay, I. & Ravid, D. 2010. Cross-linguistic evidence for the nature of age effects in second language acquisition. Applied Psycholinguistics 31: 413–438.
DeKeyser, R.M. 2012. Age Effects in Second Language Learning: Stepping Stones Toward a Better Understanding. Language Learning ISSN 0023-8333
DeKeyser, R. M. 2012a. Age effects in second language learning. In S. M. Gass & A. Mackey (Eds.), The Routledge handbook of second language acquisition (pp. 442–460). London: Routledge.
DeKeyser, R. M. 2012b. Interactions between individual differences, treatments, and structures in SLA. Language Learning, 62(Supplement 2), 188–199.
DeKeyser, R. M., & Koeth, J. 2011. Cognitive aptitudes for second language learning. In E. Hinkel (Ed.), Handbook of research in second language teaching and learning (Vol. 2, pp. 395–406). London: Routledge.
Devete-Chee, K. & Magury, P.M. The Current State of Education in Papua New Guinea. 2017 NRI Blog @ https://pngnri.org/the-current-state-of-education-in-papua-new-guinea-some-facts-and-figures-on-access-and-quality-of-education/
Devette-Chee, K. Situational Analysis of UBE Main Indicators of Gulf, Hela and Southern Highlands Provinces (NRI) PNG Update 2017, UPNG, Waigani Econometric Software, Inc. 2007. NLOGIT Version 4.0. New York: Econometric Software Inc.
Greene, W.H. 2003. Econometric Analysis. (5th ed.). Upper Saddle River, NJ: Prentice Hall. Hakuta, K., Bialystok, E., & Wiley, E. (2003). Critical evidence: A test of the critical-period hypothesis
for second-language acquisition. Psychological Science, 14, 31–38. Hurford, J. R., & Kirby, S. (1999). Co-evolution of language size and the critical period. In D. Birdsong
(Ed.), Second language acquisition and the critical period hypothesis (pp. 39–63). Mahwah, NJ: Lawrence Erlbaum.
Hyltenstam K., and Abrahamsson, N. 2003. Maturational Constraints in SLA, in The Handbook of Second Language Acquisition (eds CJ Doughty and MH Long), Blackwell Publishing Ltd, Oxford, UK. Doi: 10.1002/9780470756492.ch17
Johnson JS, Newport EL. 1989. Critical Period effects in second language learning: The influence of maturational state on the acquisition of English as a second language. Cognitive Psychology 21:60-99.
Krashen, S. D., Long, M. H., & Scarcella, R. C. (1979). Age, rate, and eventual attainment in second language acquisition. TESOL Quarterly, 13, 573–582.
Lenneberg, E. H. 1967. Biological Foundations of Language. Wiley. ISBN 0-89874-700-7 Long, M.H. 2005. Problems with supposed counter-evidence to the critical period hypothesis.
International Review of Applied Linguistics in Language Teaching 43: 287–317.
Language & Linguistics in Melanesia Vol. 35, 2017 ISSN: 0023-1959
198
Marinova-Todd, S. H., Marshall, D. B., & Snow, C. E. 2000. Three misconceptions about age and L2
learning. TESOL Quarterly, 34, 9-34. Miñoz, C. 2013. Age Effects in SLA. Routledge Encyclopedia of SLA, p. 14 Paraide, P. 2015. Formalizing Indigenous Number and Measurement Knowledge. Language and
Linguistics in Melanesia, Vol. 33/2, pp. 2-15. Penfield W. & Roberts L. 1959. Speech and Brain Mechanisms. Princeton: Princeton University Press. Pulvermüller, F. and Schumann, J. H. (1994), Neurobiological Mechanisms of Language Acquisition.
Language Learning, 44: 681–734. doi: 10.1111/j.1467-1770.1994.tb00635.x Schouten, A. 2010. The Critical Period Hypothesis: Support, Challenge, and Reconceptualization.
Teachers College, Columbia University, Working Papers in TESOL & Applied Linguistics, 2009, Vol. 9, No. 1.
Singleton, D. 1995. Introduction: A critical look at the critical hypothesis in second language acquisition research. In D. Singleton & Z. Lengyel (Eds.), The age factor in second language acquisition (pp. 1-29). Bristol, PA: Multilingual Matters.
Singleton, D. 1997. Second language in primary school: The age dimension. The Irish Yearbook of Applied Linguistics, 15, 155-1 66.
Singleton, D. 2001. Age and second language acquisition. Annual Review of Applied Linguistics, 21, 77-91.
Singleton, D., & Ryan, L. 2004. Language acquisition: The age factor (2nd ed.). Clevedon: Multilingual Matters.
Singleton, D. 2005. The critical period hypothesis: A coat of many colours. International Review of Applied Linguistics, 43, 269-285.
Singleton, D. 2007. The critical period hypothesis: Some problems. Interlinguıstica 17: 48–56. Temple, O. et al. 2016. Effect of Early Language Education on Students’ Academic Performance:
POMNATHS case study. Proceedings of the Linguistic Society of Papua New Guinea 50th Conference August 2-4, 2016 @ Ukarumpa, EHP Papua New Guinea. URL: http://www.langlxmelanesia.com/Temple_LSPNG%20Proceedings%202016%20FV.pdf
Tokudome, M. 2010. Unlikely Bedfellows: The Critical Period Hypothesis and its Effects on Second Language Acquisition. Texas Papers in Foreign Language Education (TPFLE) Volume 14, Number 1 (Summer, 2010)
Vanhove, J. 2013. The critical period hypothesis in second language acquisition: a statistical critique and a reanalysis. PLoS One. 2013 Jul 25; 8(7):e69172. doi: 10.1371/journal.pone.0069172. Print 2013.
Verbeek, M. 2007. A guide to Modern Econometrics. Chichester, UK: John Wiley & Sons. Walton, G. et al. The challenges of free education in Papua New Guinea. (ANU). PNG Update 2017
Conference Paper.