Embed Size (px)
Citation preview
Journal of Tropical Ecologyhttp://journals.cambridge.org/TRO
Additional services for Journal of Tropical Ecology:
Email alerts: Click hereSubscriptions: Click hereCommercial reprints: Click hereTerms of use : Click here
Atmospheric deposition versus rock weathering in the control ofstreamwater chemistry in a tropical rain-forest catchment in MalaysianBorneo
Naoyuki Yamashita, Hiroyuki Sase, Ryo Kobayashi, Kok-Peng Leong, Jamil Mohd Hanapi, Shigeki Uchiyama, SiniarovinaUrban, Ying Ying Toh, Maznorizan Muhamad, Jikos Gidiman and Nick A. Chappell
Journal of Tropical Ecology / Volume 30 / Issue 05 / September 2014, pp 481 - 492DOI: 10.1017/S0266467414000303, Published online: 03 July 2014
Link to this article: http://journals.cambridge.org/abstract_S0266467414000303
How to cite this article:Naoyuki Yamashita, Hiroyuki Sase, Ryo Kobayashi, Kok-Peng Leong, Jamil Mohd Hanapi, Shigeki Uchiyama, SiniarovinaUrban, Ying Ying Toh, Maznorizan Muhamad, Jikos Gidiman and Nick A. Chappell (2014). Atmospheric deposition versusrock weathering in the control of streamwater chemistry in a tropical rain-forest catchment in Malaysian Borneo. Journal ofTropical Ecology, 30, pp 481-492 doi:10.1017/S0266467414000303
Request Permissions : Click here
Downloaded from http://journals.cambridge.org/TRO, IP address: 148.88.193.142 on 09 Dec 2014
Journal of Tropical Ecology (2014) 30:481–492. © Cambridge University Press 2014doi:10.1017/S0266467414000303
Atmospheric deposition versus rock weathering in the control ofstreamwater chemistry in a tropical rain-forest catchment in MalaysianBorneo
Naoyuki Yamashita∗,1, Hiroyuki Sase∗, Ryo Kobayashi†, Kok-Peng Leong‡, Jamil Mohd Hanapi§,Shigeki Uchiyama∗, Siniarovina Urban‡, Ying Ying Toh‡, Maznorizan Muhamad‡, Jikos Gidiman§and Nick A. Chappell#
∗ Asia Center for Air Pollution Research, Sowa 1182, Nishi-ku, Niigata, Japan† NSS corporation, Yoshida-Higashi-Sakae 8–11, Tsubame, Japan‡ Malaysian Meteorological Department, Jalan Sultan 4667, Petaling Jaya, Malaysia§ Danum Valley Field Centre, c/o Yayasan Sabah Group, Sabah, Malaysia# Lancaster Environment Centre, Lancaster University, Lancaster LA1 4YQ, UK
(Received 1 October 2013; revised 2 June 2014; accepted 3 June 2014; first published online 3 July 2014)
Abstract: Uncertainty about the H+ buffering capacity in tropical rain forest limits our ability to predict the futureeffect of anthropogenic deposition on the streamwater chemistry. Export of major ions to the stream and the ion-fluxesvia rainfall, throughfall, litter-leachate and soil-water pathways were observed to examine the source of streamwaternutrients in a small catchment in Sabah, Malaysia. The streamwater and the ion-fluxes were measured for 3.75 and2 y, respectively, by collecting water twice a month and setting ion-exchange-resin columns. Streamwater pH rangedfrom 6.5 to 7.6 and was not sensitive to water discharge controlling base cations. The NO3
−-N, Ca2+ and Mg2+ fluxeswere low in atmospheric depositions (0.6, 0.5 and 0.3 kg ha−1 y−1, respectively) and markedly increased in the litterlayer. The NO3
−-N flux decreased drastically from subsoil (70 kg ha−1 y−1) to the stream (1.4 kg ha−1 y−1) whereasthe Ca2+ and Mg2+ fluxes were not different between subsoil (38 and 18 kg ha−1 y−1) and stream (30 and 15 kg ha−1
y−1). Neutral pH in tropical streams was mainly due to the base cation leaching with deep chemical weathering indeeper strata, and a rapid decrease in NO3
− leaching from the subsoil to the stream.
Key Words: hydrology, nutrient cycling, precipitation, South-east Asia, tropical rain forest, tropical streams
INTRODUCTION
Inland aquatic environments are under pressure in thehumid tropics from population growth, land use andclimate change. In South-East Asia, with four of 25global biodiversity hotspots (Myers et al. 2000), anincrease in emissions of N and S into the atmosphere(Ohara et al. 2007, Streets et al. 2001) could introducenew risks for the environment through eutrophicationor acidification. An enhancement of atmospheric Ndeposition is particularly associated with a decreasein richness of species (Phoenix et al. 2006). Aquaticorganisms vary widely in their sensitivity to acidificationin temperate streams (Lovett et al. 2009). However,
1 Corresponding author. Email: [email protected]
uncertainty regarding the mechanisms for the deliveryof material to tropical streams limits our ability to addresshow anthropogenic disturbances can alter streamwaterchemistry (Wohl et al. 2012) which is closely linked to thehabitats of aquatic organisms. Better understanding of themechanisms for the delivery of materials from atmosphereto stream is needed for the protection of biological diversityin tropical ecosystems against anthropogenic emissions.
In tropical forests with strongly weathered soils,throughfall carrying solutes is an important pathwayof nutrients to the forest floor (Bruijnzeel 1991). Thedecomposition of litter and subsequent release of nutrientsis also an important component in the rain-forestnutrient cycle (Nye 1961, Vitousek & Sanford 1986).In the soil of a tropical rain forest, the biotic activityaccompanied by mineralization, nitrification or plantuptake is also pronounced because of the tight nutrient
482 NAOYUKI YAMASHITA ET AL.
cycling derived from the high competition betweenplants and microbes (Lodge et al. 1994). Meanwhilethe tightness depends on the export of Ca, Mg and K,which are affected by soil fertility in the forest catchment(Bruijnzeel 1991). Tropical ecosystems with high rainfallcan have high weathering rates relative to temperatesystems (Stallard & Edmond 1983). The possibility ofrapid release rates of cations in catchments has beenreported in a lowland topical forest of Puerto Rico(McDowell & Asbury 1994, Shanley et al. 2011) andMalaysia (Bruijnzeel et al. 1993, Gomyo et al. 2012a).Studies on storm hydrology in the tropics have shown theimportance of fast flow paths (Chappell 2010, Elsenbeer& Lack 1995, 1996; Schellekens et al. 2004), whichmay lead to the rapid leaching of some solutes (Golleret al. 2006, Shanley et al. 2011) and rapid dilutionof other solutes in streams (Elsenbeer & Lack 1995).The rapid weathering rates of the humid tropics mayoften result in relatively high streamwater pH levelsof more than 6.5, even with a low precipitation andtopsoil pH. This is the case for basins underlain byvolcanic rock (Bruijnzeel et al. 1993, McDowell & Asbury1994, Newbold et al. 1995) and various sedimentaryrocks (Elsenbeer & Lack 1995, Elsenbeer et al. 1994,Wilcke et al. 2001). Meanwhile, not only abiotic processes(e.g. chemical weathering) but also biological processes(e.g. mineralization of organic materials followed bybase cation leaching, nitrogen or sulphur reductionunder anaerobic conditions) contribute to high pH intropical streams. This has received less attention in forestsestablished on strongly weathered and acid soil thus far.
Observation of the vertical fluxes of major cationsand anions through each ecological compartment fromrainfall to throughfall, litter layer, topsoil, subsoil andthe stream may contribute to our understanding ofthe mechanisms of delivery of material to tropicalstreams and the comprehensive understanding of the pHneutralization processes. This is crucial for evaluating thefuture impact of anthropogenic deposition on the speciesrichness of plants and aquatic organisms. Our hypothesisis that acidified rainwater is neutralized through thetropical rain-forest catchment mainly by rapid chemicalweathering and reductive biological processes in deeperstrata. To test this, we (1) monitored both streamwaterchemistry and water discharge for a long period and (2)determined the balances between anion and cation fluxesfrom rainfall to a stream in the lowland dipterocarp foreston Borneo Island, Malaysia.
METHODS
Study site
The experimental site (study catchment) is the Baruexperimental catchment (Chappell et al. 1999a), which
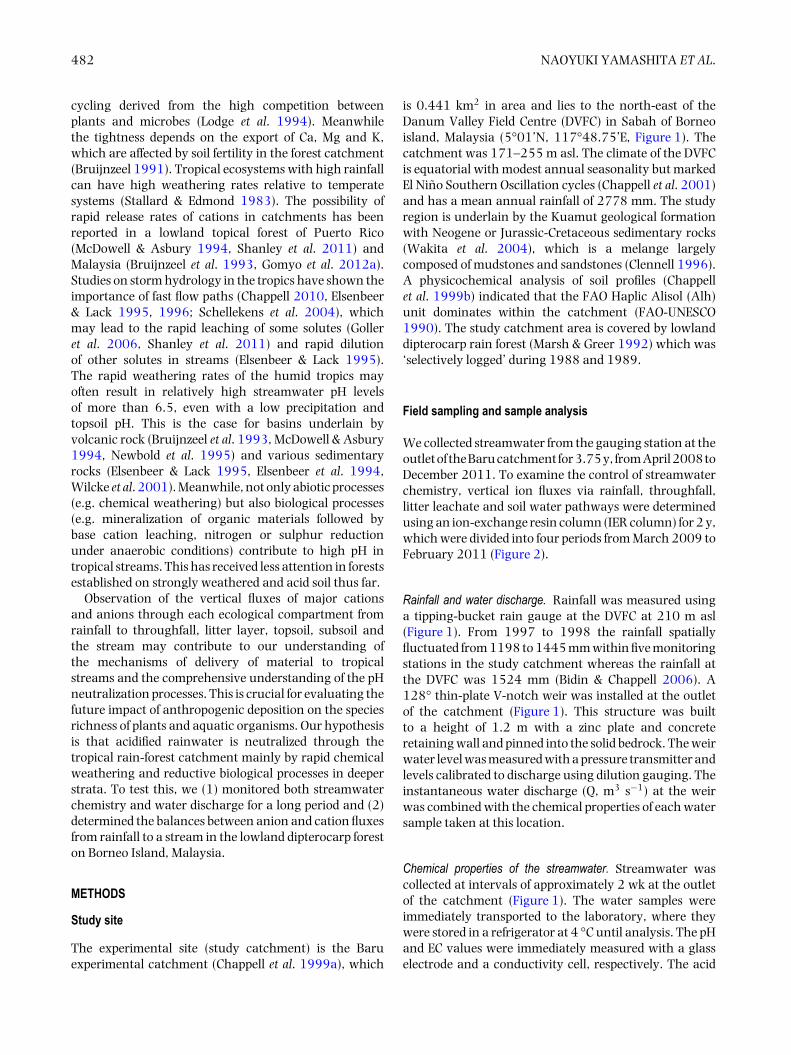
is 0.441 km2 in area and lies to the north-east of theDanum Valley Field Centre (DVFC) in Sabah of Borneoisland, Malaysia (5°01’N, 117°48.75’E, Figure 1). Thecatchment was 171–255 m asl. The climate of the DVFCis equatorial with modest annual seasonality but markedEl Nino Southern Oscillation cycles (Chappell et al. 2001)and has a mean annual rainfall of 2778 mm. The studyregion is underlain by the Kuamut geological formationwith Neogene or Jurassic-Cretaceous sedimentary rocks(Wakita et al. 2004), which is a melange largelycomposed of mudstones and sandstones (Clennell 1996).A physicochemical analysis of soil profiles (Chappellet al. 1999b) indicated that the FAO Haplic Alisol (Alh)unit dominates within the catchment (FAO-UNESCO1990). The study catchment area is covered by lowlanddipterocarp rain forest (Marsh & Greer 1992) which was‘selectively logged’ during 1988 and 1989.
Field sampling and sample analysis
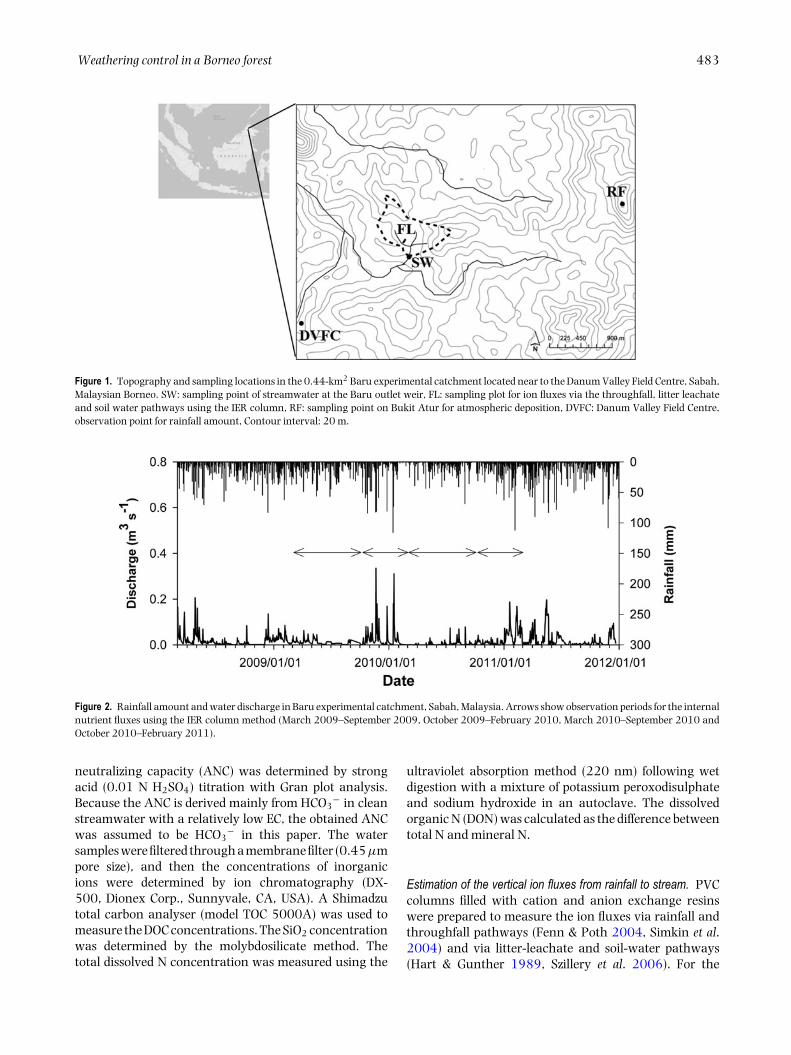
We collected streamwater from the gauging station at theoutlet of the Baru catchment for 3.75 y, from April 2008 toDecember 2011. To examine the control of streamwaterchemistry, vertical ion fluxes via rainfall, throughfall,litter leachate and soil water pathways were determinedusing an ion-exchange resin column (IER column) for 2 y,which were divided into four periods from March 2009 toFebruary 2011 (Figure 2).
Rainfall and water discharge. Rainfall was measured usinga tipping-bucket rain gauge at the DVFC at 210 m asl(Figure 1). From 1997 to 1998 the rainfall spatiallyfluctuated from 1198 to 1445 mm within five monitoringstations in the study catchment whereas the rainfall atthe DVFC was 1524 mm (Bidin & Chappell 2006). A128° thin-plate V-notch weir was installed at the outletof the catchment (Figure 1). This structure was builtto a height of 1.2 m with a zinc plate and concreteretaining wall and pinned into the solid bedrock. The weirwater level was measured with a pressure transmitter andlevels calibrated to discharge using dilution gauging. Theinstantaneous water discharge (Q, m3 s−1) at the weirwas combined with the chemical properties of each watersample taken at this location.
Chemical properties of the streamwater. Streamwater wascollected at intervals of approximately 2 wk at the outletof the catchment (Figure 1). The water samples wereimmediately transported to the laboratory, where theywere stored in a refrigerator at 4 °C until analysis. The pHand EC values were immediately measured with a glasselectrode and a conductivity cell, respectively. The acid
Weathering control in a Borneo forest 483
Figure 1. Topography and sampling locations in the 0.44-km2 Baru experimental catchment located near to the Danum Valley Field Centre, Sabah,Malaysian Borneo. SW: sampling point of streamwater at the Baru outlet weir, FL: sampling plot for ion fluxes via the throughfall, litter leachateand soil water pathways using the IER column, RF: sampling point on Bukit Atur for atmospheric deposition, DVFC: Danum Valley Field Centre,observation point for rainfall amount, Contour interval: 20 m.
Figure 2. Rainfall amount and water discharge in Baru experimental catchment, Sabah, Malaysia. Arrows show observation periods for the internalnutrient fluxes using the IER column method (March 2009–September 2009, October 2009–February 2010, March 2010–September 2010 andOctober 2010–February 2011).
neutralizing capacity (ANC) was determined by strongacid (0.01 N H2SO4) titration with Gran plot analysis.Because the ANC is derived mainly from HCO3
− in cleanstreamwater with a relatively low EC, the obtained ANCwas assumed to be HCO3
− in this paper. The watersamples were filtered through a membrane filter (0.45μmpore size), and then the concentrations of inorganicions were determined by ion chromatography (DX-500, Dionex Corp., Sunnyvale, CA, USA). A Shimadzutotal carbon analyser (model TOC 5000A) was used tomeasure the DOC concentrations. The SiO2 concentrationwas determined by the molybdosilicate method. Thetotal dissolved N concentration was measured using the
ultraviolet absorption method (220 nm) following wetdigestion with a mixture of potassium peroxodisulphateand sodium hydroxide in an autoclave. The dissolvedorganic N (DON) was calculated as the difference betweentotal N and mineral N.
Estimation of the vertical ion fluxes from rainfall to stream. PVCcolumns filled with cation and anion exchange resinswere prepared to measure the ion fluxes via rainfall andthroughfall pathways (Fenn & Poth 2004, Simkin et al.2004) and via litter-leachate and soil-water pathways(Hart & Gunther 1989, Szillery et al. 2006). For the
484 NAOYUKI YAMASHITA ET AL.
fluxes via rainfall and throughfall pathways, the PVCtubes (10-mm diameter×approximately 400 mm height)with a 120-mm diameter funnel were filled with 30 gof Amberlite MB-1 (Rohm and Haas Co., Philadelphia,PA, USA) loaded with H+ or OH− with a total exchangecapacity of 0.55 meq mL−1 wetted bed volume. For the fluxvia the soil-water pathways, ring-type PVC tubes (50-mmdiameter×20 mm height) were also filled with 30 g of MB-1: the top and bottom were covered with 1-mm and 0.2-mm nylon mesh lids, respectively. The capacity per resincolumn was approximately 21 meq (10 eq m−2) for bothtypes. The resin columns were set out for consecutive half-year periods from March 2009 to February 2011 (March2009–September 2009, October 2009–February 2010,March 2010–September 2010, October 2010–February2011; Figure 2).
Three IER columns were installed for rainfall on anopen hilltop at 455 m asl (Bukit Atur) 3 km north-east ofthe study catchment (Figure 1). This is the location of theDanum Valley Global Atmosphere Watch (GAW) Station,where monitoring on wet deposition has been conductedfor the Acid Deposition Monitoring Network in East Asia(EANET, http://www.eanet.asia/). Nevertheless, we usedIER columns for atmospheric deposition to compare withthroughfall and soil water by the same method. Withinthe catchment 10 resin columns for throughfall wererandomly located in the centre of the 20×20-m study plot(FL plot in Figure 1) on a west-facing slope of the westerntributary of the Baru stream. The FL plot was chosento obtain the typical forest in the study catchment. Theforest in FL plot has understorey, closed-canopy layer anda few big stumps which would have been the emergenttrees (pers. obs.). Soil physico-chemical properties in thenearest two soil pits from the FL plot (< 200 m) are alsotypical of this area (Chappell et al. 1999b). To quantifythe litter-leachate and soil-water pathways, 20, 10 and6 IER columns were installed at 0-cm (i.e. immediatelybeneath the litter layer), 20-cm and 60-cm soil depths,respectively, in the centre of the FL plot. The resin columnswere placed so as to avoid overlapping vertically. Oneach sampling date (beginning of each period), newresin columns were placed at each location and depth.During the all-sampling period 196 columns were usedat different compartments (i.e. rainfall, throughfall, litter-leachate and soil-water). Field blank had been installed ateach compartment and period by placing the column intoa plastic container. Bidin & Chappell (2006) reported thatthe rainfall amount at Bukit Atur (the site for atmosphericdeposition) was similar to that of the monitoring stationnearby FL plot.
The resins recovered from the field were extracted(1:50 w/v) with 1.0 M KCl for NH4
+ and NO3− and
0.5 M HCl for SO42−, Na+, K+, Ca2+ and Mg2+. The
extractions were repeated twice for 2-g resin samplestaken from each extraction liquid. The NH4
+ and NO3−
concentrations of the extracts were determined usingthe indophenol blue method and the zinc reductionmethod by flow injection (Auto-Analyzer, BL TEC K.K.,Osaka, Japan). Other ions were determined by ionchromatography (DX-500, Dionex Corp., Sunnyvale, CA,USA). Because the high ionic strength of the 0.5 M HClsample matrix interfered with the IC peak resolution forSO4
2−, each sample was diluted 10-fold with ultrapurewater using an automatic pipette. A standard solutionof a similar matrix with 0.05 M HCl was prepared toquantify the SO4
2− concentration. In this condition,IC peak for SO4
2− concentration had been distinctlydetected.
The vertical fluxes of ions in each period (kg ha−1 perperiod) via the pathways of rainfall, throughfall, litterlayer and at 20-cm soil depth were estimated based on thecollection area of the IER column (a 120-mm diameterfunnel for the rainfall and the throughfall, a 50-mmdiameter ring for the litter layer and soil). Surface ofthe column was set on the level (0°) to calculate thevertical flux per area (kg ha−1) at each compartment. Inthis estimation, the fluxes may contain the error derivedfrom preferential flow to the column, which could becaused by the difference of conductivity between soiland IER (Lehmann et al. 2001). At 20-cm soil depthwe assumed that ions accumulated in the column werederived from only vertical/downward direction (90°angleto surface of the column). Meanwhile, at 60-cm depth weconsidered the effect of lateral flow from the upper part ofthe slope because the lateral flow is considerable at thatdepth in Danum Valley (Chappell et al. 2006). A tracerexperiment using NaCl in a nearby area with a 21–23.5°slope reported that 60% flow in the subsoil was directedlaterally and 40% vertically (Chappell & Sherlock 2005).At a depth of 60 cm we assumed that 40% of all theions caught by the column is derived from vertical flow;both vertical-downward flow and lateral-downward flowall passed through the surface of the IER column. In theabove assumption, ion flux via vertical flow was estimatedby the following simple equation:
Vertical flow at 60-cm depth (kg ha−1 per period) =M × 0.4 × 10000/b × 0.01 where M is weight of ionaccumulated in the IER column (mg), b is the surface areaof the column top (19.6 cm2), conversion factor frommg m−2 to kg ha−1 is 0.01. The annual fluxes (kg ha−1
y−1) were calculated as the sum of the fluxes in all periodsdivided by two, because the observation period was 2y. To compare these fluxes with export via streams, foreach period and annually (March 2009–February 2011),elemental exports via streamwater were determined bymultiplying the average measured concentrations ofdissolved chemicals in streamwater (SW) at the beginningand the end of the interval (i.e. about 2 wk) by thewater discharge during the period (Likens & Bormann1995).
Weathering control in a Borneo forest 485
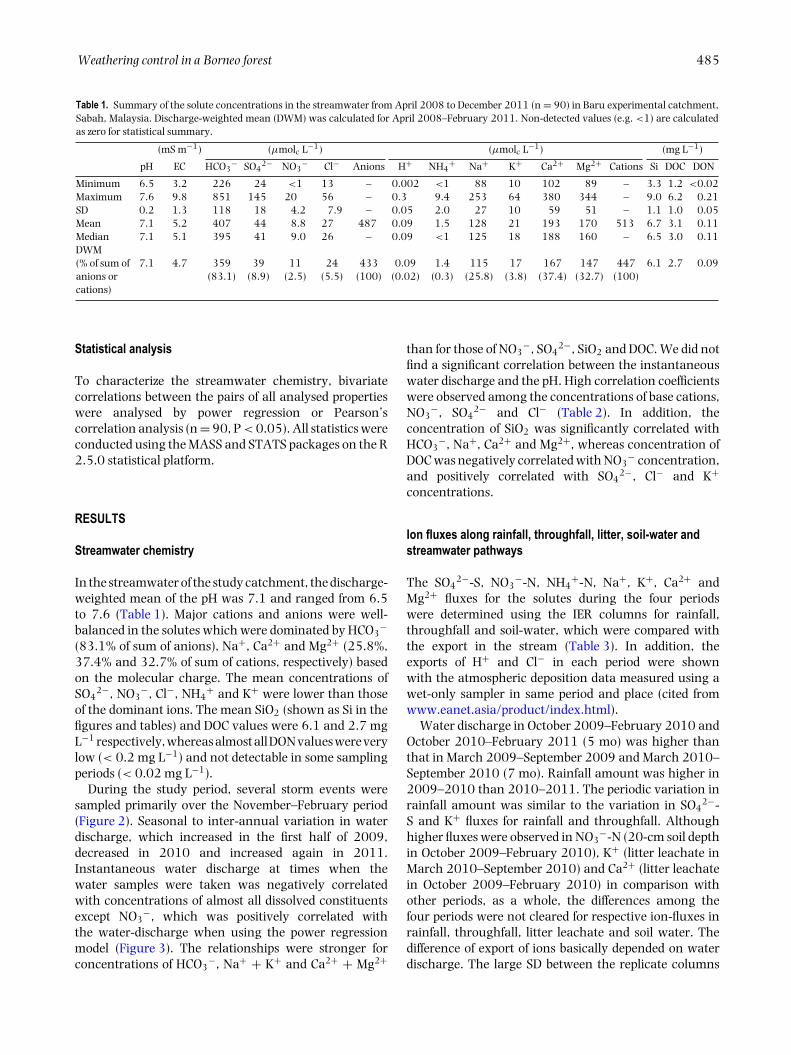
Table 1. Summary of the solute concentrations in the streamwater from April 2008 to December 2011 (n = 90) in Baru experimental catchment,Sabah, Malaysia. Discharge-weighted mean (DWM) was calculated for April 2008–February 2011. Non-detected values (e.g. <1) are calculatedas zero for statistical summary.
(mS m−1) (μmolc L−1) (μmolc L−1) (mg L−1)
pH EC HCO3− SO4
2− NO3− Cl− Anions H+ NH4
+ Na+ K+ Ca2+ Mg2+ Cations Si DOC DON
Minimum 6.5 3.2 226 24 <1 13 – 0.002 <1 88 10 102 89 – 3.3 1.2 <0.02Maximum 7.6 9.8 851 145 20 56 – 0.3 9.4 253 64 380 344 – 9.0 6.2 0.21SD 0.2 1.3 118 18 4.2 7.9 – 0.05 2.0 27 10 59 51 – 1.1 1.0 0.05Mean 7.1 5.2 407 44 8.8 27 487 0.09 1.5 128 21 193 170 513 6.7 3.1 0.11Median 7.1 5.1 395 41 9.0 26 – 0.09 <1 125 18 188 160 – 6.5 3.0 0.11DWM(% of sum ofanions orcations)
7.1 4.7 359(83.1)
39(8.9)
11(2.5)
24(5.5)
433(100)
0.09(0.02)
1.4(0.3)
115(25.8)
17(3.8)
167(37.4)
147(32.7)
447(100)
6.1 2.7 0.09
Statistical analysis
To characterize the streamwater chemistry, bivariatecorrelations between the pairs of all analysed propertieswere analysed by power regression or Pearson’scorrelation analysis (n = 90, P < 0.05). All statistics wereconducted using the MASS and STATS packages on the R2.5.0 statistical platform.
RESULTS
Streamwater chemistry
In the streamwater of the study catchment, the discharge-weighted mean of the pH was 7.1 and ranged from 6.5to 7.6 (Table 1). Major cations and anions were well-balanced in the solutes which were dominated by HCO3
−
(83.1% of sum of anions), Na+, Ca2+ and Mg2+ (25.8%,37.4% and 32.7% of sum of cations, respectively) basedon the molecular charge. The mean concentrations ofSO4
2−, NO3−, Cl−, NH4
+ and K+ were lower than thoseof the dominant ions. The mean SiO2 (shown as Si in thefigures and tables) and DOC values were 6.1 and 2.7 mgL−1 respectively, whereas almost all DON values were verylow (< 0.2 mg L−1) and not detectable in some samplingperiods (< 0.02 mg L−1).
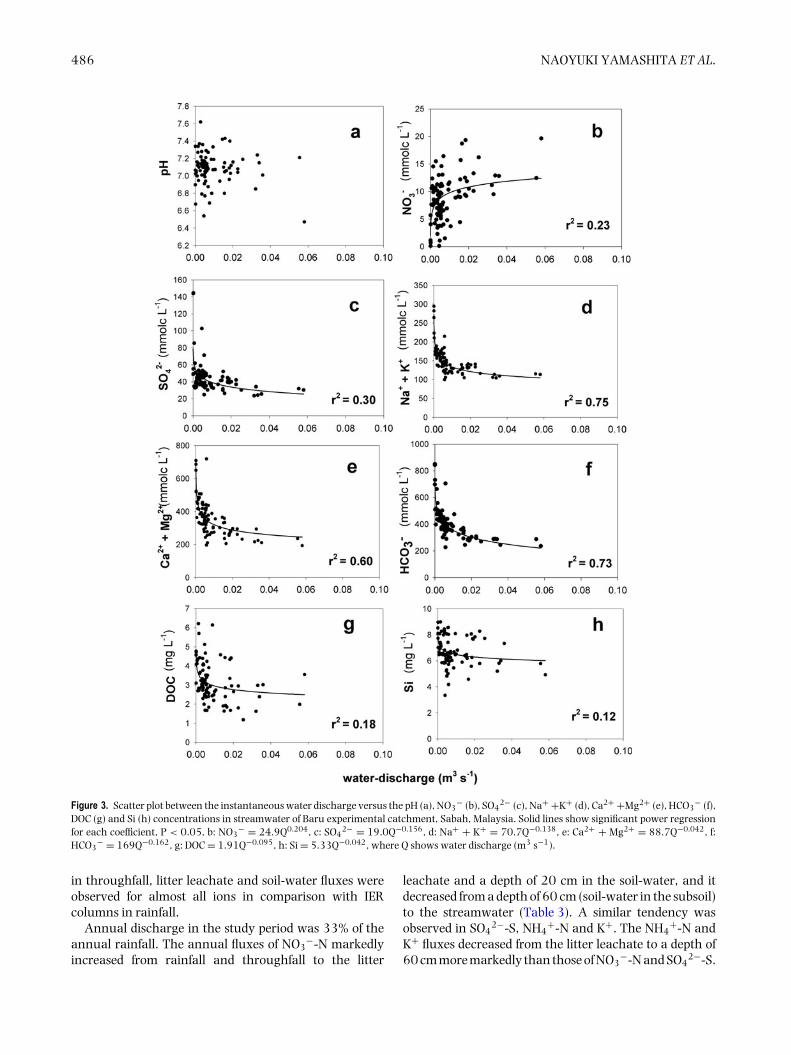
During the study period, several storm events weresampled primarily over the November–February period(Figure 2). Seasonal to inter-annual variation in waterdischarge, which increased in the first half of 2009,decreased in 2010 and increased again in 2011.Instantaneous water discharge at times when thewater samples were taken was negatively correlatedwith concentrations of almost all dissolved constituentsexcept NO3
−, which was positively correlated withthe water-discharge when using the power regressionmodel (Figure 3). The relationships were stronger forconcentrations of HCO3
−, Na+ + K+ and Ca2+ + Mg2+
than for those of NO3−, SO4
2−, SiO2 and DOC. We did notfind a significant correlation between the instantaneouswater discharge and the pH. High correlation coefficientswere observed among the concentrations of base cations,NO3
−, SO42− and Cl− (Table 2). In addition, the
concentration of SiO2 was significantly correlated withHCO3
−, Na+, Ca2+ and Mg2+, whereas concentration ofDOC was negatively correlated with NO3
− concentration,and positively correlated with SO4
2−, Cl− and K+
concentrations.
Ion fluxes along rainfall, throughfall, litter, soil-water andstreamwater pathways
The SO42−-S, NO3
−-N, NH4+-N, Na+, K+, Ca2+ and
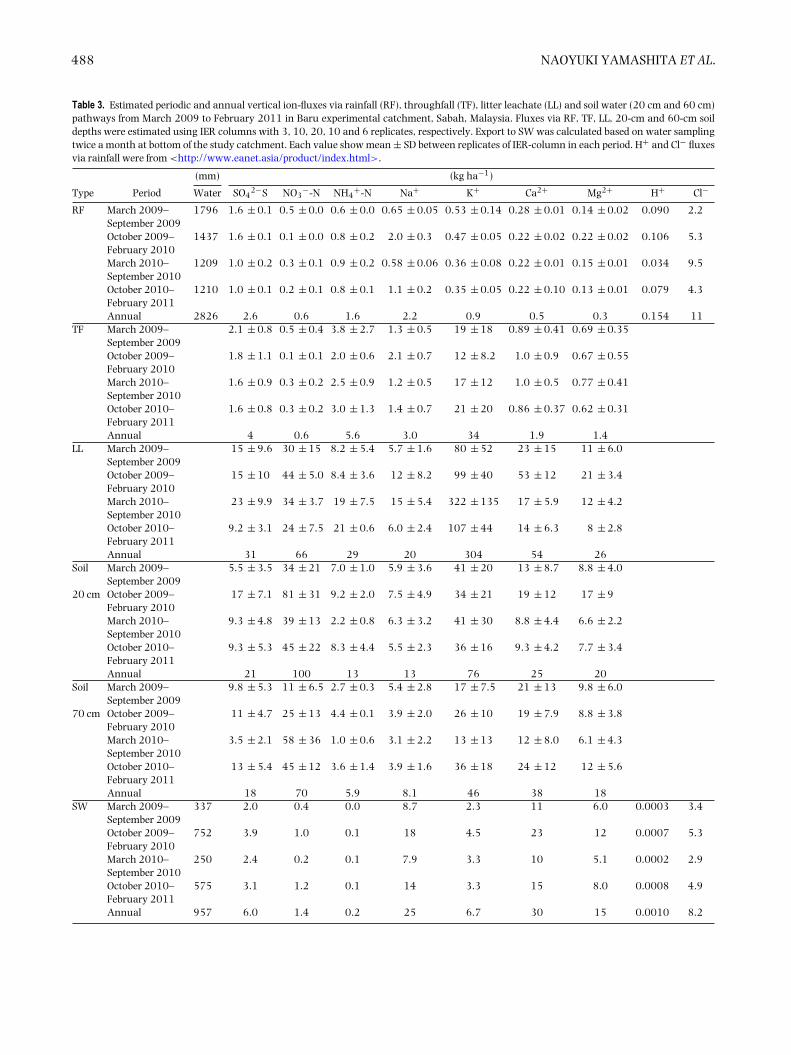
Mg2+ fluxes for the solutes during the four periodswere determined using the IER columns for rainfall,throughfall and soil-water, which were compared withthe export in the stream (Table 3). In addition, theexports of H+ and Cl− in each period were shownwith the atmospheric deposition data measured using awet-only sampler in same period and place (cited fromwww.eanet.asia/product/index.html).
Water discharge in October 2009–February 2010 andOctober 2010–February 2011 (5 mo) was higher thanthat in March 2009–September 2009 and March 2010–September 2010 (7 mo). Rainfall amount was higher in2009–2010 than 2010–2011. The periodic variation inrainfall amount was similar to the variation in SO4
2−-S and K+ fluxes for rainfall and throughfall. Althoughhigher fluxes were observed in NO3
−-N (20-cm soil depthin October 2009–February 2010), K+ (litter leachate inMarch 2010–September 2010) and Ca2+ (litter leachatein October 2009–February 2010) in comparison withother periods, as a whole, the differences among thefour periods were not cleared for respective ion-fluxes inrainfall, throughfall, litter leachate and soil water. Thedifference of export of ions basically depended on waterdischarge. The large SD between the replicate columns
486 NAOYUKI YAMASHITA ET AL.
Figure 3. Scatter plot between the instantaneous water discharge versus the pH (a), NO3− (b), SO4
2− (c), Na+ +K+ (d), Ca2+ +Mg2+ (e), HCO3− (f),
DOC (g) and Si (h) concentrations in streamwater of Baru experimental catchment, Sabah, Malaysia. Solid lines show significant power regressionfor each coefficient, P < 0.05, b: NO3
− = 24.9Q0.204, c: SO42− = 19.0Q−0.156, d: Na+ + K+ = 70.7Q−0.138, e: Ca2+ + Mg2+ = 88.7Q−0.042, f:
HCO3− = 169Q−0.162, g: DOC = 1.91Q−0.095, h: Si = 5.33Q−0.042, where Q shows water discharge (m3 s−1).
in throughfall, litter leachate and soil-water fluxes wereobserved for almost all ions in comparison with IERcolumns in rainfall.
Annual discharge in the study period was 33% of theannual rainfall. The annual fluxes of NO3
−-N markedlyincreased from rainfall and throughfall to the litter
leachate and a depth of 20 cm in the soil-water, and itdecreased from a depth of 60 cm (soil-water in the subsoil)to the streamwater (Table 3). A similar tendency wasobserved in SO4
2−-S, NH4+-N and K+. The NH4
+-N andK+ fluxes decreased from the litter leachate to a depth of60 cm more markedly than those of NO3
−-N and SO42−-S.
Weathering control in a Borneo forest 487
Table 2. Correlation matrix of streamwater chemistry from April 2008 to December 2011 (n = 90) in Baru experimental catchment, Sabah,Malaysia. Each number shows Pearson’s coefficients. Asterisk shows the coefficient is significant (P < 0.05).
HCO3− SO4
2− NO3− Cl− NH4
+ Na+ K+ Ca2+ Mg2+ H+ DOC
SO42− 0.63∗
NO3− − 0.58∗ − 0.52∗
Cl− 0.65∗ 0.84∗ − 0.46NH4
+ 0.40 0.48 − 0.14 0.38Na+ 0.91∗ 0.78∗ − 0.50∗ 0.73∗ 0.43K+ 0.68∗ 0.90∗ − 0.59∗ 0.85∗ 0.38 0.79Ca2+ 0.92∗ 0.68∗ − 0.61∗ 0.62∗ 0.39 0.91∗ 0.71Mg2+ 0.92∗ 0.69∗ − 0.57∗ 0.64∗ 0.45 0.91∗ 0.67∗ 0.96∗H+ 0.02 0.26 − 0.27 0.29 0.16 0.10 0.31 0.01 0.01DOC 0.44 0.54∗ − 0.60∗ 0.50∗ 0.26 0.42 0.62∗ 0.47 0.49 0.31Si 0.75∗ 0.38 − 0.31 0.38 0.35 0.66∗ 0.35 0.66∗ 0.70∗ − 0.04 0.14
As for the exports from a depth of 60 cm to the stream,the decrease in SO4
2−-S was smaller than that of NO3−-
N. In contrast, the Ca2+ and Mg2+ fluxes did not changefrom 60-cm depth to the streamwater, while the Na+
flux clearly increased. The annual exports in streamwatergreatly exceeded the atmospheric deposition in Ca2+ andMg2+ and moderately exceeded it for K+, NO3
−-N andSO4
2−-S. As a result, the H+ export in the stream wassmaller than the atmospheric deposition. These verticalvariations in each ion flux from rainfall to streamwaterwere pronounced more than the difference between theperiods and the variation in IER column replicates at eachcompartment.
DISCUSSION
Temporal variation of the streamwater chemistry
Other published work in tropical montane forests andtropical lowland rain forests demonstrates that thechemical properties of streamwater change markedlythrough storm periods (Boy et al. 2008, Elsenbeer & Lack1995, Newbold et al. 1995, Shanley et al. 2011). Someof the samples in our study carried out over almost 4 ywere collected during such storm periods and allowed therelationships between streamwater chemistry and streamdischarge to be quantified. However, the highest valueof stream discharge at the water sampling (0.058 m−3
s−1) was below the peak of each storm in the hydrographfor 3.75 y (0.2–0.3 m−3 s−1). This indicated that oursampling interval could not evaluate the notable increaseand decrease in stream discharge during the large stormevent in comparison with other published work whichused continuous sampling in individual storms.
The negative correlations between the water dischargeand base cation concentrations were mostly ascribed to adilution of water from subsoil pathways by an increasingcontribution of water from lateral flows from within thelitter layer or topsoil during storms, which was reported
in tropical rain forests elsewhere (Elsenbeer et al. 1994,Yusop et al. 2006). The negative correlations of DOC andK+ with water discharge was inconsistent with existingreports that showed a positive relationship for DOC (Golleret al. 2006, Newbold et al. 1995, Shanley et al. 2011) andK+ (Elsenbeer et al. 1994, Turvey 1975); those reportsindicated that both materials accumulated in the canopy,the litter and the topsoil could be leached out during thestorm periods. The discrepancy between our result andthose previous studies may be explained by the soil depthat which the lateral flow occurs during storms. In PuertoRican forest, storm water flow may move rapidly throughmacropores in the top 20 cm of the soil profile (Schellekenset al. 2004), whereas the lateral flow in study catchmentmainly occur at 60 cm soil depth (Chappell & Sherlock2005). A lateral flow at 60 cm soil depth is probably notcrucial for the intensive leaching of DOC and K+ stored inthe top soil.
The positive correlation between the water dischargeand NO3
− concentration might be ascribed to theenhancement of biotic activity during very wet soilconditions which may lead to greater NO3
− leaching inthe period with high discharge derived from high andcontinuous precipitation. Our sampling interval (twicea month for 3.75 y) probably does not cover the stormeffect on DOC leaching but the lagged effect of bioticactivity on gradual increase in NO3
− concentration withan increase in stream base flow which occurs aftercontinuous precipitation. The relationship of the NO3
−
concentration to the water discharge was unclear in thetropical forests of Puerto Rico and Ecuador (Goller et al.2006, Shanley et al. 2011), whereas a positive correlationwas found in Costa Rica (Newbold et al. 1995).
Source for the solutes in streamwater
The atmospheric (bulk) deposition of most elementsusing the IER column in this study was almost at the
488 NAOYUKI YAMASHITA ET AL.
Table 3. Estimated periodic and annual vertical ion-fluxes via rainfall (RF), throughfall (TF), litter leachate (LL) and soil water (20 cm and 60 cm)pathways from March 2009 to February 2011 in Baru experimental catchment, Sabah, Malaysia. Fluxes via RF, TF, LL, 20-cm and 60-cm soildepths were estimated using IER columns with 3, 10, 20, 10 and 6 replicates, respectively. Export to SW was calculated based on water samplingtwice a month at bottom of the study catchment. Each value show mean ± SD between replicates of IER-column in each period. H+ and Cl− fluxesvia rainfall were from <http://www.eanet.asia/product/index.html>.
(mm) (kg ha−1)
Type Period Water SO42−S NO3
−-N NH4+-N Na+ K+ Ca2+ Mg2+ H+ Cl−
RF March 2009–September 2009
1796 1.6 ± 0.1 0.5 ± 0.0 0.6 ± 0.0 0.65 ± 0.05 0.53 ± 0.14 0.28 ± 0.01 0.14 ± 0.02 0.090 2.2
October 2009–February 2010
1437 1.6 ± 0.1 0.1 ± 0.0 0.8 ± 0.2 2.0 ± 0.3 0.47 ± 0.05 0.22 ± 0.02 0.22 ± 0.02 0.106 5.3
March 2010–September 2010
1209 1.0 ± 0.2 0.3 ± 0.1 0.9 ± 0.2 0.58 ± 0.06 0.36 ± 0.08 0.22 ± 0.01 0.15 ± 0.01 0.034 9.5
October 2010–February 2011
1210 1.0 ± 0.1 0.2 ± 0.1 0.8 ± 0.1 1.1 ± 0.2 0.35 ± 0.05 0.22 ± 0.10 0.13 ± 0.01 0.079 4.3
Annual 2826 2.6 0.6 1.6 2.2 0.9 0.5 0.3 0.154 11TF March 2009–
September 20092.1 ± 0.8 0.5 ± 0.4 3.8 ± 2.7 1.3 ± 0.5 19 ± 18 0.89 ± 0.41 0.69 ± 0.35
October 2009–February 2010
1.8 ± 1.1 0.1 ± 0.1 2.0 ± 0.6 2.1 ± 0.7 12 ± 8.2 1.0 ± 0.9 0.67 ± 0.55
March 2010–September 2010
1.6 ± 0.9 0.3 ± 0.2 2.5 ± 0.9 1.2 ± 0.5 17 ± 12 1.0 ± 0.5 0.77 ± 0.41
October 2010–February 2011
1.6 ± 0.8 0.3 ± 0.2 3.0 ± 1.3 1.4 ± 0.7 21 ± 20 0.86 ± 0.37 0.62 ± 0.31
Annual 4 0.6 5.6 3.0 34 1.9 1.4LL March 2009–
September 200915 ± 9.6 30 ± 15 8.2 ± 5.4 5.7 ± 1.6 80 ± 52 23 ± 15 11 ± 6.0
October 2009–February 2010
15 ± 10 44 ± 5.0 8.4 ± 3.6 12 ± 8.2 99 ± 40 53 ± 12 21 ± 3.4
March 2010–September 2010
23 ± 9.9 34 ± 3.7 19 ± 7.5 15 ± 5.4 322 ± 135 17 ± 5.9 12 ± 4.2
October 2010–February 2011
9.2 ± 3.1 24 ± 7.5 21 ± 0.6 6.0 ± 2.4 107 ± 44 14 ± 6.3 8 ± 2.8
Annual 31 66 29 20 304 54 26Soil March 2009–
September 20095.5 ± 3.5 34 ± 21 7.0 ± 1.0 5.9 ± 3.6 41 ± 20 13 ± 8.7 8.8 ± 4.0
20 cm October 2009–February 2010
17 ± 7.1 81 ± 31 9.2 ± 2.0 7.5 ± 4.9 34 ± 21 19 ± 12 17 ± 9
March 2010–September 2010
9.3 ± 4.8 39 ± 13 2.2 ± 0.8 6.3 ± 3.2 41 ± 30 8.8 ± 4.4 6.6 ± 2.2
October 2010–February 2011
9.3 ± 5.3 45 ± 22 8.3 ± 4.4 5.5 ± 2.3 36 ± 16 9.3 ± 4.2 7.7 ± 3.4
Annual 21 100 13 13 76 25 20Soil March 2009–
September 20099.8 ± 5.3 11 ± 6.5 2.7 ± 0.3 5.4 ± 2.8 17 ± 7.5 21 ± 13 9.8 ± 6.0
70 cm October 2009–February 2010
11 ± 4.7 25 ± 13 4.4 ± 0.1 3.9 ± 2.0 26 ± 10 19 ± 7.9 8.8 ± 3.8
March 2010–September 2010
3.5 ± 2.1 58 ± 36 1.0 ± 0.6 3.1 ± 2.2 13 ± 13 12 ± 8.0 6.1 ± 4.3
October 2010–February 2011
13 ± 5.4 45 ± 12 3.6 ± 1.4 3.9 ± 1.6 36 ± 18 24 ± 12 12 ± 5.6
Annual 18 70 5.9 8.1 46 38 18SW March 2009–
September 2009337 2.0 0.4 0.0 8.7 2.3 11 6.0 0.0003 3.4
October 2009–February 2010
752 3.9 1.0 0.1 18 4.5 23 12 0.0007 5.3
March 2010–September 2010
250 2.4 0.2 0.1 7.9 3.3 10 5.1 0.0002 2.9
October 2010–February 2011
575 3.1 1.2 0.1 14 3.3 15 8.0 0.0008 4.9
Annual 957 6.0 1.4 0.2 25 6.7 30 15 0.0010 8.2
Weathering control in a Borneo forest 489
lowest level among the existing studies within tropicalrain forests across the globe. For instance, the NO3
−
-N and Ca2+ depositions of 0.6 and 0.5 kg ha−1 y−1
were lower than those of the lowland dipterocarp forestin Sarawak (1.9 and 22 kg ha−1 y−1, Gomyo et al.2012a), the nearest EANET station in Kuching City,Sarawak (3.3 and 4.6 kg ha−1 y−1 for the study period,www.eanet.asia/product/index.html), Brazil (1.2 and 1.1kg ha−1 y−1, Lesack & Melack 1996), Ecuador (1.1 and5 kg ha−1 y−1, taken from bar-chart of Amelie et al.2011) and Puerto Rico (1.2 and 13.0 kg ha−1 y−1,McDowell 1998). The SO4
2−-S deposition of 2.6 kg ha−1
y−1 was within the range of these published studies.NSS-Ca2+ (where NSS is ‘non-sea salt’) and NSS-SO4
2−
accounted for 88% and 90% in the rainwater in study site(EANET station in Bukit Atur), respectively. Meanwhile,the volume-weighted pH of 5.32 of wet deposition instudy site (EANET station in Bukit Atur) and periodwas comparable to the tropical montane forest of GununSilam, Sabah (5.4–5.9, Bruijnzeel et al. 1993) and EANETstation in Kuching city, western Borneo (5.27 for thestudy period).
For most elements, the throughfall flux was higher thanthe atmospheric deposition. The higher leaching in K+
than Mg2+ or Ca2+ in the canopy was consistent withthat observed in many other tropical forests, for example,in Ecuador (Wilcke et al. 2001), Puerto Rico (McDowell1998) and Brazil (Germer et al. 2007). Major cations canbe released due to the buffering capacity to H+ in theprecipitation on the canopy (Shibata & Sakuma 1996).Higher K leaching might be due to the high leachabilityof K+ from leaf tissue (Parker 1983, Zimmermann et al.2008). Tropical rainfall may also wash off dry depositioninto the throughfall (Lindberg & Lovett 1985, Rodrigo &Avila 2002).
An increase in ion flux from throughfall to litterleachate has been observed in other tropical forestecosystems (Bruijnzeel et al. 1993, Goller et al. 2006,Lodge et al. 1994, Wilcke et al. 2001, Yamashita et al.2010). This increase in flux through the litter layer ispartly the result of the rapid turnover rate of the leaf litterin this forest, and a k factor (annual litter fall/annual littermass) of 2.6 in the leaf litter was reported by Burghoutset al. (1992) in Danum valley. The rapid turnover wasalso suggested by the distinct Oi and Oe, and thin Oa inFL plot (pers. obs). Burghouts et al. (1992) also reportedpH 4.4 in the litter layer. We speculate that the lower pHin the litter layer in comparison with rainfall is controlledby elevated NO3
− from rainfall and strong organic acidalthough the mineralization of K, Ca and Mg in organicmatter plays a role as H+ sink in the solution (VanBreemen et al. 1983). The large SD in litter layer fluxin 20 resin columns in litter leachate suggested a largespatial variability of the release rate of each element(Burghouts et al. 1998), which was also observed for
NO3− in a tropical dry forest in Thailand (Yamashita et al.
2010).From the litter leachate to a soil depth of 20 cm (lower
topsoil), the increase of NO3− flux and decrease of NH4
+
flux suggested that nitrification occurred in the topsoil.The decreasing trend in K+, NH4
+ and Na+ fluxes from thelitter leachate to 60 cm might be due to the plant uptakeand the retention in the soils. The retention capacity ofthe soil in this site is probably high because of relativelyhigh CEC (10–20 cmolc kg−1, Chappell et al. 1999b). Therelatively constant distributions of Ca2+ and Mg2+ fluxeswith depth in the soil-water system may result from thesimultaneous effect of the decrease due to the retentionin the soil and the increase due to chemical weathering.In addition, the distribution of both fluxes with depth wassimilar to that of water-soluble base cations in two soil pitsin the nearby FL plot (Chappell et al. 1999b), which mayprimary reflect soil mineralogical composition along theprofile (Bruijnzeel 1983). In those soil pits, pH was 4.41–4.57 and 5.70–6.45 at surface and subsoil (Chappell et al.1999b), which implies that main buffer substance is Aloxides and exchangeable base cations in the soil profile.
From a 60-cm depth in the subsoil to the streamwater,84% and 79% of the fluxes of Mg2+ and Ca2+, respectively,were leached into the stream. The marked decrease ofNO3
− from the litter and soil-water to the stream might becaused by the denitrification process in the riparian zone(McClain et al. 1994, McDowell et al. 1992, McSwineyet al. 2001) or the stream itself (Potter et al. 2010). Thedenitrification process might occur below subsoil at moresteady state than the NO3
− leaching process with anincrease in water discharge because the riparian zonewas under reducing conditions through a year in studycatchment. The presence of base flow through almosta year suggested the relatively long residence time ofgroundwater and the reducing conditions in the riparianzone. In the concentration of major ions of streamwater, asignificant positive correlation among Si and base cations,which is strongly associated with the weathering ofsilicate minerals (Stumm & Morgan 1981), supported thelarge contribution of the chemical weathering to the basecations leaching to the stream.
A marked decrease from atmospheric H+ depositionto H+ leaching to the stream (from 0.154 to0.001 kmolc ha−1 y−1) demonstrated high H+ bufferingcapacity to acid substances at catchment scale. Thechemical weathering in the catchment was stronglysupported by the fact that Na+, Ca2+ and Mg2+ leachingto the stream greatly exceeded the catchment input viaatmospheric deposition. Very low base saturation in thelitter, topsoil and subsoil of study catchment, whichranged 17.6%, 10.9%, 3.7% and 5.5% at 0-, 25-, 51-and 71-cm depths, respectively (Chappell et al. 1999b),may suggest an even deeper source of base cationsthan the sampled 60-cm subsoil depth, perhaps at the
490 NAOYUKI YAMASHITA ET AL.
subsoil-rock contact. Bruijnzeel (1991) reported thatannual nutrient discharge from a tropical forestcatchment strongly depends on water discharge andsoil fertility. The study catchment also followed thislinearity and was classified with a moderate infertilesoil group which still exports considerable nutrients tothe stream. Somewhat higher SO4
2− discharge than thedeposition might be affected by the sulphide mineralsin the parent rock. In lowland dipterocarp forest ofRanbil hills (Sarawak state, Malaysia), Gomyo et al.(2012b) stated that high SO4
2− discharge which might bederived from sedimentary rock including FeS2 distributedheterogeneously in the catchment.
Consequently, the streamwater pH value in thisstudy catchment was high (relatively neutral) becauseof pronounced base cation leaching derived from thechemical weathering in the subsoil. Steep decreases inNO3
− flux from soil to stream, which might be causedby denitrification, may also lead to an increase in streampH. The ratio of total base cations and strong-acid anionfluxes (calculated from (K+ + Ca2+ + Mg2+)/(NO3
− +SO4
2−) as equivalent concentration) were 0.58, 0.75 and6.41 at 20 cm, 60 cm soil depth and stream discharge,respectively. An increase in the ratio may contribute tohigh pH in the stream because the pH is controlled bythe balance between the supply of major base cationsand strong-acid anions from soil to stream (Cosby et al.1985). Study forests in Puerto Rico, Ecuador and somesites of Malaysia had a streamwater chemistry with highpH values ranging from 6.5 to 7.5 (Bruijnzeel et al. 1993,Lodge et al. 1994, Wilcke et al. 2001). We assumed thatthe change of ion balance along the water pathways to thestream might be crucial to the neutralization processes.
CONCLUSIONS
The chemical properties of streamwater and streamdischarge were monitored in a small catchment of lowlanddipterocarp forest on Borneo Island, South-East Asia fornearly 4 y. This study also used IER to estimate the verticalion fluxes along pathways from rainfall, throughfall,litter, topsoil (20 cm depth) and subsoil (60 cm depth).These approaches suggested that chemical weatheringneutralized streamwater pH because the exports of Na+,Ca2+ and Mg2+ to the stream greatly exceeded thosein atmospheric deposition, with SiO2 being significantlycorrelated with base cations in the streamwater. As aresult, the precipitation pH of 5.3 was neutralized by soil-water from the subsoil to give 7.1 in the streamwater.Stoichiometric studies on chemical weathering anddenitrification within the subsoil are needed to furtherdevelop our understanding of streamwater chemistrywithin natural streams in the humid tropics.
ACKNOWLEDGEMENTS
The authors thank the Yayasan Sabah Group,particularly their staff at the Danum Valley Field Centrefor their support with the sampling and site access. Wealso thank Mr Sei Eng Yong at the Tawau branch officeof the Malaysian Meteorological Department (MMD) forthe rainfall sampler and shipping of samples, Dr HideshigeToda at Shinshu University for technical assistance withthe ion exchange resin method for sampling rainfallchemistry and Ms Leong Chow Peng, former deputydirector general of the Asia Centre for Air PollutionResearch for the initiation this collaborative study. Thestudy was supported by the Environment Researchand Technology Development Fund (B-0801), MOE andKAKENHI (20120012), MEXT, Japan and Asia-PacificNetwork for Global Change Research (APN, ARCP2012–18NMY-Sase).
LITERATURE CITED
AMELIE, B., CRESPO, P., FREDE, H. & BREUER, L. 2011. Solute
behaviour and export rates in neotropical montane catchments
under different land-uses. Journal of Tropical Ecology 27:305–317.
BOY, J., VALAREZO, C. & WILCKE, W. 2008. Water flow paths in
soil control element exports in an Andean tropical montane forest.
European Journal of Soil Science 59:1209–1227.
BIDIN, K., & CHAPPELL, N. A. 2006. Characteristics of rain events at an
inland locality in northearn Borneo, Malaysia. Hydrological Processes
20:3835–3850.
BRUIJNZEEL, L. A. 1983. Hydrological and biogeochemical aspects of
man-made forests in south-central Java, Indonesia. PhD thesis, Vrije
Universiteit, Amsterdam. 250 pp.
BRUIJNZEEL, L. A. 1991. Nutrient input–output budgets of tropical
forest ecosystems: a review. Journal of Tropical Ecology 7:1–24.
BRUIJNZEEL, L. A., WATERLOO, M. J., PROCTOR, J., KUITERS, A. T. &
KOTTERINK, B. 1993. Hydrological observations in montane rain
forests on Gunung Silam, Sabah, Malaysia, with special reference to
the “Massenerhebung” effect. Journal of Ecology 81:145–167.
BURGHOUTS, T. B. A., ERNSTING, G., KORTHALS, G. & DE VRIES, T.
1992. Litterfall, leaf litter decomposition and litter invertebrates in
primary and selectively logged dipterocarp forest in Sabah, Malaysia.
Philosophical Transactions of the Royal Society B: Biological Sciences
335:407–416.
BURGHOUTS, T. B. A., VAN STRAALEN, N. M. & BRUIJNZEEL, L. A.
1998. Spatial heterogeneity of element and litter turnover in a
Bornean rain forest. Journal of Tropical Ecology 14:477–506.
CHAPPELL, N. A. 2010. Soil pipe distribution and hydrological
functioning within the humid tropics: a synthesis. Hydrological
Processes 24:1567–1581.
CHAPPELL, N. A. & SHERLOCK, M. 2005. Contrasting flow pathways
within tropical forest slopes of Ultisol soils. Earth Surface Processes and
Landforms 30:735–753.

Weathering control in a Borneo forest 491
CHAPPELL, N. A., MCKENNA, P., BIDIN, K., DOUGLAS, I. & WALSH,
R. P. 1999a. Parsimonious modelling of water and suspended
sediment flux from nested catchments affected by selective tropical
forestry. Philosophical Transactions of the Royal Society B: Biological
Sciences 354:1831–1846.
CHAPPELL, N. A., TERNAN, L. & BIDIN, K. 1999b. Correlation
of physicochemical properties and sub-erosional landforms with
aggregate stability variations in a tropical Ultisol disturbed by forestry
operations. Soil and Tillage Research 50:55–71.
CHAPPELL, N. A., BIDIN, K. & TYCH, W. 2001. Modelling rainfall
and canopy controls on net-precipitation beneath selectively-logged
tropical forest. Plant Ecology 153:215–229.
CHAPPELL, N. A., SHERLOCK, M., BIDIN, K., MACDONALD, R.,
NAJMAN, Y. & DAVIES, G. 2006. Runoff processes in southeast
Asia: role of soil, regolith, and rock type. Pp. 3–23 in Sawada, H.,
Araki, M., Chappell, N. A., LaFrankie, J. V. & Shimizu, A. (eds.).
Forest environments in the Mekong river basin. Springer, Tokyo.
CLENNELL, B. 1996. Far-field and gravity tectonics in Miocene basins of
Sabah, Malaysia. Pp. 307–320 in Hall, R. & Blundell, D. (eds.). Tectonic
evolution of Southeast Asia. Geological Society Special Publication,
London.
COSBY, B. J., HORNBERGER, G. M., GALLOWAY, J. N. & WRIGHT,
R. E. 1985. Time scales of catchment acidification. A quantitative
model for estimating freshwater acidification. Environmental Science
and Technology 19:1144–1149.
ELSENBEER, H. & LACK, A. 1995. Chemical fingerprints of hydrological
compartments and flow paths at La Cuenca, western Amazonia.
Water Resources Research 31:3051–3058.
ELSENBEER, H. & LACK, A. 1996. Hydrometric and hydrochemical
evidence for fast flowpaths at La Cuenca, Western Amazonia. Journal
of Hydrology 180:237–250.
ELSENBEER, H., WEST, A. & BONELL, M. 1994. Hydrologic
pathways and stormflow hydrochemistry at South Creek, northeast
Queensland. Journal of Hydrology 162:1–21.
FAO-UNESCO. 1990. Soil Map of the World, Revised Legend. FAO, Rome.
FENN, M. E. & POTH, M. A. 2004. Atmospheric pollutants and trace
gases – monitoring nitrogen deposition in throughfall using ion
exchange resin columns: a field test in the San Bernardino Mountains.
Journal of Environmental Quality 33:2007–2014.
GERMER, S., NEILL, C., KRUSCHE, A. V., NETO, S. C. G. & ELSENBEER,
H. 2007. Seasonal and within-event dynamics of rainfall and
throughfall chemistry in an open tropical rainforest in Rondonia,
Brazil. Biogeochemistry 86:155–174.
GOLLER, R., WILCKE, W., FLEISCHBEIN, K., VALAREZO, C. & ZECH,
W. 2006. Dissolved nitrogen, phosphorus, and sulfur forms in the
ecosystem fluxes of a montane forest in Ecuador. Biogeochemistry
77:57–89.
GOMYO, M., WAKAHARA, T., SHIRAKI, K., KURAJIL, K., KITAYAMA,
K. & SUZUKI, M. 2012a. Comparison of nutrient balance between a
tropical lowland forest and a tropical montane forest in Malaysian
Borneo. Journal of Tropical Biology and Conservation 9:15–25.
GOMYO, M., WAKAHARA, T., SHIRAKI, K., KURAJI, K. & SUZUKI,
M. 2012b. Sources and generation mechanisms of high SO42−
concentrations in soil water, groundwater and streamwater in a
small watershed, Lambir Hills National Park, Malaysia. Bulletin on
Forestry, University of Tokyo 34:17–34.
HART, S. C. & GUNTHER, A. J. 1989. In situ estimates of annual net
nitrogen mineralization and nitrification in a subarctic watershed.
Oecologia 80:284–288.
LEHMANN, J., KAISER, K. & PETER, I. 2001. Exchange resin cores for
the estimation of nutrient fluxes in highly permeable tropical soil.
Journal of Plant Nutrition and Soil Science 164:57–64.
LESACK, L. W. & MELACK, J. 1996. Mass balance of major solutes
in a rainforest catchment in the Central Amazon: implications for
nutrient budgets in tropical rainforests. Biogeochemistry 32:115–
142.
LIKENS, G. E. & BORMANN, F. H. 1995. Biogeochemistry of a forested
ecosystem. Springer Verlag, New York. 159 pp.
LINDBERG, S. E. & LOVETT, G. M. 1985. Field measurements of particle
dry deposition rates to foliage and inert surfaces in a forest canopy.
Environmental Science and Technology 19:238–244.
LODGE, D. J., MCDOWELL, W. H. & MCSWINEY, C. P. 1994. The
importance of nutrient pulses in tropical forests. Tree 9:384–387.
LOVETT, G. M., TEAR, T. H., EVERS, D. C., FINDLAY, S. E. G., COSBY,
B. J., DUNSCOMB, J. K., DRISCOLL, C. T. & WEATHERS, K. C. 2009.
Effects of air pollution on ecosystems and biological diversity in the
eastern United States. Annals of the New York Academy of Sciences
1162:99–135.
MARSH, C. W. & GREER, A. G. 1992. Forest land-use in Sabah, Malaysia:
an introduction to Danum Valley. Philosophical Transactions of the
Royal Society B: Biological Sciences 335:331–339.
MCCLAIN, M., RICHEY, J. & PIMENTEL, T. 1994. Groundwater nitrogen
dynamics at the terrestrial-lotic interface of a small catchment in the
Central Amazon Basin. Biogeochemistry 27:113–127.
MCDOWELL, W. H. 1998. Internal nutrient fluxes in a Puerto Rican
rain forest. Journal of Tropical Ecology:521–536.
MCDOWELL, W. H. & ASBURY, C. E. 1994. Export of carbon, nitrogen,
and major ions from three tropical montane watersheds. Limnology
and Oceanography 39:111–125.
MCDOWELL, W. H., BOWDEN, W. B. & ASBURY, C. E. 1992. Riparian
nitrogen dynamics in two geomorphologically distinct tropical
rain forest watersheds: subsurface solute patterns. Biogeochemistry
18:53–75.
MCSWINEY, C. P., MCDOWELL, W. H. & KELLER, M. 2001. Distribution
of nitrous oxide and regulators of its production across a tropical
rainforest catena in the Luquillo Experimental Forest, Puerto Rico.
Biogeochemistry 56:265–286.
MYERS, N., MITTERMEIER, R. A., MITTERMEIER, C. G., DA FONSECA,
G. A. B. & KENT, J. 2000. Biodiversity hotspots for conservation
priorities. Nature 403:853–858.
NEWBOLD, J. D., SWEENEY, B. W. & KAPLAN, L. A. 1995.
Concentrations and export of solutes from six mountain streams in
northwestern Costa Rica. Journal of the North American Benthological
Society 14:21–37.
NYE, P. H. 1961. Organic matter and nutrient cycles under moist
tropical forest. Plant and Soil 13:333–346.
OHARA, T., AKIMOTO, H., KUROKAWA, J., HORII, N., YAMAJI, K.,
YAN, X. & HAYASAKA, T. 2007. An Asian emission inventory
492 NAOYUKI YAMASHITA ET AL.
of anthropogenic emission sources for the period 1980–2020.
Atmospheric Chemistry and Physics 7:4419–4444.
PARKER, G. G. 1983. Throughfall and stemflow in the forest nutrient
cycle. Advances in Ecological Research 13:58–120.
PHOENIX, G. K., HICKS, W. K., CINDERBY, S., JOHAN, C. I.,
KUYLENSTIERNA, J. C. I., STOCK, W. D., DENTENER, F. J., GILLER,
K. E., AUSTIN, A. T., LEFROY, R. D. B., GIMENO, B. S., ASHMOR,
M. R. & INESON, P. 2006. Atmospheric nitrogen deposition in
world biodiversity hotspots: the need for a greater global perspective
in assessing N deposition impacts. Global Change Biology 12:
470–476.
POTTER, A. J. D., MCDOWELL, W. H., MERRIAM, J. L., PETERSON,
B. J. & THOMAS, S. M. 2010. Denitrification and total nitrate uptake
in streams of a tropical landscape. Ecological Applications 20:2104–
2115.
RODRIGO, A. & AVILA, A. 2002. Dry deposition to the forest
canopy and surrogate surfaces in two mediterranean holm oak
forests in Montseny (NE Spain). Water, Air, & Soil Pollution 136:
269–288.
SCHELLEKENS, J., SCATENA, F. N., BRUIJNZEEL, L. A., VAN DIJK,
A. I. J. M., GROEN, M. M. A. & VAN HOGEZAND, R. J. P.
2004. Stormflow generation in a small rainforest catchment in the
Luquillo experimental forest, Puerto Rico. Hydrological Processes 18:
505–530.
SHANLEY, J. B., MCDOWELL, W. H. & STALLARD, R. F. 2011.
Long-term patterns and short-term dynamics of stream solutes and
suspended sediment in a rapidly weathering tropical watershed.
Water Resources Research 47:1–11.
SHIBATA, H. & SAKUMA, T. 1996. Canopy modification of precipitation
chemistry in deciduous and coniferous forests affected by acidic
deposition. Soil Science and Plant Nutrition 42:1–10.
SIMKIN, S. M., LEWIS, D. N., WEATHERS, K. C., LOVETT, G. M. &
SCHWARZ, K. 2004. Determination of sulfate, nitrate, and chloride
in throughfall using ion-exchange resins. Water, Air, and Soil Pollution
153:343–354.
STALLARD, R. F. & EDMOND, J. M. 1983. Geochemistry of the Amazon:
2. The influence of geology and weathering environment on the
dissolved load. Journal of Geophysical Research 88:9671.
STREETS, D. G., TSAI, N. Y., AKIMOTO, H. & OKA, K. 2001. Trends in
emissions of acidifying species in Asia, 1985–1997. Water, Air, and
Soil Pollution 130:187–192.
STUMM, W. & MORGAN, J. J. 1981. Aquatic chemistry – an introduction
emphasizing chemical equilibria in natural waters. (Second edition). John
Wiley and Sons, New York. 780 pp.
SZILLERY, J. E., FERNANDEZ, I. J., NORTON, S. A., RUSTAD, L. E. &
WHITE, A. S. 2006. Using ion-exchange resins to study soil response
to experimental watershed acidification. Environmental Monitoring
and Assessment 116:383–398.
TURVEY, N. D. 1975. Water quality in a tropical rain forested
catchment. Journal of Hydrology 27:111–125.
VAN BREEMEN, N., MULDER, J. & DRISCOLL, C. T. 1983. Acidification
and alkalinization of soils. Plant and Soils 75:283–308.
VITOUSEK, P. M. & SANFORD, R. L. 1986. Nutrient cycling in moist
tropical forest. Annual Review of Ecology and Systematics 17:137–167.
WAKITA, K., OKUBO, Y., BANDIBAS, J., LEI, X. & SCHULTE, M. 2004.
Digital geologic map of east and Southeast Asia. (Second edition).
Geological Society of Japan, Tokyo.
WILCKE, W., YASIN, S., VALAREZO, C. & ZECH, W. 2001. Change in
water quality during the passage through a tropical montane rain
forest in Ecuador. Biogeochemistry 55:45–72.
WOHL, E., BARROS, A., BRUNSELL, N., CHAPPELL, N. A., COE, M.,
GIAMBELLUCA, T., GOLDSMITH, S., HARMON, R., HENDRICKX, J.
M. H., JUVIK, J. & MCDONNELL, J. 2012. The hydrology of the humid
tropics. Nature Climate Change 2:655–662.
YAMASHITA, N., OHTA, S., SASE, H., LUANGJAME, J., VISARATANA,
T., KIEVUTTINON, B., GARIVAIT, H. & KANZAKI, M. 2010. Seasonal
and spatial variation of nitrogen dynamics in the litter and surface
soil layers on a tropical dry evergreen forest slope. Forest Ecology and
Management 259:1502–1512.
YUSOP, Z., DOUGLAS, I. & NIK, A. 2006. Export of dissolved and
undissolved nutrients from forested catchments in Peninsular
Malaysia. Forest Ecology and Management 224:26–44.
ZIMMERMANN, A., GERMER, S., NEILL, C., KRUSCHE, A. & ELSENBEER,
H. 2008. Spatio-temporal patterns of throughfall and solute
deposition in an open tropical rain forest. Journal of Hydrology
360:87–102.


![RECENSIONI - morcelliana.net Recensioni.pdfAges, in «Ostraka» XVI, 2[2007], pp. 481-492 along with O. Zwierlein, Petrus in Rom. Die literarischen Zeugnisse . Mit einer kritischen](https://img.pdfslide.net/doc/110x75/5d655ce188c993c8128bc849/recensioni-recensionipdfages-in-ostraka-xvi-22007-pp-481-492-along.jpg)