Embed Size (px)
Citation preview
Journal of Unconventional Oil and Gas Resources 5 (2014) 1–9
Contents lists available at ScienceDirect
Journal of Unconventional Oil and Gas Resources
journal homepage: www.elsevier .com/ locate / juogr
Evaluation of the EOR potential of gas and water injection in shale oil reservoirs
James J. Sheng ⇑, Ke Chen 1
Bob L. Herd Department of Petroleum Engineering, Texas Tech University, P.O. Box 43111, Lubbock, TX 79409, United States
a r t i c l e i n f o a b s t r a c t
Article history:Received 13 September 2013Revised 4 December 2013Accepted 5 December 2013Available online 21 December 2013
Keywords:Gas floodingWaterfloodingShale oilEnhanced oil recoveryUnconventional oil and gas resourcesSimulation
2213-3976/$ - see front matter � 2013 Elsevier Ltd. Ahttp://dx.doi.org/10.1016/j.juogr.2013.12.001
⇑ Corresponding author. Address: Bob L. Herd Depneering, Texas Tech University, P.O. Box 43111, LubbTel.: +1 (806) 834 8477.
E-mail address: [email protected] (J.J. Sheng).1 Present address: PetroChina.
With the relatively modest natural gas price, producing oil from unconventional shale reservoirs hasattracted more and more interest from oil operators. Although many tremendous efforts have been madeto develop shale resources, the ultimate oil recovery is still low (5–10%). Because of the important role ofshale resources in the future oil and gas industry, more stimulation and production strategies are beingconsidered and tested to find ways to improve oil production from shale reservoirs. Before applying aspecific method to enhance oil recovery (EOR) in the field or conducting a research in laboratory, the sim-ulation approach is a cheap and fast approach to evaluate its EOR potential. The analysis of simulationresults will be helpful in designing laboratory experiments and field testing.
In this paper we use a simulation approach to evaluate the EOR potential in shale oil reservoirs by gasflooding and waterflooding. Production behavior and oil recovery of different schemes are discussedthrough sensitivity studies. Simulation results of primary production, gas injection and water injectionare compared. Results show that miscible gas injection has a higher potential to improve oil recoveryfrom shale oil reservoirs than water injection. Gas injection above a minimum miscible pressure(MMP) can be fully miscible with oil, thus reducing oil viscosity significantly, in addition to the mecha-nism of pressure maintenance. Simulation results indicate that the oil recovery factor can be increased upto 15.1% by gas injection in a hydraulically fractured shale reservoir, whereas the oil recovery factor fromthe primary depletion is only 6.5%. The oil recovery from waterflooding is about 11.9% which is lowerthan that from gas flooding. The results indicate that miscible gas flooding could be a way to enhanceoil recovery in shale oil reservoirs.
� 2013 Elsevier Ltd. All rights reserved.
Introduction heterogeneity on cyclic CO injection. Gamadi et al. (2013) did an
Unconventional shale reservoirs are generally produced bystimulation techniques. A horizontal well with multiple transversefractures has proven to be an effective technique for shale gas andshale oil production. However, shale oil production faces morechallenges compared with shale gas production. Even applyingmulti-stage hydraulic fracturing techniques, the final oil recoveryfactors using existing methods are only a few percent. Oil rateand reservoir pressure drop very quickly. Because most of oilremains unrecoverable even using the expensive horizontal welldrilling combined with hydraulic fracturing, seeking the ways toenhance oil recovery will be the continuous efforts.
In addition to drilling horizontal well and hydraulic fracturingstimulation, several EOR methods have been proposed or tested.Wan et al. (2013a,b) evaluated cyclic gas injection to improve shaleoil recovery. Chen et al. (2013) studied the effect of reservoir
ll rights reserved.
artment of Petroleum Engi-ock, TX 79409, United States.
2
experimental study of cyclic gas injection in shale rocks. Appar-ently, no gas injection has been reported to have been applied inshale oil reservoirs.
Takahashi and Kovscek (2009) investigated the impact of differ-ent brine formulations in tight formations. Makhanov et al. (2012)showed that the imbibition could be a viable mechanism to trans-fer fluids from fracture to matrix in Horn River shales. Morsy et al.(2013a–e) studied the effects of water compositions (salinity, acidand alkali) on the EOR potential of water imbibition. Fakcharoen-phol et al. (2013) pointed out that waterflooding changes the for-mation in situ stress due to the increase in reservoir pressureand decrease of reservoir temperature, which enhances oil recov-ery of shale formations by reactivating existing natural fracturesand/or creating new fractures. Although waterflooding is a maturesecondary recovery method for conventional reservoirs, it has notbeen applied in shale oil and gas reservoirs in a large commercialscale. A waterflooding pilot was started in Bakken shale in late2006, (Wood and Milne, 2011).
Because of ultra-low permeability of shale reservoirs, eitherwaterflooding or gas flooding may have issues of injectivity andfluid transport. In this paper, we initiate a simulation study to eval-uate whether gas flooding and waterflooding could have a potential

Table 1Reservoir properties used in the base model.
Initial reservoir pressure 6425 psiPorosity of shale matrix 0.06Initial water saturation 0.3Compressibility of shale 5�10�6 psi�1
Shale matrix permeability 0.0001 md
2 J.J. Sheng, K. Chen / Journal of Unconventional Oil and Gas Resources 5 (2014) 1–9
to improve oil recovery in shale oil reservoirs. The EOR potentialsof gas injection and water injection are evaluated. A furthersensitivity study is conducted to improve the understanding ofthe mechanism of gas and water injection in shale reservoirs. Beforewe present simulation results, the base simulation model isdescribed next.
Reservoir temperature 255 �FGas specific gravity 0.8Reservoir thickness 200 ftBubble point for oil 2398 psi
Base model setup
Rubin (2010) used an extremely fine grid model as a referencemodel to simulate fracture flow. In the reference model, small cellsof the actual width of fractures (assumed 0.001 ft) are used to cap-ture the flow from the matrix to the fractures. He also showed thatit is possible to accurately model flow from a fractured shalereservoir using logarithmically spaced, locally refined grids withfractures represented by 2.0-ft-wide cells and by maintaining thesame conductivity (kfwf) as that of the original 0.001-ft-wide frac-ture. Using Robin’s approach, we can use much less cells to simu-late fracture-related flow.
Wan (2013) used Robin’s approach to have built a model of200 ft long, 1000 ft wide and 200 ft thick to simulate a horizontalwell and one transverse fracture (Fig. 1). 2-ft wide grid cells with83.3 md-ft conductivity (k = 41.65 md, wf = 2 ft) were used to rep-resent the actual fractures of 0.001-ft wide and 83.300 md. The res-ervoir property data used by Wan are similar to the Eagle Fordshale data (Table 1). The initial reservoir pressure is 6425 psi.The permeability is 100 nano-Darcy. The porosity is 0.06. Duringthe primary production process, the well is controlled by bot-tom-hole pressure (BHP) of 2500 psi. These data and the approachare used in the base model as well.
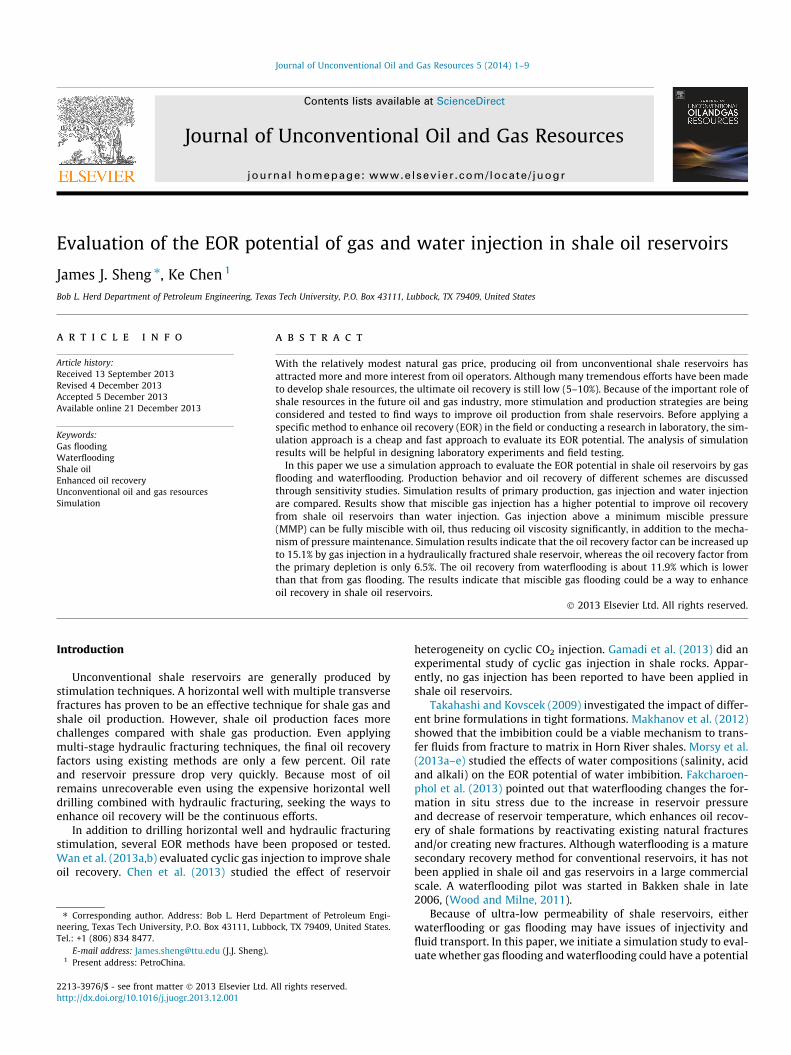
The objective of this study is to evaluate the potential of gas andwater injection for improving oil production from shale oil reser-voirs. Modeling a whole reservoir requires a large number of gridblocks, and it is of course time-consuming to model these complexfracture networks. Therefore, we built a small model which is200 ft long, 1000 ft wide and 200 ft thick (Fig. 2). This small modelis produced with two half-vertical wells connected with two half-fractures, respectively. Thus each fracture is 1-ft wide and has aconductivity of 46.65 md-ft. We use such a simple model tosimulate the flow between the two lateral hydraulic fractures of
Fig. 1. Cyclic gas injection simulation model used in Wan (2013).
a horizontal well. Assume the flow between any two lateral frac-tures is the same, such small model can be used to simulate theflow through a part of a horizontal well. The reservoir propertiesdata used in this model is shown in Table 1.
Before conducting gas or waterflooding simulation using thissmall base model, we need to validate the model first. In Wan’smodel, one vertical well was used to connect one lateral verticalfracture. The fracture is 2-ft wide and has a conductivity of83.3 md-ft. In the base model, we use two vertical wells to connecttwo half-fractures, because we need to use one vertical well to rep-resent an injection well and the other well to represent a produc-tion well, so that an injection-production pattern is built in themodel. The area or volume of our base model is the same as thatin Wan’s model. If the injector is changed to a producer in our basemodel, the oil production from our model should be same as thatfrom Wan’s model. Because Wan’s model has been validated inhis thesis, if the oil production performance is the same as thatfrom Wan’s model, then our model is validated. This validationhas been performed in Chen’s thesis (Chen, 2013), and it is notrepeated here because of limited space allowed for this paper.
In the above base model, the miscibility model proposed byTodd and Longstaff (1972) is used. Todd and Longstaff (1972) pro-posed a method of simulating miscible displacement performancewithout considering detailed compositions. They introduced amixing parameter x, which determines the degree of mixingbetween the miscible fluids within a grid block. A value of zero cor-responds to the immiscible displacement, whereas a value of onecorresponds to complete mixing. The mixing of solvent and oil iscontrolled by a pressure-dependent mixing parameter, xo
(Omegaos in the simulator IMEX used in this study). IMEX, theblack oil simulator, is developed by Computer Modeling Group(CMG). If the individual block pressure is much lower than theminimum miscibility pressure (MMP), xo = 0.0, and gas is displac-ing oil immiscibly. As the block pressure increases, this mixingparameter reaches its maximum value xomax at the MMP, asshown in Fig. 3. When no better data is available, the user manualof the simulation software IMEX suggests a value in the range of0.5–0.8 as a first approximation. xo is considered to be a functionof pressure and xomax is set as 0.72 in the base model.
The black oil simulator IMEX uses 4-components but threephases to simulate miscible flooding. The 4-components are water,oil, dissolved gas and injected gas (solvent). The three phases arewater, oil and gas which includes dissolved gas and injected gasin the free gas state. Both the injected gas and the original dis-solved gas have the same properties. The specific gravity (ratio ofthe gas density to the air density) is 0.8. The oil compressibilityis 1�10�5 psi�1. The mixing of solvent and free gas is governed byxg (OMEGASG in IMEX), which is assumed pressure independent.xg is bounded by zero and one. Since solvent-gas has a lowermobility ratio than oil, xg is usually greater than xomax. In our caseOMEGASG is set as 1.0, assuming solvent and free gas have a com-plete mixing. In this base simulation model, the injection is con-trolled by the maximum solvent injection rate for a half well of400 Mscf/day and the maximum injection pressure of 7000 psi.
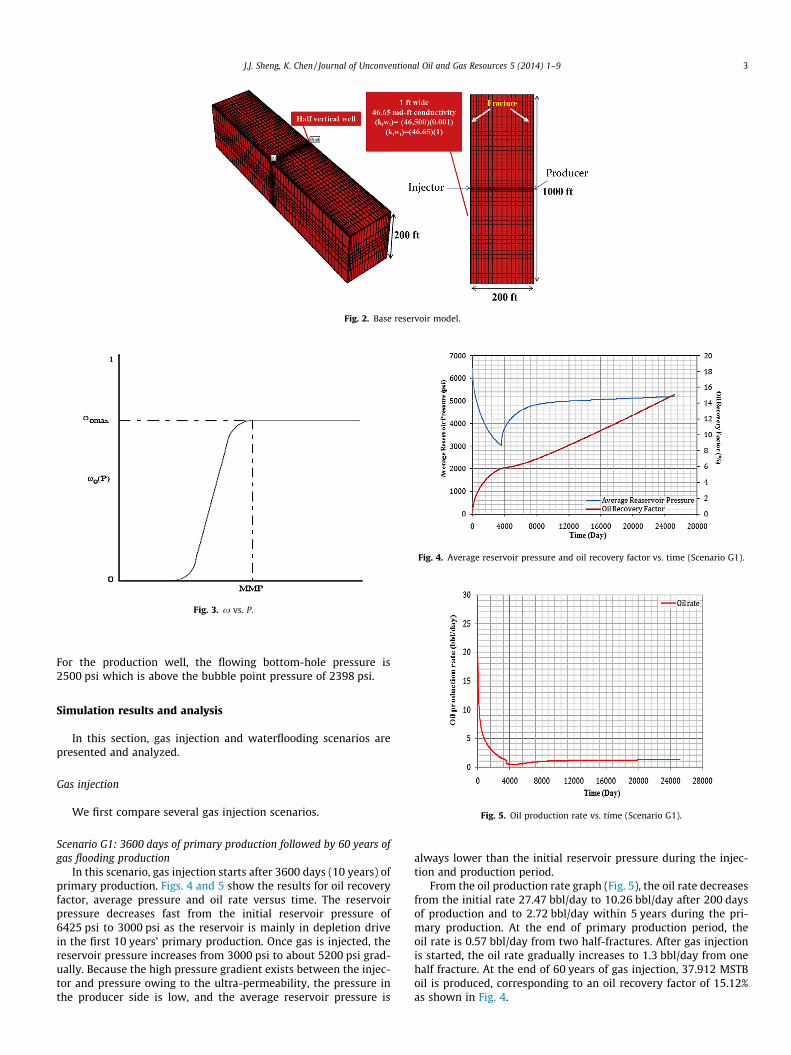
Fig. 2. Base reservoir model.
Fig. 3. x vs. P.
Fig. 4. Average reservoir pressure and oil recovery factor vs. time (Scenario G1).
J.J. Sheng, K. Chen / Journal of Unconventional Oil and Gas Resources 5 (2014) 1–9 3
For the production well, the flowing bottom-hole pressure is2500 psi which is above the bubble point pressure of 2398 psi.
Fig. 5. Oil production rate vs. time (Scenario G1).
Simulation results and analysis
In this section, gas injection and waterflooding scenarios arepresented and analyzed.
Gas injection
We first compare several gas injection scenarios.
Scenario G1: 3600 days of primary production followed by 60 years ofgas flooding production
In this scenario, gas injection starts after 3600 days (10 years) ofprimary production. Figs. 4 and 5 show the results for oil recoveryfactor, average pressure and oil rate versus time. The reservoirpressure decreases fast from the initial reservoir pressure of6425 psi to 3000 psi as the reservoir is mainly in depletion drivein the first 10 years’ primary production. Once gas is injected, thereservoir pressure increases from 3000 psi to about 5200 psi grad-ually. Because the high pressure gradient exists between the injec-tor and pressure owing to the ultra-permeability, the pressure inthe producer side is low, and the average reservoir pressure is
always lower than the initial reservoir pressure during the injec-tion and production period.
From the oil production rate graph (Fig. 5), the oil rate decreasesfrom the initial rate 27.47 bbl/day to 10.26 bbl/day after 200 daysof production and to 2.72 bbl/day within 5 years during the pri-mary production. At the end of primary production period, theoil rate is 0.57 bbl/day from two half-fractures. After gas injectionis started, the oil rate gradually increases to 1.3 bbl/day from onehalf fracture. At the end of 60 years of gas injection, 37.912 MSTBoil is produced, corresponding to an oil recovery factor of 15.12%as shown in Fig. 4.
4 J.J. Sheng, K. Chen / Journal of Unconventional Oil and Gas Resources 5 (2014) 1–9
The pressure data and oil rate data are further analyzed. At theend of primary production, the average reservoir pressure is about3000 psi. The well BHP is 2500 psi. The pressure drawdown isabout 500 psi. During the gas injection period, the average reser-voir pressure is about 5200 psi. Then the pressure drawdownbecomes 2700 psi which is about 5 times that at the end of primaryproduction. During this time, the well rate from one half-fracture is1.3 bbl/day which is about 2.3 times that rate (0.57 bbl/day) at theend of primary production. Because 1.3 bbl/day is from onehalf-fracture, then the rate from two half-fractures would be2.6 bbl/day if both of the half-fractures produced. Then the rateof 2.6 bbl/day is 4.6 times the rate of 0.57 bbl/day from the twohalf-fractures. This rate ratio is close the pressure drawdown ratioof about 5 (the pressure drawdown during the injection period tothat at the end of primary production). From the Darcy rate equa-tion (Eq. (1)), if the pressure drawdown Dp is increased 5 times, therate is also increased about 5 times only if the viscosity l does notchange, because the other parameters in Eq. (1) (permeability k,flow area A and distance DL from the matrix to fracture) are almostunchanged.
q ¼ kAðDpÞlðDLÞ : ð1Þ
From this analysis, it is clear that the main mechanism from gasinjection is mainly pressure maintenance.
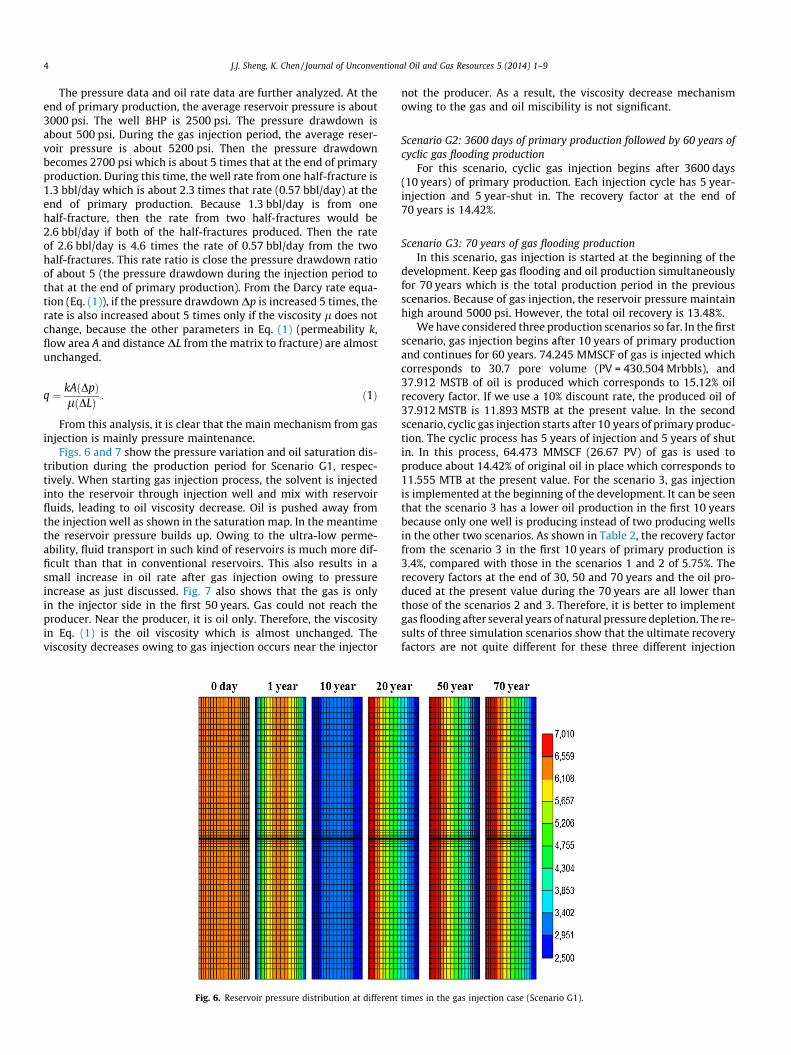
Figs. 6 and 7 show the pressure variation and oil saturation dis-tribution during the production period for Scenario G1, respec-tively. When starting gas injection process, the solvent is injectedinto the reservoir through injection well and mix with reservoirfluids, leading to oil viscosity decrease. Oil is pushed away fromthe injection well as shown in the saturation map. In the meantimethe reservoir pressure builds up. Owing to the ultra-low perme-ability, fluid transport in such kind of reservoirs is much more dif-ficult than that in conventional reservoirs. This also results in asmall increase in oil rate after gas injection owing to pressureincrease as just discussed. Fig. 7 also shows that the gas is onlyin the injector side in the first 50 years. Gas could not reach theproducer. Near the producer, it is oil only. Therefore, the viscosityin Eq. (1) is the oil viscosity which is almost unchanged. Theviscosity decreases owing to gas injection occurs near the injector
Fig. 6. Reservoir pressure distribution at different
not the producer. As a result, the viscosity decrease mechanismowing to the gas and oil miscibility is not significant.
Scenario G2: 3600 days of primary production followed by 60 years ofcyclic gas flooding production
For this scenario, cyclic gas injection begins after 3600 days(10 years) of primary production. Each injection cycle has 5 year-injection and 5 year-shut in. The recovery factor at the end of70 years is 14.42%.
Scenario G3: 70 years of gas flooding productionIn this scenario, gas injection is started at the beginning of the
development. Keep gas flooding and oil production simultaneouslyfor 70 years which is the total production period in the previousscenarios. Because of gas injection, the reservoir pressure maintainhigh around 5000 psi. However, the total oil recovery is 13.48%.
We have considered three production scenarios so far. In the firstscenario, gas injection begins after 10 years of primary productionand continues for 60 years. 74.245 MMSCF of gas is injected whichcorresponds to 30.7 pore volume (PV = 430.504 Mrbbls), and37.912 MSTB of oil is produced which corresponds to 15.12% oilrecovery factor. If we use a 10% discount rate, the produced oil of37.912 MSTB is 11.893 MSTB at the present value. In the secondscenario, cyclic gas injection starts after 10 years of primary produc-tion. The cyclic process has 5 years of injection and 5 years of shutin. In this process, 64.473 MMSCF (26.67 PV) of gas is used toproduce about 14.42% of original oil in place which corresponds to11.555 MTB at the present value. For the scenario 3, gas injectionis implemented at the beginning of the development. It can be seenthat the scenario 3 has a lower oil production in the first 10 yearsbecause only one well is producing instead of two producing wellsin the other two scenarios. As shown in Table 2, the recovery factorfrom the scenario 3 in the first 10 years of primary production is3.4%, compared with those in the scenarios 1 and 2 of 5.75%. Therecovery factors at the end of 30, 50 and 70 years and the oil pro-duced at the present value during the 70 years are all lower thanthose of the scenarios 2 and 3. Therefore, it is better to implementgas flooding after several years of natural pressure depletion. The re-sults of three simulation scenarios show that the ultimate recoveryfactors are not quite different for these three different injection
times in the gas injection case (Scenario G1).
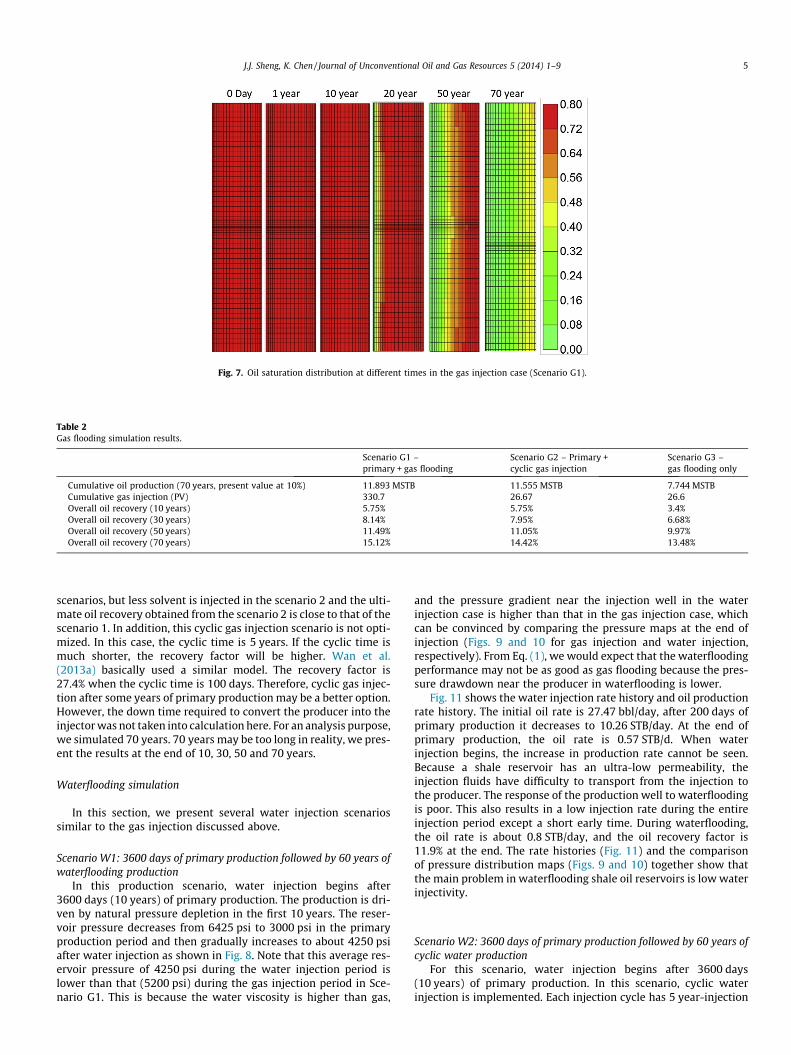
Fig. 7. Oil saturation distribution at different times in the gas injection case (Scenario G1).
Table 2Gas flooding simulation results.
Scenario G1 –primary + gas flooding
Scenario G2 – Primary +cyclic gas injection
Scenario G3 –gas flooding only
Cumulative oil production (70 years, present value at 10%) 11.893 MSTB 11.555 MSTB 7.744 MSTBCumulative gas injection (PV) 330.7 26.67 26.6Overall oil recovery (10 years) 5.75% 5.75% 3.4%Overall oil recovery (30 years) 8.14% 7.95% 6.68%Overall oil recovery (50 years) 11.49% 11.05% 9.97%Overall oil recovery (70 years) 15.12% 14.42% 13.48%
J.J. Sheng, K. Chen / Journal of Unconventional Oil and Gas Resources 5 (2014) 1–9 5
scenarios, but less solvent is injected in the scenario 2 and the ulti-mate oil recovery obtained from the scenario 2 is close to that of thescenario 1. In addition, this cyclic gas injection scenario is not opti-mized. In this case, the cyclic time is 5 years. If the cyclic time ismuch shorter, the recovery factor will be higher. Wan et al.(2013a) basically used a similar model. The recovery factor is27.4% when the cyclic time is 100 days. Therefore, cyclic gas injec-tion after some years of primary production may be a better option.However, the down time required to convert the producer into theinjector was not taken into calculation here. For an analysis purpose,we simulated 70 years. 70 years may be too long in reality, we pres-ent the results at the end of 10, 30, 50 and 70 years.
Waterflooding simulation
In this section, we present several water injection scenariossimilar to the gas injection discussed above.
Scenario W1: 3600 days of primary production followed by 60 years ofwaterflooding production
In this production scenario, water injection begins after3600 days (10 years) of primary production. The production is dri-ven by natural pressure depletion in the first 10 years. The reser-voir pressure decreases from 6425 psi to 3000 psi in the primaryproduction period and then gradually increases to about 4250 psiafter water injection as shown in Fig. 8. Note that this average res-ervoir pressure of 4250 psi during the water injection period islower than that (5200 psi) during the gas injection period in Sce-nario G1. This is because the water viscosity is higher than gas,
and the pressure gradient near the injection well in the waterinjection case is higher than that in the gas injection case, whichcan be convinced by comparing the pressure maps at the end ofinjection (Figs. 9 and 10 for gas injection and water injection,respectively). From Eq. (1), we would expect that the waterfloodingperformance may not be as good as gas flooding because the pres-sure drawdown near the producer in waterflooding is lower.
Fig. 11 shows the water injection rate history and oil productionrate history. The initial oil rate is 27.47 bbl/day, after 200 days ofprimary production it decreases to 10.26 STB/day. At the end ofprimary production, the oil rate is 0.57 STB/d. When waterinjection begins, the increase in production rate cannot be seen.Because a shale reservoir has an ultra-low permeability, theinjection fluids have difficulty to transport from the injection tothe producer. The response of the production well to waterfloodingis poor. This also results in a low injection rate during the entireinjection period except a short early time. During waterflooding,the oil rate is about 0.8 STB/day, and the oil recovery factor is11.9% at the end. The rate histories (Fig. 11) and the comparisonof pressure distribution maps (Figs. 9 and 10) together show thatthe main problem in waterflooding shale oil reservoirs is low waterinjectivity.
Scenario W2: 3600 days of primary production followed by 60 years ofcyclic water production
For this scenario, water injection begins after 3600 days(10 years) of primary production. In this scenario, cyclic waterinjection is implemented. Each injection cycle has 5 year-injection

Fig. 8. Average reservoir pressure and oil recovery factor vs. time for Scenario W1.
6 J.J. Sheng, K. Chen / Journal of Unconventional Oil and Gas Resources 5 (2014) 1–9
and 5 year-shut in. The overall recovery factor at the end of70 years is 11.03%.
0 100
0 100
10,000
Pressure (psi) 2078-12-3
Fig. 9. Pressure at the end of ga
0 100
0 100
10,000
Pressure (psi) 2078-12-
Fig. 10. Pressure at the end of wa
Scenario W3: 70 years of waterflooding productionIn this scenario, water injection is started at the beginning of
the development. Keep water injection and oil production simulta-neously for 70 years. When water injection starts at the beginningof the production, the initial production rate is lower than previousscenarios because only one half-fractured well is producing in thebeginning, and the reservoir pressure decreases slowly from initialreservoir pressure to 4000 psi. The ultimate oil recovery factor is11%.
Three production scenarios of waterflooding have been simu-lated with the results presented in Table 3. In the first scenario,water injection begins after 10 years of primary production andcontinues for 60 years. 27.020 MSTB of water is injected which cor-responds to 0.063 PV, and 29.872 MSTB of oil is produced whichcorresponds to 11.9% oil recovery factor. In the second scenario,cyclic water injection begins after 10 years of primary production.The cyclic injection process has 5 years of injection and 5 years ofshut in. In this process, 21.883 MSTB of water (0.051 PV) is usedto produce about 11.03% of original oil in place. For the scenario
200
200
9,90
010
,000
0.00 35.00 70.00 feet0.00 10.00 20.00 meters
File: 1inj_1prod_36User: jshengDate: 10/26/2013Scale: 1:481.64478Z/X: 1.00:1Axis Units: ft
2,490
0 J layer: 27
s injection for Scenario G1.
200
200
9,90
010
,000
0.00 35.00 70.00 feet0.00 10.00 20.00 meters
File: 1inj_1prod_waUser: jshengDate: 10/26/2013Scale: 1:481.64478Z/X: 1.00:1Axis Units: ft
2,490
30 J layer: 27
ter injection for Scenario W1.

Fig. 11. Oil rate & injection rate vs. time for Scenario W1.
Table 4Effect of half-fracture length.
Half-fracture Length, ft Recovery factor, %
500 15.1365 12.6245 9.1125 5.5
Fig. 12. Oil recovery factor vs. half-fracture length.
J.J. Sheng, K. Chen / Journal of Unconventional Oil and Gas Resources 5 (2014) 1–9 7
3, water injection is implemented at the beginning of the develop-ment. We can understand that the scenario W3 has a lower oil pro-duction in the first 10 years because only one half-production wellis used instead of two half-production wells in the other two sce-narios. The recovery factors at the end of 30, 50 and 70 years, andthe oil produced at the present value during the 70 years are alllower than those of the scenarios 2 and 3. So it is better to imple-ment waterflooding after several years of natural pressure deple-tion so that some oil can be produced during early depletion.Similar to the gas injection cases, however, the down time requiredto convert the producer into the injector was not taken into calcu-lation in this comparison.
Further sensitivity analysis
The above simulation study shows that gas flooding is a betteroption than waterflooding. In this section, we will further do somesensitivity analysis of gas flooding. Sensitivity analysis is a quanti-tative method of determining the important parameters whichaffect shale oil production performance. The base model is3600 days of primary production followed by 60 years of gas injec-tion. The parameters considered in this paper include fracturehalf-length, flowing bottom-hole pressure, matrix permeabilityand fracture spacing.
Fracture half-lengthThe fracture half-length used in the base model is 500 ft. Three
other fracture half-lengths of 365, 245, and 125 ft are selected tocompare the effect of fracture length on gas flooding production.The simulation result shows that the reservoir pressure decreasesfaster in the case of longer fracture half-length in primary produc-tion period. The average reservoir pressure at the end of 10 yearsstays lower with longer fracture half-length. A longer fracturelength has a higher drainage volume of the reservoir which createsproportionately higher production rates and the gas injection pro-cess can have a better effect in maintaining the reservoir pressurewhich leads to a higher cumulative oil production and a higher
Table 3Waterflooding simulation results.
Scenario W1 – primwaterflooding
Cumulative oil production (present value at 10%) 11.627 MSTBCumulative water injection (PV) 0.063Overall oil recovery (10 years) 5.73%Overall oil recovery (30 years) 7.59%Overall oil recovery (50 years) 9.8%Overall oil recovery (70 years) 11.9%
ultimate recovery factor. The oil recovery factors at the end of60 years of gas injection for different half-fracture lengths areshown in Table 4. The data show that the recovery factors arealmost a linear function of the half-length, as shown in Fig. 12. Inour model, near the fracture, it is almost linear flow. The flow areaA in Eq. (1) is proportional to the half-fracture length. Therefore, ifthe half-fracture length is increased, A is increased proportionally.Thus the flow rate and the resulting oil recovery factor will beincreased linearly with the half-fracture length.
Flowing bottom-hole pressureIn the base model, we consider a system where the pressure is
maintained high enough to guarantee the entire reservoir remainssingle phase throughout the gas flooding process. The base gasinjection model is controlled by flowing bottom-hole pressure(FBHP) which was set up to 2500 psi. Now we will test the produc-tion performance under different FBHP. The flowing bottom-holepressures selected are 1500, 1000 and 500 psi.
At the end of 10 years (3600 days) of primary production, theaverage reservoir pressures are lowered to 2279 and 2392 psi forthe flowing bottom-hole pressures of 500 and 1000 psi, respec-tively. As expected, with a lower flowing bottom-hole pressure, ahigher rate and a higher oil recovery factor can be achieved atthe end of the primary production period (at 3600 days). After thatthe oil rate for the lower FBHP is lower than that for the higherFBHP in the early injection period from 4000 days to 8000 days.During this period, the reservoir pressure is below the bubble pointpressure. It indicates that the two-phase flow decreases the effi-ciency of gas flooding. Later gas injection causes the reservoir pres-sure to rise and become higher than the bubble point pressure.
ary + Scenario W2 – primary +cyclic waterflooding
Scenario W3 –waterflooding only
11.555 MSTB 7.578 MSTB0.051 0.0565.73% 3.39%7.21% 6.41%9.30% 8.87%11.03% 11.05%
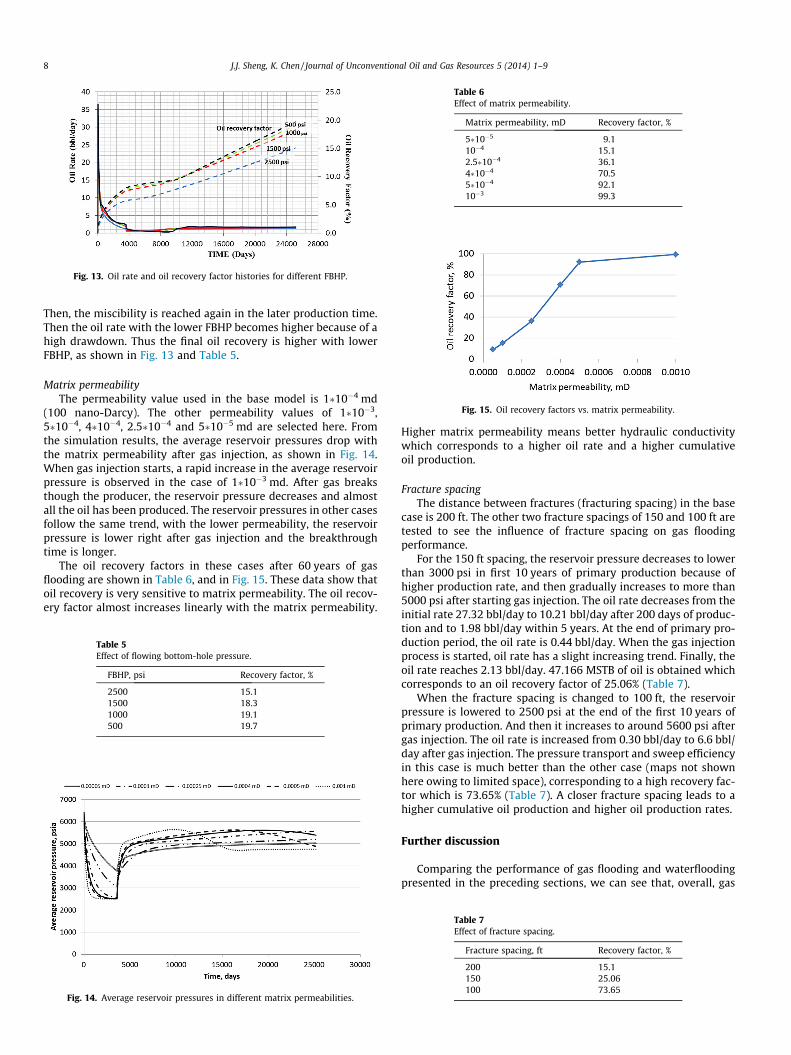
Fig. 13. Oil rate and oil recovery factor histories for different FBHP.
Table 6Effect of matrix permeability.
Matrix permeability, mD Recovery factor, %
5�10�5 9.110�4 15.12.5�10�4 36.14�10�4 70.55�10�4 92.110�3 99.3
Fig. 15. Oil recovery factors vs. matrix permeability.
8 J.J. Sheng, K. Chen / Journal of Unconventional Oil and Gas Resources 5 (2014) 1–9
Then, the miscibility is reached again in the later production time.Then the oil rate with the lower FBHP becomes higher because of ahigh drawdown. Thus the final oil recovery is higher with lowerFBHP, as shown in Fig. 13 and Table 5.
Matrix permeabilityThe permeability value used in the base model is 1�10�4 md
(100 nano-Darcy). The other permeability values of 1�10�3,5�10�4, 4�10�4, 2.5�10�4 and 5�10�5 md are selected here. Fromthe simulation results, the average reservoir pressures drop withthe matrix permeability after gas injection, as shown in Fig. 14.When gas injection starts, a rapid increase in the average reservoirpressure is observed in the case of 1�10�3 md. After gas breaksthough the producer, the reservoir pressure decreases and almostall the oil has been produced. The reservoir pressures in other casesfollow the same trend, with the lower permeability, the reservoirpressure is lower right after gas injection and the breakthroughtime is longer.
The oil recovery factors in these cases after 60 years of gasflooding are shown in Table 6, and in Fig. 15. These data show thatoil recovery is very sensitive to matrix permeability. The oil recov-ery factor almost increases linearly with the matrix permeability.
Table 5Effect of flowing bottom-hole pressure.
FBHP, psi Recovery factor, %
2500 15.11500 18.31000 19.1500 19.7
Fig. 14. Average reservoir pressures in different matrix permeabilities.
Higher matrix permeability means better hydraulic conductivitywhich corresponds to a higher oil rate and a higher cumulativeoil production.
Fracture spacingThe distance between fractures (fracturing spacing) in the base
case is 200 ft. The other two fracture spacings of 150 and 100 ft aretested to see the influence of fracture spacing on gas floodingperformance.
For the 150 ft spacing, the reservoir pressure decreases to lowerthan 3000 psi in first 10 years of primary production because ofhigher production rate, and then gradually increases to more than5000 psi after starting gas injection. The oil rate decreases from theinitial rate 27.32 bbl/day to 10.21 bbl/day after 200 days of produc-tion and to 1.98 bbl/day within 5 years. At the end of primary pro-duction period, the oil rate is 0.44 bbl/day. When the gas injectionprocess is started, oil rate has a slight increasing trend. Finally, theoil rate reaches 2.13 bbl/day. 47.166 MSTB of oil is obtained whichcorresponds to an oil recovery factor of 25.06% (Table 7).
When the fracture spacing is changed to 100 ft, the reservoirpressure is lowered to 2500 psi at the end of the first 10 years ofprimary production. And then it increases to around 5600 psi aftergas injection. The oil rate is increased from 0.30 bbl/day to 6.6 bbl/day after gas injection. The pressure transport and sweep efficiencyin this case is much better than the other case (maps not shownhere owing to limited space), corresponding to a high recovery fac-tor which is 73.65% (Table 7). A closer fracture spacing leads to ahigher cumulative oil production and higher oil production rates.
Further discussion
Comparing the performance of gas flooding and waterfloodingpresented in the preceding sections, we can see that, overall, gas
Table 7Effect of fracture spacing.
Fracture spacing, ft Recovery factor, %
200 15.1150 25.06100 73.65

J.J. Sheng, K. Chen / Journal of Unconventional Oil and Gas Resources 5 (2014) 1–9 9
flooding is better than waterflooding in improving oil recovery inshale oil reservoirs. Another important benefit of gas flooding isthat natural gas is available in field and the price is currentlylow. On the contrary, water sources are limited in some areas.More importantly, as a lot of water is used in fracturing shale res-ervoirs, we need to try to use less water in producing oil.
However, shale-water interactions are not considered in thispaper. Recently, we observed that the water may help to generatemicrofractures or open existing microfractures (Morsy et al.,2013a–e). If so, waterflooding performance might be better thanwhat is predicted in this paper.
In the process of gas flooding, gas can be absorbed and desorbedin the shale rock, However, the adsorption and desorption have notbeen included in this current paper for a couple of reasons. Theadsorption and desorption may primarily affect the amount ofgas needed. Adsorption and desorption are complex processes,which have not been well understood. Including these processesin the current simulation will result in more uncertainty. Similarto the shale-water interaction, such work is our next researcheffort.
Conclusions
Gas and waterflooding are studied in this paper using the sim-ulation approach. Based on this study, the following conclusionsare reached.
1. Because of the ultra-low permeability of shale reservoirs,injected gas can only miscible with the oil near the fractureregion. The main mechanism of gas injection is the pressuremaintenance.
2. According to the sensitivity analysis, low matrix permeability isthe main factor that causes low oil recovery from shale reser-voirs. A close fracture spacing will have a significant effect onshale oil production. It leads to a higher initial production rateand a much better sweep efficiency for miscible gas flooding.
3. In an ultra-low porosity and ultra-low permeability shale oilreservoir, water injection through high conductivity fracturehas less effect on improving oil recovery than gas injection.Unlike miscible gas injection which can reduce oil viscosity,water injection can only provide limited pressure maintenancebecause of high pressure loss from an injector to a producer.Ultra-low permeability results in a low productivity and lowinjectivity. Therefore, the performance of water injection ispoor. This conclusion did not include the water-shale rockinteraction which may improve waterflooding performance.
4. Comparing the simulation results of gas flooding with water-flooding, miscible gas injection has a better effect on improvingoil recovery in shale reservoirs. Injected solvent can be misciblewith oil, reducing oil viscosity, and lead a higher stimulated vol-
ume than water, in addition to pressure maintenance. Gas injec-tion may be a potential method to improve oil production inshale oil reservoirs.
References
Chen, K. 2013. Evaluation of the EOR potential by gas and waterflooding in shale oilreservoirs, Master thesis, Texas Tech University.
Chen, C., Balhoff, B., Mohanty, K.K., 2013. Effect of reservoir heterogeneity onimproved shale oil recovery by CO2 Huff-n-Puff, SPE 164553-MS, presented at2013 SPE Unconventional Resources Conference, Woodlands, Texas, USA, April10–12.
Fakcharoenphol, P., Charoenwongsa, S., Kazemi, H., Wu, Y.S., 2013. T The Effect ofWater-Induced Stress To Enhance Hydrocarbon Recovery in Shale Reservoirs.SPEJ 18 (5), 897–909.
Gamadi, T.D., Sheng, J.J., and Soliman, M.Y., 2013. An experimental study of cyclicgas injection to improve shale oil recovery, paper SPE 166334 presented at theSPE Annual Technical Conference and Exhibition held in New Orleans,Louisiana, USA, September 30–October 2.
Makhanov K., Dehghanpour H., and Kuru E. 2012. An experimental study ofspontaneous imbibition in Horn River shales. SPE-162650-MS presented at SPECanadian Unconventional Resources Conference, Calgary, Alberta, Canada,October 30–November 1.
Morsy, S., Gomaa, A., Sheng, J.J., Soliman, M.Y. 2013a. Potential of improvedwaterflooding in acid-hydraulically-fractured shale formations, paper SPE166403 presented at the SPE Annual Technical Conference and Exhibitionheld in New Orleans, Louisiana, USA, September 30–October 2.
Morsy, S., Sheng, J.J., Soliman, M.Y. 2013b. Improving hydraulic fracturing of shaleformations by acidizing, paper SPE 165688 presented at the SPE EasternRegional Meeting held in Pittsburgh, Pennsylvania, USA, August 20–22.
Morsy, S., Hetherington, C.J., Sheng, J.J. 2013c. Effect of low-concentration HCl onthe mineralogical, mechanical, and physical properties of shale rocks, paper SPE165689 presented at the SPE Eastern Regional Meeting held in Pittsburgh,Pennsylvania, USA, August 20–22.
Morsy, S., Sheng, J.J., Hetherington, C.J., Soliman, M.Y., Ezewu, R.O. 2013d. Impact ofmatrix acidizing on shale formations, paper SPE 167568 presented at theNigeria Annual International Conference and Exhibition held in Lagos, Nigeria,August 5–7.
Morsy, S., Sheng, J.J., Roland O. Ezewu, 2013e. Potential of waterflooding in shaleformations, paper SPE 167510 presented at the Nigeria Annual InternationalConference and Exhibition held in Lagos, Nigeria, August 5–7.
Rubin, B. 2010. Accurate simulation of non darcy flow in stimulated fractured shalereservoirs, paper SPE 132093 presented at the SPE Western Regional Meeting,Anaheim, California, May 27–29.
Takahashi S., Kovscek A.R. 2009. Spontaneous counter current imbibition and forceddisplacement characteristics of low permeability, siliceous rocks. SPE-121354-MS presented at SPE Western Regional Meeting, San Jose, California.
Todd, M.R., Longstaff, W.J., 1972. The Development, testing, and application of anumerical simulator for predicting miscible flood performance. J. Pet. Technol.24 (7), 874–882.
Wan, T., 2013. Evaluation of the EOR Potential in Shale Oil Reservoirs by Cyclic GasInjection. Texas Tech University, Master thesis.
Wan, T., Sheng, J.J., and Soliman, M.Y. 2013a. Evaluation of the EOR potential inshale oil reservoirs by cyclic gas injection, paper SPWLA-D-12-00119 presentedat the SPWLA 54th Annual Logging Symposium held in New Orleans, Louisiana,June 22–26.
Wan, T., Sheng, J.J., and Soliman, M.Y. 2013b. Evaluation of the EOR potential infractured shale oil reservoirs by cyclic gas injection, paper SPE 16880 or URTeC1611383 presented at the Unconventional Resources Technology Conferenceheld in Denver, Colorado, USA, August 12–14, 2013.
Wood, T., Milne, B. 2011. Waterflood potential could unlock billions of barrels:crescent point energy. http://www.investorvillage.com/uploads/44821/files/CPGdundee.pdf (accessed October 27, 2013).