Embed Size (px)
Citation preview
Production Operations Manual: An approach for the implementation
of Quality Management System in a ceramic manufacturing company
CALVIN KARL R. GARGANTA
Bachelor of Science in Industrial Engineering, Holy Angel University
#1, Holy Angel Avenue, Sto. Rosario, Angeles City 2009
Email: [email protected]
Website: ph.linkedin.com/in/ckgarganta
CARLO G. GOMEZ
Bachelor of Science in Industrial Engineering, Holy Angel University
#1, Holy Angel Avenue, Sto. Rosario, Angeles City 2009
Email: [email protected]
ABSTRACT
Quality Management System (QMS) directs and controls an organization in order to continually improve
the efficiency and effectiveness of its performance. It is done through quality commitments and by series
of extensive documentation of procedures, work instructions and guidelines. This study establishes a
Production Operations Manual for Asia Ceramics Corporation (ACC) to serve as an approach for the
implementation of Quality Management System. It aims to make the production of ceramics standardized
and detailed in order to meet the customer specifications and to acquire customer loyalty. Series of surveys,
interviews and meetings attended served as bases for the establishment of the standardized procedures and
work instructions. A favorable response from respondents were acquired from the manual evaluation. An
Ishikawa diagram and Pareto analysis were the tools used for the problem identification and Deming’s cycle
for the construction of this study.
Keywords. Ceramic Industry, Quality, Quality Management System, Ishikawa diagram, Pareto analysis,
Deming’s Cycle, Continuous Improvement
1. INTRODUCTION Quality varies. However, it is perceived and can be defined. Therefore it is known—and can be measured.
Quality is the totality of features and characteristics of a product or service in which it conforms to a design
or specification (Render, Stair & Hanna, 2012). Basically, a design or specification is given by the consumer
in which the manufacturer should follow. In a design, conformance to every specification is a key point
towards accessing the quality needed by the consumer. This states that the consumer is the first benchmark
with regards to the product’s physical quality. According to Henry Ford (as stated in Scherkenbach, 1991),
quality is defined and specified by the consumers: that throughout their lives, products and services should
meet and exceed their needs.
The conformance to customer specification defines the manufacturing-based definition, one out of five
definitions of quality by Garvin. According to Hopp & Spearman (2008), quality corresponds with the
alignment to given specifications from the start to the end of its production. Dalota (2011) stated that
manufacturing-based definition of quality deals with the engineering and manufacturing practices which
mainly concentrates on the conformance to requirements and specifications. These requirements and
specifications are established designs; and any unconformity tantamount to a reduction in quality. This
implies that quality is doing the products right for the first time.
Asia Ceramics Corporation (ACC) has been in the ceramic industry for 30 long years. It started as
a small family-run business with less than 20 employees in the pottery village of Sto. Tomas, Pampanga.
Now, the company operates with around 200 employees. Just like other companies, Asia Ceramics
Corporation wants to continually improve its yearly production performance. As stated by Martinich
(1997), quality is an important component in every industry. It serves as a set of standards in which products
should conform to assigned specifications. The quality and its conformance reflects on how the company
standardize and improves its processes, research and development, manufacture and deliver products for
the benefit of their consumers. However, it will not be improved unless proper quality management is
implemented. Quality Management, as referred by International Organization for Standardization (ISO),
includes all the organizations’ activities that are used to direct, control and coordinate quality. These
activities include the formulation of quality policies and setting of quality objectives. Quality Management
also include quality planning, quality control, quality assurance and quality improvement. According to
Edwards Deming (2014) [motion picture], Quality Management is not managing outcomes and defects.
Quality Management is looking deeper at the system, creating a standardized operation making different
varieties work as one and tracing where the defects are being produced and are coming from.
2. LITERATURE REVIEW According to the study of Canos regarding quality control in ceramic industry (2009), quality is
one of the most important factors towards success in production operations. Every company should account
their control and management within the plant and in relation to the processes. It was pointed out that even
if the clays, as their raw materials, are in their greatest condition, if the procedure and the tools are not
specified, quality will not be attained. Canos proposes an application of QMS through proper
documentation and introduction of standard procedures that prevent production errors in terms of its
processes and procedures which lead to an increase in the company’s productivity.
In a dissertation done by Dalota (2011), it was mentioned that quality management concept and its
implementation plays a vital role for the survival of the industries. Quality Management plans, produces,
and develops products which are in accordance with the expectations of the consumer to ensure “effective
efficiency.” Dalota mentioned that companies who follow Quality Management System and Total Quality
Management achieve greater effective productivity, profitability and market share for most kinds of
products and market situations.
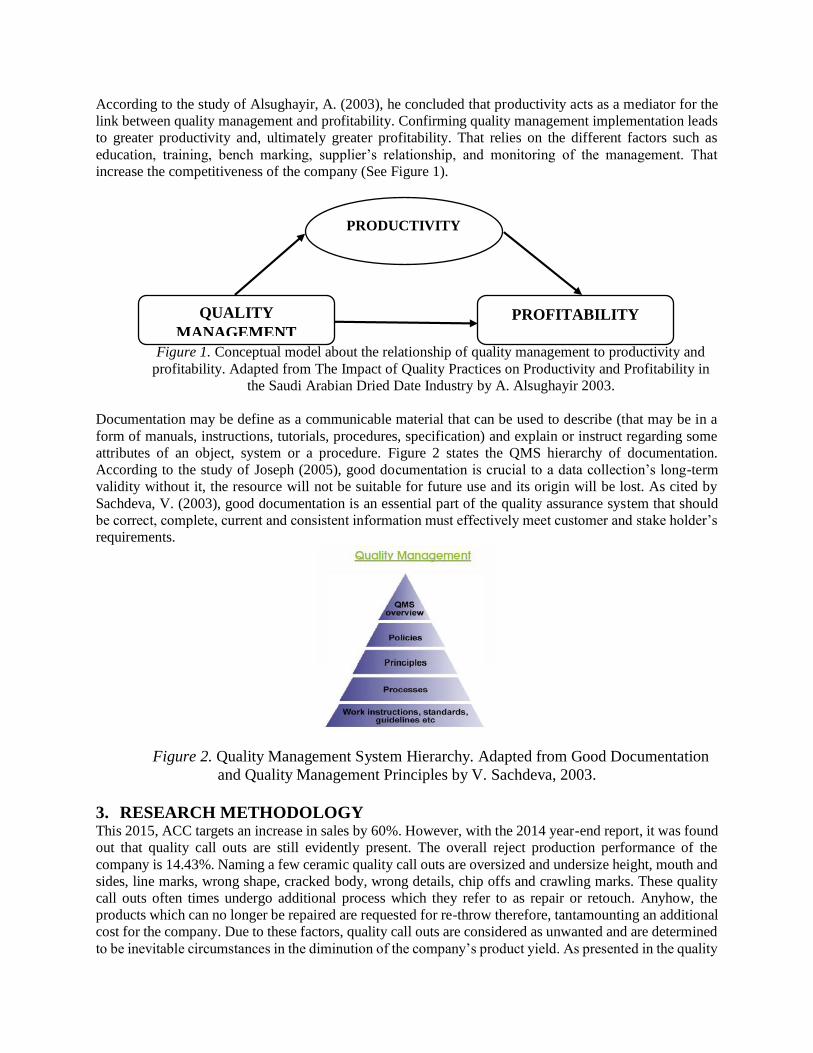
According to the study of Alsughayir, A. (2003), he concluded that productivity acts as a mediator for the
link between quality management and profitability. Confirming quality management implementation leads
to greater productivity and, ultimately greater profitability. That relies on the different factors such as
education, training, bench marking, supplier’s relationship, and monitoring of the management. That
increase the competitiveness of the company (See Figure 1).
Figure 1. Conceptual model about the relationship of quality management to productivity and
profitability. Adapted from The Impact of Quality Practices on Productivity and Profitability in
the Saudi Arabian Dried Date Industry by A. Alsughayir 2003.
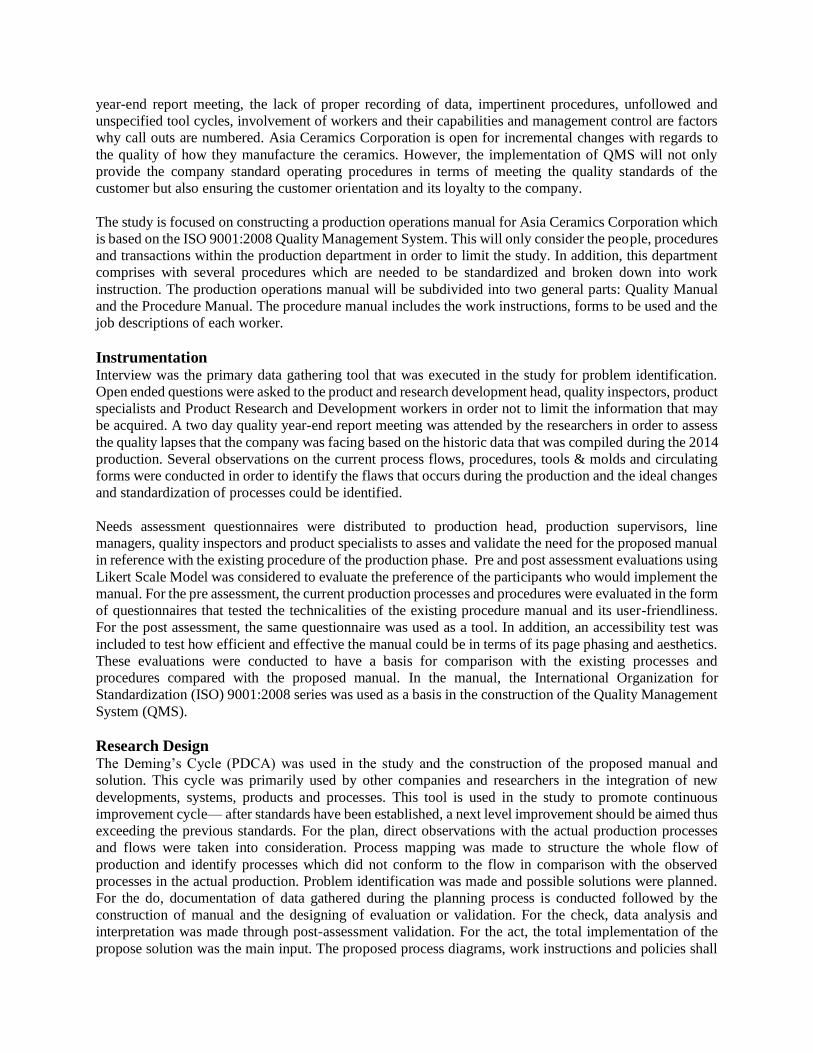
Documentation may be define as a communicable material that can be used to describe (that may be in a
form of manuals, instructions, tutorials, procedures, specification) and explain or instruct regarding some
attributes of an object, system or a procedure. Figure 2 states the QMS hierarchy of documentation.
According to the study of Joseph (2005), good documentation is crucial to a data collection’s long-term
validity without it, the resource will not be suitable for future use and its origin will be lost. As cited by
Sachdeva, V. (2003), good documentation is an essential part of the quality assurance system that should
be correct, complete, current and consistent information must effectively meet customer and stake holder’s
requirements.
Figure 2. Quality Management System Hierarchy. Adapted from Good Documentation
and Quality Management Principles by V. Sachdeva, 2003.
3. RESEARCH METHODOLOGY This 2015, ACC targets an increase in sales by 60%. However, with the 2014 year-end report, it was found
out that quality call outs are still evidently present. The overall reject production performance of the
company is 14.43%. Naming a few ceramic quality call outs are oversized and undersize height, mouth and
sides, line marks, wrong shape, cracked body, wrong details, chip offs and crawling marks. These quality
call outs often times undergo additional process which they refer to as repair or retouch. Anyhow, the
products which can no longer be repaired are requested for re-throw therefore, tantamounting an additional
cost for the company. Due to these factors, quality call outs are considered as unwanted and are determined
to be inevitable circumstances in the diminution of the company’s product yield. As presented in the quality
PRODUCTIVITY
QUALITY
MANAGEMENT PROFITABILITY
year-end report meeting, the lack of proper recording of data, impertinent procedures, unfollowed and
unspecified tool cycles, involvement of workers and their capabilities and management control are factors
why call outs are numbered. Asia Ceramics Corporation is open for incremental changes with regards to
the quality of how they manufacture the ceramics. However, the implementation of QMS will not only
provide the company standard operating procedures in terms of meeting the quality standards of the
customer but also ensuring the customer orientation and its loyalty to the company.
The study is focused on constructing a production operations manual for Asia Ceramics Corporation which
is based on the ISO 9001:2008 Quality Management System. This will only consider the people, procedures
and transactions within the production department in order to limit the study. In addition, this department
comprises with several procedures which are needed to be standardized and broken down into work
instruction. The production operations manual will be subdivided into two general parts: Quality Manual
and the Procedure Manual. The procedure manual includes the work instructions, forms to be used and the
job descriptions of each worker.
Instrumentation Interview was the primary data gathering tool that was executed in the study for problem identification.
Open ended questions were asked to the product and research development head, quality inspectors, product
specialists and Product Research and Development workers in order not to limit the information that may
be acquired. A two day quality year-end report meeting was attended by the researchers in order to assess
the quality lapses that the company was facing based on the historic data that was compiled during the 2014
production. Several observations on the current process flows, procedures, tools & molds and circulating
forms were conducted in order to identify the flaws that occurs during the production and the ideal changes
and standardization of processes could be identified.
Needs assessment questionnaires were distributed to production head, production supervisors, line
managers, quality inspectors and product specialists to asses and validate the need for the proposed manual
in reference with the existing procedure of the production phase. Pre and post assessment evaluations using
Likert Scale Model was considered to evaluate the preference of the participants who would implement the
manual. For the pre assessment, the current production processes and procedures were evaluated in the form
of questionnaires that tested the technicalities of the existing procedure manual and its user-friendliness.
For the post assessment, the same questionnaire was used as a tool. In addition, an accessibility test was
included to test how efficient and effective the manual could be in terms of its page phasing and aesthetics.
These evaluations were conducted to have a basis for comparison with the existing processes and
procedures compared with the proposed manual. In the manual, the International Organization for
Standardization (ISO) 9001:2008 series was used as a basis in the construction of the Quality Management
System (QMS).
Research Design The Deming’s Cycle (PDCA) was used in the study and the construction of the proposed manual and
solution. This cycle was primarily used by other companies and researchers in the integration of new
developments, systems, products and processes. This tool is used in the study to promote continuous
improvement cycle— after standards have been established, a next level improvement should be aimed thus
exceeding the previous standards. For the plan, direct observations with the actual production processes
and flows were taken into consideration. Process mapping was made to structure the whole flow of
production and identify processes which did not conform to the flow in comparison with the observed
processes in the actual production. Problem identification was made and possible solutions were planned.
For the do, documentation of data gathered during the planning process is conducted followed by the
construction of manual and the designing of evaluation or validation. For the check, data analysis and
interpretation was made through post-assessment validation. For the act, the total implementation of the
propose solution was the main input. The proposed process diagrams, work instructions and policies shall
serve as a key point towards the improvement of the production process. Continuous improvement was
integrated in the act area of the cycle.
Data Analysis After gathering data, data analysis and interpretation were considered. Descriptive statistics were used to
interpret the respondent’s rating on the pre and post assessment evaluations of the manuals. The results
analyzed were from the content and relevance, the manual’s user-friendliness and its over-all aspect. The
ratings given by the participants were calculated through mean averaging to reflect the over-all response.
The figures stated served as a basis for the interpretation of the mean average results.
Range Interpretation
4.21 – 5.00 Very High / Strongly Agree
3.41 – 4.20 High / Agree
2.61 – 3.40 Normal / Neutral
1.81 – 2.60 Low / Disagree
1.00 – 1.80 Very Low / Strongly Disagree
The existing procedure and proposed production operations manual were evaluated in terms of its usability
specifically its content and relevance, user-friendliness and the over-all aspect through the pre and post
assessments in the form of questionnaires.
Importance Satisfaction
5 – Very High 5 – Strongly Agree
4 – High 4 – Agree
3 – Normal 3 – Neither / Neutral
2 – Low 2 – Disagree
1 – Very Low 1 – Strongly Disagree
3. RESULTS and DISCUSSION The aim of this study is to develop a proposed manual for Asia Ceramics Corporation. The manual outlines
the process on how to create a ceramic from raw material to finished product. The manual, importantly
outlines the standards of each process including what forms to fill in, who would be the responsible person,
what specific tool to be used and defects occurring every after each process. The manual must be detailed
as possible because it will primarily be used by existing employees as their manual of operation and it can
be used as a training manual for new employees.
To be able come up with the proposed manual, ISO 9001 is used to seek and established a quality
management system that provides confidence to the company, to provide quality products that fulfill its
customers’ needs and expectation in accordance to the standards of ISO 9001.
Dealing with the fundamentals of Quality Management System and considering the sections in the standards
of ISO 9001, the following activities was considered:
Overall requirements for the quality management system and documentation.
Management responsibility, focus, policy, planning and objectives.
Product realization and process management, and
Measurement, monitoring, analysis and improvement.
The use of Quality Management System in order to improve the organizational effectiveness by establishing
goals for operational sectors, measures the work performance and reviews the effectiveness of the
organization, encouraging the customer’s feedback and manage information to improve the customer’s
satisfaction. To give employees confidence to improve organizational culture, properly documented files,
forms and system and for the continual improvement of the company system.
To describe clearly what constitutes the general set of forms of Quality Management System proper
documentation of the Quality Management System must be observed by following the four-tier pyramid
concept (See Figure 2).
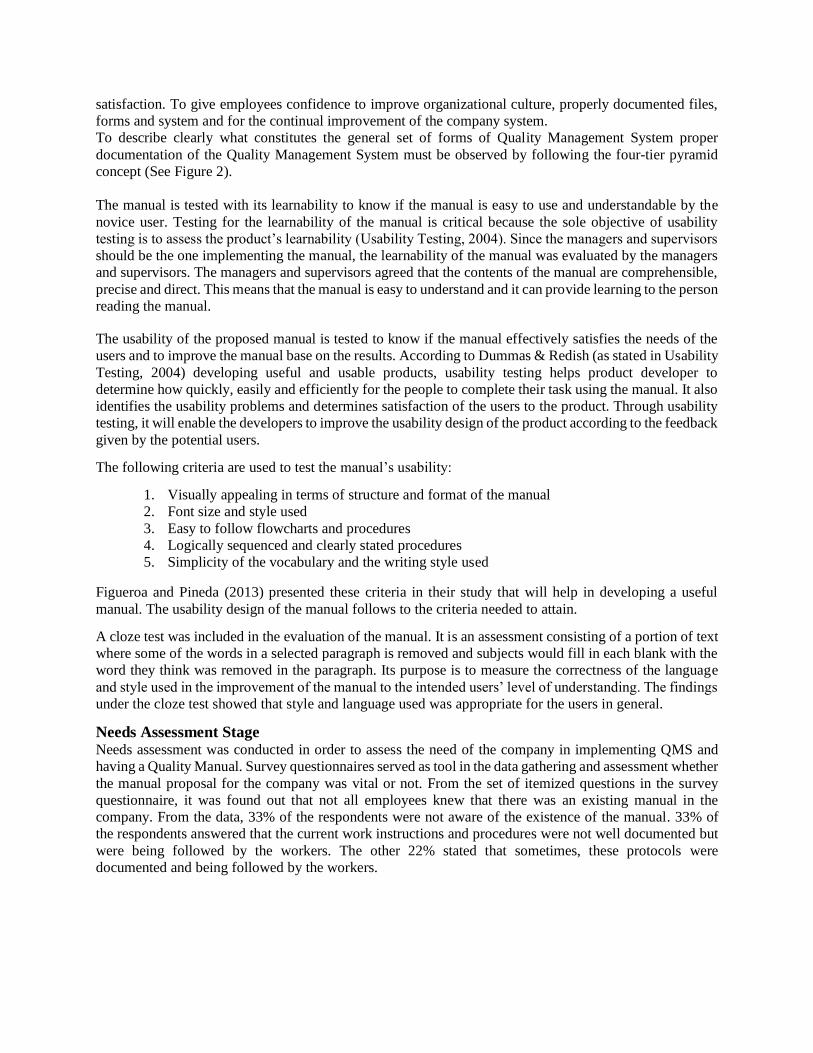
The manual is tested with its learnability to know if the manual is easy to use and understandable by the
novice user. Testing for the learnability of the manual is critical because the sole objective of usability
testing is to assess the product’s learnability (Usability Testing, 2004). Since the managers and supervisors
should be the one implementing the manual, the learnability of the manual was evaluated by the managers
and supervisors. The managers and supervisors agreed that the contents of the manual are comprehensible,
precise and direct. This means that the manual is easy to understand and it can provide learning to the person
reading the manual.
The usability of the proposed manual is tested to know if the manual effectively satisfies the needs of the
users and to improve the manual base on the results. According to Dummas & Redish (as stated in Usability
Testing, 2004) developing useful and usable products, usability testing helps product developer to
determine how quickly, easily and efficiently for the people to complete their task using the manual. It also
identifies the usability problems and determines satisfaction of the users to the product. Through usability
testing, it will enable the developers to improve the usability design of the product according to the feedback
given by the potential users.
The following criteria are used to test the manual’s usability:
1. Visually appealing in terms of structure and format of the manual
2. Font size and style used
3. Easy to follow flowcharts and procedures
4. Logically sequenced and clearly stated procedures
5. Simplicity of the vocabulary and the writing style used
Figueroa and Pineda (2013) presented these criteria in their study that will help in developing a useful
manual. The usability design of the manual follows to the criteria needed to attain.
A cloze test was included in the evaluation of the manual. It is an assessment consisting of a portion of text
where some of the words in a selected paragraph is removed and subjects would fill in each blank with the
word they think was removed in the paragraph. Its purpose is to measure the correctness of the language
and style used in the improvement of the manual to the intended users’ level of understanding. The findings
under the cloze test showed that style and language used was appropriate for the users in general.
Needs Assessment Stage Needs assessment was conducted in order to assess the need of the company in implementing QMS and
having a Quality Manual. Survey questionnaires served as tool in the data gathering and assessment whether
the manual proposal for the company was vital or not. From the set of itemized questions in the survey
questionnaire, it was found out that not all employees knew that there was an existing manual in the
company. From the data, 33% of the respondents were not aware of the existence of the manual. 33% of
the respondents answered that the current work instructions and procedures were not well documented but
were being followed by the workers. The other 22% stated that sometimes, these protocols were
documented and being followed by the workers.
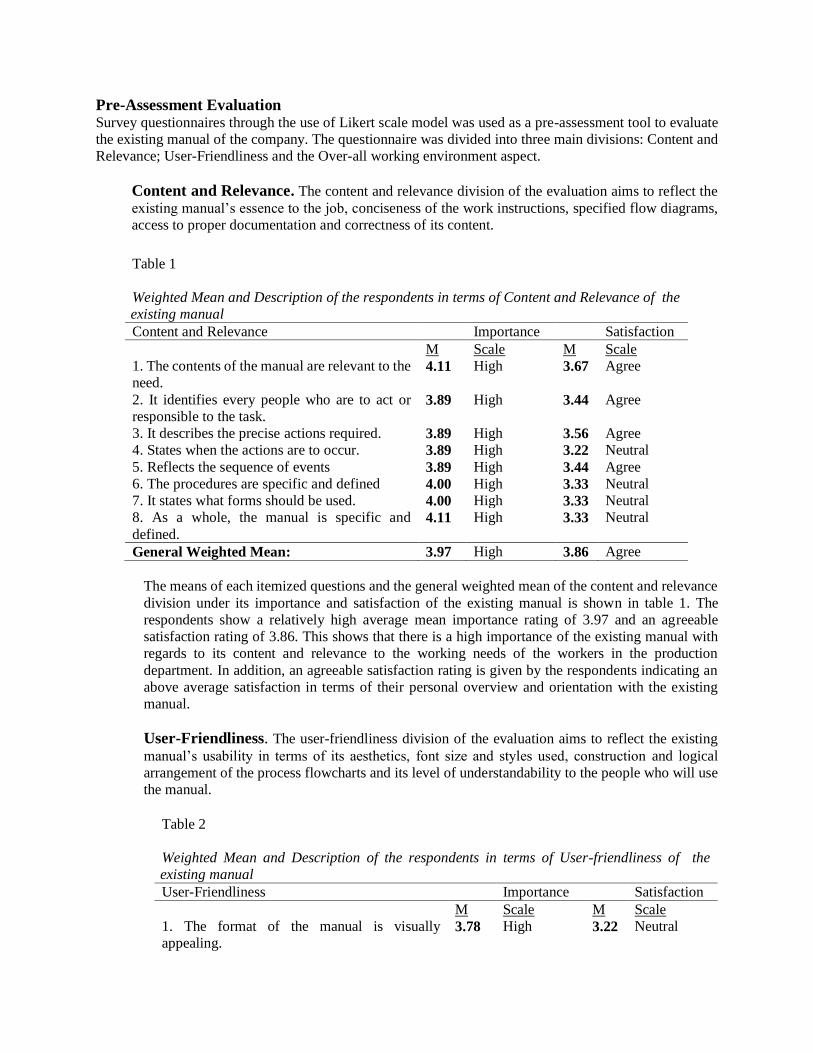
Pre-Assessment Evaluation Survey questionnaires through the use of Likert scale model was used as a pre-assessment tool to evaluate
the existing manual of the company. The questionnaire was divided into three main divisions: Content and
Relevance; User-Friendliness and the Over-all working environment aspect.
Content and Relevance. The content and relevance division of the evaluation aims to reflect the
existing manual’s essence to the job, conciseness of the work instructions, specified flow diagrams,
access to proper documentation and correctness of its content.
The means of each itemized questions and the general weighted mean of the content and relevance
division under its importance and satisfaction of the existing manual is shown in table 1. The
respondents show a relatively high average mean importance rating of 3.97 and an agreeable
satisfaction rating of 3.86. This shows that there is a high importance of the existing manual with
regards to its content and relevance to the working needs of the workers in the production
department. In addition, an agreeable satisfaction rating is given by the respondents indicating an
above average satisfaction in terms of their personal overview and orientation with the existing
manual.
User-Friendliness. The user-friendliness division of the evaluation aims to reflect the existing
manual’s usability in terms of its aesthetics, font size and styles used, construction and logical
arrangement of the process flowcharts and its level of understandability to the people who will use
the manual.
Table 1
Weighted Mean and Description of the respondents in terms of Content and Relevance of the
existing manual
Content and Relevance Importance Satisfaction
M Scale M Scale
1. The contents of the manual are relevant to the
need. 4.11 High 3.67 Agree
2. It identifies every people who are to act or
responsible to the task. 3.89 High 3.44 Agree
3. It describes the precise actions required. 3.89 High 3.56 Agree
4. States when the actions are to occur. 3.89 High 3.22 Neutral
5. Reflects the sequence of events 3.89 High 3.44 Agree
6. The procedures are specific and defined 4.00 High 3.33 Neutral
7. It states what forms should be used. 4.00 High 3.33 Neutral
8. As a whole, the manual is specific and
defined.
4.11 High 3.33 Neutral
General Weighted Mean: 3.97 High 3.86 Agree
Table 2
Weighted Mean and Description of the respondents in terms of User-friendliness of the
existing manual
User-Friendliness Importance Satisfaction
M Scale M Scale
1. The format of the manual is visually
appealing. 3.78 High 3.22 Neutral
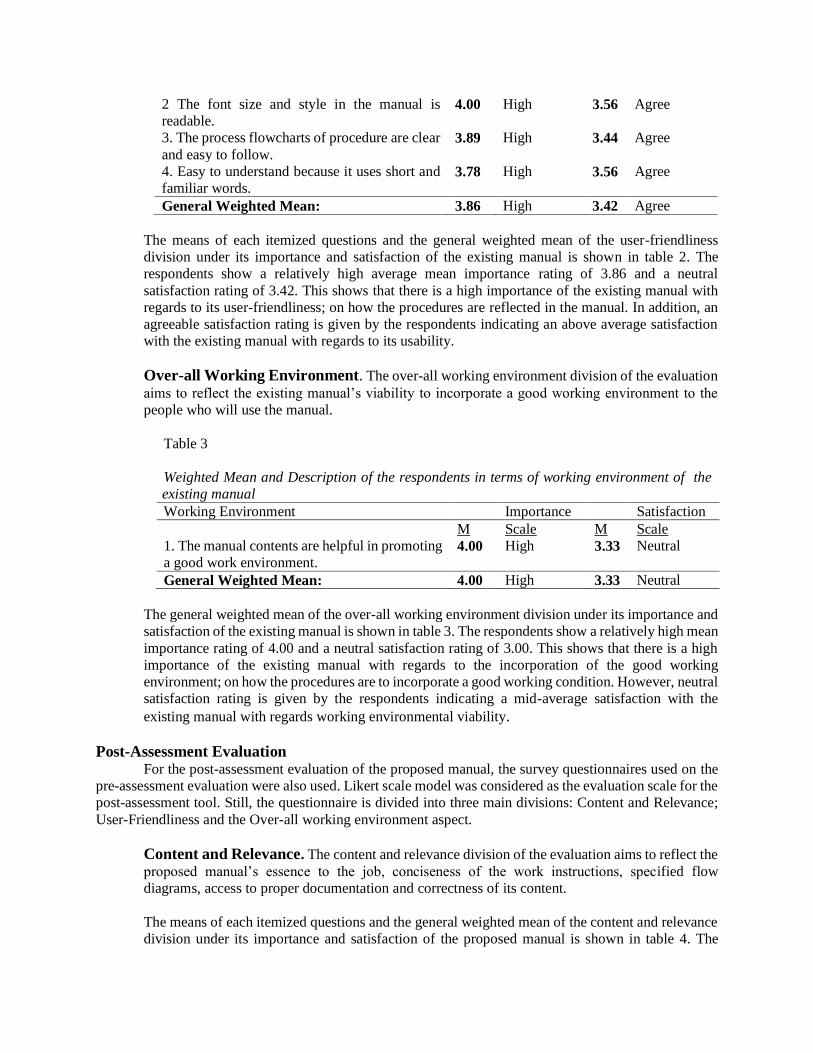
The means of each itemized questions and the general weighted mean of the user-friendliness
division under its importance and satisfaction of the existing manual is shown in table 2. The
respondents show a relatively high average mean importance rating of 3.86 and a neutral
satisfaction rating of 3.42. This shows that there is a high importance of the existing manual with
regards to its user-friendliness; on how the procedures are reflected in the manual. In addition, an
agreeable satisfaction rating is given by the respondents indicating an above average satisfaction
with the existing manual with regards to its usability.
Over-all Working Environment. The over-all working environment division of the evaluation
aims to reflect the existing manual’s viability to incorporate a good working environment to the
people who will use the manual.
Table 3
Weighted Mean and Description of the respondents in terms of working environment of the
existing manual
Working Environment Importance Satisfaction
M Scale M Scale
1. The manual contents are helpful in promoting
a good work environment. 4.00 High 3.33 Neutral
General Weighted Mean: 4.00 High 3.33 Neutral
The general weighted mean of the over-all working environment division under its importance and
satisfaction of the existing manual is shown in table 3. The respondents show a relatively high mean
importance rating of 4.00 and a neutral satisfaction rating of 3.00. This shows that there is a high
importance of the existing manual with regards to the incorporation of the good working
environment; on how the procedures are to incorporate a good working condition. However, neutral
satisfaction rating is given by the respondents indicating a mid-average satisfaction with the
existing manual with regards working environmental viability.
Post-Assessment Evaluation For the post-assessment evaluation of the proposed manual, the survey questionnaires used on the
pre-assessment evaluation were also used. Likert scale model was considered as the evaluation scale for the
post-assessment tool. Still, the questionnaire is divided into three main divisions: Content and Relevance;
User-Friendliness and the Over-all working environment aspect.
Content and Relevance. The content and relevance division of the evaluation aims to reflect the
proposed manual’s essence to the job, conciseness of the work instructions, specified flow
diagrams, access to proper documentation and correctness of its content.
The means of each itemized questions and the general weighted mean of the content and relevance
division under its importance and satisfaction of the proposed manual is shown in table 4. The
2 The font size and style in the manual is
readable. 4.00 High 3.56 Agree
3. The process flowcharts of procedure are clear
and easy to follow.
3.89 High 3.44 Agree
4. Easy to understand because it uses short and
familiar words. 3.78 High 3.56 Agree
General Weighted Mean: 3.86 High 3.42 Agree
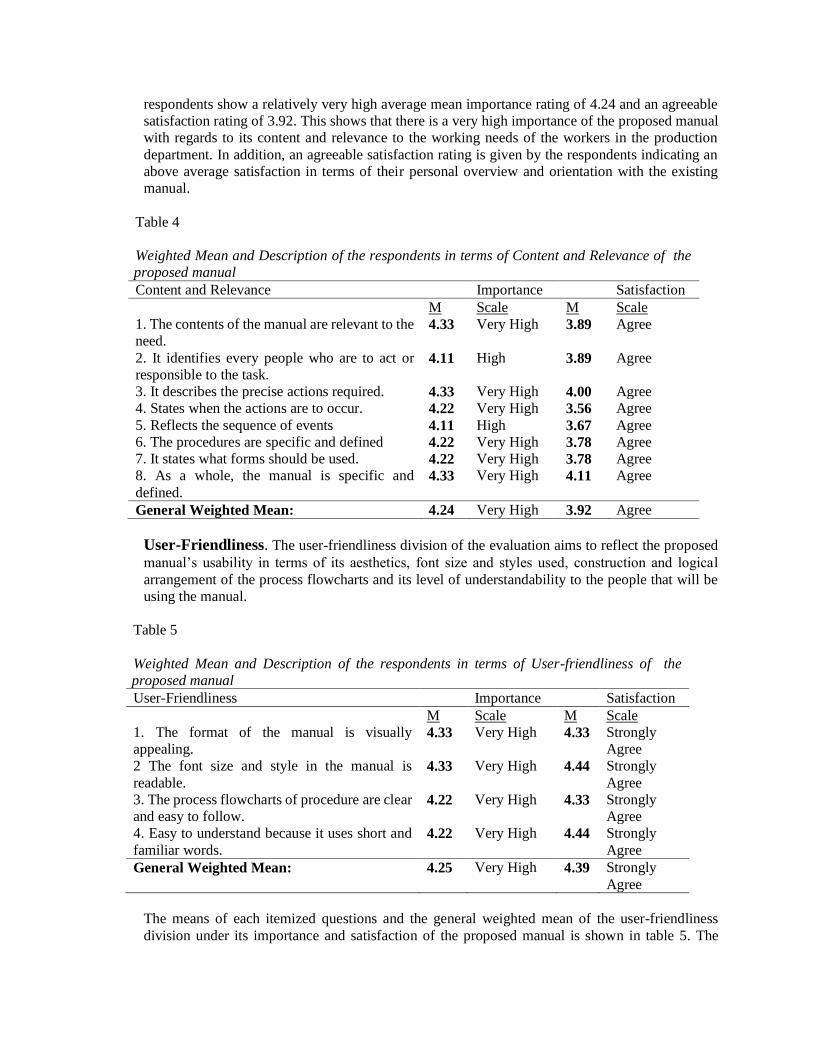
respondents show a relatively very high average mean importance rating of 4.24 and an agreeable
satisfaction rating of 3.92. This shows that there is a very high importance of the proposed manual
with regards to its content and relevance to the working needs of the workers in the production
department. In addition, an agreeable satisfaction rating is given by the respondents indicating an
above average satisfaction in terms of their personal overview and orientation with the existing
manual.
Table 4
Weighted Mean and Description of the respondents in terms of Content and Relevance of the
proposed manual
Content and Relevance Importance Satisfaction
M Scale M Scale
1. The contents of the manual are relevant to the
need. 4.33 Very High 3.89 Agree
2. It identifies every people who are to act or
responsible to the task. 4.11 High 3.89 Agree
3. It describes the precise actions required. 4.33 Very High 4.00 Agree
4. States when the actions are to occur. 4.22 Very High 3.56 Agree
5. Reflects the sequence of events 4.11 High 3.67 Agree
6. The procedures are specific and defined 4.22 Very High 3.78 Agree
7. It states what forms should be used. 4.22 Very High 3.78 Agree
8. As a whole, the manual is specific and
defined.
4.33 Very High 4.11 Agree
General Weighted Mean: 4.24 Very High 3.92 Agree
User-Friendliness. The user-friendliness division of the evaluation aims to reflect the proposed
manual’s usability in terms of its aesthetics, font size and styles used, construction and logical
arrangement of the process flowcharts and its level of understandability to the people that will be
using the manual.
Table 5
Weighted Mean and Description of the respondents in terms of User-friendliness of the
proposed manual
User-Friendliness Importance Satisfaction
M Scale M Scale
1. The format of the manual is visually
appealing. 4.33 Very High 4.33 Strongly
Agree
2 The font size and style in the manual is
readable.
4.33 Very High 4.44 Strongly
Agree
3. The process flowcharts of procedure are clear
and easy to follow. 4.22 Very High 4.33 Strongly
Agree
4. Easy to understand because it uses short and
familiar words.
4.22 Very High 4.44 Strongly
Agree
General Weighted Mean: 4.25 Very High 4.39 Strongly
Agree
The means of each itemized questions and the general weighted mean of the user-friendliness
division under its importance and satisfaction of the proposed manual is shown in table 5. The
respondents show a relatively very high average mean importance rating of 4.25 and a strongly
agreeable satisfaction rating of 4.39. This shows that there is a very high importance of the existing
manual with regards to its user-friendliness; on how the procedures were reflected in the manual.
In addition, a strongly agreeable satisfaction rating is given by the respondents indicating an
excellent satisfaction with the existing manual with regards to its usability.
Over-all Working Environment. The over-all working environment division of the evaluation
aims to reflect the proposed manual’s viability to incorporate a good working environment to the
people who will use the manual.
Table 6
Weighted Mean and Description of the respondents in terms of working environment of the
proposed manual
Working Environment Importance Satisfaction
M Scale M Scale
1. The manual contents are helpful in promoting
a good work environment. 4.33 Very High 4.22 Strongly
Agree
General Weighted Mean: 4.33 Very High 4.22 Strongly
Agree
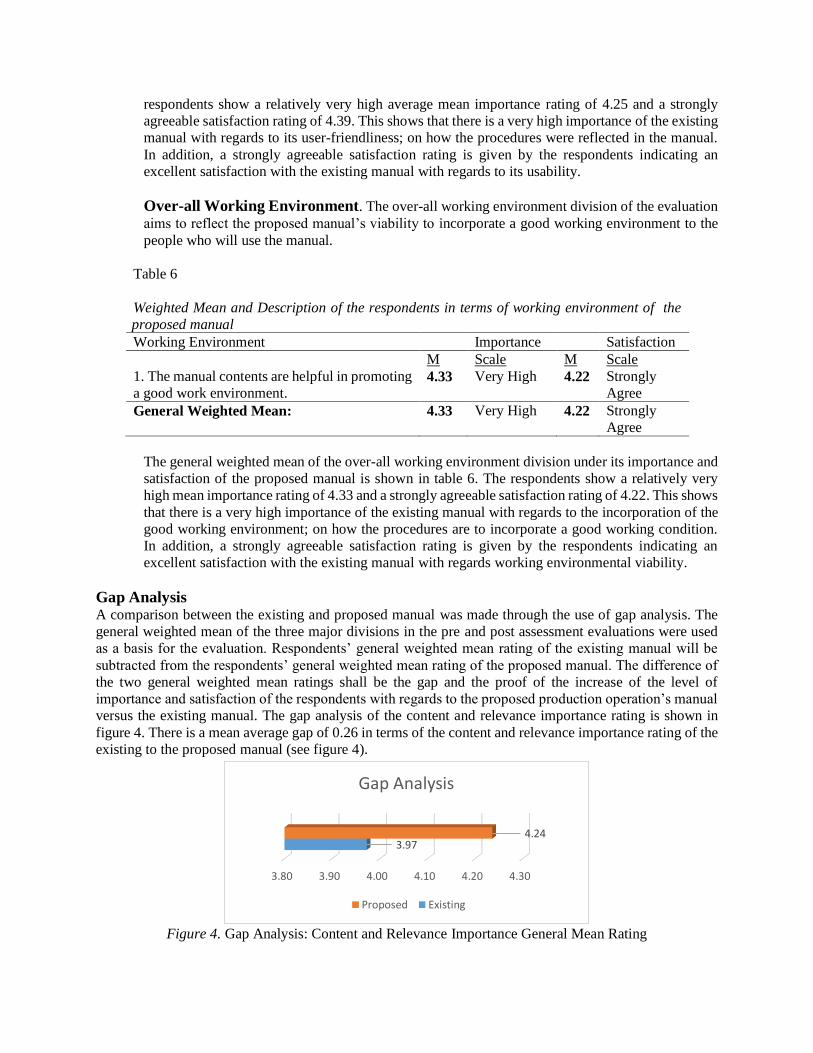
The general weighted mean of the over-all working environment division under its importance and
satisfaction of the proposed manual is shown in table 6. The respondents show a relatively very
high mean importance rating of 4.33 and a strongly agreeable satisfaction rating of 4.22. This shows
that there is a very high importance of the existing manual with regards to the incorporation of the
good working environment; on how the procedures are to incorporate a good working condition.
In addition, a strongly agreeable satisfaction rating is given by the respondents indicating an
excellent satisfaction with the existing manual with regards working environmental viability.
Gap Analysis A comparison between the existing and proposed manual was made through the use of gap analysis. The
general weighted mean of the three major divisions in the pre and post assessment evaluations were used
as a basis for the evaluation. Respondents’ general weighted mean rating of the existing manual will be
subtracted from the respondents’ general weighted mean rating of the proposed manual. The difference of
the two general weighted mean ratings shall be the gap and the proof of the increase of the level of
importance and satisfaction of the respondents with regards to the proposed production operation’s manual
versus the existing manual. The gap analysis of the content and relevance importance rating is shown in
figure 4. There is a mean average gap of 0.26 in terms of the content and relevance importance rating of the
existing to the proposed manual (see figure 4).
Figure 4. Gap Analysis: Content and Relevance Importance General Mean Rating
3.80 3.90 4.00 4.10 4.20 4.30
3.974.24
Gap Analysis
Proposed Existing
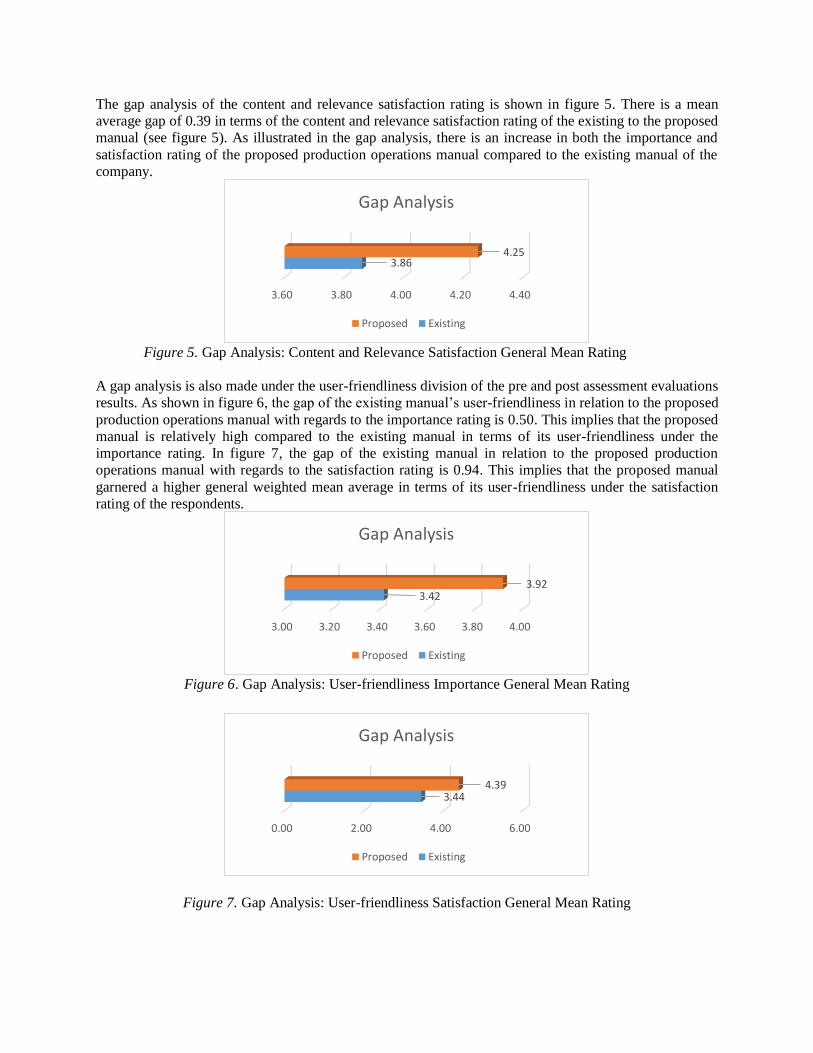
The gap analysis of the content and relevance satisfaction rating is shown in figure 5. There is a mean
average gap of 0.39 in terms of the content and relevance satisfaction rating of the existing to the proposed
manual (see figure 5). As illustrated in the gap analysis, there is an increase in both the importance and
satisfaction rating of the proposed production operations manual compared to the existing manual of the
company.
Figure 5. Gap Analysis: Content and Relevance Satisfaction General Mean Rating
A gap analysis is also made under the user-friendliness division of the pre and post assessment evaluations
results. As shown in figure 6, the gap of the existing manual’s user-friendliness in relation to the proposed
production operations manual with regards to the importance rating is 0.50. This implies that the proposed
manual is relatively high compared to the existing manual in terms of its user-friendliness under the
importance rating. In figure 7, the gap of the existing manual in relation to the proposed production
operations manual with regards to the satisfaction rating is 0.94. This implies that the proposed manual
garnered a higher general weighted mean average in terms of its user-friendliness under the satisfaction
rating of the respondents.
Figure 6. Gap Analysis: User-friendliness Importance General Mean Rating
Figure 7. Gap Analysis: User-friendliness Satisfaction General Mean Rating
3.60 3.80 4.00 4.20 4.40
3.864.25
Gap Analysis
Proposed Existing
3.00 3.20 3.40 3.60 3.80 4.00
3.423.92
Gap Analysis
Proposed Existing
0.00 2.00 4.00 6.00
3.444.39
Gap Analysis
Proposed Existing
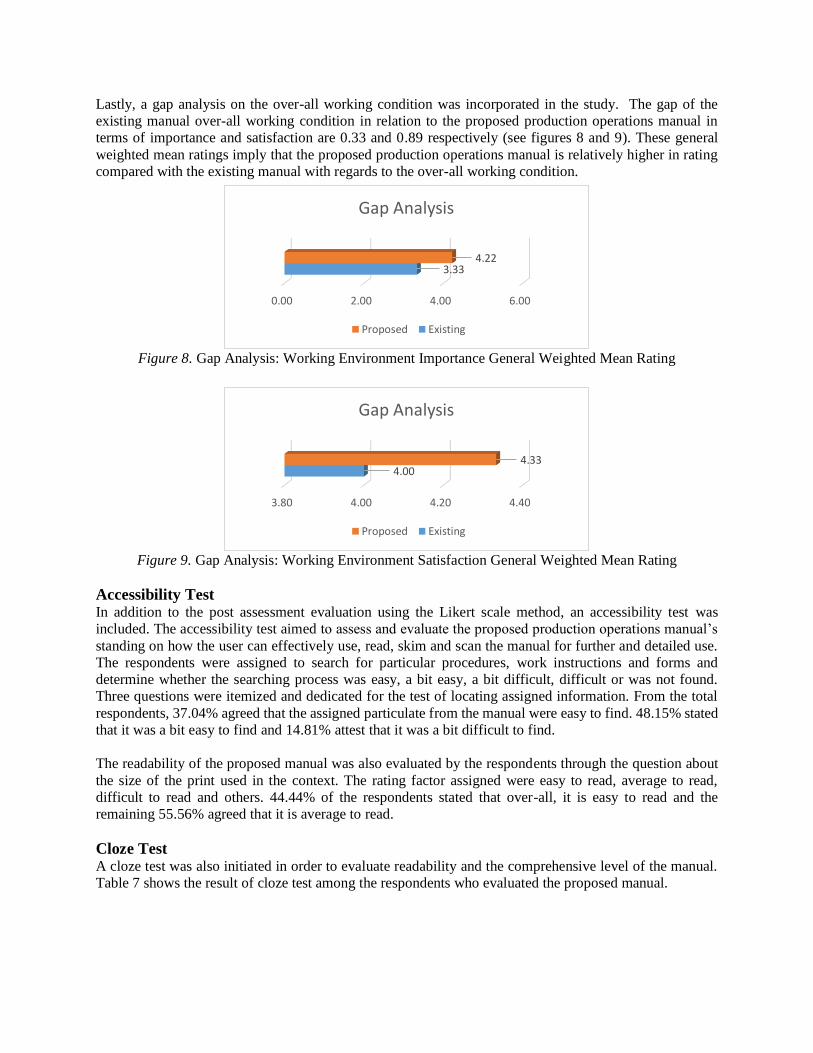
Lastly, a gap analysis on the over-all working condition was incorporated in the study. The gap of the
existing manual over-all working condition in relation to the proposed production operations manual in
terms of importance and satisfaction are 0.33 and 0.89 respectively (see figures 8 and 9). These general
weighted mean ratings imply that the proposed production operations manual is relatively higher in rating
compared with the existing manual with regards to the over-all working condition.
Figure 8. Gap Analysis: Working Environment Importance General Weighted Mean Rating
Figure 9. Gap Analysis: Working Environment Satisfaction General Weighted Mean Rating
Accessibility Test In addition to the post assessment evaluation using the Likert scale method, an accessibility test was
included. The accessibility test aimed to assess and evaluate the proposed production operations manual’s
standing on how the user can effectively use, read, skim and scan the manual for further and detailed use.
The respondents were assigned to search for particular procedures, work instructions and forms and
determine whether the searching process was easy, a bit easy, a bit difficult, difficult or was not found.
Three questions were itemized and dedicated for the test of locating assigned information. From the total
respondents, 37.04% agreed that the assigned particulate from the manual were easy to find. 48.15% stated
that it was a bit easy to find and 14.81% attest that it was a bit difficult to find.
The readability of the proposed manual was also evaluated by the respondents through the question about
the size of the print used in the context. The rating factor assigned were easy to read, average to read,
difficult to read and others. 44.44% of the respondents stated that over-all, it is easy to read and the
remaining 55.56% agreed that it is average to read.
Cloze Test A cloze test was also initiated in order to evaluate readability and the comprehensive level of the manual.
Table 7 shows the result of cloze test among the respondents who evaluated the proposed manual.
3.80 4.00 4.20 4.40
4.004.33
Gap Analysis
Proposed Existing
0.00 2.00 4.00 6.00
3.334.22
Gap Analysis
Proposed Existing
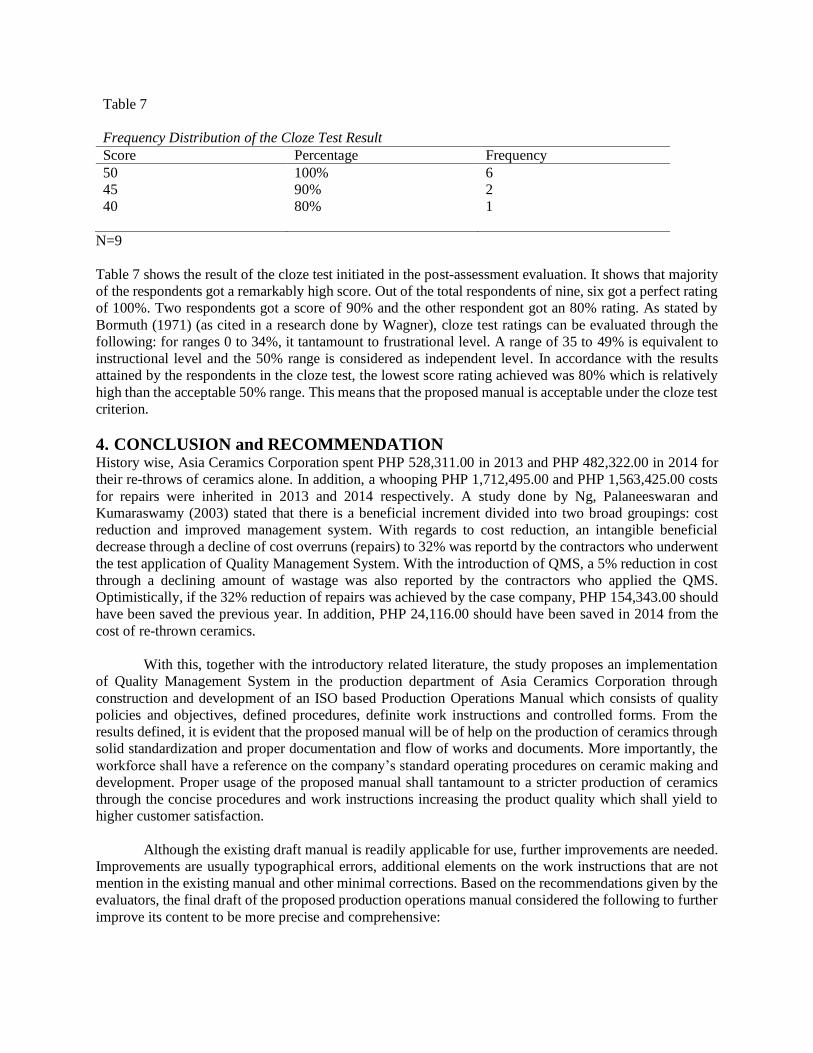
Table 7
Frequency Distribution of the Cloze Test Result
Score Percentage Frequency
50 100% 6
45 90% 2
40 80% 1
N=9
Table 7 shows the result of the cloze test initiated in the post-assessment evaluation. It shows that majority
of the respondents got a remarkably high score. Out of the total respondents of nine, six got a perfect rating
of 100%. Two respondents got a score of 90% and the other respondent got an 80% rating. As stated by
Bormuth (1971) (as cited in a research done by Wagner), cloze test ratings can be evaluated through the
following: for ranges 0 to 34%, it tantamount to frustrational level. A range of 35 to 49% is equivalent to
instructional level and the 50% range is considered as independent level. In accordance with the results
attained by the respondents in the cloze test, the lowest score rating achieved was 80% which is relatively
high than the acceptable 50% range. This means that the proposed manual is acceptable under the cloze test
criterion.
4. CONCLUSION and RECOMMENDATION History wise, Asia Ceramics Corporation spent PHP 528,311.00 in 2013 and PHP 482,322.00 in 2014 for
their re-throws of ceramics alone. In addition, a whooping PHP 1,712,495.00 and PHP 1,563,425.00 costs
for repairs were inherited in 2013 and 2014 respectively. A study done by Ng, Palaneeswaran and
Kumaraswamy (2003) stated that there is a beneficial increment divided into two broad groupings: cost
reduction and improved management system. With regards to cost reduction, an intangible beneficial
decrease through a decline of cost overruns (repairs) to 32% was reportd by the contractors who underwent
the test application of Quality Management System. With the introduction of QMS, a 5% reduction in cost
through a declining amount of wastage was also reported by the contractors who applied the QMS.
Optimistically, if the 32% reduction of repairs was achieved by the case company, PHP 154,343.00 should
have been saved the previous year. In addition, PHP 24,116.00 should have been saved in 2014 from the
cost of re-thrown ceramics.
With this, together with the introductory related literature, the study proposes an implementation
of Quality Management System in the production department of Asia Ceramics Corporation through
construction and development of an ISO based Production Operations Manual which consists of quality
policies and objectives, defined procedures, definite work instructions and controlled forms. From the
results defined, it is evident that the proposed manual will be of help on the production of ceramics through
solid standardization and proper documentation and flow of works and documents. More importantly, the
workforce shall have a reference on the company’s standard operating procedures on ceramic making and
development. Proper usage of the proposed manual shall tantamount to a stricter production of ceramics
through the concise procedures and work instructions increasing the product quality which shall yield to
higher customer satisfaction.
Although the existing draft manual is readily applicable for use, further improvements are needed.
Improvements are usually typographical errors, additional elements on the work instructions that are not
mention in the existing manual and other minimal corrections. Based on the recommendations given by the
evaluators, the final draft of the proposed production operations manual considered the following to further
improve its content to be more precise and comprehensive:
1. Use the existing terminologies situated by the case company.
2. Make the font size bigger and use ideal spacing (Preferably each process per page).
3. Include table of contents / legend and be more specific to task assignments.
As stated in the quality manual, the company should undertake a regular review and audit of the
policies and objectives for its continual improvement. This implies that the manual should be regularly
updated to maintain its usability. Inclusion of pictures on the work instructions are highly recommended in
order to increase the comprehensive and illustrative level of the manual. It is recommended that production
operations manual should be laid down to the production workforce for a department wide and
implementation of QMS. The company should initiate an implementation of QMS to all its department for
a companywide implementation.
5. REFERENCES Alsughayir, A. (2013) the impacts of quality practices on productivity and profitability in the Saudi Arabian dried date industry.
Retrieved February 12, 2015 from http://wscholars.com/index.php/ajbm/article/viewFile/465/pdf
Canos, F. (2009) Quality control in the ceramic industry. What should be controlled, how, when why and by whom?: Proposal
for a global system for quality in production. Retrieved January 19, 2015 from http://www.google.com/url?sa=t&rct=j&q=&esrc=s&source=web&cd=1&ved=0CB8QFjAA&url=http%3A%2F%2Fwww.
qualicer.org%2Frecopilatorio%2Fponencias%2Fpdf%2F9003042e.pdf&ei=Fk28VIKDJsXbmgXgsIDwDQ&usg=AFQjCN
EEP5FDOU_WQ7s1uinCQnFyCoN0mA&sig2=PaFPrLAFpoWkijg0fENvsg&bvm=bv.83829542,d.dGY
Dalota, M. (2011) Increasing Productivity by Total Quality Management and Constraint Management. Retrieved January 19,
2015 from ftp://ftp.repec.org/opt/ReDIF/RePEc/hmm/v1i1/3/2.pdf
Hopp, W., & Spearman, M., (2008). Factory physics (3rd ed.). New York: McGraw-Hill Companies, Inc.
Hunter, J. (Producer). (2014). W. Edwards Deming: The 14 Points. [Motion Picture]. (Available from the W. Edwards Deming
Institute. Retrieved from http://blog.deming.org/2014/05/deming-library-video-with-dr-deming-discussing-the-14-points/)
International Organization for Standardization (ISO). (2015). ISO DIS 9000 2015. Quality management definitions. Retrieved
January 12, 2015 from http://www.praxiom.com/iso-definition.htm
Joseph, J. (1994). Productivity and total quality management: Application in maine manufacturing. Maine Policy Review. 3(1). 27-38. Retrieved from http://digitalcommons.library.umaine.edu/cgi/viewcontent.cgi?article=1457&context=mpr
Martinich, J. (1997). Production and operations management: A modern approach. Canada: John Wiley & Sons, Inc.
Ng, T., Palaneeswaran, E & Kumaraswamy, M. (2003). Costs and benefits of ISO9001-based quality management system to construction
contractors. The Australasian Journal of Construction Economics and Building. 3(2). 23-29. Retrieved February 8, 2015 from
http://www.google.com/url?sa=t&rct=j&q=&esrc=s&source=web&cd=1&cad=rja&uact=8&ved=0CB8QFjAA&url=http%3A%2F%2Fepre
ss.lib.uts.edu.au%2Fjournals%2Findex.php%2FAJCEB%2Farticle%2Fdownload%2F3003%2F3186&ei=UbvgVN7_PNfU8gXQ9oII&usg=
AFQjCNERU52o-C6kfPDuvvdyCFagKYGRJA&sig2=FlL8funKCjtiaNhssC1E7Q
Render, B., Stair, R., & Hanna, M. (2012). Quantitative analysis for management (11th ed.). Philippines: Pearson Education Inc.
Scherkenbach, W. (1991). Deming’s road to continual improvement. Tenesse: SPC Press.
Sachdeva, V. (2003) Good documentation and quality principles. Retrieve January 12, 2015 from
http://apps.who.int/prequal/trainingresources/pq_pres/stakeholders_2011/presentations/day_2/good_documentation_practice
s.pdf
Usability Testing. (2004). Retrieved February 13, 2015 from http://www.usability.gov/how-to-and tools/methods/usability-
testing.html
Wagner, G. (1982). Interpreting Cloze Scores in the Assessment of Text Readability and Reading Comprehension. 68-72.
Retrieved February 8, 2015 from http://www.directions.usp.ac.fj/collect/direct/index/assoc/D769931.dir/doc.pdf