Embed Size (px)
Citation preview
See discussions, stats, and author profiles for this publication at: https://www.researchgate.net/publication/258703037
Heterogeneity in Healthy Aging
Article in The Journals of Gerontology Series A Biological Sciences and Medical Sciences · November 2013
DOI: 10.1093/gerona/glt162 · Source: PubMed
CITATIONS
218READS
698
4 authors, including:
Some of the authors of this publication are also working on these related projects:
Aging and Disease Prevention View project
Value of Prescription Drugs View project
S. Jay Olshansky
University of Illinois at Chicago
130 PUBLICATIONS 8,888 CITATIONS
SEE PROFILE
Jay Bhattacharya
Stanford University
273 PUBLICATIONS 7,543 CITATIONS
SEE PROFILE
Dana Goldman
University of Southern California
419 PUBLICATIONS 13,163 CITATIONS
SEE PROFILE
All content following this page was uploaded by Jay Bhattacharya on 18 November 2015.
The user has requested enhancement of the downloaded file.
640
Journals of Gerontology: BIOLOGICAL SCIENCESCite journal as: J Gerontol A Biol Sci Med Sci 2014 June;69(6):640–649doi:10.1093/gerona/glt162 Advance Access publication November 17, 2013
© The Author 2013. Published by Oxford University Press on behalf of The Gerontological Society of America. All rights reserved. For permissions, please e-mail: [email protected].
Heterogeneity in Healthy Aging
David J. Lowsky,1,* S. Jay Olshansky,2 Jay Bhattacharya,3 and Dana P. Goldman4
1RAND Corporation, Santa Monica, California.2School of Public Health, University of Illinois at Chicago.
3Center for Primary Care and Outcomes Research, Stanford University School of Medicine, California.4Schaeffer Center for Health Policy and Economics, University of Southern California, Los Angeles.
*Affiliation at time of article authorship.
Address correspondence to Dana P. Goldman, PhD, Schaeffer Center for Health Policy and Economics, University of Southern California, 3335 South Figueroa Street, Unit A, Los Angeles, CA 90007. Email: [email protected]
For a surprisingly large segment of the older population, chronological age is not a relevant marker for understanding, measuring, or experiencing healthy aging. Using the 2003 Medical Expenditure Panel Survey and the 2004 Health and Retirement Study to examine the proportion of Americans exhibiting five markers of health and the variation in health-related quality of life across each of eight age groups, we find that a significant proportion of older Americans is healthy within every age group beginning at age 51, including among those aged 85+. For example, 48% of those aged 51–54 and 28% of those aged 85+ have excellent or very good self-reported health status; similarly, 89% of those aged 51–54 and 56% of those aged 85+ report no health-based limitations in work or housework. Also, health-related quality of life ranges widely within every age group, yet there is only a comparatively small variation in median quality of life across age groups, suggesting that older Americans today may be experiencing substantially different age-health trajectories than their predecessors. Patterns are similar for medical expenditures. Several policy implica-tions are explored.
Key Words: Compression of morbidity—Healthy aging—Quality of life.
Received May 7, 2013; Accepted July 30, 2013
Decision Editor: Rafael de Cabo, PhD
INCREASING longevity combined with the large Baby Boomer population means the U.S. population aged 65
and older is projected to grow from 12% in 2010 to 20% in 2050 (1). Researchers and policymakers have forecasted that this trend will drive a significant rise in care needs and social program costs (2,3) based on the assumption that, for most people, chronological age is associated with a decline in health; decreased capacity for work, self-care, and active living; and greater overall dependency (4,5).
Yet when evaluating the consequences of population aging, it is important to determine just how strong the link is between chronological age and health decline. Although greater age is certainly correlated with increased morbidity, some people live into their 70s, 80s, and 90s in good health, with active lifestyles, and a willingness and ability to work. Furthermore, a growing body of research indicates substan-tial variation in the health impact of aging, influenced by multiple factors such as gender, race, income, and educa-tional attainment (6–8), suggesting that poor health is not a necessary consequence of survival to older ages. In addition, the line between middle age and old age is becoming increas-ingly blurred. The terms “young–old” and “old–old” were coined decades ago to emphasize that chronological age is not as relevant as functional status, and that people of any age can fall into either category. Only a minority of individuals are “old–old,” in need of special societal care and support (9).
The presence of the healthy subgroup of older Americans is important, as they will have, on average, the same low demands for care and societal costs as younger people, and they can conceivably continue to productively contribute to society by maintaining part-time jobs, contributing infor-mal care to their families, or engaging in volunteer work for more years of their lives. In short, their social costs will be smaller, and their social contributions larger, than those of their less able counterparts.
Their presence also holds promise that in the future, a greater number and proportion of individuals may reach old age in good health. Researchers are advocating investments to promote healthy behaviors earlier in life so that younger cohorts today can be healthier when they eventually reach older ages (10). Recently, researchers have argued that “the association between chronological age and health status is much more variable than is often realized,” and they have advocated for a change in how population aging is framed and portrayed, from primarily a social and economic bur-den to an opportunity for older people to “make substantial social, economic, and cultural contributions, which can be enhanced by measures that improve their health and func-tional status” (11).
In this article, we document the extent to which chrono-logical age matters with regard to healthy aging by examin-ing two questions:
Abstract
HETEROGENEITY IN HEALTHY AGING 641
1. What proportion of the older U.S. population remains healthy and active in old age, and how do these differ-ences compare with younger age groups?
2. How much variation exists in health outcomes, spe-cifically quality-of-life outcomes, among individuals of similar ages?
In addressing the first question, we characterize the pro-portion of Americans that remain healthy and active as they age. Most existing studies that compare the health of older age groups examine the prevalence of health problems, such as disability and functional limitations (12–15) and chronic diseases (12). They also generally examine one health con-dition at a time. Our approach differs in two ways. First, we characterize the proportion of the older population in over-all “good” health. Second, we examine measures that cap-ture “multiple” dimensions of health, such as self-reported health or absence of work limitations.
In addressing the second question, we characterize the degree to which health outcomes vary within age groups. Much of the research that examines health disparities focuses on distinctions by socioeconomic status (SES) (16) and a single type of health limitation or condition. It is well established that lower SES, particularly income (17) and education (18,19), is correlated with poorer mean health outcomes and the health gap grows larger through middle and early old age, and then retreats at older ages (20,21). Lower levels of education, income, and wealth are also strongly associated with mortality risk among older middle-aged Americans (22). Racial/ethnic disparities in old-age disability have persisted during the last 20 years, and income/education disparities have increased (23). Socioeconomic disparities in healthy life expectancy are large and growing (7).
A small number of studies have examined disparities in health-related quality of life (HRQoL). These studies find that higher income and educational attainment are associ-ated with higher HRQoL in the United States (8). Income differences in HRQoL outcomes are largest in middle age and become smaller in old age, consistent with other find-ings on SES disparities (16), whereas the educational dis-parities in HRQoL outcomes are relatively constant across age groups (24). In related work, trajectories of functional decline at end of life are also quite variable (25), and a recent body of literature has found significant heterogeneity in multidimensional health trajectories among the middle-aged and older populations (26,27).
In addressing the second question, we chose a multi-dimensional measure of health rather than a single health condition as others have. We selected an HRQoL meas-ure, joining one other study (24) in examining age varia-tions using this metric. HRQoL captures multiple health outcomes in a single measure, thereby characterizing an individual’s overall level of health and functional ability more comprehensively. In addition, rather than examine
how health outcomes vary as a function of individual fac-tors such as SES disparities, we quantify the overall range of variation in health outcomes by age group. Although the effects of SES disparities are important, they are certainly not the only drivers of outcome differences. Many behav-ioral and psychosocial factors, such as degree of social engagement (28), exercise (29,30), sense of control (31), and caloric intake (32), have significant effects on long-term health. In characterizing the full range of health outcomes by age, we illustrate the combined effects of all contributing factors to health and shed light on the extent of variability in people’s health trajectories as they grow older. One related study examined variation in quality of life among the 85+ population and found “great diversity of the elderly popula-tion, even in relatively homogeneous areas” (33). Our study quantifies the range of variation in HRQoL by age group across the age spectrum.
MethodsTo characterize the proportion of the older population
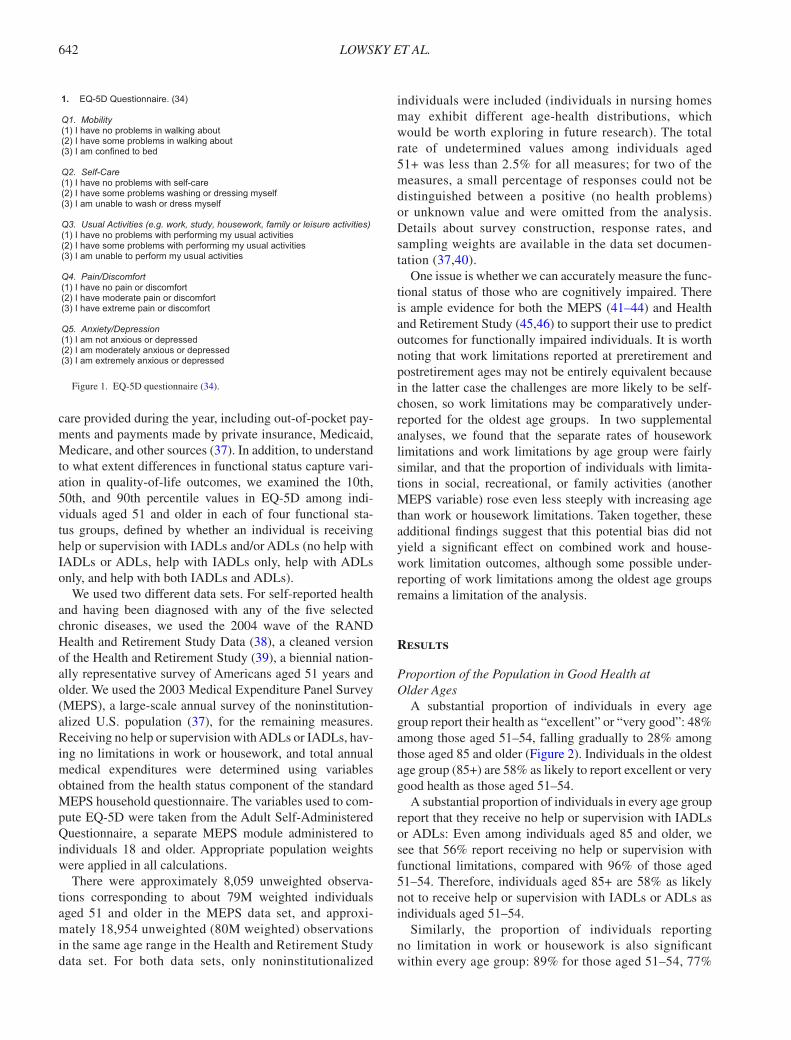
within each age group that remains healthy and active, we examined five markers of well-being: (i) self-reported health equal to “excellent” or “very good” (1 or 2 on a 5-point scale); (ii) receiving no help or supervision with activities of daily living (ADLs) or instrumental activities of daily living (IADLs); (iii) having no limitations in the ability to work at a job or do housework because of an impairment or a physical or mental health problem; (iv) not having been diagnosed with any of five leading chronic diseases (cancer, diabe-tes, heart disease, lung disease, or stroke); and (v) having a perfect score on a HRQoL measure (using EQ-5D, a well-established index for health status). ADLs included bathing, dressing, or getting around the house. IADLs included using the telephone, paying bills, taking medications, preparing light meals, doing laundry, or going shopping. We calcu-lated the proportion of the population exhibiting each of the five markers separately for each of eight age groups: 51–54, 55–59, 60–64, 65–69, 70–74, 75–79, 80–84, and 85+.
To determine variation in overall health among individu-als of similar age and individuals of similar functional sta-tus, we examined EQ-5D (34), a commonly used HRQoL measure that incorporates five dimensions of well-being: mobility, self-care, ability to perform usual activities, pain/discomfort, and anxiety/depression. Each dimension is measured on a 3-point scale (shown in Figure 1). We con-verted the combined responses to the five questions into a continuous value using a commonly cited set of U.S. pop-ulation-based preference weights (35,36). We calculated the 10th, 50th, and 90th percentile values in EQ-5D among individuals in each of the eight age groups.
For comparison purposes, we also examined variation in medical expenditures (10th, 50th, and 90th percentile values) among individuals within each age group. Medical expenditures are defined as the sum of direct payments for
642 LOWSKY ET AL.
care provided during the year, including out-of-pocket pay-ments and payments made by private insurance, Medicaid, Medicare, and other sources (37). In addition, to understand to what extent differences in functional status capture vari-ation in quality-of-life outcomes, we examined the 10th, 50th, and 90th percentile values in EQ-5D among indi-viduals aged 51 and older in each of four functional sta-tus groups, defined by whether an individual is receiving help or supervision with IADLs and/or ADLs (no help with IADLs or ADLs, help with IADLs only, help with ADLs only, and help with both IADLs and ADLs).
We used two different data sets. For self-reported health and having been diagnosed with any of the five selected chronic diseases, we used the 2004 wave of the RAND Health and Retirement Study Data (38), a cleaned version of the Health and Retirement Study (39), a biennial nation-ally representative survey of Americans aged 51 years and older. We used the 2003 Medical Expenditure Panel Survey (MEPS), a large-scale annual survey of the noninstitution-alized U.S. population (37), for the remaining measures. Receiving no help or supervision with ADLs or IADLs, hav-ing no limitations in work or housework, and total annual medical expenditures were determined using variables obtained from the health status component of the standard MEPS household questionnaire. The variables used to com-pute EQ-5D were taken from the Adult Self-Administered Questionnaire, a separate MEPS module administered to individuals 18 and older. Appropriate population weights were applied in all calculations.
There were approximately 8,059 unweighted observa-tions corresponding to about 79M weighted individuals aged 51 and older in the MEPS data set, and approxi-mately 18,954 unweighted (80M weighted) observations in the same age range in the Health and Retirement Study data set. For both data sets, only noninstitutionalized
individuals were included (individuals in nursing homes may exhibit different age-health distributions, which would be worth exploring in future research). The total rate of undetermined values among individuals aged 51+ was less than 2.5% for all measures; for two of the measures, a small percentage of responses could not be distinguished between a positive (no health problems) or unknown value and were omitted from the analysis. Details about survey construction, response rates, and sampling weights are available in the data set documen-tation (37,40).
One issue is whether we can accurately measure the func-tional status of those who are cognitively impaired. There is ample evidence for both the MEPS (41–44) and Health and Retirement Study (45,46) to support their use to predict outcomes for functionally impaired individuals. It is worth noting that work limitations reported at preretirement and postretirement ages may not be entirely equivalent because in the latter case the challenges are more likely to be self-chosen, so work limitations may be comparatively under-reported for the oldest age groups. In two supplemental analyses, we found that the separate rates of housework limitations and work limitations by age group were fairly similar, and that the proportion of individuals with limita-tions in social, recreational, or family activities (another MEPS variable) rose even less steeply with increasing age than work or housework limitations. Taken together, these additional findings suggest that this potential bias did not yield a significant effect on combined work and house-work limitation outcomes, although some possible under-reporting of work limitations among the oldest age groups remains a limitation of the analysis.
Results
Proportion of the Population in Good Health at Older Ages
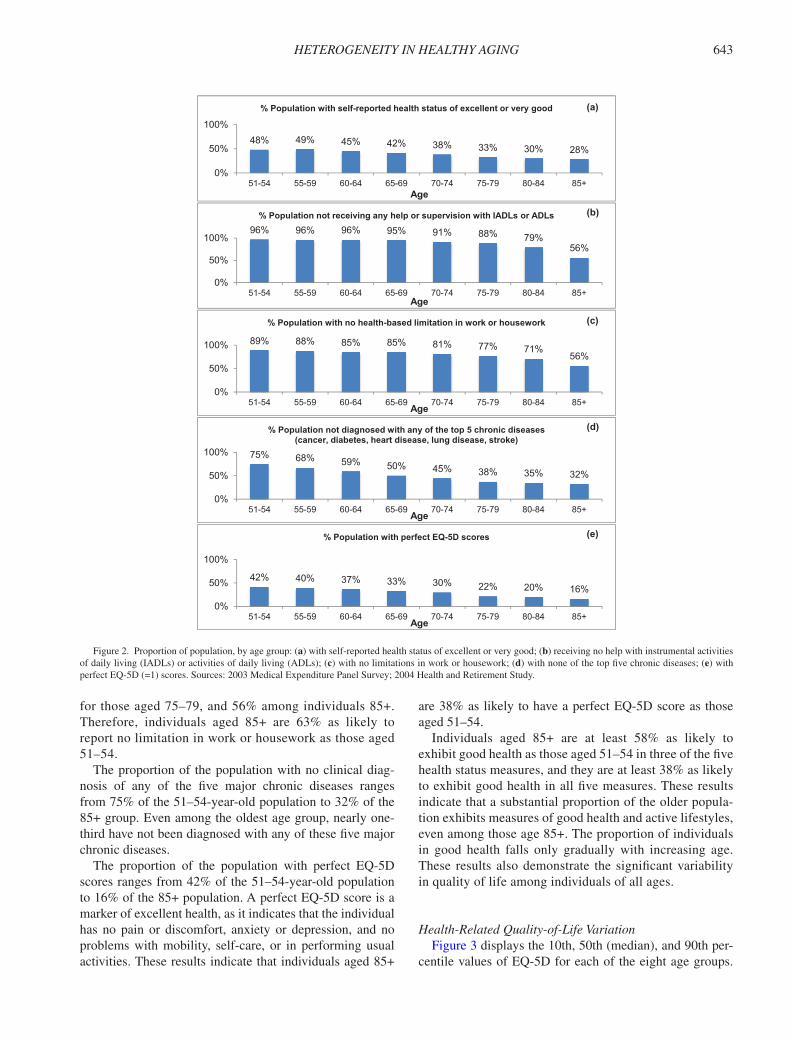
A substantial proportion of individuals in every age group report their health as “excellent” or “very good”: 48% among those aged 51–54, falling gradually to 28% among those aged 85 and older (Figure 2). Individuals in the oldest age group (85+) are 58% as likely to report excellent or very good health as those aged 51–54.
A substantial proportion of individuals in every age group report that they receive no help or supervision with IADLs or ADLs: Even among individuals aged 85 and older, we see that 56% report receiving no help or supervision with functional limitations, compared with 96% of those aged 51–54. Therefore, individuals aged 85+ are 58% as likely not to receive help or supervision with IADLs or ADLs as individuals aged 51–54.
Similarly, the proportion of individuals reporting no limitation in work or housework is also significant within every age group: 89% for those aged 51–54, 77%
Figure 1. EQ-5D questionnaire (34).
HETEROGENEITY IN HEALTHY AGING 643
for those aged 75–79, and 56% among individuals 85+. Therefore, individuals aged 85+ are 63% as likely to report no limitation in work or housework as those aged 51–54.
The proportion of the population with no clinical diag-nosis of any of the five major chronic diseases ranges from 75% of the 51–54-year-old population to 32% of the 85+ group. Even among the oldest age group, nearly one-third have not been diagnosed with any of these five major chronic diseases.
The proportion of the population with perfect EQ-5D scores ranges from 42% of the 51–54-year-old population to 16% of the 85+ population. A perfect EQ-5D score is a marker of excellent health, as it indicates that the individual has no pain or discomfort, anxiety or depression, and no problems with mobility, self-care, or in performing usual activities. These results indicate that individuals aged 85+
are 38% as likely to have a perfect EQ-5D score as those aged 51–54.
Individuals aged 85+ are at least 58% as likely to exhibit good health as those aged 51–54 in three of the five health status measures, and they are at least 38% as likely to exhibit good health in all five measures. These results indicate that a substantial proportion of the older popula-tion exhibits measures of good health and active lifestyles, even among those age 85+. The proportion of individuals in good health falls only gradually with increasing age. These results also demonstrate the significant variability in quality of life among individuals of all ages.
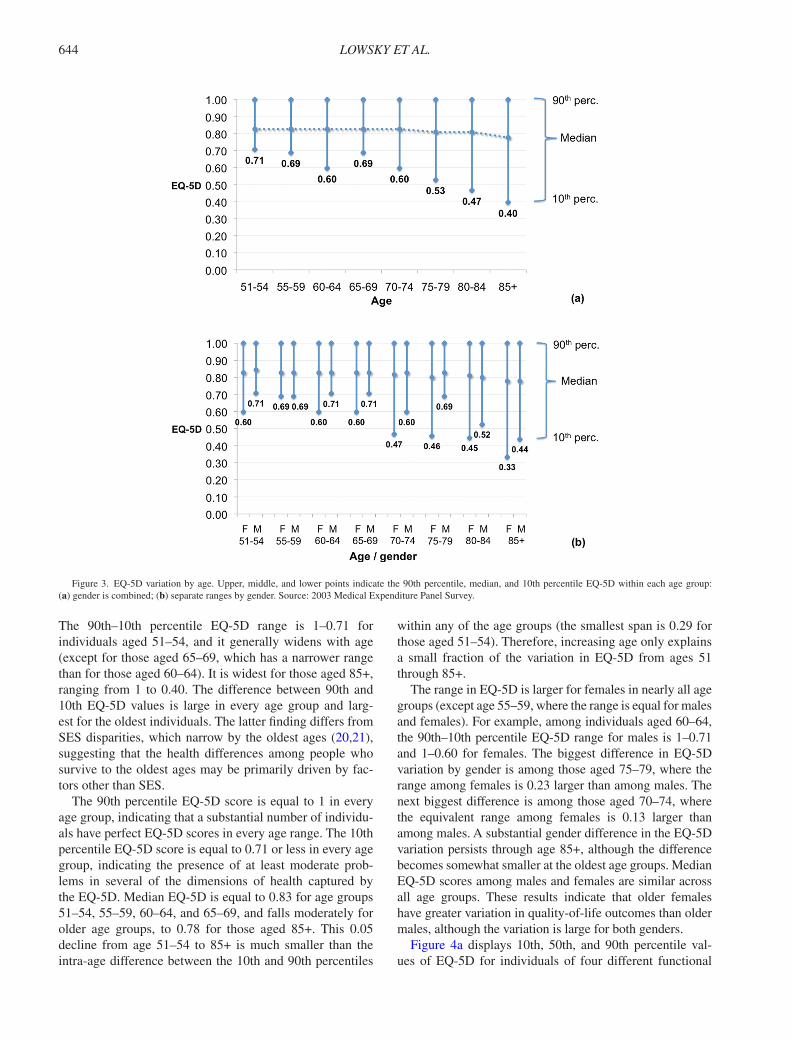
Health-Related Quality-of-Life VariationFigure 3 displays the 10th, 50th (median), and 90th per-
centile values of EQ-5D for each of the eight age groups.
Figure 2. Proportion of population, by age group: (a) with self-reported health status of excellent or very good; (b) receiving no help with instrumental activities of daily living (IADLs) or activities of daily living (ADLs); (c) with no limitations in work or housework; (d) with none of the top five chronic diseases; (e) with perfect EQ-5D (=1) scores. Sources: 2003 Medical Expenditure Panel Survey; 2004 Health and Retirement Study.
644 LOWSKY ET AL.
The 90th–10th percentile EQ-5D range is 1–0.71 for individuals aged 51–54, and it generally widens with age (except for those aged 65–69, which has a narrower range than for those aged 60–64). It is widest for those aged 85+, ranging from 1 to 0.40. The difference between 90th and 10th EQ-5D values is large in every age group and larg-est for the oldest individuals. The latter finding differs from SES disparities, which narrow by the oldest ages (20,21), suggesting that the health differences among people who survive to the oldest ages may be primarily driven by fac-tors other than SES.
The 90th percentile EQ-5D score is equal to 1 in every age group, indicating that a substantial number of individu-als have perfect EQ-5D scores in every age range. The 10th percentile EQ-5D score is equal to 0.71 or less in every age group, indicating the presence of at least moderate prob-lems in several of the dimensions of health captured by the EQ-5D. Median EQ-5D is equal to 0.83 for age groups 51–54, 55–59, 60–64, and 65–69, and falls moderately for older age groups, to 0.78 for those aged 85+. This 0.05 decline from age 51–54 to 85+ is much smaller than the intra-age difference between the 10th and 90th percentiles
within any of the age groups (the smallest span is 0.29 for those aged 51–54). Therefore, increasing age only explains a small fraction of the variation in EQ-5D from ages 51 through 85+.
The range in EQ-5D is larger for females in nearly all age groups (except age 55–59, where the range is equal for males and females). For example, among individuals aged 60–64, the 90th–10th percentile EQ-5D range for males is 1–0.71 and 1–0.60 for females. The biggest difference in EQ-5D variation by gender is among those aged 75–79, where the range among females is 0.23 larger than among males. The next biggest difference is among those aged 70–74, where the equivalent range among females is 0.13 larger than among males. A substantial gender difference in the EQ-5D variation persists through age 85+, although the difference becomes somewhat smaller at the oldest age groups. Median EQ-5D scores among males and females are similar across all age groups. These results indicate that older females have greater variation in quality-of-life outcomes than older males, although the variation is large for both genders.
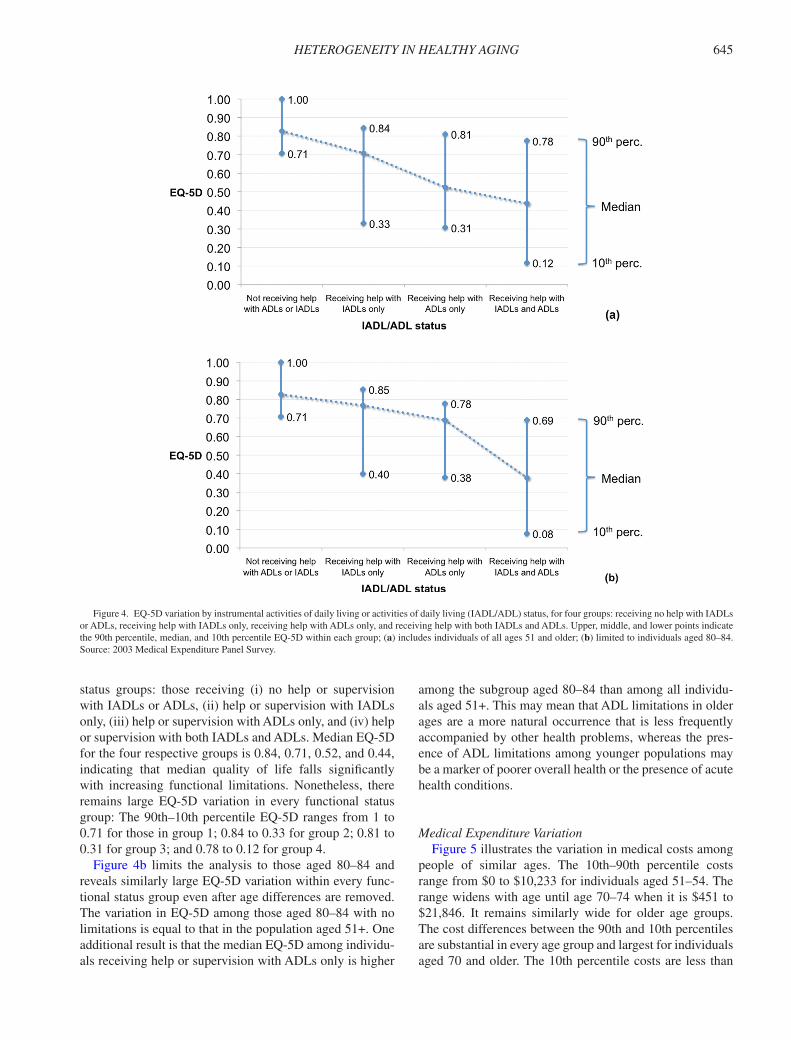
Figure 4a displays 10th, 50th, and 90th percentile val-ues of EQ-5D for individuals of four different functional
Figure 3. EQ-5D variation by age. Upper, middle, and lower points indicate the 90th percentile, median, and 10th percentile EQ-5D within each age group: (a) gender is combined; (b) separate ranges by gender. Source: 2003 Medical Expenditure Panel Survey.
HETEROGENEITY IN HEALTHY AGING 645
status groups: those receiving (i) no help or supervision with IADLs or ADLs, (ii) help or supervision with IADLs only, (iii) help or supervision with ADLs only, and (iv) help or supervision with both IADLs and ADLs. Median EQ-5D for the four respective groups is 0.84, 0.71, 0.52, and 0.44, indicating that median quality of life falls significantly with increasing functional limitations. Nonetheless, there remains large EQ-5D variation in every functional status group: The 90th–10th percentile EQ-5D ranges from 1 to 0.71 for those in group 1; 0.84 to 0.33 for group 2; 0.81 to 0.31 for group 3; and 0.78 to 0.12 for group 4.
Figure 4b limits the analysis to those aged 80–84 and reveals similarly large EQ-5D variation within every func-tional status group even after age differences are removed. The variation in EQ-5D among those aged 80–84 with no limitations is equal to that in the population aged 51+. One additional result is that the median EQ-5D among individu-als receiving help or supervision with ADLs only is higher
among the subgroup aged 80–84 than among all individu-als aged 51+. This may mean that ADL limitations in older ages are a more natural occurrence that is less frequently accompanied by other health problems, whereas the pres-ence of ADL limitations among younger populations may be a marker of poorer overall health or the presence of acute health conditions.
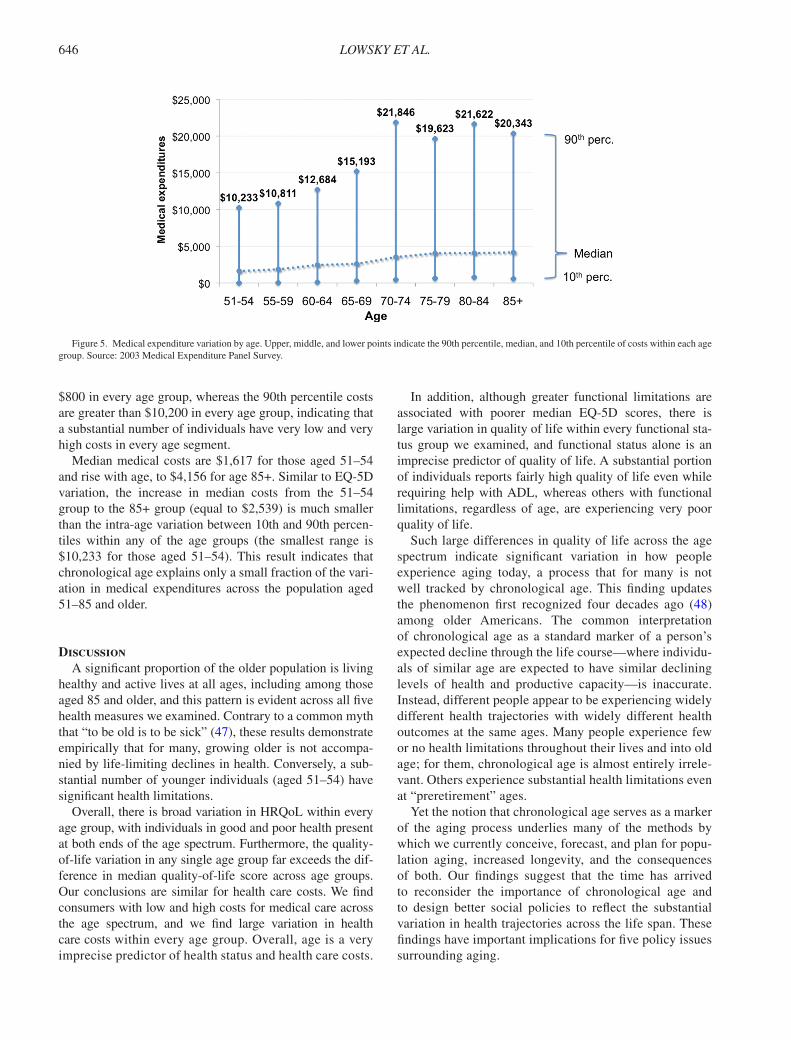
Medical Expenditure VariationFigure 5 illustrates the variation in medical costs among
people of similar ages. The 10th–90th percentile costs range from $0 to $10,233 for individuals aged 51–54. The range widens with age until age 70–74 when it is $451 to $21,846. It remains similarly wide for older age groups. The cost differences between the 90th and 10th percentiles are substantial in every age group and largest for individuals aged 70 and older. The 10th percentile costs are less than
Figure 4. EQ-5D variation by instrumental activities of daily living or activities of daily living (IADL/ADL) status, for four groups: receiving no help with IADLs or ADLs, receiving help with IADLs only, receiving help with ADLs only, and receiving help with both IADLs and ADLs. Upper, middle, and lower points indicate the 90th percentile, median, and 10th percentile EQ-5D within each group; (a) includes individuals of all ages 51 and older; (b) limited to individuals aged 80–84. Source: 2003 Medical Expenditure Panel Survey.
646 LOWSKY ET AL.
$800 in every age group, whereas the 90th percentile costs are greater than $10,200 in every age group, indicating that a substantial number of individuals have very low and very high costs in every age segment.
Median medical costs are $1,617 for those aged 51–54 and rise with age, to $4,156 for age 85+. Similar to EQ-5D variation, the increase in median costs from the 51–54 group to the 85+ group (equal to $2,539) is much smaller than the intra-age variation between 10th and 90th percen-tiles within any of the age groups (the smallest range is $10,233 for those aged 51–54). This result indicates that chronological age explains only a small fraction of the vari-ation in medical expenditures across the population aged 51–85 and older.
DiscussionA significant proportion of the older population is living
healthy and active lives at all ages, including among those aged 85 and older, and this pattern is evident across all five health measures we examined. Contrary to a common myth that “to be old is to be sick” (47), these results demonstrate empirically that for many, growing older is not accompa-nied by life-limiting declines in health. Conversely, a sub-stantial number of younger individuals (aged 51–54) have significant health limitations.
Overall, there is broad variation in HRQoL within every age group, with individuals in good and poor health present at both ends of the age spectrum. Furthermore, the quality-of-life variation in any single age group far exceeds the dif-ference in median quality-of-life score across age groups. Our conclusions are similar for health care costs. We find consumers with low and high costs for medical care across the age spectrum, and we find large variation in health care costs within every age group. Overall, age is a very imprecise predictor of health status and health care costs.
In addition, although greater functional limitations are associated with poorer median EQ-5D scores, there is large variation in quality of life within every functional sta-tus group we examined, and functional status alone is an imprecise predictor of quality of life. A substantial portion of individuals reports fairly high quality of life even while requiring help with ADL, whereas others with functional limitations, regardless of age, are experiencing very poor quality of life.
Such large differences in quality of life across the age spectrum indicate significant variation in how people experience aging today, a process that for many is not well tracked by chronological age. This finding updates the phenomenon first recognized four decades ago (48) among older Americans. The common interpretation of chronological age as a standard marker of a person’s expected decline through the life course—where individu-als of similar age are expected to have similar declining levels of health and productive capacity—is inaccurate. Instead, different people appear to be experiencing widely different health trajectories with widely different health outcomes at the same ages. Many people experience few or no health limitations throughout their lives and into old age; for them, chronological age is almost entirely irrele-vant. Others experience substantial health limitations even at “preretirement” ages.
Yet the notion that chronological age serves as a marker of the aging process underlies many of the methods by which we currently conceive, forecast, and plan for popu-lation aging, increased longevity, and the consequences of both. Our findings suggest that the time has arrived to reconsider the importance of chronological age and to design better social policies to reflect the substantial variation in health trajectories across the life span. These findings have important implications for five policy issues surrounding aging.
Figure 5. Medical expenditure variation by age. Upper, middle, and lower points indicate the 90th percentile, median, and 10th percentile of costs within each age group. Source: 2003 Medical Expenditure Panel Survey.
HETEROGENEITY IN HEALTHY AGING 647
Forecasting Future Dependency and Social CostsAge is an imprecise metric on which to base forecasts
of how many people will experience various degrees of health, their future care needs, and associated societal costs. Age alone fails to capture the diversity in outcomes within age groups. As a notable example, a common met-ric to gauge the proportion of the population that will depend on society for their care or livelihood is the Old Age Dependency Ratio, conventionally defined as the ratio of individuals aged 65 and older (ie, dependent’) to those aged 18–65 (in the labor force). In light of our find-ings, this age-specific measure of population dependency seems to no longer apply in the United States and other long-lived populations, given that it does not capture the variation in outcomes and capacities among people of similar age, nor does it reflect the substantial num-ber of older individuals living healthy and active lives and who are largely indistinguishable from their younger counterparts. To forecast the future care needs of the population, new metrics must move beyond traditional views of dependency as a product of age to those that reflect health status (both good and bad) across the age spectrum. As one step in this direction, researchers have recently introduced alternative dependency measures based on disability prevalence instead of age that yield substantially lower projected levels of dependency in the next 40 years than projected by the Old Age Dependency Ratio (49).
Work and Civic Roles for Older AmericansThe number of individuals remaining healthy and active
into old age suggests that more Americans are in a position to continue to contribute productively to society through-out their lives. Older adults increasingly want to make substantial social contributions and remain productive (5). However, most societies are ill prepared to use this valu-able source of social capital (5). As one notable example, there are numerous forced retirement policies in existence for various occupations in the private sector, many of which are age based, policies that our analysis suggest may be outdated. A new understanding of career longevity needs to be developed, and new work and civic roles may need to be devised, to enable these individuals to remain active and continue to contribute productively at different stages of life.
Eligibility Policies for Major Entitlement ProgramsOur findings also raise important questions about the
current eligibility policies for the most costly entitlement programs (50). Currently, the eligibility policies of these programs are largely age based, resting on the presumed link between age and health decline and dependency. In light of our findings, current age-based Medicare eligibility
rules seem to be imprecisely targeting those in need; such rules likely include many individuals older than age 65 who do not need such benefits and exclude others younger than age 65 who do. As society ages, this will become an even larger concern. Basing eligibility on measures of need rather than or in conjunction with age poses its own set of challenges, including the potential for measurement error or for gaming the system. Nevertheless, redesigning eligibility rules to more precisely target true need is one strategy to reduce the currently unsustainable projected cost burden of these programs (50).
Factors Driving the Differences in Health OutcomesIf not age, then what? It appears that differing life tra-
jectories are leading to dramatic differences in health and wellness, ranging from genetic differences to socio-economic and behavioral factors, such as exercise, nutri-tion, social engagement and support, stress levels, career experiences, and geographic location. Their effects may be cumulative and determine quality of life in old age. Although some of these factors and their effects, such as income and education, have been characterized in the lit-erature, such a large variation in health outcomes suggests that more research is needed to understand the many inter-acting causes of differences in long-term health outcomes. In particular, the field should examine those factors most strongly associated with positive long-term outcomes. A sophisticated understanding of these drivers may guide the design of targeted interventions to steer at-risk sub-populations toward more positive health trajectories at earlier ages. Doing so can increase the odds that they enter later ages on the positive side of the health continuum and maintain their health for a longer period of time. Such interventions could potentially yield significant increases in quality of life, activity, social contributions, and reduc-tions in social costs associated with large increases in the number of Americans who will reach later ages in this century.
Educating Citizens About the Large Differences in Long-Term Health Outcomes
Communicating the degree of variation in long-term health outcomes to the public may help motivate individu-als to adopt healthier behaviors. Although most people are aware that their lifestyle choices affect their health, they may be unaware of the degree to which they may be able to maintain their youthful vigor into much older ages or how large the long-term variation in health outcomes can be. Such awareness can motivate people to make healthier changes earlier in their lives.
We end with a question that should increasingly guide our thinking: When does age no longer matter? Age no longer matters when it cannot reliably gauge the health status of a
648 LOWSKY ET AL.
significant segment of the population in a given age range. Results presented in this study suggest that chronological age is a poor marker of the health impact of aging for a surprisingly large number of older people today, given that different people experience vastly different health outcomes at the same age across the entire age structure. Furthermore, by examining the positive side of the health equation as a function of chronological age, we find a relatively large pro-portion of the population is functionally indistinguishable from people 20 to 30 years their junior. As such, when it comes to measuring, understanding, experiencing, and pro-moting healthy aging, for a large number of older people, chronological age is no longer relevant.
Funding
This work was supported by the MacArthur Foundation Research Network on an Aging Society, whose generous funding made this research possible. In addition, we are grateful to the National Institute on Aging for its support through the Roybal Center for Health Policy Simulation (P30AG024968). The Health and Retirement Study is sponsored by the National Institute on Aging (NIA U01AG009740) and is conducted by the University of Michigan.
References 1. U.S. Census. Projections of the population by selected age groups
and sex for the United States: 2010 to 2050. http://www.census.gov/population/www/projections/files/nation/summary/np2008-t2.xls, 2008. Accessed October 13, 2013.
2. Mendelson DN, Schwartz WB. The effects of aging and population growth on health care costs. Health Aff. 1993;12:119–125.
3. Denton FT, Gafni A, Spencer BG. Exploring the effects of popu-lation change on the costs of physician services. J Health Econ. 2002;21:781–803.
4. Peterson PG. Gray Dawn: How the Coming Age Wave Will Transform America--and the World. New York, NY: Times Books; 1999.
5. Olshansky SJ, Biggs S, Achenbaum WA, et al. The Global Agenda Council on the ageing society: policy principles. Global Policy. 2011;2:97–105.
6. Crimmins EM, Hayward MD, Saito Y. Differentials in active life expectancy in the older population of the United States. J Gerontol B Psychol Sci Soc Sci. 1996;51:S111–S120.
7. Crimmins EM, Saito Y. Trends in healthy life expectancy in the United States, 1970-1990: gender, racial, and educational differences. Soc Sci Med. 2001;52:1629–1641.
8. Lubetkin EI, Jia H, Franks P, Gold MR. Relationship among sociode-mographic factors, clinical conditions, and health-related quality of life: examining the EQ-5D in the U.S. general population. Qual Life Res. 2005;14:2187–2196.
9. Neugarten BL, Neugarten DA. The changing meanings of age. Psychology Today. 1987;21:29.
10. Olshansky SJ, Beard J, Börsch-Supan A. The longevity dividend: health as an investment. In: Beard JR, Biggs S, Bloom DE, Fried LP, Hogan P, Kalache A, and Olshansky SJ, eds. Global Population Ageing: Peril or Promise. Geneva: World Economic Forum; 2011.
11. Lloyd-Sherlock P, McKee M, Ebrahim S, et al. Population ageing and health. Lancet. 2012;379:1295–1296.
12. Crimmins EM, Beltrán-Sánchez H. Mortality and morbidity trends: is there compression of morbidity? J Gerontol B Psychol Sci Soc Sci. 2011;66:75–86.
13. Freedman VA, Martin LG. Understanding trends in functional limita-tions among older Americans. Am J Public Health. 1998;88:1457–1462.
14. Manton KG, Gu X, Lamb VL. Change in chronic disability from 1982 to 2004/2005 as measured by long-term changes in function and health in the U.S. elderly population. Proc Natl Acad Sci USA. 2006;103:18374–18379.
15. Waidmann TA, Liu K. Disability trends among elderly persons and implications for the future. J Gerontol B Psychol Sci Soc Sci. 2000;55:S298–S307.
16. Poses RM, Smith WR, McClish DK, Anthony M. Controlling for con-founding by indication for treatment. Are administrative data equiva-lent to clinical data? Med Care. 1995;33:AS36–AS46.
17. Deaton A, Paxson C. Aging and inequality in income and health. Am Econ Rev. 1998;88:248–253.
18. Dupre ME. Educational differences in age-related patterns of disease: reconsidering the cumulative disadvantage and age-as-leveler hypoth-eses. J Health Soc Behav. 2007;48:1–15.
19. Melzer D, Izmirlian G, Leveille SG, Guralnik JM. Educational differ-ences in the prevalence of mobility disability in old age: the dynamics of incidence, mortality, and recovery. J Gerontol B Psychol Sci Soc Sci. 2001;56:S294–S301.
20. House JS, Lantz PM, Herd P. Continuity and change in the social stratification of aging and health over the life course: evidence from a nationally representative longitudinal study from 1986 to 2001/2002 (Americans’ Changing Lives Study). J Gerontol B Psychol Sci Soc Sci. 2005;60:15–26.
21. House JS, Lepkowski JM, Kinney AM, Mero RP, Kessler RC, Herzog AR. The social stratification of aging and health. J Health Soc Behav. 1994;35:213–234.
22. Feinglass J, Lin S, Thompson J, et al. Baseline health, socioeconomic status, and 10-year mortality among older middle-aged Americans: findings from the Health and Retirement Study, 1992 2002. J Gerontol B Psychol Sci Soc Sci. 2007;62:S209–S217.
23. Schoeni RF, Martin LG, Andreski PM, Freedman VA. Persistent and growing socioeconomic disparities in disability among the elderly: 1982-2002. Am J Public Health. 2005;95:2065–2070.
24. Robert SA, Cherepanov D, Palta M, Dunham NC, Feeny D, Fryback DG. Socioeconomic status and age variations in health-related quality of life: results from the national health measurement study. J Gerontol B Psychol Sci Soc Sci. 2009;64:378–389.
25. Lunney JR, Lynn J, Foley DJ, Lipson S, Guralnik JM. Patterns of functional decline at the end of life. JAMA. 2003;289:2387–2392.
26. Chang WC, Lu FP, Lan TY, Wu SC. Multidimensional health-tran-sition patterns among a middle-aged and older population. Geriatr Gerontol Int. 2013;13:571–579.
27. Wickrama KK, Mancini JA, Kwag K, Kwon J. Heterogeneity in mul-tidimensional health trajectories of late old years and socioeconomic stratification: a latent trajectory class analysis. J Gerontol B Psychol Sci Soc Sci. 2013;68:290–297.
28. Thomas PA. Trajectories of social engagement and limitations in late life. J Health Soc Behav. 2011;52:430–443.
29. DiLorenzo TM, Bargman EP, Stucky-Ropp R, Brassington GS, Frensch PA, LaFontaine T. Long-term effects of aerobic exercise on psychological outcomes. Prev Med. 1999;28:75–85.
30. Warburton DE, Nicol CW, Bredin SS. Health benefits of physical activity: the evidence. CMAJ. 2006;174:801–809.
31. Rodin J. Aging and health: effects of the sense of control. Science. 1986;233:1271–1276.
32. Fontana L, Meyer TE, Klein S, Holloszy JO. Long-term calorie restriction is highly effective in reducing the risk for atherosclerosis in humans. Proc Natl Acad Sci USA. 2004;101:6659–6663.
33. Grundy E, Bowling A. Enhancing the quality of extended life years. Identification of the oldest old with a very good and very poor quality of life. Aging Ment Health. 1999;3:199–212.
34. EuroQol Group. About EQ-5D. http://www.euroqol.org/eq-5d/what-is-eq-5d.html, 2013. Accessed October 13, 2013.
HETEROGENEITY IN HEALTHY AGING 649
35. Shaw JW, Johnson JA, Coons SJ. US valuation of the EQ-5D health states: development and testing of the D1 valuation model. Med Care. 2005;43:203–220.
36. Agency for Healthcare Research and Quality. Calculating the U.S. population-based EQ-5D index score. http://www.ahrq.gov/rice/EQ5Dscore.htm. Accessed October 13, 2013.
37. Agency for Healthcare Research and Quality. MEPS HC-079: 2003 full year consolidated data file. http://meps.ahrq.gov/mepsweb/data_stats/download_data/pufs/h79/h79doc.shtml, 2005. Accessed October 13, 2013.
38. RAND Center for the Study of Aging. RAND HRS Data, Version J. Funded by the National Institute on Aging and the Social Security Administration. Santa Monica, CA.
39. University of Michigan. Health and Retirement Study: public use dataset. Funded by the National Institute on Aging (grant number NIA U01AG009740). Ann Arbor, MI.
40. University of Michigan. Health and Retirement Study: survey design doc-uments. http://hrsonline.isr.umich.edu/index.php?p=sdesign. Accessed October 13, 2013.
41. Wun LM, Ezzati-Rice TM, Kashihara D. Assessment and evalua-tion of nonresponse error in the Medical Expenditure Panel Survey (MEPS): assessing nonresponse bias reduction in MEPS. Presented at: 2009 Joint Statistical Meetings, Section on Survey Research Methods; August 2, 2009; Washington, DC.
42. Wolinsky FD, Mahncke HW, Kosinski M, et al. The ACTIVE cogni-tive training trial and predicted medical expenditures. BMC Health Serv Res. 2009;9:109.
43. Ellis C, Grubaugh AL, Egede LE. Factors associated with SF-12 physical and mental health quality of life scores in adults with stroke. J Stroke Cerebrovasc Dis. 2013;22:309–317.
44. Jano E, Johnson M, Chen H, Aparasu RR. Determinants of atypical antipsychotic use among antipsychotic users in community-dwell-ing elderly, 1996-2004. Curr Med Res Opin. 2008;24:709–716.
45. Hurd MD, Martorell P, Delavande A, Mullen KJ, Langa KM. Monetary costs of dementia in the United States. N Engl J Med. 2013;368:1326–1334.
46. Weir D, Faul J, Langa K. Proxy interviews and bias in the distribution of cognitive abilities due to non-response in longitudinal studies: a com-parison of HRS and ELSA. Longit Life Course Stud. 2011;2:170–184.
47. Rowe JW, Kahn RL. Successful Aging. New York, NY: Dell; 1999.
48. Neugarten BL. Age groups in American Society and the rise of the young-old. Ann Am Acad Polit Soc Sci. 1974;415:187–198.
49. Sanderson WC, Scherbov S. Demography. Remeasuring aging. Science. 2010;329:1287–1288.
50. Social Security and Medicare Boards of Trustees. Summary of the 2011 Annual Social Security and Medicare Trust Fund Reports. 2011. http://www.ssa.gov/oact/tr/2011/tr2011.pdf. Accessed October 13, 2013.
View publication statsView publication stats
![Essays in Criticism Volume 61 Issue 3 2011 [Doi 10.1093%2Fescrit%2Fcgr011] Giles, P. -- Axel's Castle](https://img.pdfslide.net/doc/110x75/563db876550346aa9a93e831/essays-in-criticism-volume-61-issue-3-2011-doi-1010932fescrit2fcgr011.jpg)


![Mind Volume Lxxi Issue 282 1962 [Doi 10.1093%2fmind%2flxxi.282.197] Sprigge, Timothy -- IV.—Internal and External Properties](https://img.pdfslide.net/doc/110x75/577ccd7f1a28ab9e788c7f82/mind-volume-lxxi-issue-282-1962-doi-1010932fmind2flxxi282197-sprigge.jpg)