Embed Size (px)
Citation preview
JP Morgan High Yield ConferenceKevin Burns, SVP – Investor Relations and Treasurer
February 25, 2019
Safe Harbor StatementThe statements in this release other than historical facts are forward-looking statements made in reliance upon the safe harbor of the Private Securities Litigation Reform Act of 1995. Theseforward-looking statements are subject to a number of factors that could cause our actual results to differ materially from what is indicated here. These factors include but are not limited togeneral economic conditions, the level of customer demand particularly for capital projects in the markets we serve, changes in supplier relationships or in supplier sales strategies or financialviability, risks associated with the sale of nonconforming products and services, political, economic or currency risks related to foreign operations, inventory obsolescence, copper pricefluctuations, customer viability, risks associated with accounts receivable, the impact of regulation and regulatory, investigative and legal proceedings and legal compliance risks, informationsecurity risks, risks associated with substantial debt and restrictions contained in financial and operating covenants in our debt agreements, the impact and the uncertainty concerning the timingand terms of the withdrawal by the United Kingdom from the European Union, and risks associated with integration of acquired companies, including, but not limited to, the risk that theacquisitions may not provide us with the synergies or other benefits that were anticipated. These uncertainties may cause our actual results to be materially different than those expressed inany forward looking statements. We do not undertake to update any forward looking statements. Please see our Securities and Exchange Commission (“SEC”) filings for more information.
Non-GAAP Financial MeasuresIn addition to the results provided in accordance with U.S. Generally Accepted Accounting Principles (“GAAP”) above, this presentation includes certain financial measures computed using non-GAAP components as defined by the SEC. Specifically, net sales comparisons to the prior corresponding period, both worldwide and in relevant segments, are discussed in this presentationboth on a U.S. GAAP and non-GAAP basis. We believe that by providing non-GAAP organic growth, which adjusts for the impact of acquisitions (when applicable), foreign exchangefluctuations, copper prices and the number of billing days, both management and investors are provided with meaningful supplemental sales information to understand and analyze ourunderlying trends and other aspects of our financial performance. Historically and from time to time, we may also exclude other items from reported financial results (e.g., impairment charges,inventory adjustments, restructuring charges, tax items, currency devaluations, pension settlements, etc.) in presenting adjusted operating expense, adjusted operating income, adjusted incometaxes and adjusted net income so that both management and financial statement users can use these non-GAAP financial measures to better understand and evaluate our performance periodover period and to analyze the underlying trends of our business. We have also excluded amortization of intangible assets associated with purchase accounting from acquisitions from theadjusted amounts for comparison of the non-GAAP financial measures period over period.
EBITDA is defined as net income from continuing operations before interest, income taxes, depreciation and amortization. Adjusted EBITDA is defined as EBITDA before foreign exchange andother non-operating expense and non-cash stock-based compensation, excluding the other items from reported financial results, as defined above. Adjusted EBITDA leverage is defined as thepercentage change in Adjusted EBITDA divided by the percentage change in net sales. We believe that adjusted operating income, EBITDA, Adjusted EBITDA, and Adjusted EBITDA leverageprovide relevant and useful information, which is widely used by analysts, investors and competitors in our industry as well as by our management in assessing both consolidated and businesssegment performance. Adjusted operating income provides an understanding of the results from the primary operations of our business by excluding the effects of certain items that do notreflect the ordinary earnings of our operations. We use adjusted operating income to evaluate our period-over-period operating performance because we believe this provides a morecomparable measure of our continuing business excluding certain items that are not reflective of expected ongoing operations. This measure may be useful to an investor in evaluating theunderlying performance of our business. EBITDA provides us with an understanding of earnings before the impact of investing and financing charges and income taxes. Adjusted EBITDAfurther excludes the effects of foreign exchange and other non-cash stock-based compensation, and certain items that do not reflect the ordinary earnings of our operations and that are alsoexcluded for purposes of calculating adjusted net income, adjusted earnings per share and adjusted operating income. EBITDA and Adjusted EBITDA are used by our management for variouspurposes including as measures of performance of our operating entities and as a basis for strategic planning and forecasting. Adjusted EBITDA and Adjusted EBITDA leverage may be usefulto an investor because this measure is widely used to evaluate a company’s operating performance without regard to items excluded from the calculation of such measure, which can varysubstantially from company to company depending on the accounting methods, book value of assets, capital structure and the method by which the assets were acquired, among other factors.They are not, however, intended as an alternative measure of operating results or cash flow from operations as determined in accordance with U.S. GAAP.
Non-GAAP financial measures provide insight into selected financial information and should be evaluated in the context in which they are presented. These non-GAAP financial measures havelimitations as analytical tools, and should not be considered in isolation from, or as a substitute for, financial information presented in compliance with GAAP, and non-GAAP financial measuresas reported by us may not be comparable to similarly titled amounts reported by other companies. The non-GAAP financial measures should be considered in conjunction with the CondensedConsolidated Financial Statements, including the related notes, and Management’s Discussion and Analysis of Financial Condition and Results of Operations included in this presentation.Management does not use these non-GAAP financial measures for any purpose other than the reasons stated above.
SAFE HARBOR STATEMENT ANDNON-GAAP FINANCIAL MEASURES
2
TABLE OF CONTENTS
3
Business Overview
Key Priorities
Financial Profile
Invest in Anixter
1234

BUSINESS OVERVIEW
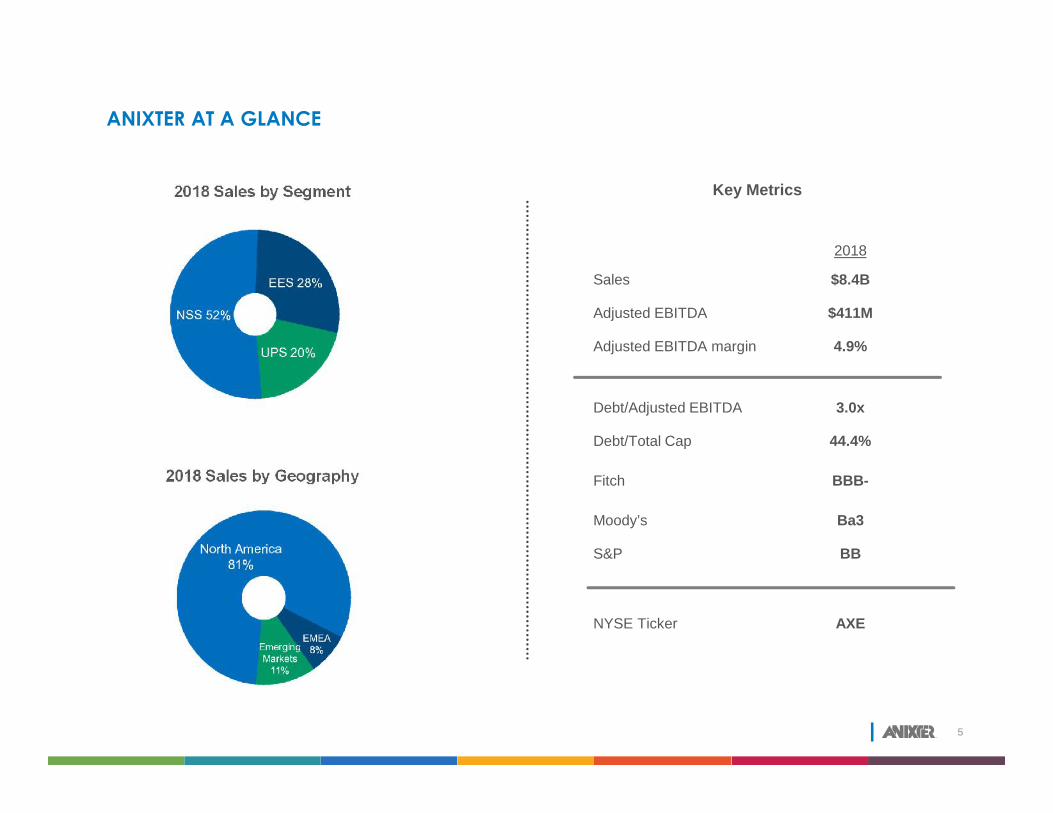
ANIXTER AT A GLANCE
5
2018
Sales $8.4B
Adjusted EBITDA $411M
Adjusted EBITDA margin 4.9%
Debt/Adjusted EBITDA 3.0x
Debt/Total Cap 44.4%
Fitch BBB-
Moody’s Ba3
S&P BB
NYSE Ticker AXE
2018 Sales by Segment
2018 Sales by Geography
Key Metrics
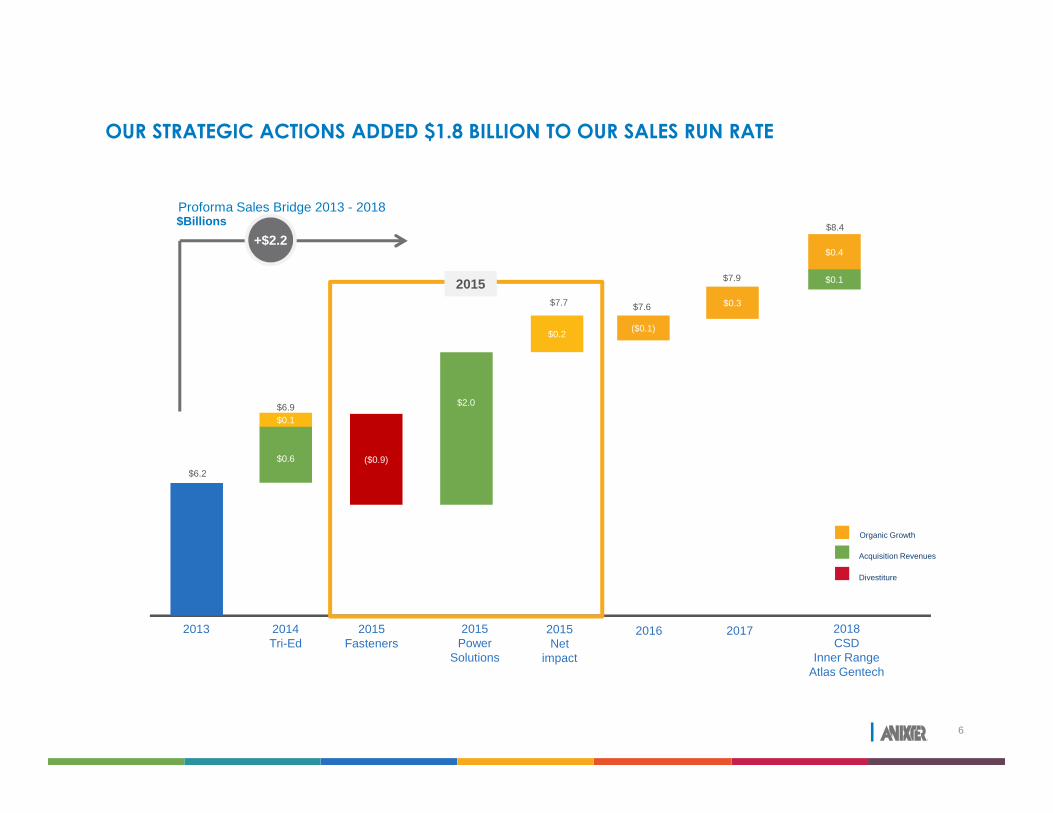
($0.9)
6
OUR STRATEGIC ACTIONS ADDED $1.8 BILLION TO OUR SALES RUN RATE
2017
$6.9
$0.6
$0.1
$2.0
2018CSD
Inner RangeAtlas Gentech
$6.2
2015Net
impact
2014Tri-Ed
2015Fasteners
2015Power
Solutions
2013
$0.2
$7.7
2016
Proforma Sales Bridge 2013 - 2018$Billions
+$2.2
2015$7.6
($0.1)
$7.9
$0.3
$8.4
$0.4
$0.1
Acquisition Revenues
Organic Growth
Divestiture
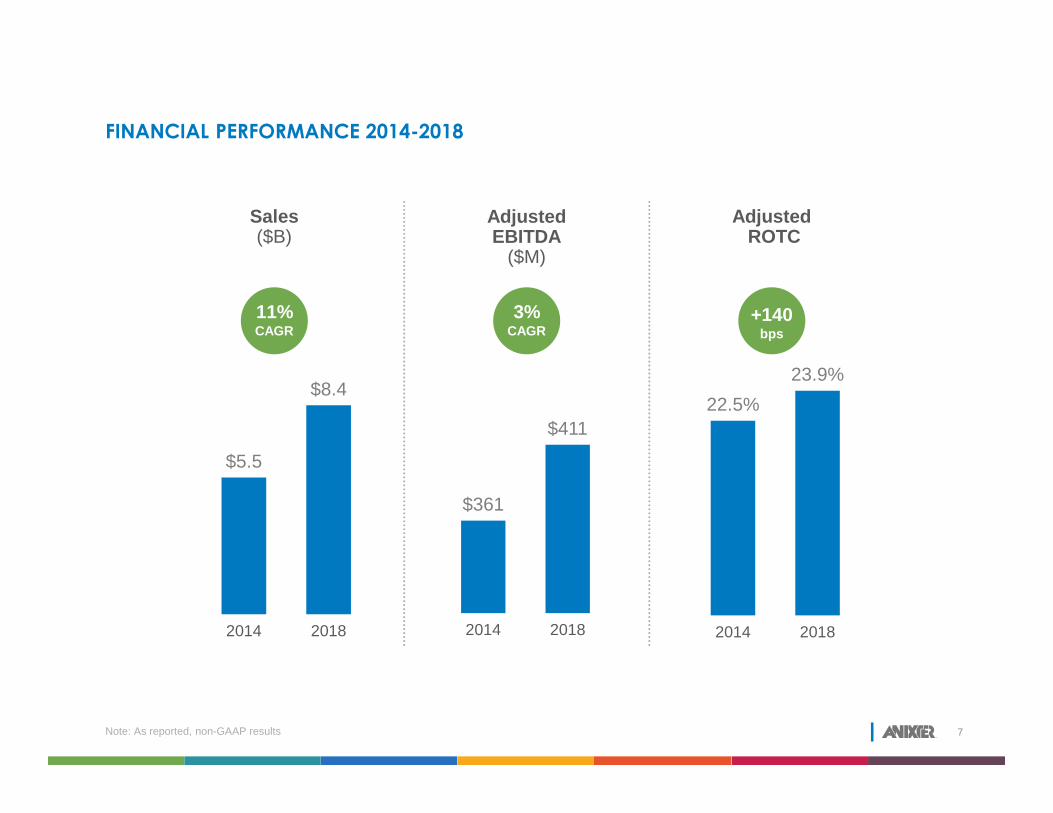
22.5%23.9%
2014 2018
FINANCIAL PERFORMANCE 2014-2018
7
$5.5
$8.4
2014 2018
$361
$411
2014 2018
Note: As reported, non-GAAP results
AdjustedEBITDA
($M)
Sales($B)
AdjustedROTC
11%CAGR
3%CAGR
+140bps
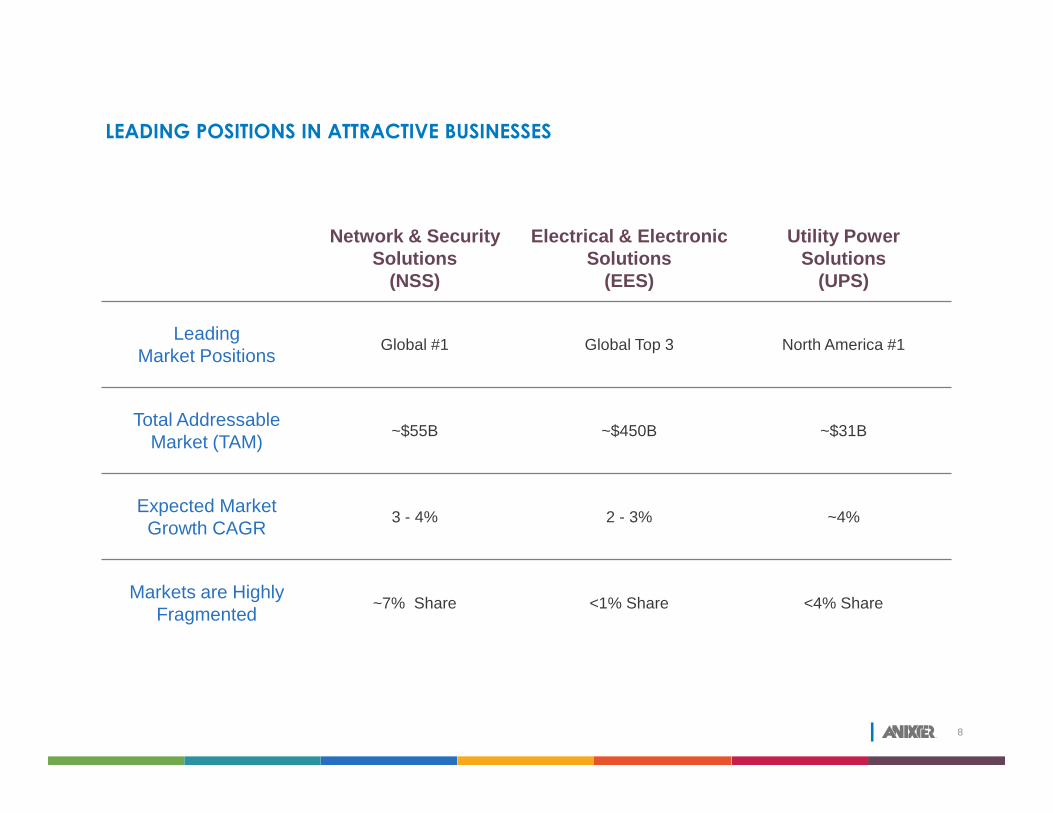
LEADING POSITIONS IN ATTRACTIVE BUSINESSES
8
Network & SecuritySolutions
(NSS)
Electrical & ElectronicSolutions
(EES)
Utility PowerSolutions
(UPS)
LeadingMarket Positions Global #1 Global Top 3 North America #1
Total AddressableMarket (TAM) ~$55B ~$450B ~$31B
Expected MarketGrowth CAGR 3 - 4% 2 - 3% ~4%
Markets are HighlyFragmented ~7% Share <1% Share <4% Share
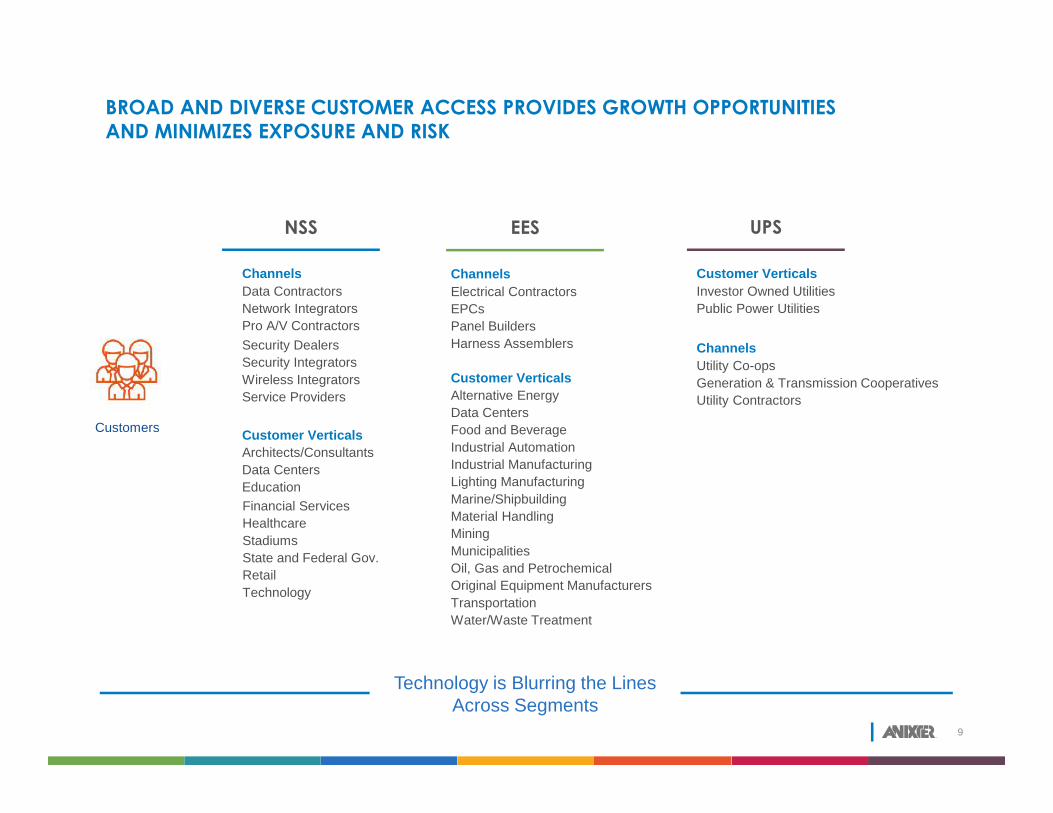
BROAD AND DIVERSE CUSTOMER ACCESS PROVIDES GROWTH OPPORTUNITIESAND MINIMIZES EXPOSURE AND RISK
9
ChannelsData ContractorsNetwork IntegratorsPro A/V Contractors
NSS
Customer VerticalsArchitects/ConsultantsData CentersEducation
Security DealersSecurity IntegratorsWireless IntegratorsService Providers
Financial ServicesHealthcareStadiumsState and Federal Gov.RetailTechnology
UPS
Customer VerticalsInvestor Owned UtilitiesPublic Power Utilities
ChannelsUtility Co-opsGeneration & Transmission CooperativesUtility Contractors
ChannelsElectrical ContractorsEPCsPanel BuildersHarness Assemblers
Customer VerticalsAlternative EnergyData CentersFood and BeverageIndustrial AutomationIndustrial ManufacturingLighting ManufacturingMarine/ShipbuildingMaterial HandlingMiningMunicipalitiesOil, Gas and PetrochemicalOriginal Equipment ManufacturersTransportationWater/Waste Treatment
EES
Customers
Technology is Blurring the LinesAcross Segments
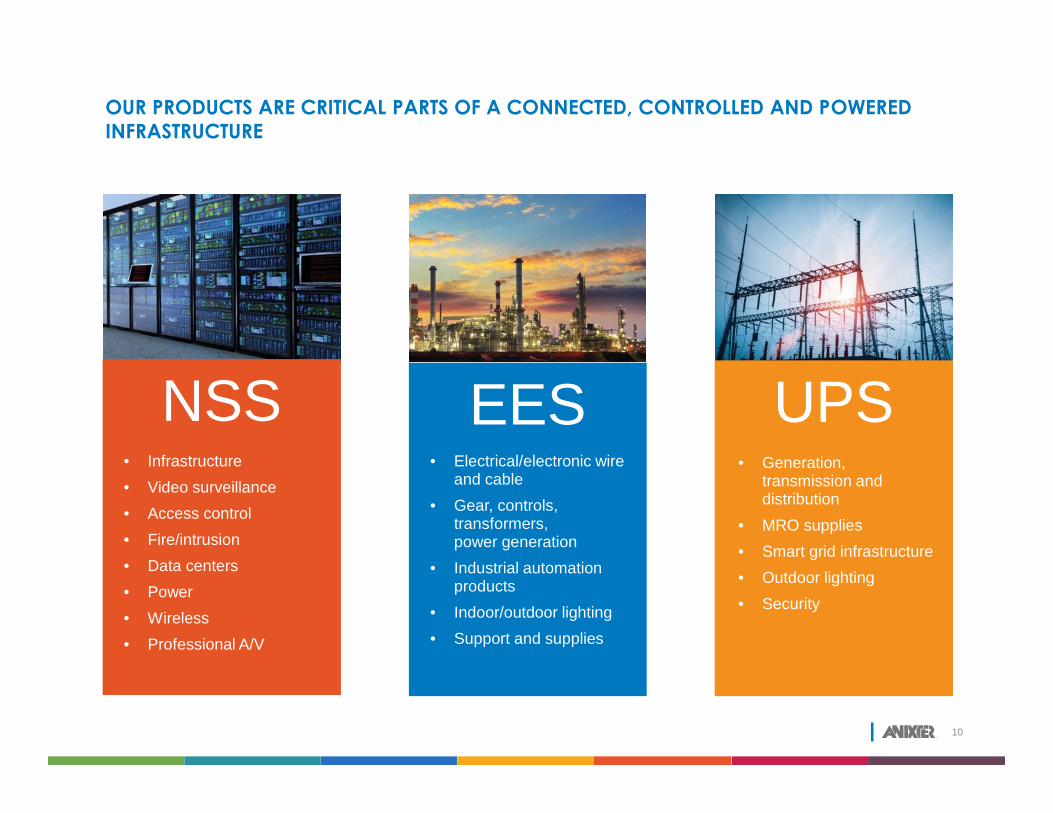
OUR PRODUCTS ARE CRITICAL PARTS OF A CONNECTED, CONTROLLED AND POWEREDINFRASTRUCTURE
10
NSS UPS• Infrastructure• Video surveillance• Access control• Fire/intrusion• Data centers• Power• Wireless• Professional A/V
• Electrical/electronic wireand cable
• Gear, controls,transformers,power generation
• Industrial automationproducts
• Indoor/outdoor lighting• Support and supplies
• Generation,transmission anddistribution
• MRO supplies• Smart grid infrastructure• Outdoor lighting• Security
EES• Electrical/electronic wire
and cable• Gear, controls,
transformers,power generation
• Industrial automationproducts
• Indoor/outdoor lighting• Support and supplies
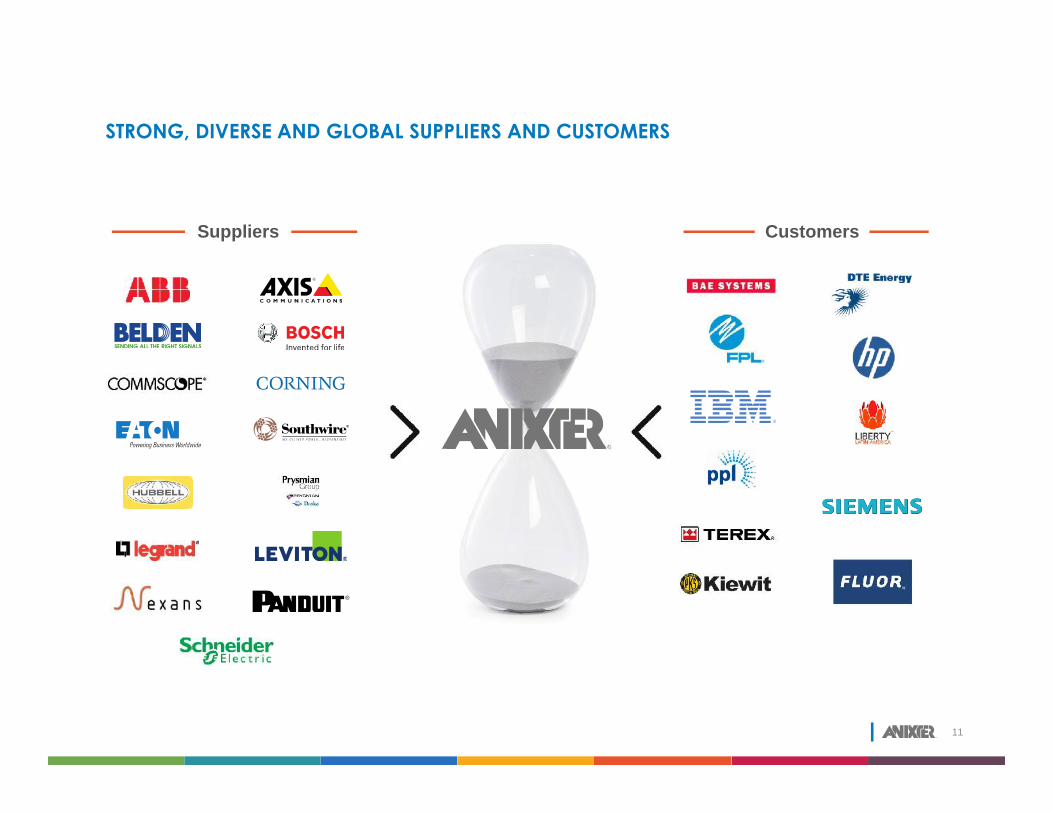
STRONG, DIVERSE AND GLOBAL SUPPLIERS AND CUSTOMERS
11
Suppliers Customers
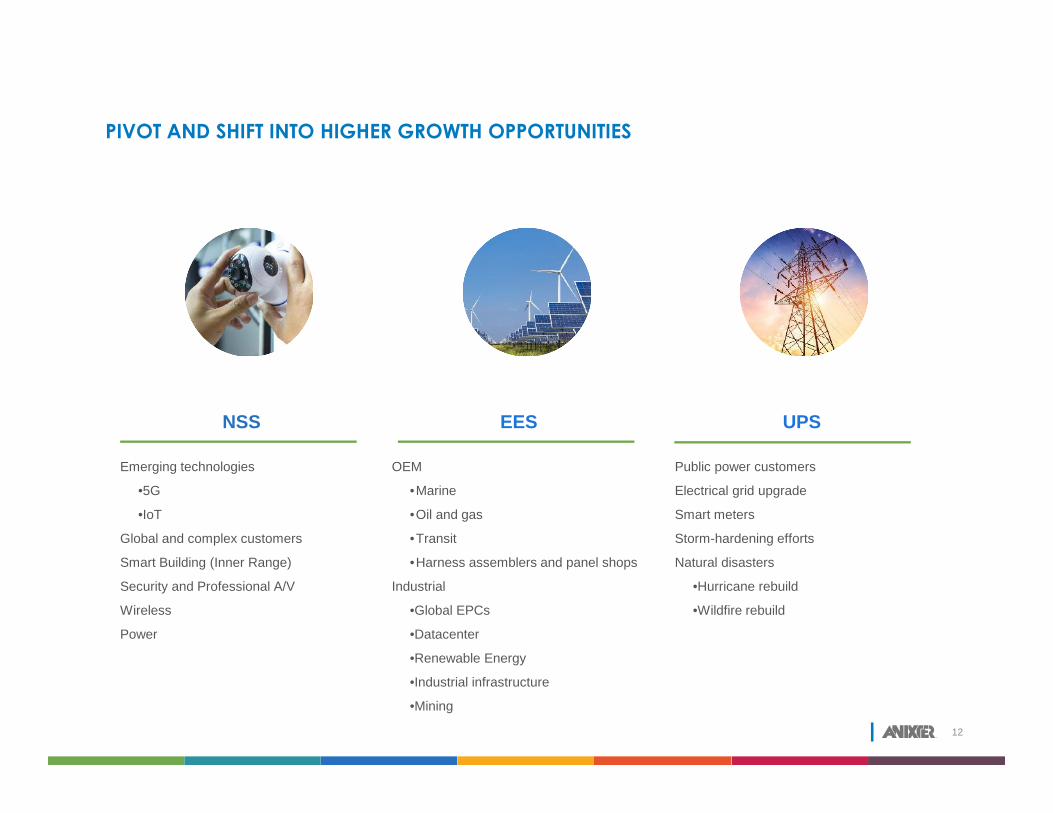
PIVOT AND SHIFT INTO HIGHER GROWTH OPPORTUNITIES
12
NSS EES UPS
Emerging technologies
•5G
•IoT
Global and complex customers
Smart Building (Inner Range)
Security and Professional A/V
Wireless
Power
OEM
•Marine
•Oil and gas
•Transit
•Harness assemblers and panel shops
Industrial
•Global EPCs
•Datacenter
•Renewable Energy
•Industrial infrastructure
•Mining
Public power customers
Electrical grid upgrade
Smart meters
Storm-hardening efforts
Natural disasters
•Hurricane rebuild
•Wildfire rebuild
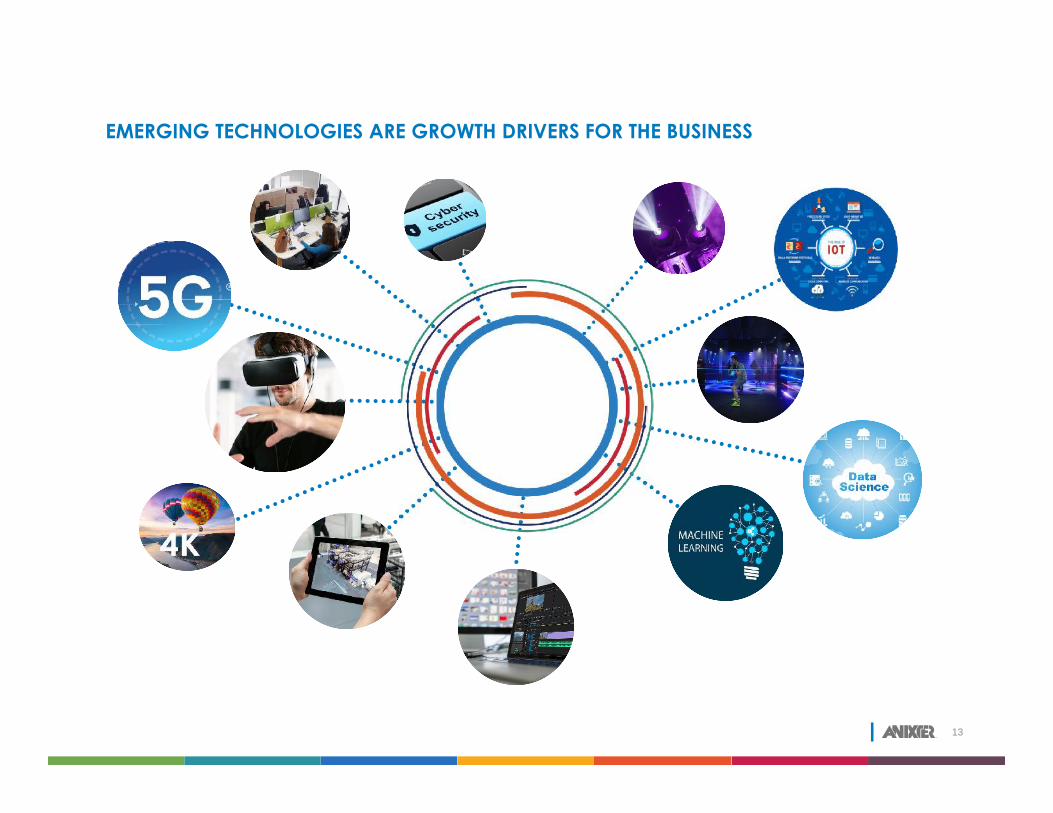
EMERGING TECHNOLOGIES ARE GROWTH DRIVERS FOR THE BUSINESS
13
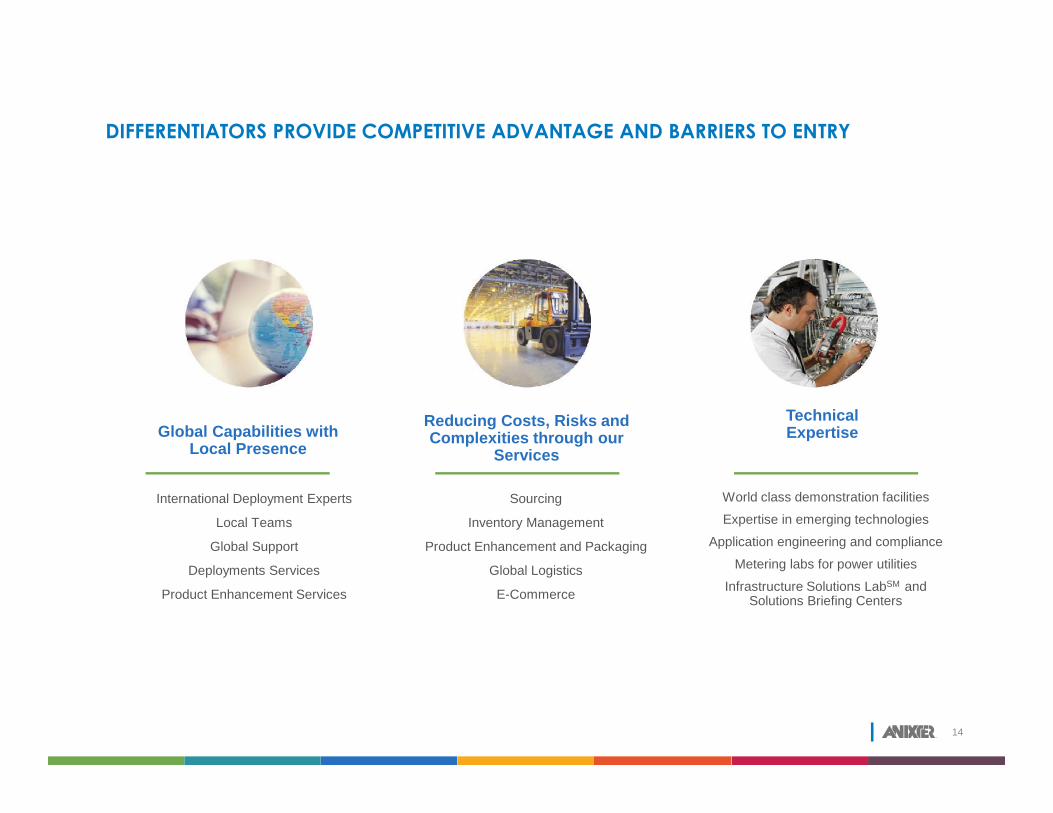
DIFFERENTIATORS PROVIDE COMPETITIVE ADVANTAGE AND BARRIERS TO ENTRY
14
Global Capabilities withLocal Presence
Reducing Costs, Risks andComplexities through our
Services
TechnicalExpertise
World class demonstration facilitiesExpertise in emerging technologies
Application engineering and complianceMetering labs for power utilities
Infrastructure Solutions LabSM andSolutions Briefing Centers
Sourcing
Inventory Management
Product Enhancement and Packaging
Global Logistics
E-Commerce
•International Deployment Experts
•Local Teams
•Global Support
•Deployments Services
•Product Enhancement Services
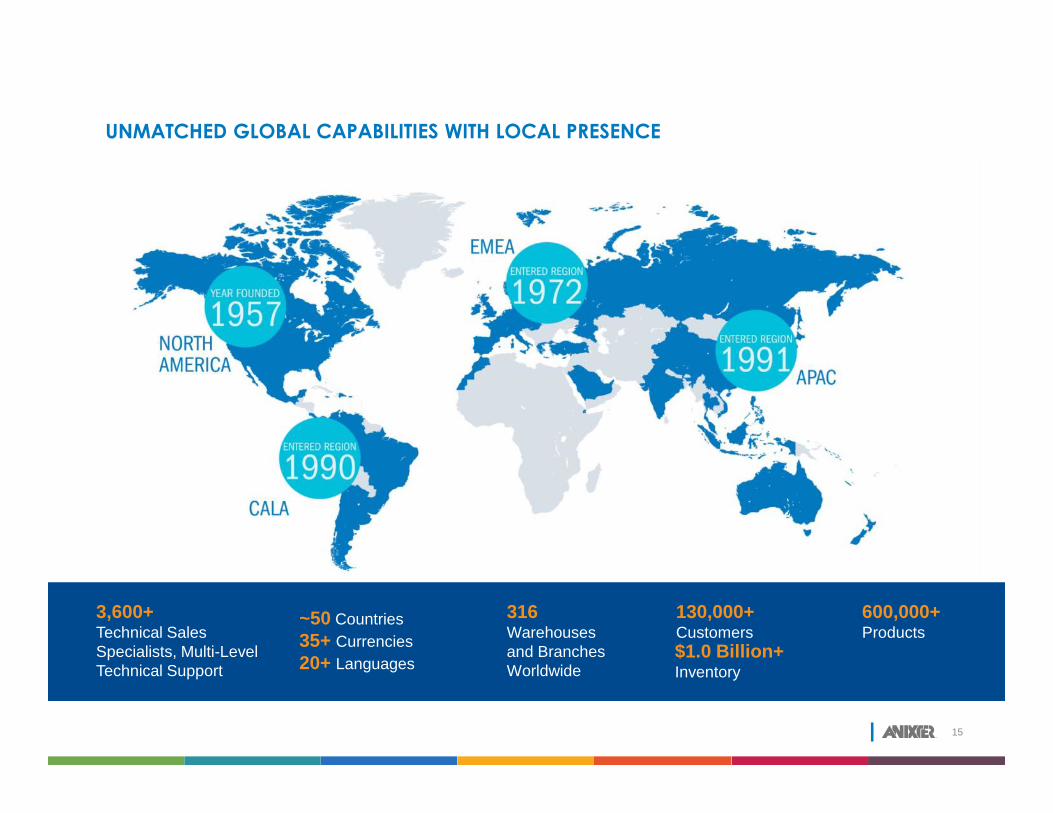
UNMATCHED GLOBAL CAPABILITIES WITH LOCAL PRESENCE
15
3,600+Technical SalesSpecialists, Multi-LevelTechnical Support
130,000+Customers$1.0 Billion+Inventory
600,000+Products
~50 Countries35+ Currencies20+ Languages
316Warehousesand BranchesWorldwide
Anixter is a Services Companythat Does Exceptional Distribution
Our Vision
16
17
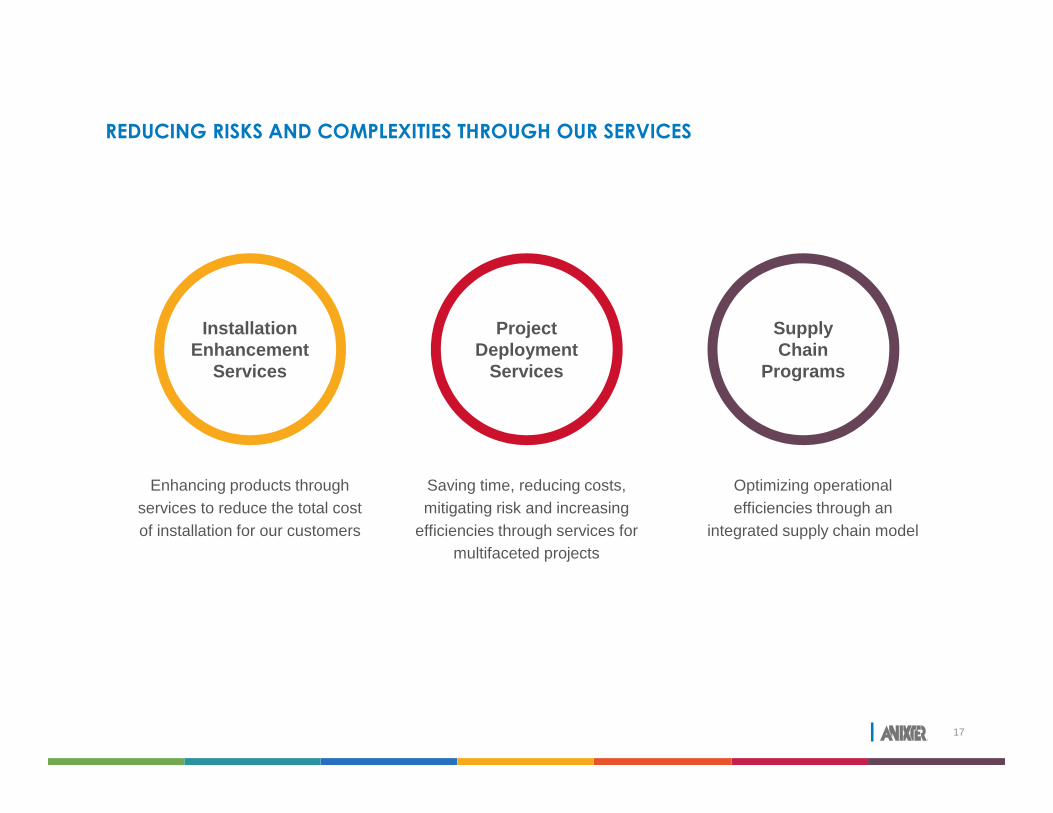
REDUCING RISKS AND COMPLEXITIES THROUGH OUR SERVICES
InstallationEnhancement
Services
ProjectDeployment
Services
SupplyChain
Programs
Enhancing products throughservices to reduce the total costof installation for our customers
Saving time, reducing costs,mitigating risk and increasing
efficiencies through services formultifaceted projects
Optimizing operationalefficiencies through an
integrated supply chain model
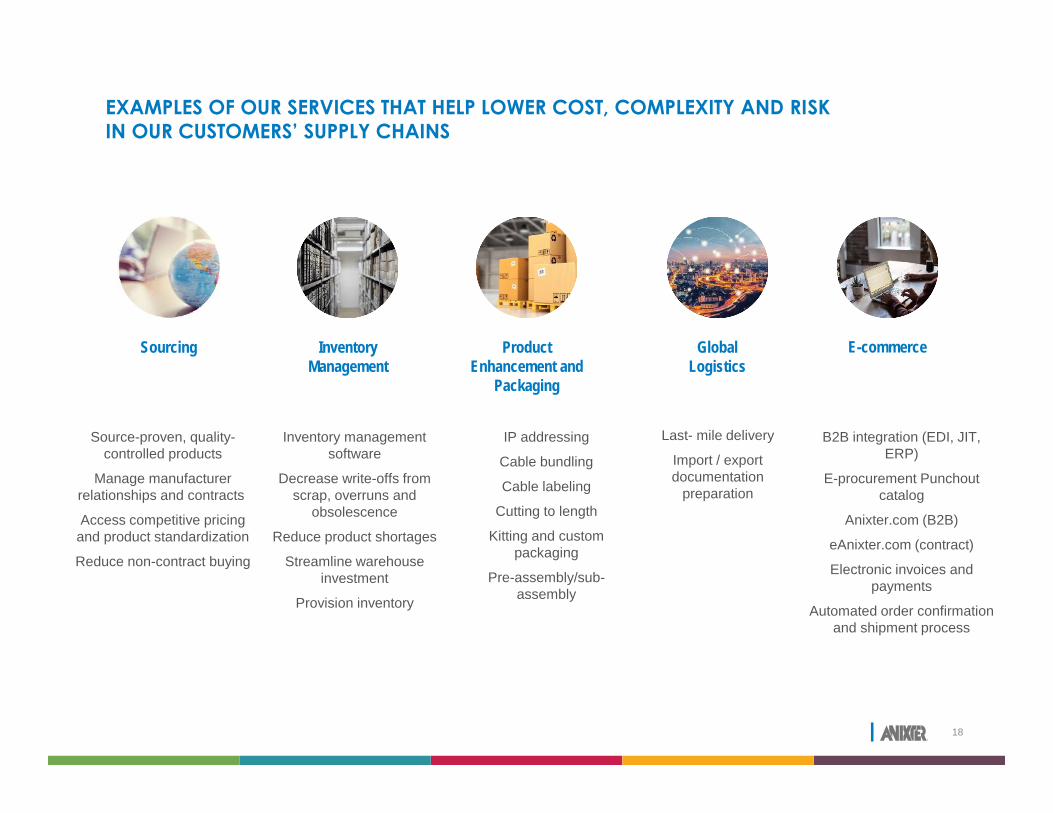
EXAMPLES OF OUR SERVICES THAT HELP LOWER COST, COMPLEXITY AND RISKIN OUR CUSTOMERS’ SUPPLY CHAINS
18
Source-proven, quality-controlled products
Manage manufacturerrelationships and contracts
Access competitive pricingand product standardization
Reduce non-contract buying
Inventory managementsoftware
Decrease write-offs fromscrap, overruns and
obsolescence
Reduce product shortages
Streamline warehouseinvestment
Provision inventory
IP addressing
Cable bundling
Cable labeling
Cutting to length
Kitting and custompackaging
Pre-assembly/sub-assembly
Last- mile delivery
Import / exportdocumentation
preparation
B2B integration (EDI, JIT,ERP)
E-procurement Punchoutcatalog
Anixter.com (B2B)
eAnixter.com (contract)
Electronic invoices andpayments
Automated order confirmationand shipment process
Sourcing InventoryManagement
ProductEnhancement and
Packaging
GlobalLogistics
E-commerce
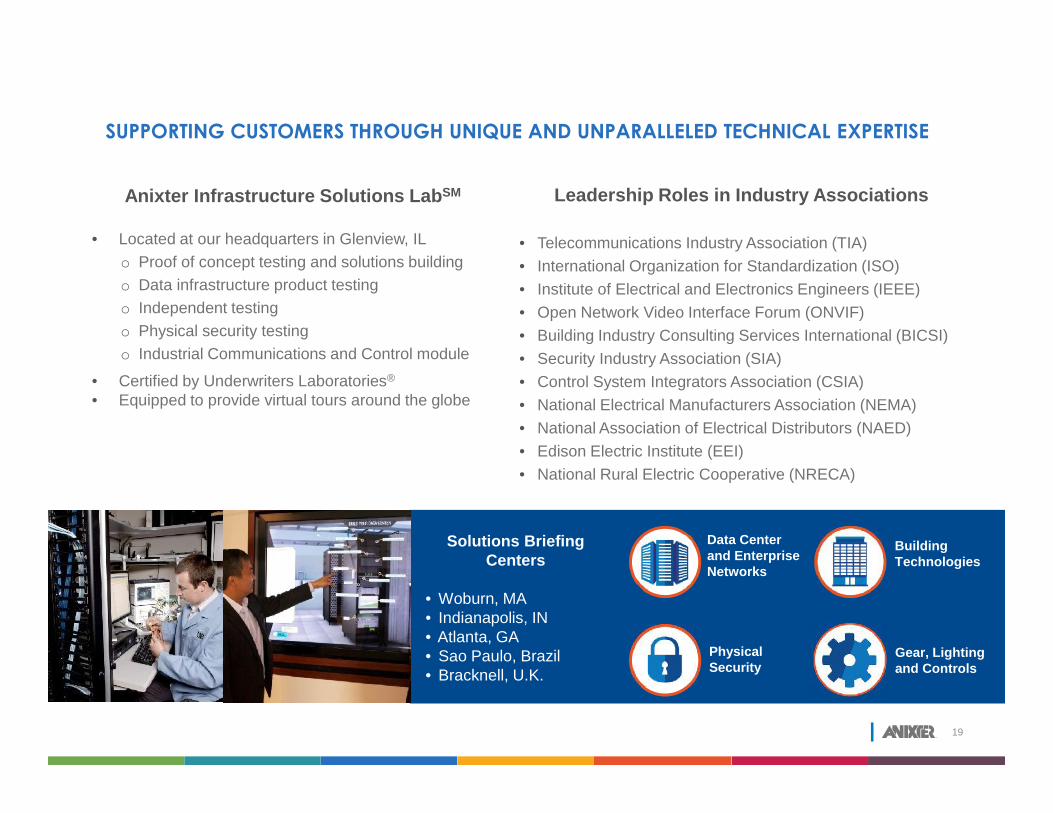
SUPPORTING CUSTOMERS THROUGH UNIQUE AND UNPARALLELED TECHNICAL EXPERTISE
19
Anixter Infrastructure Solutions LabSM
• Located at our headquarters in Glenview, ILo Proof of concept testing and solutions buildingo Data infrastructure product testingo Independent testingo Physical security testingo Industrial Communications and Control module
• Certified by Underwriters Laboratories®
• Equipped to provide virtual tours around the globe
Leadership Roles in Industry Associations
• Telecommunications Industry Association (TIA)• International Organization for Standardization (ISO)• Institute of Electrical and Electronics Engineers (IEEE)• Open Network Video Interface Forum (ONVIF)• Building Industry Consulting Services International (BICSI)• Security Industry Association (SIA)• Control System Integrators Association (CSIA)• National Electrical Manufacturers Association (NEMA)• National Association of Electrical Distributors (NAED)• Edison Electric Institute (EEI)• National Rural Electric Cooperative (NRECA)
BuildingTechnologies
Data Centerand EnterpriseNetworks
PhysicalSecurity
Gear, Lightingand Controls
Solutions BriefingCenters
• Woburn, MA• Indianapolis, IN• Atlanta, GA• Sao Paulo, Brazil• Bracknell, U.K.

KEY PRIORITIES
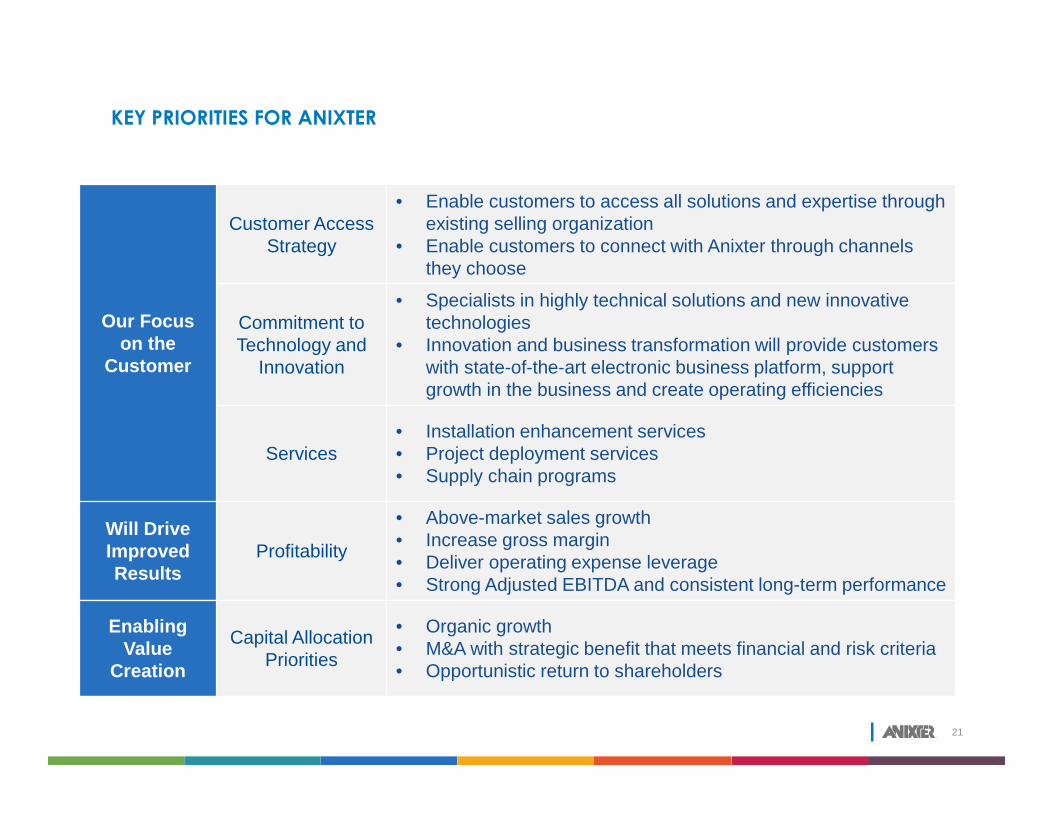
KEY PRIORITIES FOR ANIXTER
21
Our Focuson the
Customer
Customer AccessStrategy
• Enable customers to access all solutions and expertise throughexisting selling organization
• Enable customers to connect with Anixter through channelsthey choose
Commitment toTechnology and
Innovation
• Specialists in highly technical solutions and new innovativetechnologies
• Innovation and business transformation will provide customerswith state-of-the-art electronic business platform, supportgrowth in the business and create operating efficiencies
Services• Installation enhancement services• Project deployment services• Supply chain programs
Will DriveImprovedResults
Profitability
• Above-market sales growth• Increase gross margin• Deliver operating expense leverage• Strong Adjusted EBITDA and consistent long-term performance
EnablingValue
Creation
Capital AllocationPriorities
• Organic growth• M&A with strategic benefit that meets financial and risk criteria• Opportunistic return to shareholders

FINANCIAL PROFILE
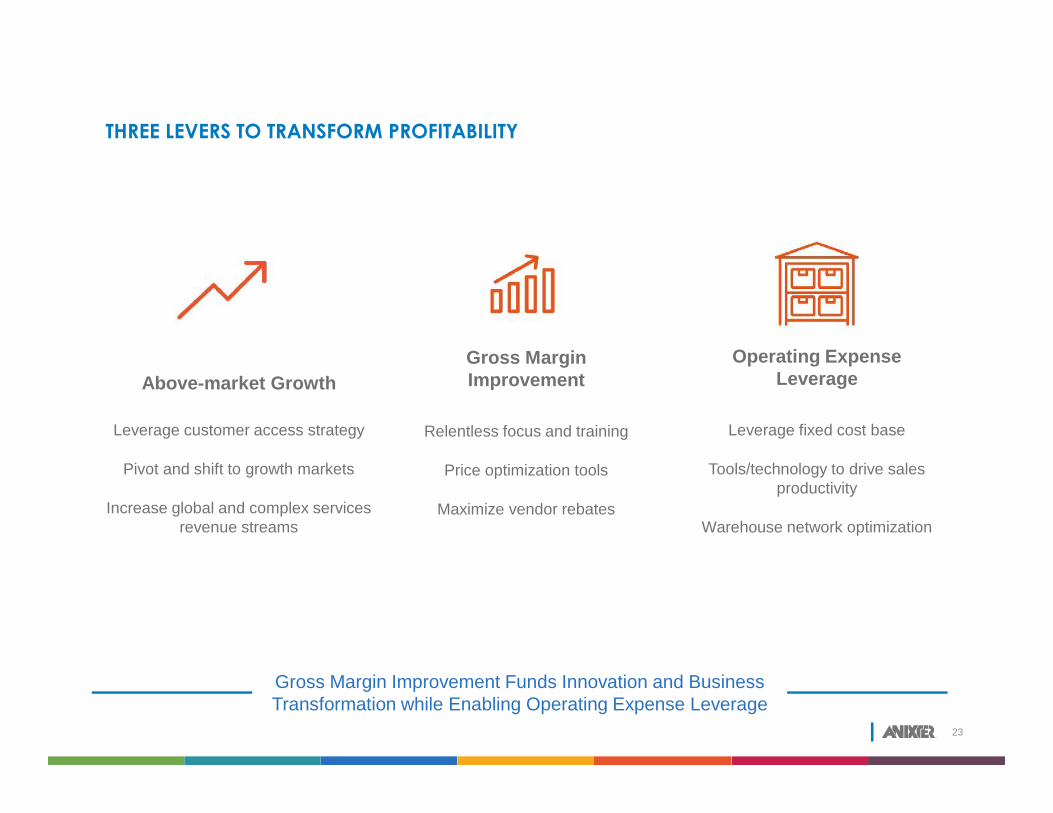
THREE LEVERS TO TRANSFORM PROFITABILITY
23
Above-market Growth
Leverage customer access strategy
Pivot and shift to growth markets
Increase global and complex servicesrevenue streams
Gross MarginImprovement
Relentless focus and training
Price optimization tools
Maximize vendor rebates
Operating ExpenseLeverage
Leverage fixed cost base
Tools/technology to drive salesproductivity
Warehouse network optimization
Gross Margin Improvement Funds Innovation and BusinessTransformation while Enabling Operating Expense Leverage
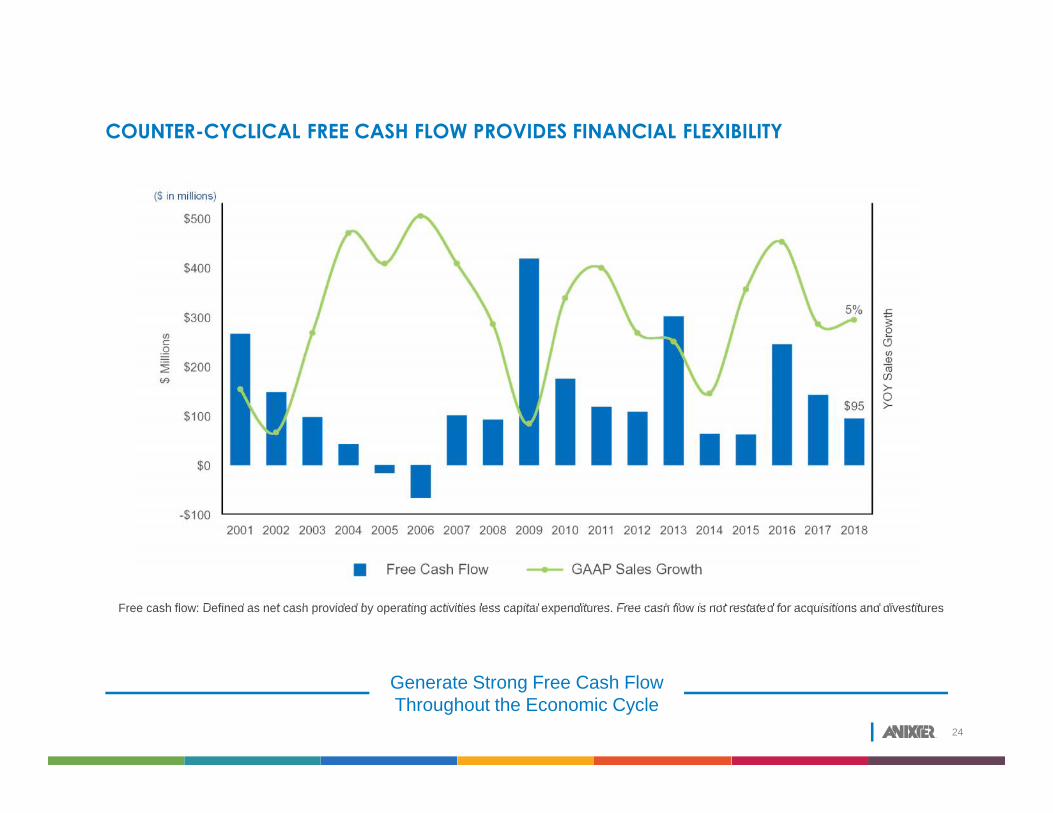
Free cash flow: Defined as net cash provided by operating activities less capital expenditures. Free cash flow is not restated for acquisitions and divestitures
COUNTER-CYCLICAL FREE CASH FLOW PROVIDES FINANCIAL FLEXIBILITY
24
($ in millions)
Generate Strong Free Cash FlowThroughout the Economic Cycle
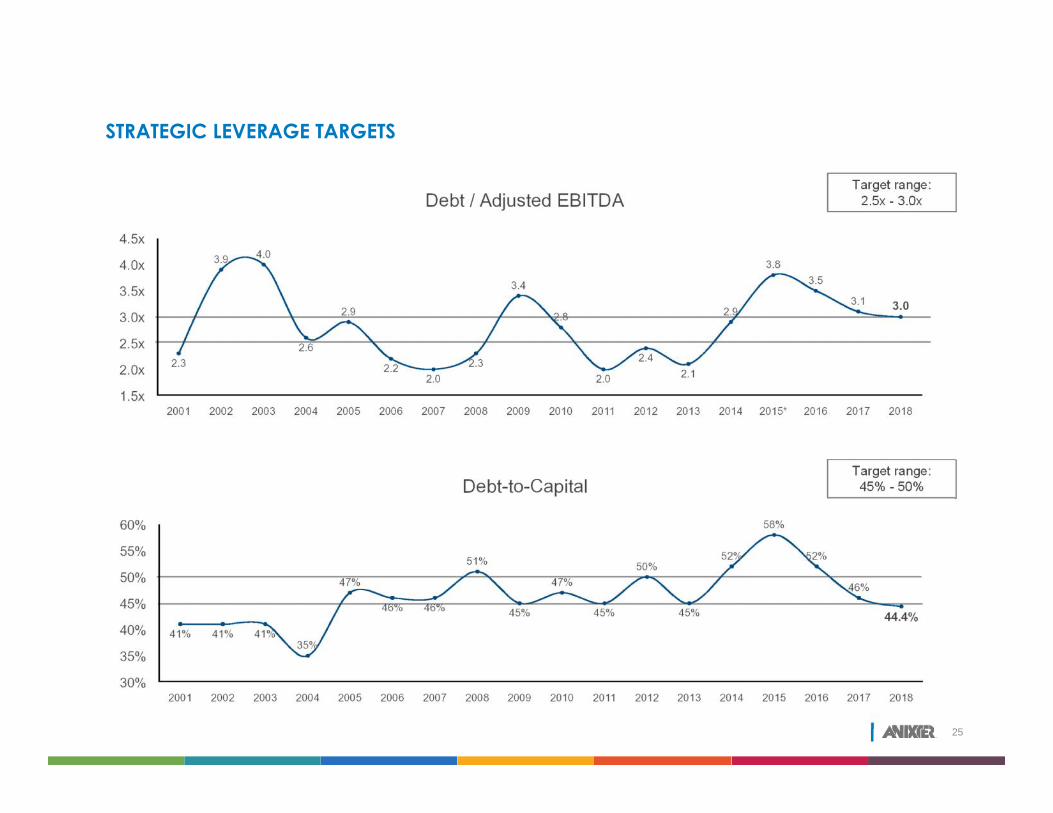
STRATEGIC LEVERAGE TARGETS
25
Target range:2.5x - 3.0x
Target range:45% - 50%
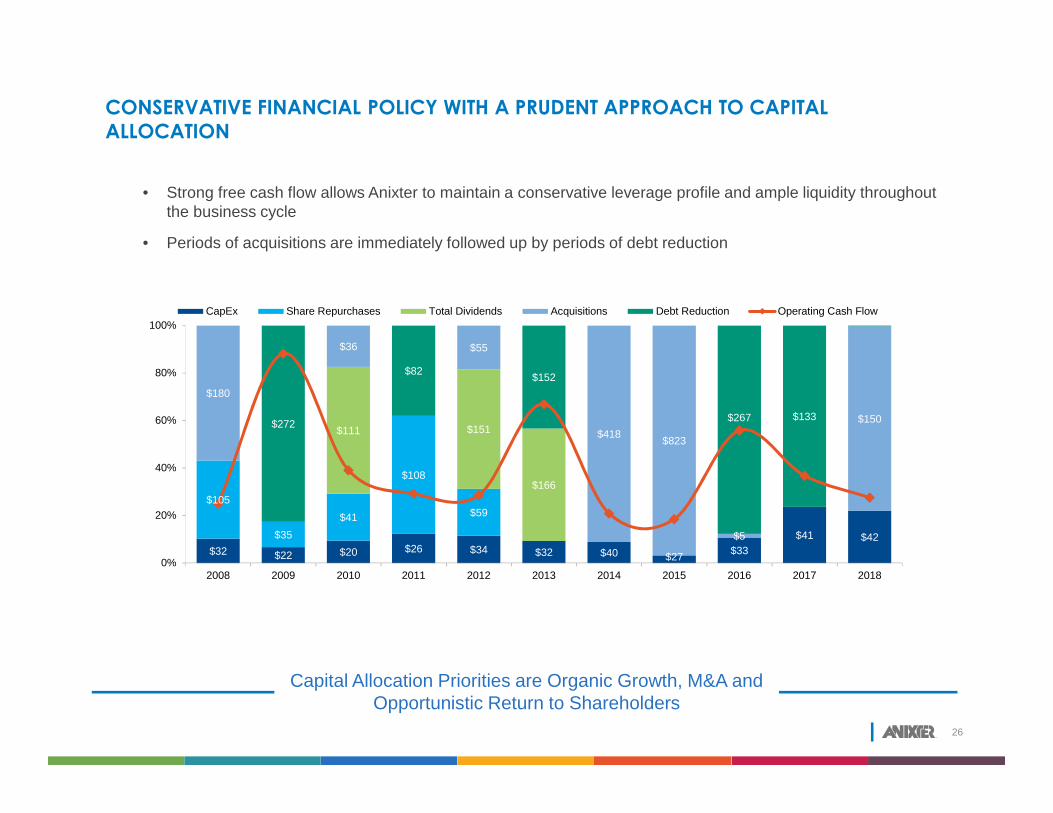
CONSERVATIVE FINANCIAL POLICY WITH A PRUDENT APPROACH TO CAPITALALLOCATION
26
• Strong free cash flow allows Anixter to maintain a conservative leverage profile and ample liquidity throughoutthe business cycle
• Periods of acquisitions are immediately followed up by periods of debt reduction
$32 $22 $20 $26 $34 $32 $40 $27 $33$41 $42
$105
$35$41
$108
$59
$111 $151
$166
$180
$36 $55
$418 $823
$5
$150$272
$82 $152
$267 $133
$1
0%
20%
40%
60%
80%
100%
2008 2009 2010 2011 2012 2013 2014 2015 2016 2017 2018
CapEx Share Repurchases Total Dividends Acquisitions Debt Reduction Operating Cash Flow
Capital Allocation Priorities are Organic Growth, M&A andOpportunistic Return to Shareholders
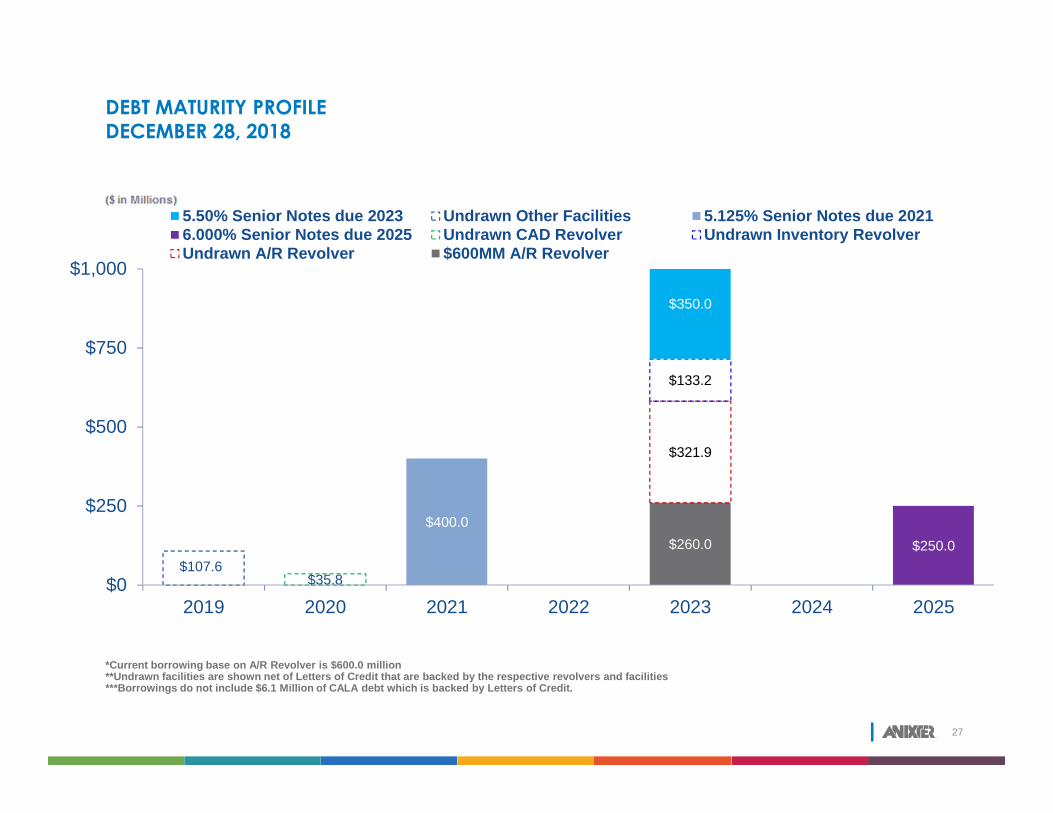
DEBT MATURITY PROFILEDECEMBER 28, 2018
27
$260.0
$321.9
$133.2
$35.8
$250.0$400.0
$107.6
$350.0
$0
$250
$500
$750
$1,000
2019 2020 2021 2022 2023 2024 2025
5.50% Senior Notes due 2023 Undrawn Other Facilities 5.125% Senior Notes due 20216.000% Senior Notes due 2025 Undrawn CAD Revolver Undrawn Inventory RevolverUndrawn A/R Revolver $600MM A/R Revolver
*Current borrowing base on A/R Revolver is $600.0 million**Undrawn facilities are shown net of Letters of Credit that are backed by the respective revolvers and facilities***Borrowings do not include $6.1 Million of CALA debt which is backed by Letters of Credit.
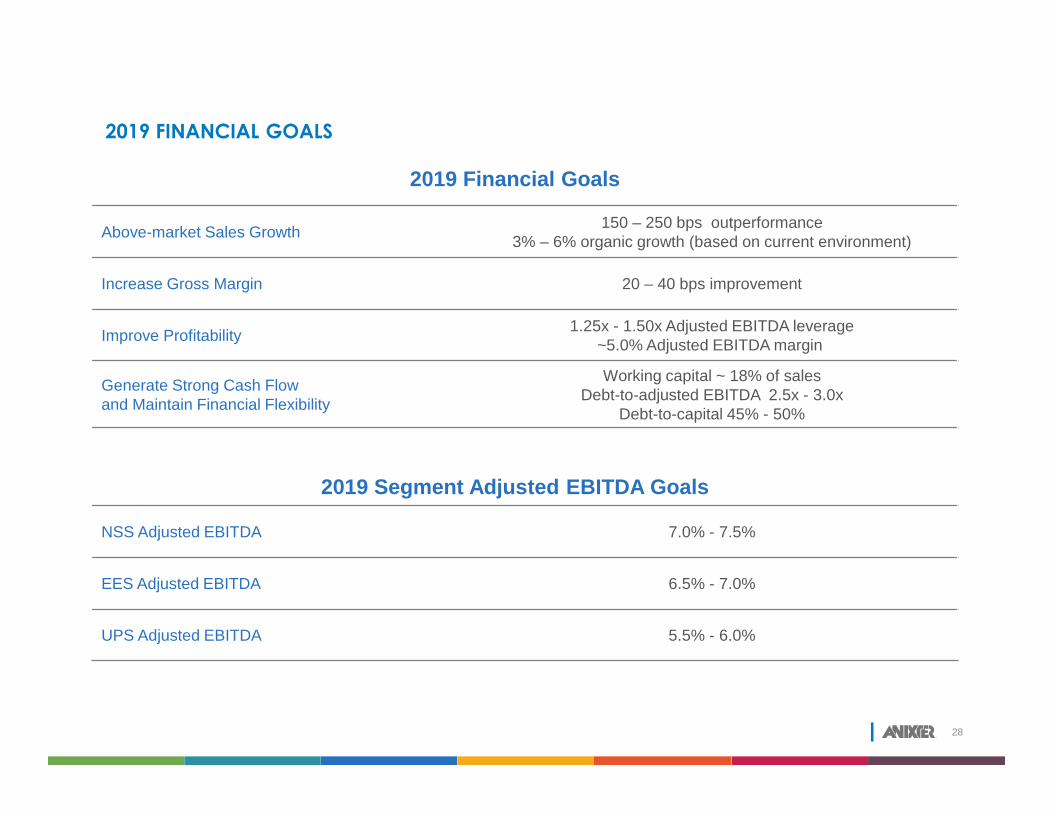
2019 FINANCIAL GOALS
28
2019 Financial Goals
Above-market Sales Growth 150 – 250 bps outperformance3% – 6% organic growth (based on current environment)
Increase Gross Margin 20 – 40 bps improvement
Improve Profitability 1.25x - 1.50x Adjusted EBITDA leverage~5.0% Adjusted EBITDA margin
Generate Strong Cash Flowand Maintain Financial Flexibility
Working capital ~ 18% of salesDebt-to-adjusted EBITDA 2.5x - 3.0x
Debt-to-capital 45% - 50%
2019 Segment Adjusted EBITDA Goals
NSS Adjusted EBITDA 7.0% - 7.5%
EES Adjusted EBITDA 6.5% - 7.0%
UPS Adjusted EBITDA 5.5% - 6.0%
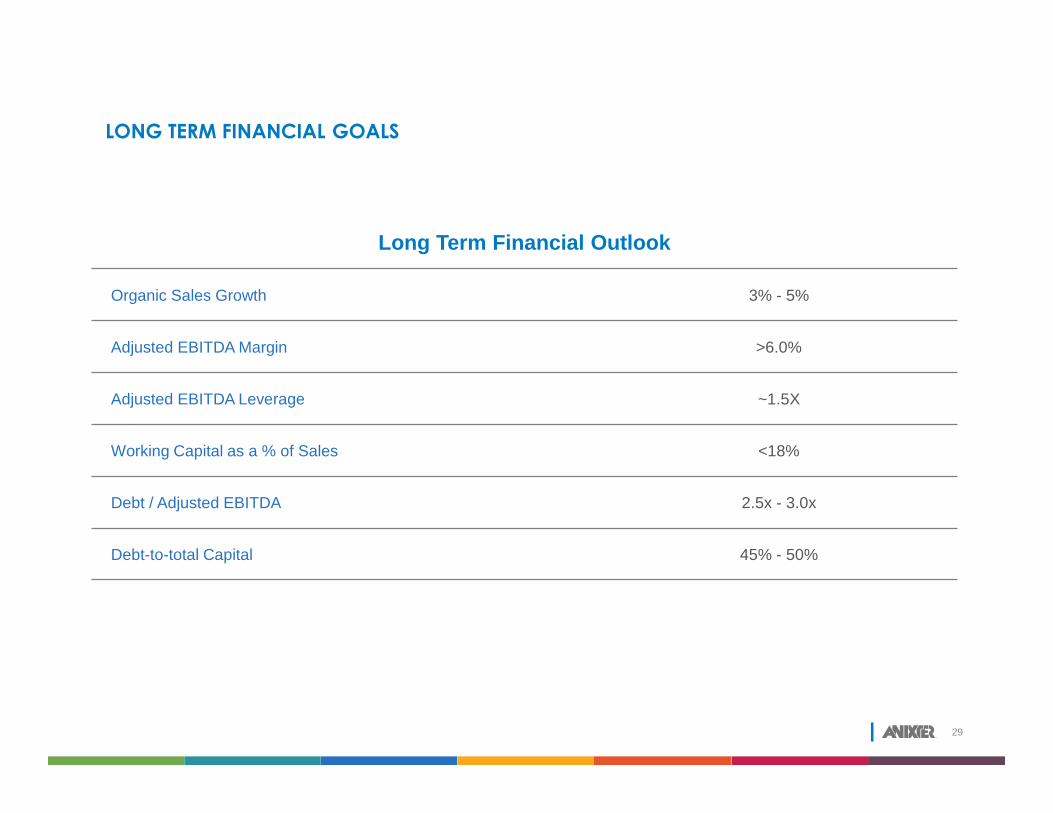
LONG TERM FINANCIAL GOALS
29
Long Term Financial Outlook
Organic Sales Growth 3% - 5%
Adjusted EBITDA Margin >6.0%
Adjusted EBITDA Leverage ~1.5X
Working Capital as a % of Sales <18%
Debt / Adjusted EBITDA 2.5x - 3.0x
Debt-to-total Capital 45% - 50%

INVEST IN ANIXTER
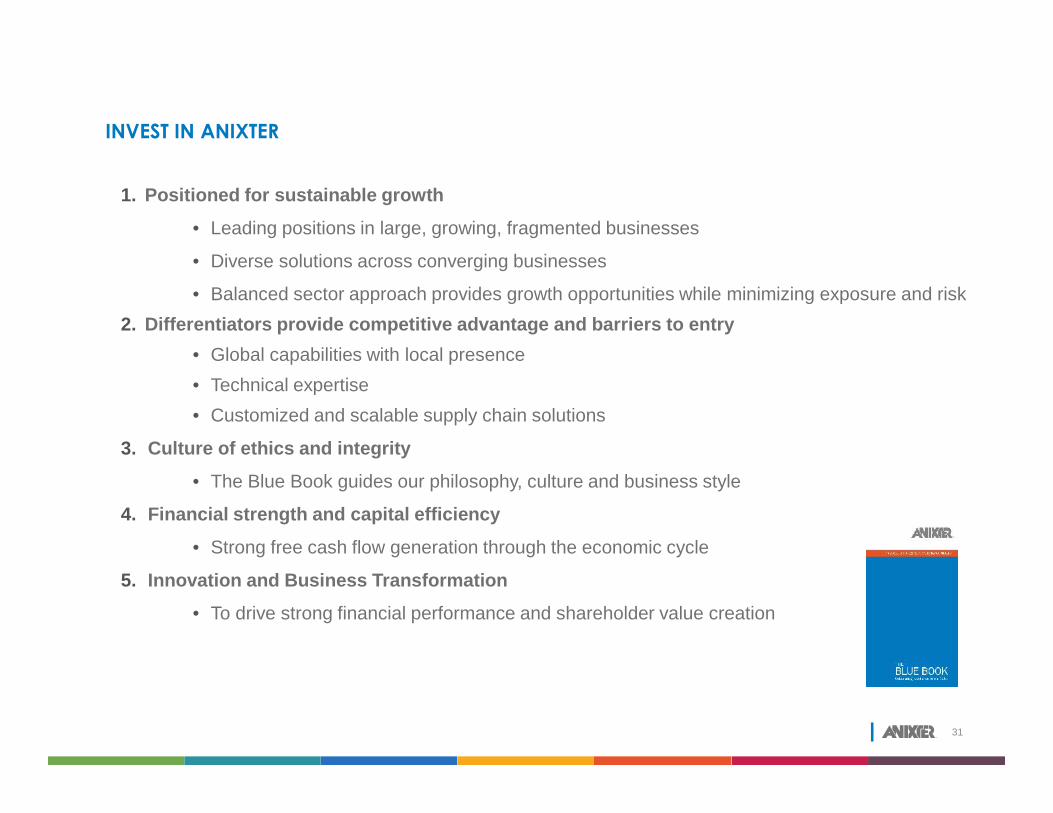
INVEST IN ANIXTER
31
1. Positioned for sustainable growth• Leading positions in large, growing, fragmented businesses
• Diverse solutions across converging businesses
• Balanced sector approach provides growth opportunities while minimizing exposure and risk2. Differentiators provide competitive advantage and barriers to entry
• Global capabilities with local presence• Technical expertise• Customized and scalable supply chain solutions
3. Culture of ethics and integrity• The Blue Book guides our philosophy, culture and business style
4. Financial strength and capital efficiency• Strong free cash flow generation through the economic cycle
5. Innovation and Business Transformation• To drive strong financial performance and shareholder value creation

THANK YOU