Embed Size (px)
Citation preview

JPET #95141
1
INHIBITION OF B16 MELANOMA METASTASES WITH THE RUTHENIUM
COMPLEX NAMI-A AND DOWN-REGULATION OF TUMOR CELL INVASION
Gava B., Zorzet S., Spessotto P, Cocchietto M., Sava G.
Department of Biomedical Science University of Trieste (GB, ZS, SG), Italy; Callerio
Foundation -Onlus, Institute of Biological Research (CM, SG), Trieste, Italy; Reference
Centre for Oncology (SP), Aviano, Italy
JPET Fast Forward. Published on December 20, 2005 as DOI:10.1124/jpet.105.095141
Copyright 2005 by the American Society for Pharmacology and Experimental Therapeutics.
This article has not been copyedited and formatted. The final version may differ from this version.JPET Fast Forward. Published on December 20, 2005 as DOI: 10.1124/jpet.105.095141
at ASPE
T Journals on A
pril 4, 2019jpet.aspetjournals.org
Dow
nloaded from

JPET #95141
2
Running title: INVASION AND METASTASIS INHIBITION OF B16 MELANOMA
Corresponding author: prof. G. Sava, Department of Biomedical Sciences, University of
Trieste, via L. Giorgieri 7, 34127 Trieste, Italy
Tel.: 0039040569933
Fax.: 0039040569934
e-mail: [email protected]
Number of text pages: 13
Number of Tables: 3
Number of Figures: 6
Number of References: 40
Number of words in the Abstract: 224
Number of words in the Introduction: 544
Number of words in the Discussion: 1307
List of non-standard abbreviations
ATCC: american tissue culture collection
BAEC: bovine aortic endothelial cell
Collagenase buffer: 50 mM Tris-HCl (pH 7.4), 200 mM NaCl and 5 mM CaCl2
D-MEM: dulbecco minimum essential medium-low glucose
EDTA: ethylenediamminetetraacetic acid
FITC: fluoresceinisothiocianate
HEPES: N-(2-hydroxyethyl)piperazine-1-ethanesulfonic acid
MMP: matrix metalloprotease
MEM: minimum essential medium with Hank’s salt
MTT: 3-(4,5-dimethylthiazol-2-yl)-2,5-diphenyltetrazolium bromide
NAMI-A: imidazolium trans-imidazoledimethylsulfoxidetetrachlororuthenate
PBS: phosphate-buffered saline
PBS Ca+2-Mg+2: phosphate-buffered saline with calcium and magnesium
SDS: sodiumdodecylsulphate
Tris base: tris-hydroxymethylaminomethane
TMAH: tetramethylammoniumhydroxyde
This article has not been copyedited and formatted. The final version may differ from this version.JPET Fast Forward. Published on December 20, 2005 as DOI: 10.1124/jpet.105.095141
at ASPE
T Journals on A
pril 4, 2019jpet.aspetjournals.org
Dow
nloaded from

JPET #95141
3
ABSTRACT
The antimetastatic ruthenium complex imidazolium trans-imidazoledimethylsulfoxide-
tetrachlorouthenate (NAMI-A) is tested in the B16 melanoma model in vitro and in vivo.
Treatment of B6D2F1 mice, carrying intra-footpad B16 melanoma, with 35 mg/kg/day
NAMI-A for 6 days reduces metastasis weight independently of whether NAMI-A is given
prior or after surgical removal of the primary tumor. Metastasis reduction is unrelated to
NAMI-A concentration, which is 10-fold lower than on primary site (1 mM vs 0.1 mM), and
is correlated to the reduction of plasma gelatinolitic activity and to the decrease of cells
expressing CD44, CD54 and integrin-β3 adhesion molecules. Metastatic cells also show the
reduction of the S phase cells with accumulation in the G0/G1 phase. In vitro, on the highly
metastatic B16F10 cell line, NAMI-A reduces cell Matrigel invasion and their ability to cross
a layer of endothelial cells after short exposure (1 hr) to 1-100 µM concentrations. In these
conditions, NAMI-A reduces the gelatinase activity of tumor cells and it also increases cell
adhesion poly-l-lysine and particularly to fibronectin, and this effect is associated to the
increase of F-actin condensation. This work shows the selective effectiveness of NAMI-A on
the metastatic melanoma and it suggests that metastasis inhibition is due to the negative
modulation of tumor cell invasion processes, a mechanism in which the reduction of the
gelatinolitic activity of tumor cells plays a crucial role.
This article has not been copyedited and formatted. The final version may differ from this version.JPET Fast Forward. Published on December 20, 2005 as DOI: 10.1124/jpet.105.095141
at ASPE
T Journals on A
pril 4, 2019jpet.aspetjournals.org
Dow
nloaded from

JPET #95141
4
INTRODUCTION
Melanoma is the most aggressive form of skin cancer. Despite recent advances, the results of
chemotherapy for patients with metastatic melanoma remain unsatisfactory because of the
relative drug resistance of metastatic cells (Drukala et al., 2003). The standard treatment for
patients with metastatic melanoma has not been defined, and different chemotherapeutic
agents have shown activity although Dacarbazine remains the reference agent. Also
combination chemotherapy and biochemotherapy have been studied but the response rate
never exceeds 15% to 20% (Sun and Schuchter, 2001).
Ruthenium complexes represent a new class of compounds endowed with anti-tumor activity
(Keppler et al., 1989; Clarke 1989; Alessio et al., 2004a,b). NAMI-A, imidazolium trans-
imidazoletetrachlororuthenate, is one of these complexes and it is characterised by a selective
action against lung metastasis of solid mouse tumors and human xenografts (Sava et al., 1998;
Bergamo et al., 1999; Sava et al., 2003). In vitro, NAMI-A inhibits tumor cell invasion of
Matrigel-coated membranes in transwell chambers (Zorzet et al., 2000; Sava et al., 2003) at
doses free of cytotoxic activity on murine (TS/A) and human (MCF-7, LoVo, KB) tumor cell
lines up to 0.1 mM (Bergamo et al, 1999; Zorzet et al., 2000; Sava et al., 2003). In vivo,
NAMI-A selectively reduces metastasis formation. This is independent of whether it is given
prior to surgery (early growing tumors) or after surgical ablation of primary tumor (already
established metastases) (Zorzet et al., 2000; Sava et al., 2003). The post-surgical treatment of
mice bearing MCa mammary carcinoma significantly improved the life-span of the treated
animals (Sava et al., 1999b).
The aim of this study was to investigate the in vitro and in vivo effects of NAMI-A treatment
on murine melanoma cell lines. Murine melanoma cell lines differ from the previous models
used, in that they are relatively resistant to many cancer therapies (Sun and Schuchter, 2001).
For the purpose of these experiments we used the two variants of mouse melanoma B16F10
and B16 cell lines, for in vitro and in vivo studies respectively. In particular, we used the
intra-footpad model which mimics a subcutaneous growth of the tumor and it allows removal
of the primary tumor by surgery, about ten to fifteen days after implantation.
Since the adhesion process is involved in most, if not all, the intermediate steps of the
metastatic cascade (Honn and Tang, 1992) and adhesion of cells to ECM components is a
prerequisite for cell movement to substrates leading to migration and invasion, then the
capability of NAMI-A to interfere with tumor cell invasive activity was studied in vitro, using
a transwell chamber assay. Furthermore, the effects of treatments on the expression of some
This article has not been copyedited and formatted. The final version may differ from this version.JPET Fast Forward. Published on December 20, 2005 as DOI: 10.1124/jpet.105.095141
at ASPE
T Journals on A
pril 4, 2019jpet.aspetjournals.org
Dow
nloaded from

JPET #95141
5
important adhesion molecules involved in the metastatic spread such as CD44 (Birch et al.,
1991), ICAM-1 (Johnson, 1991) and integrin-ß3 subunit (Seftor et al., 1992 ; Danen et al.,
1994) was also investigated. Finally, we analyzed the effects of NAMI-A treatment on the
gelatinases MMP-2 and MMP-9, enzymes whose expression in melanoma is associated with
the conversion from radial growth phase to vertical growth phase and with subsequent
metastasis formation (MacDougall et al., 1995). Since circulating metalloproteases could be
considered as a prognostic marker for tumor malignancy, we also investigated the effects of
treatments on the reduction of this protease activity in the serum of the treated tumor-bearing
animals.
METHODS
Compounds and treatments
All reagents were purchased by Sigma (Milano, Italy), except otherwise reported. NAMI-A
was synthesized according to already reported procedures (Mestroni et al., 1998). For in vitro
studies tumor cell line was incubated for 1hr with 1-100 µM NAMI-A in PBS Ca2+-Mg2+
saline solution and analyses were performed 24 or 48hrs the end of the treatment. In vivo
treatment with NAMI-A was performed before or after the surgical removal of primary tumor.
Pre-surgery treatment started when primary tumor had reached approximately 180 mg (range
75-405 mg). NAMI-A was dissolved in isotonic non pyrogenic physiological saline and was
given intra-peritoneum (i.p.) at the dose of 35 mg/Kg for 6 consecutive days. Surgical
removal of the primary tumor, proximal to the popliteal lymph node, was done 24 hrs after the
end of the treatment; mice were anesthetized with ZOLETIL® (70 mg/kg/200 µl, i.p.)
(Laboratories Virbac, Carros, France). Post-surgery treatment was done with the same dose
and treatment schedule, starting 24 hrs after surgical removal of the primary tumor.
Tumor cell lines
B16F10 and B16 murine melanoma cell line were used for in vitro and in vivo studies
respectively.
B16F10 cell line was obtained from ATCC (Cat. Num CRL-6475) and maintained by twice a
week passages in MEM (Euroclone, Wetherby, UK) supplemented with 10% fetal bovine
serum (Euroclone, Wetherby, UK), 1% of 10 U/ml penicillin and 100 µl /ml streptomycin, 2
mM L-glutamine, 100x non essential aminoacids, 1 mM sodium pyruvate (Euroclone,
Wetherby, UK) and 1 mM HEPES.
This article has not been copyedited and formatted. The final version may differ from this version.JPET Fast Forward. Published on December 20, 2005 as DOI: 10.1124/jpet.105.095141
at ASPE
T Journals on A
pril 4, 2019jpet.aspetjournals.org
Dow
nloaded from

JPET #95141
6
B16 melanoma cell line was obtained from the National Cancer Institute (Bethesda, MD,
USA) and maintained in vivo in C57BL/6 mice (Harlan, San Pietro al Natisone, Udine, Italy),
by biweekly intramuscular (i.m.) implantation into the calf of the left hind leg.
For experimental purpose B6D2F1 female mice (Harlan) were injected intra-footpad with
0.5x10⁶/50 µl tumor cells of a single cell suspension, prepared from mincing with scissors the
primary tumor mass obtained from donors implanted as previously described.
BAEC cell line was a kind gift from Dr Paola Spessotto (CRO, Aviano, Italy). BAEC cell line
was maintained by weekly passage in D-MEM (Euroclone, Wetherby, UK) supplemented
with 10% fetal bovine serum (Euroclone, Wetherby, UK), 1% of 10 U/ml penicillin and 100
µl /ml streptomycin and 2 mM L-glutamine (Euroclone, Wetherby, UK).
Chemoinvasion assay
The effect of NAMI-A on invasion activity of B16F10 tumor cells was assayed using a
transwell cell culture chamber (Corning Costar Italia, Milano, Italy). Briefly, polycarbonate
filters with 8 µm pore size were pre-coated with 5µl/50µl fibronectin on the reverse side and
dried at room temperature. 5µl/50µl Matrigel® (Becton Dickinson Labware, Bedford, MA,
USA) was applied to the upper surface of the filter and dried overnight at room temperature.
Cells, sown 24hrs after on multiwell plates, were treated with 1-100 µM NAMI-A in PBS
Ca2+-Mg2+ for 1hr and at the end of the treatment cells were harvested with 1mM EDTA in
PBS and washed with serum-free MEM. Cell viability was determined by trypan-blue
exclusion dye test and cells were re-suspended to a final concentration of 1x10⁶/ml in MEM
with 0.1% bovine serum albumin, 1% of 10 U/ml penicillin and 100 µl /ml streptomycin and
2 mM L-glutamine (Euroclone, Wetherby, UK).
100 µl of cell suspension were added to the upper compartment and allowed to migrate for
24hrs. The lower compartment was filled with conditioned medium from NIH-3T3 murine
fibroblast cell line, supplemented with 10% fetal bovine serum. Cells remaining on the upper
surface of the filter were removed by wiping them with a cotton swab. Cells on the lower
surface were fixed with ice-methanol and stained with May-Grünvald-Giemsa. Seven to ten
fields per filter were counted under a microscope at a magnification of 32x.
Trans-endothelial migration assay
The effect of NAMI-A on trans-endothelial migration of B16F10 tumor cells was assayed
using modified transwell cell culture chamber. Briefly, polycarbonate filters with 8 µm pore
size were pre-coated with 10µl/50µl Matrigel® on to the upper surface of the filter and dried
overnight at room temperature. 0.8x10⁵/100µl BAEC endothelial cells were sown on Matrigel
coated filters in supplemented with 10% fetal bovine serum, 1% of 10 U/ml penicillin and 100
This article has not been copyedited and formatted. The final version may differ from this version.JPET Fast Forward. Published on December 20, 2005 as DOI: 10.1124/jpet.105.095141
at ASPE
T Journals on A
pril 4, 2019jpet.aspetjournals.org
Dow
nloaded from

JPET #95141
7
µl /ml streptomycin and 2 mM L-glutamine. The lower compartments of the chambers were
filled with complete medium. B16F10 tumor cells, sown 24hrs after on multiwell plate, were
treated with 1-100 µM NAMI-A in PBS Ca2+-Mg2+ for 1hr and at the end of the treatment
cells were harvested with 1mM EDTA in PBS and washed with serum-free MEM. B16F10
cells were labelled with the 5 mM FASTDil probe (Molecular Probes, Eugene, OR, USA ) for
20 min at 37° C and then washed twice with PBS. Tumor cells were sown as previously
reported and they were allowed to migrate for 48hrs. Cells remaining on the upper surface of
the filter were removed and cells on the lower surface were analyzed by fluorimetric
determination on FluoroCount-Packard® reader (Canberra Packard, USA).
Primary tumor growth and lung metastasis evaluation
Primary tumor was determined by caliper measurement by determining two orthogonal axes
and tumor weight was determined as:
Tumor volume (mm3) = a2xbx0.52 (Eq. 1)
where a and b are the shortest and the longest axis respectively.
Lung metastasis evaluation was performed at sacrifice. The number and size of metastasis
were determined by means of a dissection microscope. Metastasis weight was calculated from
their sizes applying the above formula (Eq. 1) and the sum of each individual weight gave the
total weight of the metastatic tumor per animal.
The effects of the treatment were represented by:
T/C(%) = (mean value of treated group/mean value of control group)x100
Analysis of adhesion molecules expression on in vitro treated cells
Flow cytometer analysis for CD44 and integrin-ß3 receptors expression was performed 24hrs
and 48hrs after the end of the treatment. Cells were harvested with 1mM EDTA in PBS,
counted using trypan-blue exclusion dye test and 0.5x10⁶ viable cells were incubated for 1hr
at 4° C with rat monoclonal antibody against murine CD44-FITC conjugated (Southern
Biotechnology Associates Inc., AL., USA) and hamster monoclonal antibody against integrin-
ß3-phycoerytrin conjugated (Santa Cruz Biotechnology, CA., USA). Isotype controls were
used as unspecific. At the end of incubation cells were washed twice with PBS containing
0.5% bovine serum albumin and 0.1% NaN3 and re-suspended in 1% para-formaldehyde in
PBS.
Analysis of adhesion molecule expression and of cell cycle distribution on in vivo treated
tumor cells from primary tumor and from lung metastases
This article has not been copyedited and formatted. The final version may differ from this version.JPET Fast Forward. Published on December 20, 2005 as DOI: 10.1124/jpet.105.095141
at ASPE
T Journals on A
pril 4, 2019jpet.aspetjournals.org
Dow
nloaded from

JPET #95141
8
Flow cytometer analysis of cell cycle phase distribution and CD44, CD54 and integrin-ß3
receptors expression were performed on primary tumor cells at surgery and on metastatic cells
isolated from lungs at sacrifice. Cells from the primary tumor mass or from the metastatic
nodules were mechanically disaggregated and filtered through a double layer of sterile gauze.
For the receptor analyses, cells were incubated for 1hr at 4° C, with rat monoclonal antibody
against murine CD44-FITC conjugate (Southern Biotechnology Associates Inc., AL., USA),
rat monoclonal antibody against murine CD54-FITC conjugate (Southern Biotechnology
Associates Inc., AL., USA) and hamster monoclonal antibody against integrin-ß3-
phycoerytrin conjugate (Santa Cruz Biotechnology, CA., USA). Isotype controls were
analyzed in parallel. Then cells were fixed with 1% paraformaldehyde for 15 min at 4° C and
washed with cold PBS. Cells were permeabilized with 100% ice cold methanol for 15 min,
washed and re-suspended in 0.1% saponin in PBS containing 2% fetal bovine serum for 30
min at room temperature. After washing, cells were re-suspended in 1 ml PBS containing
0.5% bovine serum albumin and 0.1% NaN3 and analyzed on flow cytometer.
For the cell cycle analysis, 0.5x10⁶ cells of a single cell suspension of B16 melanoma cells,
obtained from the primary tumor mass or from lung metastases and prepared as described
above, were fixed in 70% ethanol at 4°C for at least 1 hr. Ethanol was removed by
centrifugation and cells were washed twice with PBS and cells were re-suspended in PBS
containing 1 mg/mL ribonuclease type A, kept at 37°C for 30 min, and further stained with
propidium iodide (40µg/mL) for at least 30 min at room temperature in dark. Red
fluorescence (excitation at 488 and emission at 610 nm) was analyzed, using peak
fluorescence gate to discriminate aggregates.
Flow cytometry analysis
Flow cytometry analyses were done with a CYTOMIX FC500 flow cytometer (Beckman-
Coulter Inc., USA). Each analysis consisted of 10,000 events. Cell cycle distribution was
determined by analysis of data with Multicycle software (Phoenix Flow Systems, San Diego,
CA, USA). Antibodies analysis was performed by WinMDI 2.8 software (Dr. J. Trotter,
Scripps research Institute, La Jolla, CA, USA).
Adhesion assay (resistance to trypsin treatment) on B16F10 cells
Cell adhesion assay was performed on different substrates on 96-well plates (Falcon, Franklin
Lakes, NJ, USA), using fibronectin from human plasma and poly-L-lysine 70-150kDa. Wells
are coated with 50µl fibronectin (the original product was diluted to 20µg/ml with sterile
apyrogenic water for injection, Laboratori Diaco Spa, Trieste, Italy) or with 100µl of a
10µg/ml solution poly-L-lysine. Plates are kept in a humidified cell-culture chamber at 37°C
This article has not been copyedited and formatted. The final version may differ from this version.JPET Fast Forward. Published on December 20, 2005 as DOI: 10.1124/jpet.105.095141
at ASPE
T Journals on A
pril 4, 2019jpet.aspetjournals.org
Dow
nloaded from

JPET #95141
9
for 4 hours and each plate is washed twice with sterile PBS before cell sowing. Briefly, 1x10⁴
B16F10 cells in 200µL of complete medium are sown and incubated at 37°C. After 2 days,
the medium was removed, cells are washed with PBS and added with complete medium, with
or without 100µM NAMI-A. After 1 hr exposure, the supernatant is discarded and plates are
washed twice with PBS; then 25µL of a (0.05% w/v) trypsin solution is added to each well
and plates are kept at 37°C for 30 min. Control wells are run without the trypsin solution.
After incubation, trypsin is removed, wells are washed with PBS, and non-detached cells are
fixed with 200µL of a solution (10% w/v) of cold trichloracetic acid for 1 hr at 4°C. After
fixation, trichloroacetic acid was removed and wells washed twice with distilled water. Plates
are then left to dry at room temperature for few minutes before determining the number of
fixed cells by the sulphorhodamine B test.
Sulphorhodamine B assay
Adherent cells in each well are stained with a colorimetric assay based on the quantification
with SRB of the cell protein component (Skehan et al., 1990). Briefly, 50µl of a
sulphorhodamine solution (0.4%, w/v, in 1% acetic acid) are added to each well, treated as
described above, and cells are allowed to stain for 30 min at room temperature. Unbound
sulphorhodamine is removed by washing twice with 1% (v/v) acetic acid. Plates are air-dried,
the bound stain is dissolved with unbuffered 10 mM, pH 10.5, Tris base and the optical
density is read at 570nm with an automatic computerized spectrophotometer (SpectraCount;
Packard, USA).
The modification of cell adhesion is expressed as the percent of adhesion increment in the
samples treated with NAMI-A as compared with control samples, and with similar samples
incubated without trypsin solution. Each experiment was performed with fourteen replicates
and repeated twice.
Confocal microscopy visualization of actin filaments
The great affinity of phalloidin, a poisonous alkaloid obtained from Amanita phalloides, for
actin is useful for visualizing actin filaments (F-actin) inside cells (Herzog et al., 2004).
About 104 B16F10 cells were sown, in 400µl of complete medium, on an 8-well chamber
slide (FALCON, Culture Slide, Becton Dickinsons, Franklin Lakes, NJ, USA) and incubated
for 72 hrs at 37°C with 5% CO2. Cells were then treated with PBS containing 100µM NAMI-
A for 1 hr at 37°C. After this challenge cells were washed twice with PBS Ca2+-Mg2+ and
fixed for 15 min at room temperature with 200µL of a 4% (w/v) solution of paraformaldehyde
prepared in PBS. After two washings with PBS Ca2+-Mg2+, cells were permeabilised for 2
min at room temperature with a solution of PBS with 0.1%(w/v) bovine serum albumin
This article has not been copyedited and formatted. The final version may differ from this version.JPET Fast Forward. Published on December 20, 2005 as DOI: 10.1124/jpet.105.095141
at ASPE
T Journals on A
pril 4, 2019jpet.aspetjournals.org
Dow
nloaded from

JPET #95141
10
containing 0.1% (v/v) Triton-X-100 (all from Sigma) and 4% (v/v) of fetal bovine serum
(HyClone, Logan, Utah, USA). Then, after two washings with PBS with 0.1% bovine serum
albumin, cells were incubated for 1 hr in the dark at room temperature with 100µL of 4U/ml
(in PBS) phalloidin (Alexa Fluor 488 phalloidin, Molecular Probes, Eugene, OR, USA).
Finally chambers were removed from the slides, covered with mowiol (a substance that
shelters the fluorescence) and with a cover slide. B16F10 cells were then observed with a
microscope (DiaPHOT-200, Nikon), supported with a confocal system (MCR-1024, Bio-Rad
Laboratories, Hercules, CA, USA). The “pseudo colorized” image elaboration was done with
the LaserSharp Processing associated software (Bio-Rad Laboratories).
Zimography assay
In in vitro studies, serum-free supernatants of B16F10 cells incubated for 1hr with 1-100 µM
NAMI-A were collected 24hrs after the end of the treatment and were concentrated 20x using
Centricon Y-10 tubes (Millipore, Bedford, MA, USA). Equal volume of concentrated medium
was used for the detection of gelatinase activity.
In in vivo studies, gelatinolitic activity was evaluated on plasma fraction obtained from blood
taken by cardiac puncture from anesthetized animals at sacrifice. Mice were anesthetized with
sub-lethal doses of ethylurethan (1.5 g/Kg, i.p.) (Carlo Erba, Milano, Italy). To avoid blood
coagulation, 50µl of 0.1 M sodium citrate was used. Plasma was obtained by centrifugation at
10000xg for 20 min at room temperature and then it was aliquoted and frozen at -80° C until
processing. Euglobulin fraction was prepared by mixing 0.1 ml plasma with 0.9 ml de-ionized
cold water, acidified to pH 5.5 with 40µl % (v/v) acetic acid. This mixture was incubated for
1 hr at 0° C and centrifuged for 10 min at 5000 rpm. Euglobulin was then dissolved in 0.1 ml
PBS, pH 7.4 (modified from Ranuncolo et al., 2000). 21µl of euglobulin fraction were mixed
with electrophoresis sample buffer.
All samples were electrophoresed in 10% polyacrylamide-separating gel, in presence of 1%
SDS and containing 1 mg/ml gelatin, without reducing or heating. Then gels were washed
twice for 30 min with 2.5% Triton X-100 to remove SDS and finally washed three times for 5
min with distilled water. Gels were incubated overnight with collagenase buffer. They were
stained for 4hrs in 30% methanol/10% glacial acetic acid containing 0.1% Coomassie
Brilliant blue R-250 and de-stained with the same solution without dye. Gelatinolitic activity
was detected as clear bands on the blue background. Molecular weight standard (6,500-
205,000) was run on each gel.
Atomic absorption spectroscopy measurement
This article has not been copyedited and formatted. The final version may differ from this version.JPET Fast Forward. Published on December 20, 2005 as DOI: 10.1124/jpet.105.095141
at ASPE
T Journals on A
pril 4, 2019jpet.aspetjournals.org
Dow
nloaded from

JPET #95141
11
Ruthenium uptake from primary tumor cell and lungs were analyzed by atomic absorption
spectroscopy. Briefly, 1.0x10⁶ cell from primary tumor cell suspension obtained at surgery or
fragment of lungs obtained at sacrifice, were dried overnight at 80° C and then at 105° C in
Nalgene cryovials. Cell decomposition was facilitated by the addition of TMAH (25% in
water) (Aldrich Chimica, Milano, Italy) and Milli-Q water at a ratio of 1:1 directly in each
vial at room temperature and under shaking (modified from Tamura and Arai, 1992). Final
volumes were adjusted to 1 ml with Milli-Q water. Ruthenium concentration was measured
using a graphite furnace atomic absorption spectrometer, model SpectrAA-220Z, supplied
with GTA 110Z power and a specific ruthenium emission lamp (hollow cathode lamp P/N 56-
101447-00) (Varian, Mulgrave, VIC, Australia). The lower and higher limits of quantification
were set at the levels corresponding to the lower (20 ng of ruthenium per milliliter) and higher
(100 ng of ruthenium per milliliter) standard concentrations, respectively. The limit of
detection 10 ng of ruthenium per milliliter was estimated according to the EURACHEM
guide (www.eurachem.ul.pt/guides/valid.pdf, 1998). The quantification of ruthenium was
carried out in 10µl samples at 349.9 nm with an atomizing temperature at 2500° C, using
argon as the carrier gas at a flow rate of 3.0 l/min. Before each daily analysis session, a five-
point calibration curve was obtained using ruthenium custom-grade standard, 998 µg/ml
(Inorganic Ventures Inc., Lakewood, NJ, USA).
Animal studies
Animal studies were carried out according to the guidelines in force in Italy (DDL 116 of
21/2/1992 and subsequent addenda) and in compliance with the Guide for the Care and Use of
Laboratory Animals, DHHS Publ. No (NIH) 86-23 Bethesda, Md: NIH, 1985.
Statistical analysis
Experimental data were subjected to computer-assisted statistical analysis using analysis of
variance and the Student-Newman-Keuls to make comparisons within and between groups to
compare the treated groups versus the untreated controls. Differences of p<0.05 were
considered to be significantly different from controls.
RESULTS
In vitro results
NAMI-A was virtually inactive on B16-F10 melanoma tumor cell viability up to 0.1 mM
concentration and 96 hrs cell exposure, as evaluated by the trypan-blue exclusion test (data
not shown). In the same experimental conditions, NAMI-A statistically reduced B16F10
This article has not been copyedited and formatted. The final version may differ from this version.JPET Fast Forward. Published on December 20, 2005 as DOI: 10.1124/jpet.105.095141
at ASPE
T Journals on A
pril 4, 2019jpet.aspetjournals.org
Dow
nloaded from

JPET #95141
12
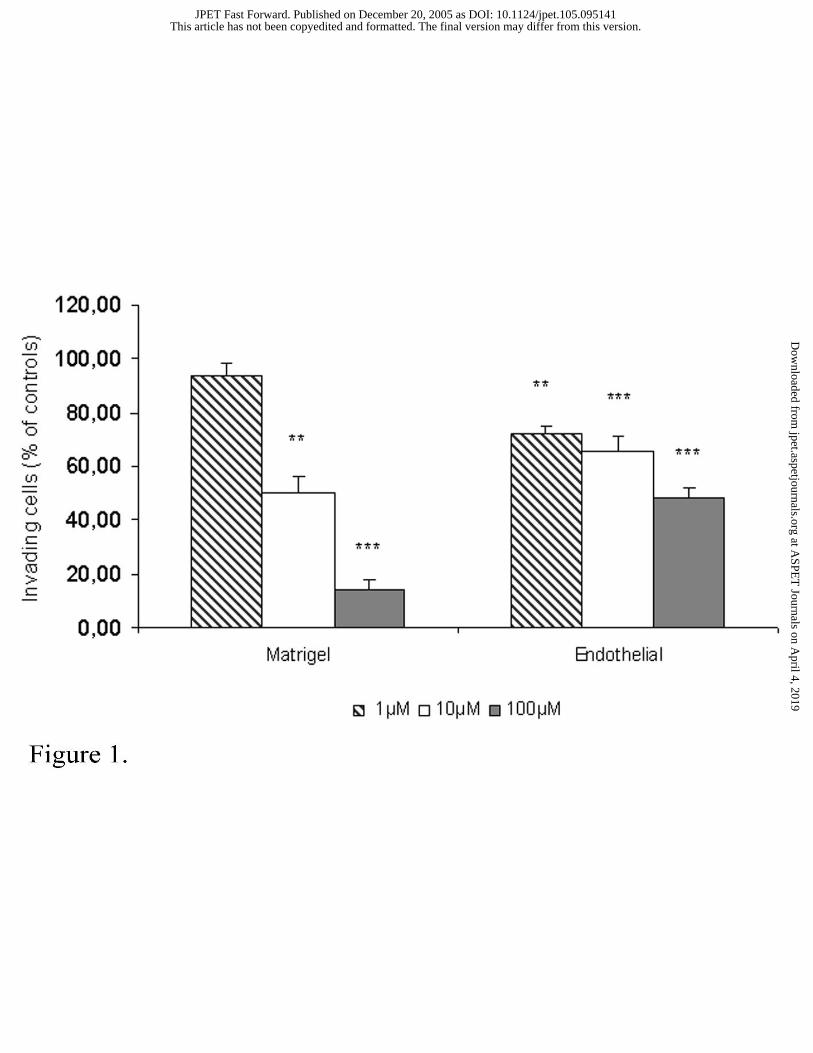
tumor cell invasion, as detected with a transwell chamber in a chemo-invasion assay (Figure
1, bars on the left). 24 hrs after cell sowing, 1 µM NAMI-A inhibited tumor cell invasion by
50.1±5.8% (p<0.001 vs controls) while 100 µM NAMI-A reduced invasion up to 85.8±3.1%
(p<0.001 vs controls). Similarly, NAMI-A inhibited tumor cells invasion also when the
treated cells were sown on a layer of endothelial cells (Figure 1, bars on the right), although in
this case the reduction of invasion is less pronounced being of about 50% at the maximum
tested dose. Cell morphology, as they appeared after invasion on the lower surface of the
filter, showed flatted and rounded cells, with a reduction of pseudopodia formation, as
compared to untreated controls. In particular, 100µM NAMI-A treated cells looked well-
rounded and free of pseudopodia formations (Figure 2).
Similarly, using a modified transwell chamber assay, adapted to study trans-endothelial
migration 48 hrs after cells sowing, NAMI-A reduced B16F10 migration throughout the
endothelial layer at any dose tested. The higher activity was observed at 100 µM: at this dose
tumor cells migration was inhibited by 48.6±3.5% (p<0.001 vs controls) (Figure 1, bars on the
right). Invasion inhibition is associated to a dose dependent reduction in gelatinase activity of
the treated cells (Figure 3, left). MMP-2 activity, measured in the supernatant of the treated
cells, significantly decreased at 100 µM NAMI-A, whereas MMP-9 activity, which was
basically lower than MMP-2, was not modified by any treatment.
In vitro, invasion inhibition was not correlated to any significant modification of the
expression of CD44 or integrin-ß3 subunit, as evaluated by flow cytometry analysis 24 or 48
hrs after the end of 1hr treatment with 100 µM NAMI-A (Table 1). However, this treatment
induced a significant increase of the adhesion strength of the cells to the growth substrate
versus untreated controls. This effect, determined as the cell resistance to detachment from the
substrates after exposure to diluted trypsin solution, is significantly higher when cells were
grown on fibronectin (+162±19 % versus controls) than on poly-l-lysine (+68±10 % versus
controls) (arbitrary values expressing the percentage of cells remaining on the substrate after
treatment with a 0.05% trypsin solution for 30 min). Correspondingly, these cells showed a
marked rearrangement of F-actin filaments, as revealed by falloidin labelling and confocal
analysis and F-actin appeared more condensed in the cells treated with NAMI-A as compared
to untreated controls (Figure 4).
In vivo results
In vivo NAMI-A treatment was devoid of significant effects on primary tumor growth at the
dose and treatment schedule used and at all of the times analyzed (unreported results).
Interestingly, NAMI-A significantly reduced metastasis weight either when given before
This article has not been copyedited and formatted. The final version may differ from this version.JPET Fast Forward. Published on December 20, 2005 as DOI: 10.1124/jpet.105.095141
at ASPE
T Journals on A
pril 4, 2019jpet.aspetjournals.org
Dow
nloaded from

JPET #95141
13
surgical removal of the primary tumor (early phases of metastasis formation) or after surgery
(34.5±7.3% and 35.0±7.4%, respectively for pre- and post-surgical treatments; p<0.05 vs
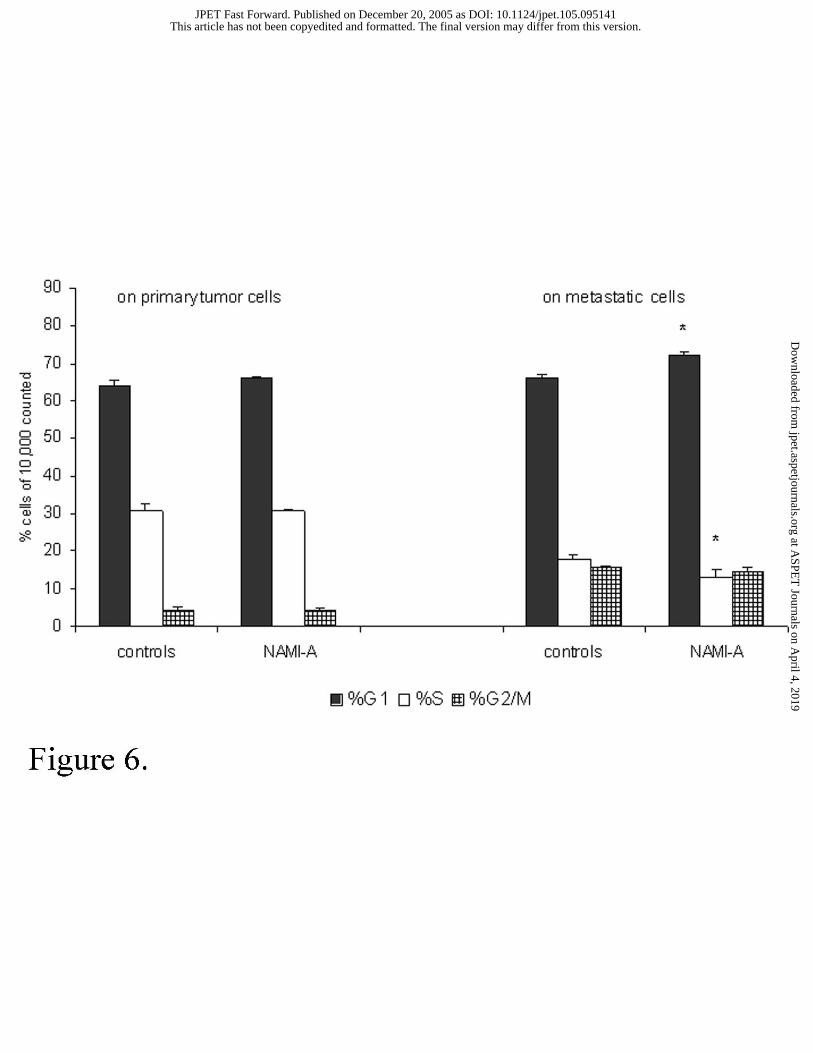
controls); no similar effect was observed on metastasis number (Figure 5). Considering the
distribution of tumor cells among cell cycle phases, NAMI-A was free of effects at primary
tumor level, while it significantly increased the percentage of cells in G1 phase and it
decreased the percentage of those in S phase in lung metastases cells (p<0.05 vs controls)
(Figure 6). The study of the expression of CD44, CD54 and integrin-ß3 on single cell
suspensions was performed on primary tumor (prepared 24 hr after last dosing) and on lung
metastases (harvested at sacrifice for metastasis evaluation). We showed no modification of
the density of CD44 and CD54 receptors per cell or of the percentage of positive cells on
primary tumor cells. Conversely, NAMI-A significantly reduced the density of integrin-ß3
receptor per cell unit (p<0.05 vs controls). However, the expression of these adhesion
molecules was significantly affected by NAMI-A on the metastatic cells with a statistically
significant decrease of the percentage of positive cells (Table 2). It must also be stressed that
the percentage of CD44 and integrin-ß3 positive cells in the treated samples was lower than
that found in vitro on cultured cells. The difference was greater for primary tumor cells than
for cells harvested from lung metastases.
In the treated animals, NAMI-A markedly reduced the level of circulating gelatinases (Figure
3, right). In particular, the post-surgical treatment reduced both MMP-9 pro-form (92 KDa)
and its active form (82 KDa) to a great extent; MMP-2 pro-form (72 KDa) and its active form
(62 KDa) were similarly reduced, but the reduction was less pronounced.
The concentration of ruthenium in the primary tumor, measured in the treated mice 24 hrs
after last dosing, was relatively high, being around 1 mM [in general greater than that found
in mice carrying i.m. MCa mammary carcinoma or Lewis lung carcinoma and dosed i.p. with
the same schedule used in this study (0.74±0.38, 0.74±0.20 x 10⁻⁴ respectively, Cocchietto et
al., 2003)] (Table 3). Ruthenium concentration evaluated at sacrifice, in the lungs of the same
animals, was still relatively high and, supposing it could represent NAMI-A in its active form,
it was of the same order of magnitude of that used for the in vitro studies.
DISCUSSION
NAMI-A is the first anticancer drug based on ruthenium to enter clinical trials, having
recently completed a phase 1 study at the Netherlands Cancer Institute. It showed a good
tolerability, following a cycle of slow daily i.v. infusion for 5 days with a three-week interval
between cycles. A large proportion of the treated patients received more than one cycle and
This article has not been copyedited and formatted. The final version may differ from this version.JPET Fast Forward. Published on December 20, 2005 as DOI: 10.1124/jpet.105.095141
at ASPE
T Journals on A
pril 4, 2019jpet.aspetjournals.org
Dow
nloaded from

JPET #95141
14
up to 8 cycles (Rademaker-Lakhai et al., 2004). In pre-clinical studies, NAMI-A showed
pronounced antimetastatic effects on animal tumors such as MCa mammary carcinoma (Sava
et al., 1998; Sava et al., 1999a; Sava et al., 1999b) and Lewis lung carcinoma (Zorzet et al.,
2000; Cocchietto et al., 2003) or on human xenograft models such as H460M2 lung
carcinoma (Sava et al., 2003) after i.p. treatments for 6 consecutive days. This was
independent of whether dosing occurred at early or advanced stages of tumor growth.
The present study shows the effectiveness of NAMI-A on another tumor known as the B16
murine melanoma and it suggests that metastasis inhibition is due to the negative modulation
of tumor cell invasion processes. The modulation of invasion processes induced by NAMI-A
is documented by the reduction of gelatinase activity, by the inhibition of cell crossing of
Matrigel and of endothelial barriers and by the marked changes on cell shape and F-actin
dependent cytoskeleton organization. In previous studies using HeLa tumor cells, NAMI-A
induced the rearrangement of cytoskeleton, interfering with the F-actin
polymerization/depolymerization process. This induced the formation of globular and fibrous
cordons, leading to the increase of the adhesive strength (Sava et al., 2004). Previous studies
have also described how NAMI-A increases the adhesion strength to the substrate on KB
tumor cells and how the ignition of this effect probably depends on integrin activation
(Frausin et al., 2005). The integrity of the cytoskeleton structure is necessary for the control of
cell motility, since the alteration of its architecture modifies cell morphology and can induce
the rearrangements of adhesion molecules, with modification of cell motility. Ballestrem and
colleagues (Ballestrem et al., 2000) showed the involvement of F-actin polymerization and
microtubule assembly in the motility and migration of B16 melanoma cell line. The study
underlined the role of microtubules in the regulation of cellular translocation, migration and
the role of actin fibers in controlling protrusive lamella formation. Metalloprotease activation
is also mediated by an intact cytoskeleton. Compounds that alter cytoskeleton structure may
interfere with this process (Tomasek et al., 1997). In addition the reduction of MMPs release
leads to the reduction of the tumor cell capability to degrade the extracellular matrix and to
invade (Stearns and Wang, 1992; Westerlund et al., 1997).
All these events find their reinforcement in the modulation of adhesion molecules such as
CD44 and integrin-ß3. The expression of these receptors is particularly modified in lung
metastases, the preferential target for the anti-tumor effects of NAMI-A.
In vivo metastasis inhibition by NAMI-A is not a new concept, having already been described
in details in previous studies (Sava et al., 1998; Bergamo et al., 1999; Sava et al., 2003).
This article has not been copyedited and formatted. The final version may differ from this version.JPET Fast Forward. Published on December 20, 2005 as DOI: 10.1124/jpet.105.095141
at ASPE
T Journals on A
pril 4, 2019jpet.aspetjournals.org
Dow
nloaded from

JPET #95141
15
Similarly, the in vitro effects of this ruthenium-based compound on gelatinases, invasion and
F-actin organization have already been described (Sava et al., 2004). However, this is the first
time the effects of NAMI-A are described, in vitro and in vivo, on the same tumor cell line.
According to these studies results it is possible to attribute the reduction of metastasis growth
to a specific mechanism of modification of the tumor cell behavior.
NAMI-A reduces metastasis growth of B16 melanoma. This reduction has a greater effect on
metastasis weight than on metastasis number, correlating with what has been observed for
other carcinomas (MCa mammary carcinoma, Lewis lung Carcinoma, H460M2 lung
carcinoma). Thus the effects of NAMI-A should not simply be attributed to the prevention of
metastasis formation, but they imply a selective interference with the metastatic proliferation.
Comparing the effects of NAMI-A treatment on the distribution of cells among cell cycle
phases we found that it significantly increased the percentage of metastatic cells in G1 phase
and decreased the percentage of metastatic cells in S phase. This induced a less proliferative
phenotype. Similar effects were not observed on tumor cells at the primary site. This suggests
that also in B16 melanoma, NAMI-A seems to be selectively effective on metastatic cells
rather than on primary tumor cells. This result is further stressed by a statistically significant
reduction of in vivo expression of CD44, CD54 and ß3 integrin molecules on metastasis rather
than on primary tumor.
The integrin-ß3 receptor has a number of important roles in the angiogenesis process, in
binding active MMP-2 (Brooks et al., 1996; Deryugina et al., 1997) and also in trans-
endothelial migration (Voura et al., 2001). An increase in integrin-ß3 expression on melanoma
cells correlates with an increase in in vivo proliferation (Trikha et al., 2002; Li et al., 2001)
and there is an association with the transition from non invasive radial growth phase to
metastasizing vertical growth phase (Albelda et al., 1990). The reduced expression of this
receptor in our conditions and the supposed role of integrin-ß3 in the activation of the
adhesion strength observed on KB cells (Frausin et al., 2005), stresses the possibility that the
selective activity of NAMI-A on metastatic cells might depend, at least in part, on the
interaction with integrin receptors leading to the inhibition of some important steps involved
in the metastatic process. In addition, NAMI-A treatment also altered the expression of
adhesion molecules on metastasis cells.
Ruthenium concentration (and therefore the in vivo available forms of NAMI-A) in the
primary tumor mass of B16 melanoma is about two orders of magnitude higher than that
found in other tumors (1.64±0.23 mM vs 0.08±0.01 mM) (Cocchietto et al., 2003) and this
This article has not been copyedited and formatted. The final version may differ from this version.JPET Fast Forward. Published on December 20, 2005 as DOI: 10.1124/jpet.105.095141
at ASPE
T Journals on A
pril 4, 2019jpet.aspetjournals.org
Dow
nloaded from

JPET #95141
16
fact could be only in part ascribed to the particular site of implantation of this tumor (i.e. s.c.
into the foot pad instead of i.m. into the calf of the hind leg). It is known that, in vivo, after
repeated i.p. NAMI-A injections, ruthenium accumulates in the skin more than in several
other organs/tissues (Callerio Foundation, Data on File). This however, is not sufficient to
explain the significantly higher amount of ruthenium in the primary mass of B16 melanoma
and we must stress that most probably this effect might depend on the characteristics of
melanoma cells. Nevertheless, the relatively high ruthenium concentration in the primary
tumor does not account for significant effects of NAMI-A on primary tumor growth which is
slightly reduced by about 20% as compared to the untreated controls. It must be stressed that
B16F10 melanoma cells show limited sensitivity to NAMI-A and, after cell exposure to 1
mM NAMI-A (a concentration closed to that found in the primary tumor mass), only a 40%
reduction of cell viability (determined in vitro with the MTT test; data not reported) was
found. One important consequence is that it is evident how, with a drug such as NAMI-A
which has repeatedly demonstrated to be selectively effective on metastatic cells rather than
on any kind of tumor cells (Bacac et al., 2004; Sava et al., 2003), in vitro cytotoxicity does
not predict in vivo tumor reduction.
In addition the effects on gelatinases appear to be even more complex. In this study NAMI-A
was shown to inhibit the active form of gelatinases released in the conditioned medium of in
vitro treated cells and it also decreased plasma gelatinase activity after in vivo treatment. This
latter effect is in agreement with the proposed prognostic and diagnostic utility for MMP-2
and MMP-9 levels in plasma serum (Garbisa et al., 1992; Zucker et al., 1999; Ranuncolo et
al., 2002) and might be correlated with the significant effect on lung metastasis reduction in
the treated mice. Further studies may be necessary to confirm this. In the future gelatinase
plasma levels may be useful for forecasting tumor response to therapy with this class of
compounds.
Acknowledgements: work done with contributions from MIUR (PRIN 2004-2005), and from
Fondazione CRTrieste to MADE project and to LINFA laboratory.
This article has not been copyedited and formatted. The final version may differ from this version.JPET Fast Forward. Published on December 20, 2005 as DOI: 10.1124/jpet.105.095141
at ASPE
T Journals on A
pril 4, 2019jpet.aspetjournals.org
Dow
nloaded from

JPET #95141
17
REFERENCES
Albelda SM, Mette SA, Elder DE, Stewart RM, Damjanovich L, Herlyn M and Buck CA
(1990) Integrin distribution in malignant melanoma: association of the ß3 subunit with
tumor progression. Cancer Res 50:6757-6764.
Alessio E, Mestroni G, Bergamo A and Sava G (2004a) Ruthenium anticancer drugs. Metal
Ions Biol Syst 42:323-351.
Alessio E, Mestroni G, Bergamo A and Sava G (2004b). Ruthenium antimetastatic agents.
Curr Top Med Chem 4:1525-1535.
Bacac M, Vadori M, Sava G and Pacor S (2004) Cocultures of metastatic and host immune
cells: selective effects of NAMI-A for tumor cells. Cancer Immunol Immunother 53:1101-
1110.
Ballestrem C, Bernhard Wehrle-Haller B, Boris Hinz B and Imhof BA (2000) Actin-
dependent lamellipodia formation and microtubule-dependent tail retraction control-
directed cell migration. Mol Biol Cell 11:2999–3012.
Bergamo A, Gagliardi R, Scarcia V, Furlani A, Alessio E, Mestroni G and Sava G (1999) In
vitro cell cycle arrest, in vivo action on solid metastasising tumours and host toxicity of
the anti-metastatic drug NAMI-A and of cisplatino. J Pharmacol Exp Ther 289:559-564.
Birch M, Mitchell S and Hart IR (1991) Isolation and characterization of human melanoma
cell variants expressing high and low levels of CD44. Cancer Res 51:6660-6667.
Brooks PC, Stromblad S, Sanders LC, von Schalscha TL, Aimes RT, Stetler-Stevenson WG,
Quigley JP and Cheresh DA (1996) Localization of matrix metalloproteinase MMP-2 to
the surface of invasive cells by interaction with integrin alpha v beta 3. Cell 85:683-963.
Clarke MJ (1989) Ruthenium chemistry pertaining to the design of anticancer agents, in
Progress in Clinical Biochemistry and Medicine-Non-platinum Metal Complexes in
Cancer Chemotherapy (Clarke MJ ed) pp 25-39, Springer-Verlag, Berlin.
Cocchietto M, Zorzet S, Sorc A and Sava G (2003) Primary tumor, lung and kidney retention
and antimetastasis effect of NAMI-A following different routes of administration. Invest
New Drugs 21:55-62.
Danen EH, Ten Berge PJ, Van Muijen GN, Van't Hof-Grootenboer AE, Brocker EB and
Ruiter DJ (1994) Emergence of alpha 5 beta 1 fibronectin- and alpha v beta 3 vitronectin-
receptor expression in melanocytic tumour progression. Histopathology 24:249-256.
This article has not been copyedited and formatted. The final version may differ from this version.JPET Fast Forward. Published on December 20, 2005 as DOI: 10.1124/jpet.105.095141
at ASPE
T Journals on A
pril 4, 2019jpet.aspetjournals.org
Dow
nloaded from

JPET #95141
18
Deryugina EI, Bourdon MA, Luo GX, Reisfeld RA and Strongin A (1997). Matrix
metalloproteinase-2 activation modulates glioma cell migration. J Cell Science 110:2473-
2482.
Drukala J, Rajwa B, Pietrzkowski Z and Korohoda W (2003) Comparison of Daunomycin
Influence upon Human Keratinocytes and Melanoma HTB 140 Cells. Image Cytometry
Study. Anticancer Res 23:419-423.
Frausin F, Scarcia V, Cocchietto M, Furlani A, Serli B, Alessio E and Sava G (2005) Free
exchange across cells, and echistatin-sensitive membrane target for the metastasis
inhibitor NAMI-A on KB tumor cells. J Pharmacol Exp Ther 313:227-233.
Garbisa S, Scagliotti G, Masiero L, Di Francesco C, Caenazzo C, Onisto M, Micela M,
Stetler-Stevenson WG and Liotta LA (1992) Correlation of serum metalloproteinase
levels with lung cancer metastasis and response to therapy. Cancer Res 52:4548-49.
Herzog M, Draegar A, Ehler E and Small JV (1994) Immunophluorescence microscopy of the
cytoskeleton, in Cell biology laboratory handbook, 2nd edition, Vol 2 pp 355-360.
Honn KV and Tang DG (1992) Adhesion molecules and tumor cell interaction with
endothelium and subendothelial matrix. Cancer Met Rev 11:353-375.
Keppler BK, Henn M, Juhl UM, Berger MR, Niebl R and Wagner FE (1989) New ruthenium
complexes for the treatment of cancer, in Progress in Clinical Biochemistry and
Medicine-Non-platinum Metal Complexes in Cancer Chemotherapy (Clarke MJ ed) pp
41-69, Springer-Verlag, Berlin.
Johnson JP (1991) Cell adhesion molecules of the immunoglobulin supergene family and
their role in malignant transformation and progression to metastatic disease. Cancer Met
Rev 10:11-22.
Li X, Regezi J, Ross FP, Blystone S, Ilic D, Leong SPL and Ramos DM (2001) Integrin αvβ3
mediates K1735 murine melanoma cell motility in vivo and in vitro. J Cell Science
114:2665-2672.
MacDougall JR, Bani MR, Lin Y, Rak J and Kerbel RS (1995) The 92-kDa gelatinase B is
expressed by advanced stage melanoma cells: suppression by somatic cell hybridization
with early stage melanoma cells. Cancer Res 55:4174-4181.
Mestroni G, Alessio E and Sava G (1998) New salt of anionic complexes of Ru(III) as
antimetastatic and antineoplastic agents. International Patent, PCT C 07F 15/00, A61K
31/28. WO 98/00431.
This article has not been copyedited and formatted. The final version may differ from this version.JPET Fast Forward. Published on December 20, 2005 as DOI: 10.1124/jpet.105.095141
at ASPE
T Journals on A
pril 4, 2019jpet.aspetjournals.org
Dow
nloaded from
JPET #95141
19
Rademaker-Lakhai JM, van der Bongard D, Pluim D, Benijnen JH and Schellens JHM (2004)
A phase I and pharmacological study with imidazolium-trans-DMSO-imidazole-
tetrachlororuthenate, a novel ruthenium anticancer agent. Clin Cancer Res 10:3717-3727.
Ranuncolo SM, Matos E, Loria D, Vilensky M, Rojo R, Bal de Kier Joffè E and Puricelli LI
(2002) Circulating 92-kilodalton matrix metalloproteinase (MMP-9) activity is enhanced
in the euglobulin plasma fraction of head and neck squamous cell carcinoma. Cancer
94:1483-1491.
Sava G, Capozzi I, Clerici K, Gagliardi G, Alessio E and Mestroni G (1998) Pharmacological
control of lung metastases of solid tumours by a novel ruthenium complex. Clin Exp
Metastasis 16:371-379.
Sava G, Clerici K, Capozzi I, Cocchietto M, Gagliardi R, Alessio E, Mestroni G and
Perbellini A (1999a) Reduction of lung metastasis by ImH[trans-RuCl4(DMSO)Im]:
mechanism of the selective action investigated on mouse tumors. Anticancer Drugs
10:129-138.
Sava G, Gagliardi R, Bergamo A, Alessio E and Mestroni G (1999b) Treatment of metastases
of solid mouse tumours by NAMI-A: comparison with cisplatin, cyclophosphamide and
dacarbazine. Anticancer Res 19:969-972.
Sava G, Frausin F, Cocchietto M, Vita F, Podda E, Spessotto P, Furlani A, Scarcia V and
Zabucchi G (2004) Actin-dependent tumor cell adhesion after short exposure to the
antimetastatic ruthenium complex NAMI-A. Eur J Cancer 40:1383-1396.
Sava G, Zorzet S, Turrin C, Vita F, Soranzo M, Zabucchi G, Cocchietto M, Bergamo A,
DiGiovine S, Pezzoni G, Sartor L and Garbisa S (2003) Dual Action of NAMI-A in
inhibition of solid tumor metastasis: selective targeting of metastatic cells and binding to
collagen. Clin Cancer Res; 9:1898-1905.
Seftor RE, Seftor EA, Gehlsen KR, Stetler-Stevenson WG, Brown PD, Ruoslahti E and
Hendrix MJ (1992) Role of the alpha v beta 3 integrin in human melanoma cell invasion.
PNAS 89:1557-1561.
Skehan P, Storeng R, Scudiero D, Monks A, McMahon J,Vistica D, Warren JT, Bokesch H,
Kenney S, Boyd MR (1990) New colorimetric cytotoxicity assay for anti cancer drug
screening. J Natl Cancer Inst 82:1107-1112.
Stearns ME and Wang M (1992) Taxol blocks processes essential for prostate tumor cell (PC-
3 ML) invasion and metastases. Cancer Res 52:3776-3781.
Sun W and Schuchter LM (2001) Metastatic melanoma. Curr Treat Options Oncol 2:193-202.
This article has not been copyedited and formatted. The final version may differ from this version.JPET Fast Forward. Published on December 20, 2005 as DOI: 10.1124/jpet.105.095141
at ASPE
T Journals on A
pril 4, 2019jpet.aspetjournals.org
Dow
nloaded from

JPET #95141
20
Tamura H and Arai T (1992) Determination of ruthenium in biological tissue by graphite
furnace AAS after decomposition of the sample by tetramethylammonium hydroxide.
Bunseki KagaKu 41:13-17.
Trikha M, Timar J, Zacharek A, Nemeth JA, Cai Y, Dome B, Somlai B, Raso E, Ladanyi A
and Honn KV (2002) Role for ß3 integrin in human melanoma growth and survival. Int J
Cancer 101:156-167.
Tomasek JJ, Halliday NL, Updike DL, Ahern-Moore JS, Vu TH, Liu RW and Howard EW
(1997) Gelatinase A activation is regulated by the organization of the polymerized actin
cytoskeleton. J Biol Chem 272:7482-7487.
Voura EB, Ramjeesingh RA, Montgomery AMP and Siu CH (2001) Involvement of integrin
αvβ3 and cell adhesion molecule L1 in transendothelial migration of melanoma cells. Mol
Biol Cell 12:2699-2710.
Westerlund A, Hujanen E, Hoyhtya M, Puistola U, Turpeenniemi-Hujanen T (1997) Ovarian
cancer cell invasion is inhibited by paclitaxel. Clin Exp Metastasis 15:318-328.
Zorzet S, Bergamo A, Cocchietto M, Sorc A, Gava B, Alessio E, Iengo E and Sava G (2000)
Lack of in vitro cytotoxicity, associated to increased G(2)-M cell fraction and inhibition of
matrigel invasion, may predict in vivo-selective antimetastasis activity of ruthenium
complexes. J Pharmacol Exp Ther 295:927-933.
Zucker S, Hymowitz M, Conner C, Zarrabi HM, Hurewitz AN, Matrisian L, Boyd D,
Nicolson G and Montana S (1999) Measurement of matrix metalloproteinases and tissue
inhibitors of metalloproteinases in blood and tissues. Clinical and experimental
applications. Ann N Y Acad Sci 878:212-227.
This article has not been copyedited and formatted. The final version may differ from this version.JPET Fast Forward. Published on December 20, 2005 as DOI: 10.1124/jpet.105.095141
at ASPE
T Journals on A
pril 4, 2019jpet.aspetjournals.org
Dow
nloaded from

JPET #95141
21
LEGENDS FOR FIGURES
Figure 1. Effects of NAMI-A on ECM invasion and on trans-endothelial migration of B16F10
cells.
On the extracellular matrix invasion assay, 1x10⁵/100 µl cells, pre-treated with 1-100
µM NAMI-A, were sown on the top compartment of a transwell chamber with polycarbonate
filters of 8 µm pore size, pre-coated with 5µl/50µl fibronectin on the reverse side and with
5µl/50µl Matrigel onto the upper surface. Invading cells/field on the lower surface was
counted in seven pre-determined fields, 24 hrs later. On trans-endothelial migration assay,
0.1x10⁵ B16F10 tumor cells, pre-treated with 1-100 µM NAMI-A and labeled with FASTDill
fluorescent probe, were sown on transwell chamber filters coated with 10 µg/ml Matrigel and
a monolayer of endothelial cells. Tumor cells were allowed to invade for 48 hrs at 37° C.
Invading cells were analyzed as reported in Materials and Methods.
Each value is the average of triplicate samples and it is expressed as percentage of
inhibition of invasion vs controls. Statistics: Student-Newman-Keuls test (** p<0.01; ***
p<0.001 vs controls).
Figure 2. Light microscopic morphology of the invading B16F10 cells.
Representative images of B16F10 melanoma cells adherent to the lower surface of the
transwell filters after invasive process. Cells were stained with May-Grünwald Giemsa dye
and images were acquired under a light microscope at a magnification of 32x.
Figure 3. Analysis of the gelatinolitic activity on the serum-free conditioned medium of in
vitro cultured B16F10 melanoma cells or on the plasma fraction of mice with B16 melanoma
and treated with NAMI-A.
Serum-free supernatants of B16F10 melanoma cells, exposed for 1hr to 1-100µM
NAMI-A, were collected 24hrs after the end of the treatment and concentrated using
Centricon Y-10 tubes. Plasma euglobulin fractions were obtained at sacrifice from blood
samples, taken by cardiac puncture in open-chest anesthetized mice carrying intra-food B16
melanoma implants. Mice were treated i.p. with 35 mg/kg/day NAMI-A for 6 consecutive
days on days 15-20 (before surgery) or 22-27 (after surgery). Gelatinolitic activity was
detected as clear bands on the blue background after Coomassie staining. (none= Controls;
early= NAMI-A before-surgery; late= NAMI-A after-surgery).
Figure 4. Confocal microscopic images of B16F10 melanoma cells exposed in vitro to NAMI-
A.
This article has not been copyedited and formatted. The final version may differ from this version.JPET Fast Forward. Published on December 20, 2005 as DOI: 10.1124/jpet.105.095141
at ASPE
T Journals on A
pril 4, 2019jpet.aspetjournals.org
Dow
nloaded from

JPET #95141
22
F-actin distribution is revealed at the confocal microscope by fluorescent phalloidin.
Original magnification x100. More details in Materials and Methods. (left column): Control
untreated cells sown on fibronectin or on poly-l-lysine; (right): Cells sown on fibronectin or
on poly-l-lysine and treated with 100µM NAMI-A for 1 hr.
Figure 5. Primary tumor growth and lung metastasis formation in mice with B16 melanoma
and treated with NAMI-A.
Data are expressed as mean±SE and represent the pool of results obtained from three
separate experiments performed in the same conditions. In the first experiment, NAMI-A was
given on days 12-17 (before surgery); in the second experiment, NAMI-A was given on days
10-15 (before surgery); in the third experiment, NAMI-A was given on days 15-20 (after
surgery). B6D2F1 female mice were implanted intra-footpad with 0.5x10⁶ B16 melanoma
cells on day 0. Primary tumor growth was measured at surgery (day 18, day 16 and day 21,
respectively for the first, second experiment and third experiment) and lung metastases were
evaluated at sacrifice on days 34, 36 and 37 respectively for the first, second and third
experiment. Statistics: Student-Newman-Keuls test (*p<0.05 vs controls).
Figure 6. Cell distribution among cell cycle phases of B16 melanoma cells harvested from
primary tumor and from lung metastasis.
Single cell suspension was obtained from primary tumor mass or from lung metastatic
nodules of the same mice treated pre-surgery with 35 mg/kg/day NAMI-A for 6 consecutive
days. 0.5x10⁶ tumor cells or 0.25x10⁶ metastatic cells were labeled with propidium iodide
solution as described in Materials and Methods. Cell cycle distribution was determined by
analysis of data with Multicycle software. Data are expressed as percentage of cells on cell
cycle phases and were obtained from two experiments and they are the mean ± S.E.M of 5
different samples. Primary tumor growth was measured at surgery (day 18 and day 16,
respectively for the first and the second experiment) and lung metastases were evaluated at
sacrifice on days 34, 36 respectively for the first and the second experiment. Statistics:
Student-Newman-Keuls test (* p<0.05 vs controls).
This article has not been copyedited and formatted. The final version may differ from this version.JPET Fast Forward. Published on December 20, 2005 as DOI: 10.1124/jpet.105.095141
at ASPE
T Journals on A
pril 4, 2019jpet.aspetjournals.org
Dow
nloaded from

JPET #95141
23
Table 1. CD44 and integrin-ß3 expression on B16F10 melanoma cells in vitro after exposure
to NAMI-A.
Controls NAMI-A
Adhesion receptor % positive cells MCh value % positive cells MCh value
24 hrs after exposure
CD44 90.6±2.2 56.4±7.0 92.3±2.1 57.0±4.1
Integrin-ß3 52.5±3.1 19.1±1.2 51.3±2.4 17.7±1.5
48 hrs after exposure
CD44 82.3±1.9 45.8±0.6 96.0±3.5 53.5±1.7
Integrin-ß3 62.1±2.7 15.8±0.7 64.3±4.8 17.1±1.6
0.5x10⁶ B16F10 melanoma cells, exposed for 1 hr to 100µM NAMI-A, were labelled 24 hrs and 48 hrs after the end of treatment with monoclonal antibodies rat anti-mouse-CD44 and hamster anti-mouse integrin-ß3 (2 µg/10 µl) and processed by flow cytometry. At least 10,000 events were acquired for each sample. Flow cytometry data were processed by computational analysis using WinMDI software and are the mean±SE of sextuplicate samples obtained from two separate experiments. No statistical differences between controls and NAMI-A treated cells; Student-Newman-Keuls test.
This article has not been copyedited and formatted. The final version may differ from this version.JPET Fast Forward. Published on December 20, 2005 as DOI: 10.1124/jpet.105.095141
at ASPE
T Journals on A
pril 4, 2019jpet.aspetjournals.org
Dow
nloaded from

JPET #95141
24
Table 2.CD44, integrin-ß3 and CD54 expression on B16 melanoma cells harvested from the
primary and metastatic lesions.
Controls NAMI-A
Adhesion receptor ex vivo B16 melanoma cells from the primary tumor
% positive cells MCh value % positive cells MCh value
CD44 13.7±1.1 15.7±2.3 14.7±1.4 16.6±2.5
Integrin-ß3 13.9±0.3 16.2±1.4 13.8±0.8 12.1±0.9*
CD54 79.6±1.1 23.0±1.9 81.0±0.9 23.7±1.5
ex vivo B16 melanoma cells from the lung metastases
% positive cells MCh value % positive cells MCh value
CD44 50.1±3.7 15.3±0.8 37.5±7.2* 17.2±0.6
Integrin-ß3 30.6±2.6 12.7±0.4 25.0±0.6* 17.0±1.7
CD54 64.9±0.6 15.1±1.3 41.0±3.4** 14.4±1.0
0.5x10⁶ B16 melanoma cells, obtained from primary tumor cell suspensions at surgery, and 0.25x10⁶ B16 melanoma cells obtained from metastatic lung nodules at sacrifice, were labeled with monoclonal antibodies rat anti-mouse-CD44, rat anti-mouse-CD54 and hamster anti-mouse integrin-ß3 (2 µg/10 µl) and processed by flow cytometry. At least 10,000 events were acquired for each sample. Flow cytometry data were processed by computational analysis using WinMDI software and are the mean±SE of 5 different samples (1 sample per mouse). Data were obtained from two separate experiments. Primary tumor growth was measured at surgery (day 18 and day 16, respectively for the first and the second experiment) and lung metastases were evaluated at sacrifice on days 34, 36 respectively for the first and the second experiment. Statistics: Student-Newman-Keuls test (* p<0.05 and ** p<0.01 vs controls).
This article has not been copyedited and formatted. The final version may differ from this version.JPET Fast Forward. Published on December 20, 2005 as DOI: 10.1124/jpet.105.095141
at ASPE
T Journals on A
pril 4, 2019jpet.aspetjournals.org
Dow
nloaded from

JPET #95141
25
Table 3. NAMI-A distribution in the primary and metastatic B16 melanoma cells following in vivo treatment.
NAMI-A
Tumor site Time of treatment µg/106 cells mM (x10-1)
Tumor before surgery 0.7±0.1 16.4±2.3
µg/mg tissue
Lungs before surgery 0.1±0.0 1.4±0.2
after surgery 0.1±0.0 2.2±0.4
Ruthenium uptake was measured on 1x10⁶ cells of the primary tumor mass harvested from three different mice 24 hrs after the end of the treatment (day 18) with 35 mg/kg/day NAMI-A for 6 consecutive (days 12-17 after tumor implantation). Ruthenium uptake from lung metastases was conversely measured using fragments of lung metastases collected at sacrifice (Day 35) from three different mice that were treated with 35 mg/kg/day for 6 consecutive days on days 10-15 (before surgery) or on days 17-22 (after surgery).
This article has not been copyedited and formatted. The final version may differ from this version.JPET Fast Forward. Published on December 20, 2005 as DOI: 10.1124/jpet.105.095141
at ASPE
T Journals on A
pril 4, 2019jpet.aspetjournals.org
Dow
nloaded from
This article has not been copyedited and formatted. The final version may differ from this version.JPET Fast Forward. Published on December 20, 2005 as DOI: 10.1124/jpet.105.095141
at ASPE
T Journals on A
pril 4, 2019jpet.aspetjournals.org
Dow
nloaded from

This article has not been copyedited and formatted. The final version may differ from this version.JPET Fast Forward. Published on December 20, 2005 as DOI: 10.1124/jpet.105.095141
at ASPE
T Journals on A
pril 4, 2019jpet.aspetjournals.org
Dow
nloaded from

This article has not been copyedited and formatted. The final version may differ from this version.JPET Fast Forward. Published on December 20, 2005 as DOI: 10.1124/jpet.105.095141
at ASPE
T Journals on A
pril 4, 2019jpet.aspetjournals.org
Dow
nloaded from

This article has not been copyedited and formatted. The final version may differ from this version.JPET Fast Forward. Published on December 20, 2005 as DOI: 10.1124/jpet.105.095141
at ASPE
T Journals on A
pril 4, 2019jpet.aspetjournals.org
Dow
nloaded from

This article has not been copyedited and formatted. The final version may differ from this version.JPET Fast Forward. Published on December 20, 2005 as DOI: 10.1124/jpet.105.095141
at ASPE
T Journals on A
pril 4, 2019jpet.aspetjournals.org
Dow
nloaded from
This article has not been copyedited and formatted. The final version may differ from this version.JPET Fast Forward. Published on December 20, 2005 as DOI: 10.1124/jpet.105.095141
at ASPE
T Journals on A
pril 4, 2019jpet.aspetjournals.org
Dow
nloaded from