Embed Size (px)
Citation preview
JPET #57257#
1
Characterization of µ opioid receptor binding and G-protein coupling in rat
hypothalamus, spinal cord and primary afferent neurons during inflammatory pain
Mohammed A. Shaqura*, Christian Zöllner*, Shaaban A. Mousa, Christoph Stein and Michael Schäfer
Klinik für Anaesthesiologie und operative Intensivmedizin, Charité – Universitätsmedizin Berlin
Campus Benjamin Franklin, Hindenburgdamm 30, 12200 Berlin, Germany
Copyright 2003 by the American Society for Pharmacology and Experimental Therapeutics.
JPET Fast Forward. Published on October 30, 2003 as DOI:10.1124/jpet.103.057257This article has not been copyedited and formatted. The final version may differ from this version.JPET Fast Forward. Published on October 30, 2003 as DOI: 10.1124/jpet.103.057257
at ASPE
T Journals on Septem
ber 17, 2018jpet.aspetjournals.org
Dow
nloaded from
JPET #57257#
2
Running title: Inflammation and µ-opioid receptor binding and coupling
Corresponding author:
Christian Zöllner
Klinik für Anaesthesiologie und operative Intensivmedizin
Charité Universitätsmedizin Berlin Campus Benjamin Franklin
Hindenburgdamm 30
12200 Berlin
Tel.: +49 30 8445 4623
Fax.: +49 30 8445 4469
email.: [email protected]
Number of text pages: 21
Number of tables: 3
Number of figures: 4
Number of references: 36
Number of words in the Abstract: 236
Introduction: 355
Discussion: 1585
Abbreviations: DAMGO, [D-Ala2,N-MePhe4,Gly5-ol]enkephalin; GTPγS, guanosine-5`-O-(γ-thio)-
triphosphate; EGTA, ethylene glycol bis(β-aminoethyl ether)-N,N,N`,N`-tetraacetic acid; DAB, 3`,3`-
diaminobenzidine tetrahydrochloride;
Recommended section: Neuropharmacology
This article has not been copyedited and formatted. The final version may differ from this version.JPET Fast Forward. Published on October 30, 2003 as DOI: 10.1124/jpet.103.057257
at ASPE
T Journals on Septem
ber 17, 2018jpet.aspetjournals.org
Dow
nloaded from
JPET #57257#
3
Abstract
Peripheral analgesic effects of opioids are pronounced under inflammatory conditions, e.g. arthritis,
however, little is known about adaptive changes of µ opioid receptor binding and G protein coupling in
the peripheral versus central nervous system. The present study investigated the effects of
inflammation on µ opioid receptor (MOP receptor) binding and G-protein coupling of supraspinal,
spinal and peripheral MOP receptors. In addition, MOP receptor were identified in
immunohistochemical experiments in dorsal root ganglia (DRG) of inflamed and non-inflamed rats.
The number of MOP receptor binding sites decreased from hypothalamus (HT) > spinal cord (SC) >
dorsal root ganglia (DRG). Unilateral Freund´s complete adjuvant inflammation of one hindpaw
induced a significant up-regulation of MOP receptor sites only in DRG but not in HT or SC. This up-
regulation was time dependent, restricted to the inflamed side and showed a peak at 24 hours. The full
agonist DAMGO induced MOP receptor G-protein coupling with decreasing efficacies (Emax) from HT >
SC > DRG. Inflammation resulted in significant increases in MOP receptor G-protein coupling only in
membranes of DRG, but not in HT, SC or DRG on the contralateral side of inflammation. This
suggests that changes in MOP receptor levels are not related to systemically released mediators.
These findings show that inflammation causes changes in MOP receptor binding and G-protein
coupling selectively in primary afferent neurons, but did not cause any adaptive changes of MOP
receptor in HT or SC.
This article has not been copyedited and formatted. The final version may differ from this version.JPET Fast Forward. Published on October 30, 2003 as DOI: 10.1124/jpet.103.057257
at ASPE
T Journals on Septem
ber 17, 2018jpet.aspetjournals.org
Dow
nloaded from
JPET #57257#
4
Opioid receptors are G protein-coupled receptors (GPCRs) that are activated by opioid peptides and
alkaloids. Both classes of agonists mediate their analgesic effects in the central nervous system
(CNS) and in the peripheral nervous system (PNS) (Raynor et al., 1994; Binder et al., 2001). G
proteins are heterotrimers of α, β and γ subunits and µ opioid receptors (MOP receptor) (International
Union of Pharmacology Committee on Receptor Nomenclature and Drug Classification, 2003) produce
biological responses by selectively activating G proteins of the pertussis toxin-sensitive Gi/Go family
(Forse, 2000; Kenakin, 2002). After ligand binding at the receptor, G proteins can be activated by
coupling. Interaction of G protein with an agonist-stimulated receptor leads to the replacement of GDP
with GTP and dissociation of the α subunit from the remaining β, γ dimer (Neer, 1995). The α subunit
and the βγ subunits influence various effectors, including inhibition of adenylyl cyclase, stimulation of
potassium channel conductance, and inhibition of calcium channel conductance (Forse, 2000). All of
these can result in diminished pain sensations (Woolf and Salter, 2000). The peripheral analgesic
effects of opioids are elicited by activation of MOP receptor on primary afferent neurons (DRG). This is
best described under local inflammatory conditions and has been shown in clinical (Likar et al., 1998)
and experimental (Stein et al., 1989) studies. Intrathecal administration of opioids is widely used in
clinical routine and shows significant MOP receptor-mediated analgesic effects at the first synaptic
relay in the transmission of nociceptive messages (Julius and Basbaum, 2001). The current report
investigates differences in MOP receptor binding and signaling at peripheral, spinal or supraspinal
neurons in an animal model of i.pl. (intraplantar) Freund`s complete adjuvant (FCA) induced
inflammation. This study investigates whether: 1. opioids bind with the same affinity at MOP receptor
in hypothalamus (HT), spinal cord (SC) or primary afferent neurons (DRG); 2. painful inflammation can
cause a significant increase in MOP receptor binding sites in HT, SC or DRG; 3. inflammation induces
changes in G protein-coupling in membranes of HT, SC or DRG. These studies help to differentiate
central versus peripheral alterations of MOP receptor binding and signaling following a painful
inflammation.
This article has not been copyedited and formatted. The final version may differ from this version.JPET Fast Forward. Published on October 30, 2003 as DOI: 10.1124/jpet.103.057257
at ASPE
T Journals on Septem
ber 17, 2018jpet.aspetjournals.org
Dow
nloaded from
JPET #57257#
5
Methods
Drugs
Guanosine-5`-O-(3-[35S]thio)-triphosphate ([35S]GTPγS) (1250 Ci/mmol) was purchased from New
England Nuclear Corp. (Boston, USA). [3H]-[D-Ala2,N-MePhe4,Gly5-ol]enkephalin) (56 Ci/mmol)
([3H]DAMGO) was purchased from Amersham Pharmacia Biotech (Buckinghamshire, England).
DAMGO and naloxone were purchased from Sigma (Taufkirchen, Germany). Scintillation fluid was
obtained from EG&G Wallac (Turku, Finland). Antibodies for immunohistochemistry were obtained
from Vector Laboratories (Burlingame, USA). Synthetic peptide for MOP receptor was obtained from
Gramsch Laboratories (Schwabhausen, Germany). Polystyrene-xylene (DPX) was provided by Merck
(Darmstadt, Germany). Tissue Tek compound (OCT) was provided by Miles (Elkhart, USA).
Anesthesia was performed with halothane from Willy Rüsch GmbH (Böblingen, Germany). Freund’s
complete adjuvant (FCA) was obtained from Calbiochem (San Diego, USA).
Subjects
Experiments were performed in male Wistar rats (180-200g) individually housed in cages lined with
sawdust, with free access to rat chow and water in a laboratory equipped with a 12h/12h light/dark
cycle. Room temperature and relative humidity were maintained at 22 ± 0.5°C and 60% respectively.
The animal protocol was approved by the committee of the „Landesamt für Arbeitsschutz, Gesundheit
und Technische Sicherheit Berlin“ and the guidelines on ethical standards for investigations of
experimental pain in animals were followed (Zimmermann, 1983).
Induction of inflammation
For induction of inflammation, 0.15ml of FCA was administered into the plantar surface of the right
hind limb of rats under brief halothane anesthesia. A description of the time course and magnitude of
the inflammatory reaction is given elsewhere (Stein et al., 1988). The inflammation remained confined
to the inoculated paw throughout the observation period. The maximum observation period of FCA
inflammation was 96h.
Membrane preparations:
Rats were killed by halothane anesthesia after saline treatment (control animals) or treatment with
FCA for 24 or 96 hours, and HT, lumbal SC (L3-L5) and DRG (L3-L5) were removed. To obtain
This article has not been copyedited and formatted. The final version may differ from this version.JPET Fast Forward. Published on October 30, 2003 as DOI: 10.1124/jpet.103.057257
at ASPE
T Journals on Septem
ber 17, 2018jpet.aspetjournals.org
Dow
nloaded from
JPET #57257#
6
enough tissue for each DRG binding experiment, tissue from 10 euthanized rats was pooled for one
binding curve ([3H] DAMGO or [35S]GTPγS). This procedure was performed in inflamed and non-
inflamed (control) animals. Contralateral DRG were examined to proof unilateral alterations and not
used for control experiments. The tissue was placed immediately on ice in cold assay buffer (50mM
Tris-HCl, 1mM EGTA (ethylene glycol bis(β-aminoethyl ether)-N,N,N`,N`-tetraacetic acid), pH 7.4).
Membrane preparations were made by pooling tissue from 10 rats. Tissue was homogenized with a
Polytron homogenizer (Kinematica AG, Littau, Switzerland) and centrifuged at 42000g at 4°C for 20
min. The pellet was resuspended in assay buffer followed by a 10 minute incubation at 37°C to
degrade endogenous ligands. The homogenate was centrifuged again at 42000g and resuspended in
assay buffer. Membranes were aliquoted and stored at –80°C for at least 30 minutes.
MOP receptor binding
Appropriate concentrations of cell membranes (50-100µg) were prepared as described above and
incubated in assay buffer with varying concentrations (0.02-3nM) of the MOP receptor agonist [D-
Ala2,N-MePhe4,Gly5-ol]enkephalin ([3H]DAMGO). In all opioid binding experiments non-specific
binding, which typically represented 15-35% of total binding, was defined with naloxone (10µM). Only
specific binding is reported. Membranes were incubated in a final volume of 1 ml for 1h at 30°C in
assay buffer. Filters were soaked in 0.1% (w/v) polyethyleneimine solution for 30 min before using.
Bound and free ligand were separated by rapid filtration under vacuum through Whatman GF/B glass
fiber filters, followed by four washes with cold buffer (50mM Tris-HCl, pH 7.4). Bound radioactivity was
determined by liquid scintillation spectrophotometry at 70% counting efficiency for [3H] after overnight
extraction of the filters in 3 mL scintillation fluid.
Measurement of DAMGO induced G-protein binding at MOP receptor
Membranes were thawed, homogenized and centrifuged at 42000g for 10min. Membranes were
incubated in [35S]GTPγS assay buffer containing 50mM Tris-HCl pH7.4, 5mM MgCl2, 0.2mM EGTA,
100mM NaCl and 1mM DTT. The buffer composition was similar to that of Newman-Tancredi
(Newman-Tancredi et al., 1997). Concentration-effect curves were generated by incubating the
appropriate concentration of membranes (30-50µg) and varying concentrations of DAMGO (10-12 - 10-
4M), with 50µM GDP and 0.05nM [35S]GTPγS in a total volume of 800µl. Basal binding was assessed
in the absence of agonist, and non-specific binding was measured in the presence of 10µM unlabeled
This article has not been copyedited and formatted. The final version may differ from this version.JPET Fast Forward. Published on October 30, 2003 as DOI: 10.1124/jpet.103.057257
at ASPE
T Journals on Septem
ber 17, 2018jpet.aspetjournals.org
Dow
nloaded from
JPET #57257#
7
GTPγS. The reaction mixture was incubated for 2hr at 30°C. Bound and free [35S]GTPγS were
separated by vacuum filtration through GF/B filters and quantified by liquid scintillation counting.
[35S]GTPγS Saturation Binding at MOP receptor
In the presence (10µM) or absence of DAMGO, saturation analysis of DAMGO stimulated [35S]GTPγS
binding to membranes was performed. Membranes were incubated with varying concentrations of
[35S]GTPγS (0.05-2nM) and 50µm GDP in assay buffer for 2hr at 30°C. Unstimulated [35S]GTPγS
binding was subtracted from agonist stimulated binding at each measurement point. The incubations
for all experiments were terminated by filtration under vacuum through Whatman GF/B glass fiber
filters, followed by four washes with cold buffer (50mM Tris-HCl, pH 7.4). Bound radioactivity was
determined by liquid scintillation spectrophotometry after extraction overnight in scintillation fluid.
Immunohistochemistry in DRG
Five rats per group (inflamed and noninflamed) were deeply anesthetized with halothane four days
after saline or FCA treatment and transcardially perfused with 60ml warm saline, followed by 300ml
4% (w/v) paraformaldehyde with 0.2 % (v/v) picric acid in 0.16M phosphate buffer solution (pH 6.9).
The ipsilateral L5 DRG were removed, postfixed in the same fixatives for 90 minutes, and then placed
in 15% (w/v) sucrose solution at 4oC overnight. The tissue was embedded in Tissue Tek compound
(OCT, Elkhart, IN), frozen, cut in 14µM sections and the sections were incubated overnight with anti-
MOP receptor (1:1000) (kindly provided by Drs. S. Schulz and V. Höllt). The appropriate biotinylated
secondary antibody (Gramsch Laboratories-Biotechnology, Germany) was added (Mousa et al.,
2002). Finally, the sections were washed and stained with 3`,3`-diaminobenzidine tetrahydrochloride
(DAB) containing 0.01% H2O2 in 0.05 M Tris-buffered saline (pH 7.6) for 3-5 min. After the enzyme
reaction, the sections were washed in tap water, mounted onto gelatin coated slides, dehydrated in
alcohol, cleared in xylene and mounted in DPX.
The method of quantification for DRG staining has been described previously (Mousa et al., 2001).
Briefly, the total number of MOP receptor containing neurons was counted by an observer blinded to
the experimental protocol. The total number of MOP receptor containing neurons divided by the total
number of neurons in each DRG section was used to calculate the percentage of MOP receptor
immunoreactive neurons. The cell body diameter was measured with the nucleus in the focal plane
This article has not been copyedited and formatted. The final version may differ from this version.JPET Fast Forward. Published on October 30, 2003 as DOI: 10.1124/jpet.103.057257
at ASPE
T Journals on Septem
ber 17, 2018jpet.aspetjournals.org
Dow
nloaded from
JPET #57257#
8
and was estimated from the average length and width determined with a calibrated micrometer. The
diameters of of 30 immunoreactive neurons with nucleus were measured in each animal.
Data analysis
All ligand binding and [35S]GTPγS binding data are reported as mean ± standard error values of at
least four experiments, which were each performed in duplicate. [3H]DAMGO ligand binding
experiments and [35S]GTPγS saturation binding experiments were fitted to a one-site binding
hyperbola using GraphPad Prism (GraphPad, San Diego, USA) to determine Kd and Bmax values. Non-
specific binding was subtracted from all [3H]DAMGO and [35S]GTPγS binding data. EC50 values in
[35S]GTPγS binding assays were determined by use of GraphPad Prism. Efficacy (Emax) is defined as
the maximum percent stimulation by DAMGO, as determined by nonlinear regression analysis of
concentration-effect curves. Statistical differences between animals with and without FCA
inflammation were determined by the non-paired Student`s t-test or analysis of variance (ANOVA) with
post hoc comparison using Tukey test. (Sigma Stat 2.03, Jandel, San Rafael, USA).
This article has not been copyedited and formatted. The final version may differ from this version.JPET Fast Forward. Published on October 30, 2003 as DOI: 10.1124/jpet.103.057257
at ASPE
T Journals on Septem
ber 17, 2018jpet.aspetjournals.org
Dow
nloaded from
JPET #57257#
9
Results
Binding affinities and opioid receptor numbers in membranes of HT, SC and DRG
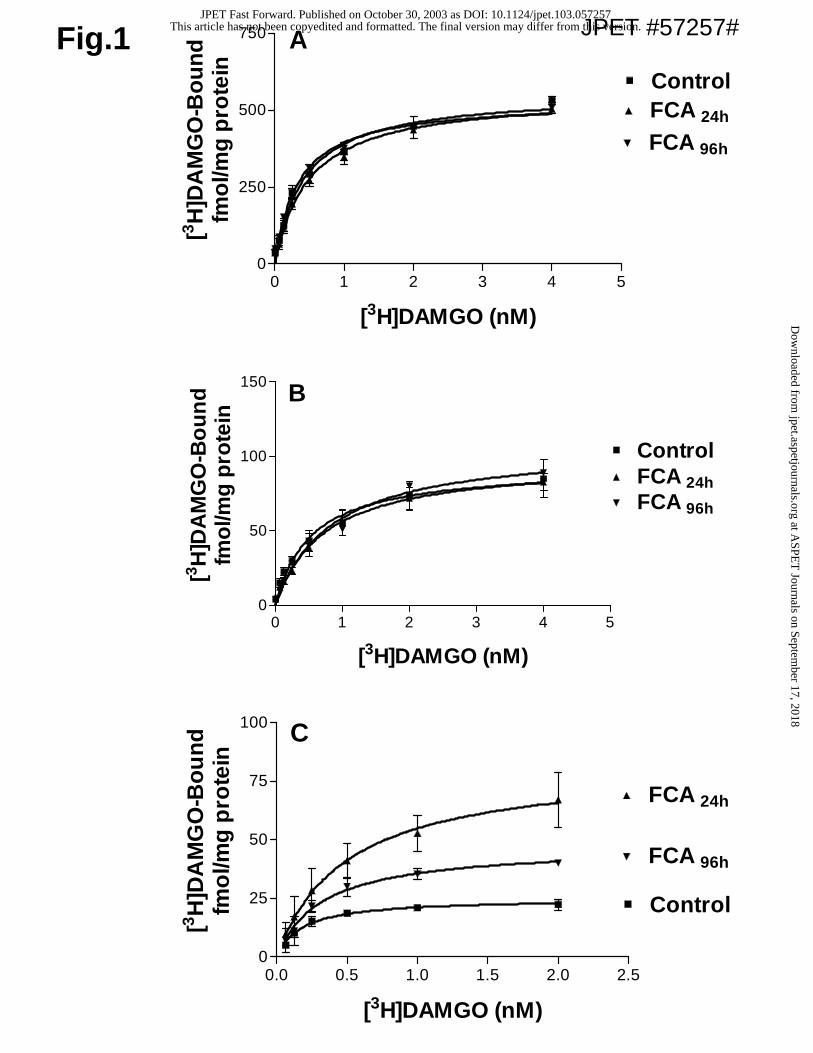
Saturation binding of [3H]DAMGO displaced by naloxone showed similiar binding affinities (Kd) in
membrane preparations of HT, SC and DRG (Table 1). The number of MOP receptor binding sites
(Bmax) decreased from HT>SC>DRG. No differences in Kd and Bmax were detectable for HT and SC in
animals with and without FCA inflammation (Table 1, Fig. 1A+B). However, the number of opioid
receptors (Bmax) increased significantly (p<0.05, ANOVA) in DRG membranes at 24 and 96 hours of
FCA inflammation (Table 1, Fig.1C). No change in Bmax was detectable in DRG membranes on the
contralateral side of inflammation (29±3.1 fmol/mg protein). Earlier data showed that opioid full
agonists (e.g. fentanyl) produce dose-dependent elevations of PPT in animals with FCA inflammation,
however, much lower elevations of PPT in animals without FCA inflammation (Antonijevic et al., 1995).
Our biochemical data support better analgesic effects in inflammatory painful conditions.
Potencies and efficacies of DAMGO stimulated [35S]GTPγS binding in membranes of HT, SC and
DRG
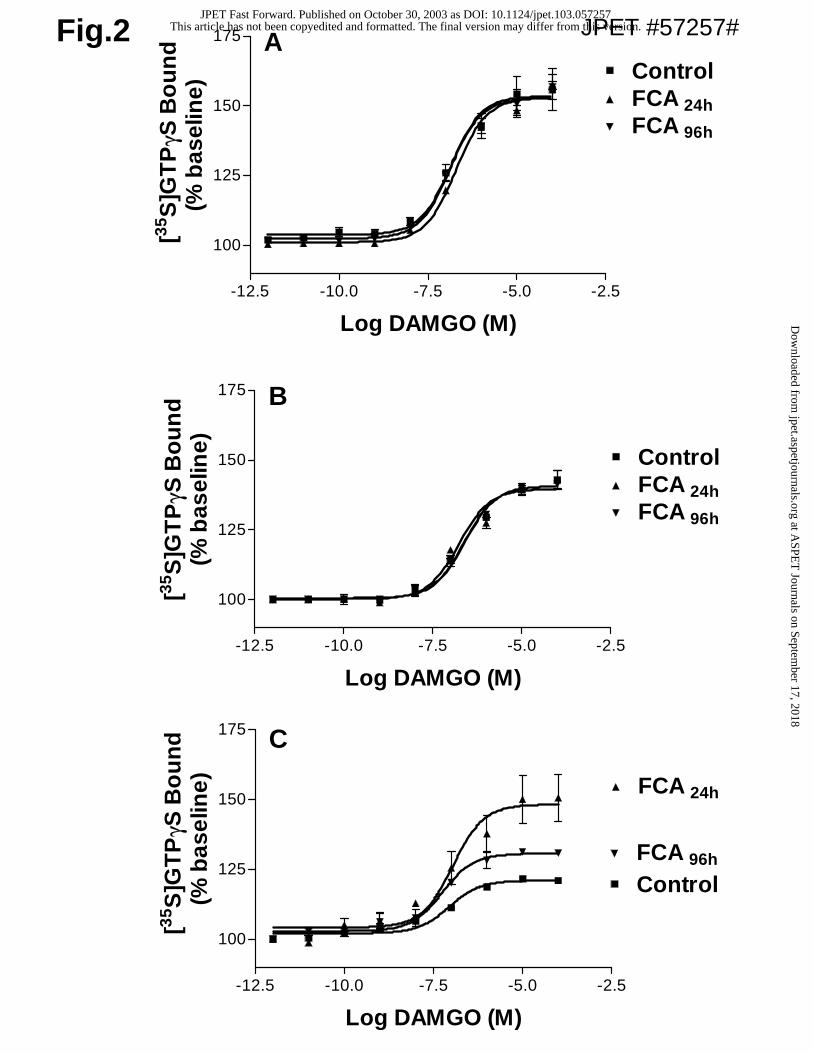
[35S]GTPγS binding stimulated by increasing DAMGO concentrations revealed no significant
differences in EC50 and Emax values at different time intervals of FCA inflammation for HT and SC and
no significant differences in EC50 for DRG (Table 2, Fig. 2A+B). However, after 24 and 96 hours of
FCA inflammation the efficacy (Emax) of DAMGO induced G protein-coupling in DRG membranes was
significantly increased compared to controls (p<0.05, ANOVA) (Table 2, Figure 2C). A significant
increase in the basal levels of DAMGO induced [35S]GTPγS binding in DRG of animals without FCA
inflammation (3740 ± 173) compared to animals with 24 (6478 ± 415 cpm) and 96 (8250 ± 794 cpm)
hours of FCA inflammation was detectable (p<0.05, ANOVA). However, basal [35S]GTPγS did not
change in HT nor SC (data not shown).
[35S]GTPγS saturation binding experiments
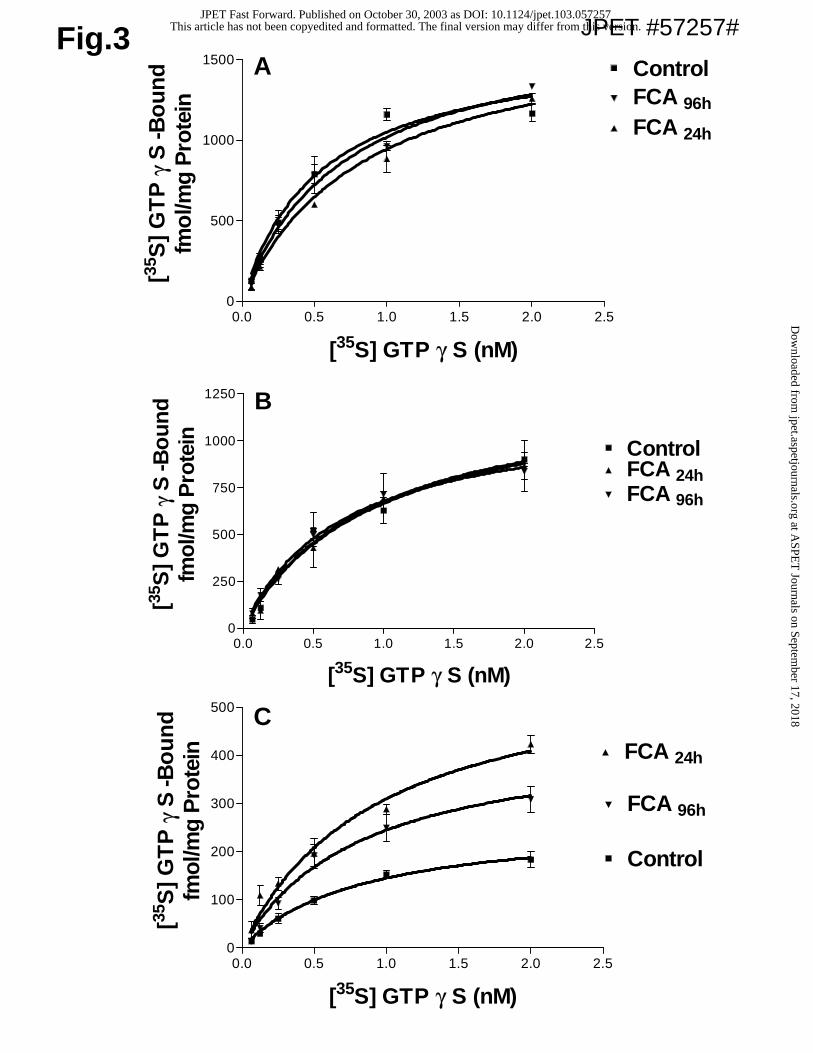
Saturation analysis of agonist-stimulated [35S]GTPγS binding was used to determine the apparent
affinity of [35S]GTPγS for the activated G protein, and the number of G proteins activated. [35S]GTPγS
saturation binding revealed high apparent affinities for G proteins at MOP receptor in HT, SC and
DRG after DAMGO (10µM) stimulation (Table 3). No significant differences were detectable between
This article has not been copyedited and formatted. The final version may differ from this version.JPET Fast Forward. Published on October 30, 2003 as DOI: 10.1124/jpet.103.057257
at ASPE
T Journals on Septem
ber 17, 2018jpet.aspetjournals.org
Dow
nloaded from
JPET #57257#
10
apparent Kd Gprotein in membranes of HT, SC and DRG in animals with and without FCA inflammation
(Table 3, Fig. 3). Animals with FCA inflammation showed a significant increase in DAMGO stimulated
apparent Bmax Gprotein in DRG membranes, but not in membranes of HT and SC (Table 3, Fig. 3). The
relative amplification factor (amount of G-protein bound/number of opioid receptors in membrane
fractions) was calculated according to Selley et al. (Selley et al., 1998). The number of G-proteins
activated by one MOP receptor in non-inflamed tissue was 3 in HT, 13 in SC and 9 in DRG and was
not significantly different between animals with and without FCA inflammation.
Immunohistochemistry
Representative DRG sections of animals with and without FCA inflammation are shown in Figure 4.
Immunohistochemical visualization showed a significant increase of MOP immunoreactive neurons in
DRG of rats with 96 hours of FCA inflammation (25.8±1.5%) compared to rats without FCA
inflammation (16.8±0.6%) (Fig. 4). This represents a 53% relative increase during inflammation. Cell
characterization showed that mainly cells of small to medium diameter (20-50µm) stained positive for
MOP receptor.
This article has not been copyedited and formatted. The final version may differ from this version.JPET Fast Forward. Published on October 30, 2003 as DOI: 10.1124/jpet.103.057257
at ASPE
T Journals on Septem
ber 17, 2018jpet.aspetjournals.org
Dow
nloaded from
JPET #57257#
11
Discussion
In this report we investigated the effect of a pathological, local FCA inflammation on MOP receptor
binding and signaling in the central compared to the peripheral nervous system. The major finding of
this study is that MOP receptor binding and G protein coupling is differentially altered in HT, SC and
DRG following FCA inflammation. While MOP receptor binding remains unaffected in HT and SC, it is
significantly increased in ipsilateral DRG following FCA hindpaw inflammation. The contralateral side
is not affected by FCA inflammation. In addition, MOP receptor G protein coupling significantly
increased in DRG neurons of animals with FCA inflammation. Consistently, our immunohistochemistry
experiments show a rise in the number of small but not large diameter MOP receptor-positive DRG
neurons. These results suggest that FCA inflammation of the hindpaw affects predominantly neurons
in DRG associated with inflammation. This indicates that differences are not related to the systemic
release of mediators of inflammation, but are restricted to neurons that innervate painful inflamed
tissue.
MOP receptor are localized and expressed in the central nervous system and in peripheral sensory
neurons. The number of MOP receptor (Bmax) in DRG membranes in animals without inflammation is
22fold lower than in HT and 4fold lower than in SC, indicating that the density of MOP receptor
decreases from HT>SC>DRG. The experiments were performed in rat hypothalamus because it was
shown that this brain region is enriched with MOP receptors (Sim et al., 1995; Maher et al., 2000) and
is involved in pain transmission (Basbaum et al., 1984). The affinity of DAMGO to MOP receptors is
not different in HT, SC and DRG, which supports previous studies showing that MOP receptors bind
DAMGO in all isolated membrane preparations equally well (Maher et al., 2000).
FCA-induced inflammation of hindpaws does not alter MOP receptor binding sites in hypothalamus
and spinal cord. In line with these findings, Spetea et al (Spetea et al., 2002) reported no differences
in binding affinities and Bmax from non-arthritic and arthritic rats in striatum, hypothalamus,
hippocampus, frontal cortex and lumbar spinal cord. Autoradiography experiments did not show
differences in the binding of DAMGO, DADL or bremazocine at µ, δ or κ-opioid receptors in lumbar
spinal cord sections after FCA inflammation (Millan et al., 1987). However, in immunohistochemistry
experiments by Goff et al. (Goff et al., 1998) and Mousa et al. (Mousa et al., 2002) a significant
increase (38% and 34%) of MOP receptor in lumbar sections of spinal cord after FCA induced
This article has not been copyedited and formatted. The final version may differ from this version.JPET Fast Forward. Published on October 30, 2003 as DOI: 10.1124/jpet.103.057257
at ASPE
T Journals on Septem
ber 17, 2018jpet.aspetjournals.org
Dow
nloaded from
JPET #57257#
12
inflammation of the hindpaw was detectable. The discrepancy between immunohistochemistry and
ligand binding might be explained by differences in the sensitivity of both techniques.
However, in animals with FCA inflammation we found changes in the number of MOP receptor binding
sites selectively on ipsilateral but not contralateral DRG membranes, reflecting adaptive changes in
response to sustained inflammation. Bmax analysis showed a large increase of MOP receptor binding
sites 24 hours after inflammation in lumbar DRG sections. As shown previously, 96 hours after
inflammation Bmax was still significantly higher compared to control animals (Zöllner et al., 2003).
However, the current study shows that the number of MOP receptor binding sites is lower compared
with 24 hours FCA inflammation. These results suggest that intraplantar application of FCA leads to a
selective increase in MOP receptor expression in DRG neurons innervating painful inflamed tissue.
This was confirmed in our immunohistochemical experiments with MOP receptor binding sites
following FCA inflammation. An increase in MOP receptor density was detectable and predominantly
localized in small diameter neurons. This indicates that MOP receptor immunoreactivity is mainly
restricted to nociceptive neurons (Ji et al., 1995; Mousa et al., 2001) and is in agreement with a report
by Silbert et al. (Silbert et al., 2003), who have shown that small nociceptors express MOP receptor
mRNA at quantitatively higher levels. In a previous study using a ribonuclease protection assay, µ
opioid receptor mRNA did not increase during FCA inflammation (Schafer et al., 1995). However,
changes in receptor protein were not examined. Current investigations using quantitative real time
PCR technology show that mRNA for µ opioid receptors might increase at early time points of FCA
inflammation. This supports the hypothesis that an increase in the efficacy of opioid analgesia during
inflammation might be related in part to an up-regulation of MOP receptor expression in small size
nociceptors. For human neuroblastoma cells it was shown recently that an increase in MOP receptor
mRNA might be related to mediators of inflammation (e.g. IL-4, TNF) (Kraus et al., 2001). In addition,
NGF is also thought to be critical for altered gene transcription and protein synthesis in DRG neurons
(Lindsay and Harmar, 1989; Alvares and Fitzgerald, 1999).
The functional status of MOP receptor can be measured in concentration-effect curves for agonist-
stimulated [35S]GTPγS binding (Audinot et al., 2002). We performed a set of experiments to determine
this initial stage of G protein activation to reveal possible changes in MOP receptor-mediated G
protein-coupling of DRG in animals with and without FCA inflammation. As predicted from classical
receptor theory (Selley et al., 1998), the relationship between receptor occupancy and G protein
This article has not been copyedited and formatted. The final version may differ from this version.JPET Fast Forward. Published on October 30, 2003 as DOI: 10.1124/jpet.103.057257
at ASPE
T Journals on Septem
ber 17, 2018jpet.aspetjournals.org
Dow
nloaded from
JPET #57257#
13
activation by MOP receptor depends on receptor density. Consistently, in our studies the absolute
magnitude of the G protein stimulation (Efficacy Emax) was higher in isolated membranes with higher
receptor density (Emax: HT>SC>DRG). In HT and SC no significant differences in efficacy were
measurable after induction of inflammation. This supports our MOP receptor binding data showing that
a local inflammation does not affect binding and signaling of opioids in the CNS. An important finding
of the present study is that the efficacy of DAMGO stimulated G-protein activation increased
significantly, time dependently and selectively in DRG membrane preparations of animals with FCA
inflammation but not in membrane preparations of the CNS. Maximal stimulation of [35S]GTPγS
binding by DAMGO in DRG increased 24 hours and 96 hours after inflammation only on the ipsilateral
side. An increase in G protein-coupling during inflammation might explain why in a number of studies
the application of exogenous opioids in behavioral experiments of peripheral antinociception are
enhanced under inflammatory conditions (Stein et al., 2001; Schäfer et al., 1995). The basal levels of
[35S]GTPγS binding are higher in DRG membranes of animals with 24 and 96 hours of inflammation.
This increase is not detectable in HT nor SC. It might indicate constitutive activity in DRG membranes
of inflamed animals which could be related to permanent stimulation through mediators of
inflammation (e.g. prostaglandins).
Some studies have found that GTPγS binding to membrane preparations is reversible and could reach
equilibrium under certain conditions (Breivogel et al., 1998; Hilf et al., 1992). The saturation analysis of
agonist-stimulated [35S]GTPγS binding in our experiments was performed in the presence of GDP in a
competitive manner. Therefore, the affinity of [35S]GTPγS for the activated G protein and the number
of G proteins activated are only apparent values. The apparent Bmax Gprotein (app. Bmax) and the
apparent Kd Gprotein (app. Kd Gprotein) do not represent the exact maximal number of G proteins or affinity
of G-proteins to the receptor. However, relative comparisons between tissues are possible as
described previously in detail (Selley et al., 2001; Newman-Tancredi et al., 1997). We found that
DAMGO occupied MOP receptor receptors bind G proteins with high affinity in HT, SC and DRG in
animals with and without FCA inflammation. However, significant differences were detectable in the
number of G proteins activated. The system with the highest receptor density (HT) showed the highest
number of G proteins activated. In comparison, a saturated concentration of DAMGO in SC or DRG
sections could activate only 80% or 16%, respectively, compared to G protein activation in HT. A
significant increase in the number of activated G proteins was detected in DRG membranes after 24
This article has not been copyedited and formatted. The final version may differ from this version.JPET Fast Forward. Published on October 30, 2003 as DOI: 10.1124/jpet.103.057257
at ASPE
T Journals on Septem
ber 17, 2018jpet.aspetjournals.org
Dow
nloaded from
JPET #57257#
14
hours or 96 hours of FCA-induced inflammation. This increase could underly the enhanced
antinociception produced by treatment with opioids in inflammatory conditions as shown in previous
behavioral experiments (Stein et al., 1989).
The relative amplification factor represents the extent of G protein amplification between treatment
(FCA) and control tissue. This factor depends on the relative expression levels of all forms of G-
protein and might vary in tissue following FCA treatment, however, we have not investigated changes
in G protein content betweeen control and FCA treated animals. The number of G-proteins activated
by one MOP receptor was 3 in the HT, 13 in the SC and 9 in the DRG. Relative amplification factors
for DRG, HT and SC have not significantly changed between inflamed and non-inflamed animals. The
amplification factor for HT is different from a previous publication by Maher and colleagues (Maher et
al., 2000), in which the amplification factor for HT was reported with 19. However, the specific assay
conditions were different (e.g. GDP concentration) which might explain differences in the relative
amplification factors.
In conclusion, painful inflammation leads to differential alterations of MOP receptor expression in
brain, spinal cord and DRG. It is associated with an up-regulation of MOP receptor mainly in small
sized primary afferent neurons, but not in the CNS. This suggests that a locally applied inflammation
can affect neurons which are innervating the region of inflammation. This has functional relevance
since the efficacy of MOP receptor agonists in G protein-coupling is enhanced in primary afferent
fibres. Our findings indicate that clinical treatment of patients with opioids in inflammatory diseases is
different from patients with non-inflammatory painful conditions. The known increased analgesic
efficacy of locally applied opioids could be explained by a selectively increased numbers as well as G-
protein coupling efficacy of MOP receptor in primary afferent neurons.
This article has not been copyedited and formatted. The final version may differ from this version.JPET Fast Forward. Published on October 30, 2003 as DOI: 10.1124/jpet.103.057257
at ASPE
T Journals on Septem
ber 17, 2018jpet.aspetjournals.org
Dow
nloaded from
JPET #57257#
15
Acknowledgments
We thank Drs. Stefan Schulz and Volker Höllt (Department of Pharmacology and Toxicology, Otto-
von-Guericke University, Magdeburg, Germany) for the gifts of the MOP receptor antibody.
This article has not been copyedited and formatted. The final version may differ from this version.JPET Fast Forward. Published on October 30, 2003 as DOI: 10.1124/jpet.103.057257
at ASPE
T Journals on Septem
ber 17, 2018jpet.aspetjournals.org
Dow
nloaded from
JPET #57257#
16
References
Alvares D and Fitzgerald M (1999) Building blocks of pain: the regulation of key molecules in spinal
sensory neurones during development and following peripheral axotomy. Pain Suppl 6:7-85.
Antonijevic I, Mousa SA, Schafer M and Stein (1995) Perineurial defect and peripheral opioid
analgesia in inflammation. J Neurosci 15:165-172.
Audinot V, Fabry N , Nicolas JP, Beauverger P, Newman-Tancredi A, Millan MJ, Try A, Bornancin F,
Canet E and Boutin JA (2000) Ligand modulation of [35S]GTPγS binding at human alpha(2A),
alpha(2B) and alpha(2C) adrenoceptors. Cell Signal 14:829-837.
Basbaum AI and Fields HL (1984) Endogenous pain control systems: Brainstem spinal pathways and
endorphin circuitry. Ann Rev Neurosci 7:309-38.
Binder W, Machelska H, Mousa S, Schmitt T, Riviere PJ, Junien JL, Stein C and Schafer M (2001)
Analgesic and antiinflammatory effects of two novel kappa-opioid peptides. Anesthesiology 94:1034-
1044.
Breivogel CS, Selley DE and Childers SR (1998) Cannabinoid receptor agonist efficacy for stimulating
[35S]GTPγS binding to rat cerebellar membranes correlates with agonist-induced decreases in GDP
affinity. J Biol Chem 273:16865-16873.
Forse RA (2000) Biology of heterotrimeric G-protein signaling. Crit Care Med 28:53-59.
Goff JR, Burkey AR, Goff DJ and Jasmin L (1998) Reorganization of the spinal dorsal horn in models
of chronic pain: correlation with behaviour. Neuroscience 82:559-574.
Hilf G, Kupprion C, Wieland T and Jakobs KH (1992) Dissociation of guanosine 5`-[gamma-
thio]triphosphate from guanine-nucleotide-binding regulatory proteins in native cardiac membranes.
Regulation by nucleotides and muscarinic acetylcholine receptors. Eur J Biochem 204:725-731.
International Union of Pharmacology Committee on Receptor Nomenclature and Drug Classification
(NC-IUPHAR) (2003) Nomenclature guidelines for authors. British Journal of Pharmacology 138:725-
729.
This article has not been copyedited and formatted. The final version may differ from this version.JPET Fast Forward. Published on October 30, 2003 as DOI: 10.1124/jpet.103.057257
at ASPE
T Journals on Septem
ber 17, 2018jpet.aspetjournals.org
Dow
nloaded from
JPET #57257#
17
Ji RR, Zhang Q, Law PY, Low HH, Elde R and Hokfelt T (1995) Expression of mu-, delta-, and kappa-
opioid receptor-like immunoreactivities in rat dorsal root ganglia after carrageenan-induced
inflammation. J Neurosci 15:8156-8166.
Julius D and Basbaum A (2001) Molecular mechanisms of nociception. Nature 413:203-210.
Kenakin T (2002) Drug efficacy at G protein-coupled receptors. Annu Rev Pharmacol Toxicol 42:349-
379.
Kraus J, Borner C, Giannini E, Hickfang K, Braun H, Mayer P, Hoehe MR, Ambrosch A, Konig W and
Hollt V (2001) Regulation of mu-opioid receptor gene transcription by interleukin-4 and influence of an
allelic variation within a STAT6 transcription factor binding site. J Biol Chem 276:43901-43908.
Likar R, Sittl R, Gragger K, Pipam W, Blatnig H, Breschan C, Schalk HV, Stein C and Schafer M
(1998) Peripheral morphine analgesia in dental surgery. Pain 76:145-150.
Lindsay RM and Harmar AJ. Nerve growth factor regulates expression of neuropeptide genes in adult
sensory neurons. Nature 337:362-364.
Maher CE, Selley DE and Childers SR (2000) Relationship of mu opioid receptor binding to activation
of G-proteins in specific rat brain regions. Biochem Pharmacol 59:1395-1401.
Millan MJ, Czlonkowski A, Morris B, Stein C, Arendt R, Huber A, Höllt V and Herz A (1988)
Inflammation of the hind limb as a model of unilateral, localized pain: influence on multiple opioid
systems in the spinal cord of the rat. Pain 35:299-312.
Mousa SA, Zhang Q, Sitte N, Ji R and Stein C (2001) beta-Endorphin-containing memory-cells and
mu-opioid receptors undergo transport to peripheral inflamed tissue. J Neuroimmunol 115:71-78.
Mousa SA, Machelska H, Schafer M and Stein C (2002) Immunohistochemical localization of
endomorphin-1 and endomorphin-2 in immune cells and spinal cord in a model of inflammatory pain. J
Neuroimmunol 126:5-15.
Neer EJ (1995) Heterotrimeric G proteins: organizers of transmembrane signals. Cell 80:249-257.
This article has not been copyedited and formatted. The final version may differ from this version.JPET Fast Forward. Published on October 30, 2003 as DOI: 10.1124/jpet.103.057257
at ASPE
T Journals on Septem
ber 17, 2018jpet.aspetjournals.org
Dow
nloaded from
JPET #57257#
18
Newman-Tancredi A, Audinot V, Chaput C, Verriele L and Millan MJ (1997) [35S]Guanosine-5'-O-(3-
thio)triphosphate binding as a measure of efficacy at human recombinant dopamine D4.4 receptors:
actions of antiparkinsonian and antipsychotic agents. J Pharmacol Exp Ther 282:181-191.
Newman-Tancredi A, Cussac D, Audinot V, Pasteau V, Gavaudan S and Millan MJ (1999) G protein
activation by human dopamine D3 receptors in high-expressing Chinese hamster ovary cells: A
guanosine-5'-O-(3-[35S]thio)- triphosphate binding and antibody study. Mol Pharmacol 55:564-574.
Raynor K, Kong H, Chen Y, Yasuda K, Yu L, Bell GI and Reisine T (1994) Pharmacological
characterization of the cloned kappa-, delta-, and mu- opioid receptors. Mol Pharmacol 45:330-334.
Schafer M, Imai Y, Uhl GR and Stein C (1995) Inflammation enhances peripheral mu-opioid receptor-
mediated analgesia, but not mu-opioid receptor transcription in dorsal root ganglia. Eur J Pharmacol
279:165-169.
Selley DE, Liu Q and Childers SR (1998) Signal transduction correlates of mu opioid agonist intrinsic
efficacy: receptor-stimulated [35S]GTP gamma S binding in mMOR-CHO cells and rat thalamus. J
Pharmacol Exp Ther 285:496-505.
Selley DE, Rorrer WK, Breivogel CS, Zimmer AM, Zimmer A, Martin BR and Sim-Selley LJ (2001)
Agonist efficacy and receptor efficiency in heterozygous CB1 knockout mice: relationship of reduced
CB1 receptor density to G-protein activation. J Neurochem 77:1048-1057.
Silbert SC, Beacham DW and McCleskey EW (2003) Quantitative single-cell differences in mu-opioid
receptor mRNA distinguish myelinated and unmyelinated nociceptors. J Neurosci 23:34-42.
Sim LJ, Selley DE and Childers SR (1995) In vitro autoradiography of receptor-activated G proteins in
rat brain by agonist-stimulated guanylyl 5[gamma-[35S]thio]-triphosphate binding. Proc Natl Acad Sci
USA 92:7242-7246
Spetea M, Rydelius G, Nylander I, Ahmed M, Bileviciute-Ljungar I, Lundeberg T, Svensson S and
Kreicbergs A (2002) Alteration in endogenous opioid systems due to chronic inflammatory pain
conditions. Eur J Pharmacol 435:245-252.
This article has not been copyedited and formatted. The final version may differ from this version.JPET Fast Forward. Published on October 30, 2003 as DOI: 10.1124/jpet.103.057257
at ASPE
T Journals on Septem
ber 17, 2018jpet.aspetjournals.org
Dow
nloaded from
JPET #57257#
19
Stein C, Machelska H, Binder W and Schafer M (2001) Peripheral opioid analgesia. Curr Opin
Pharmacol 1:62-65.
Stein C, Millan MJ and Herz A (1988) Unilateral inflammation of the hindpaw in rats as a model of
prolonged noxious stimulation: alterations in behavior and nociceptive thresholds. Pharmacol Biochem
Behav 31:455-51.
Stein C, Millan MJ, Shippenberg TS, Peter K and Herz A (1989) Peripheral opioid receptors mediating
antinociception in inflammation. Evidence for involvement of mu, delta and kappa receptors. J
Pharmacol Exp Ther 248:1269-1275.
Woolf CJ and Salter MW (2000) Neuronal plasticity: increasing the gain in pain. Science 288:1765-
1769.
Zimmermann M (1983) Ethical guidelines for investigations of experimental pain
in conscious animals. Pain 16:109-110.
Zöllner C, Shaqura MA, Bopaiah CP, Mousa S, Stein C and Schäfer M (2003) Painful inflammation
induced increase in µ opioid receptor binding and G-protein coupling in primary afferent neurons. Mol
Pharmacol 64:202-210.
This article has not been copyedited and formatted. The final version may differ from this version.JPET Fast Forward. Published on October 30, 2003 as DOI: 10.1124/jpet.103.057257
at ASPE
T Journals on Septem
ber 17, 2018jpet.aspetjournals.org
Dow
nloaded from
JPET #57257#
20
Footnotes
* These authors contributed equally to this work
This work was supported by “Klinische Forschergruppe Grant from the Deutsche
Forschungsgemeinschaft (DFG) KFO 100/1, International Anesthesia Research Society (IARS) and
Graduiertenkolleg 276/2: Signalerkennung und -umsetzung”.
This article has not been copyedited and formatted. The final version may differ from this version.JPET Fast Forward. Published on October 30, 2003 as DOI: 10.1124/jpet.103.057257
at ASPE
T Journals on Septem
ber 17, 2018jpet.aspetjournals.org
Dow
nloaded from
JPET #57257#
21
Legends for Figures
Figure 1:
Determination of MOP receptor was performed with [3H]DAMGO binding experiments in HT (A), SC
(B) and DRG (C) membranes of animals with (24h and 96h) and without FCA inflammation. Non-
specific binding was determined with 10µM naloxone. Data shown are means of at least four
representative experiments.
Figure 2:
Stimulation of [35S]GTPγS binding to HT (A), SC (B) and DRG (C) membranes of animals without and
with (24 and 96h FCA) inflammation. Concentration-response curves were determined for DAMGO as
described under Materials and Methods. Nonspecific binding was determined using 10µM cold GTPγS
and was subtracted from each data set. Basal [35S]GTPγS binding in the absence of added drugs was
4000-6000 cpm in all groups. Each value represents the mean ± S.E.M. of at least four independent
experiments performed in duplicate.
Figure 3:
Saturation analysis of DAMGO-stimulated [35S]GTPγS binding to HT (A), SC (B) and DRG (C)
membranes of animals with (24 and 96h FCA) and without inflammation. Saturation binding of
[35S]GTPγS was performed in the absence and presence of 10µM DAMGO in HT (A), SC (B) and DRG
(C) membranes.
Figure 4:
Brightfield micrographs showing representative MOP receptor positive neurons in L5 DRG of rats
without FCA inflammation (A) and in DRG of rats with FCA inflammation (B). MOP receptor positive
neurons were significantly higher in inflamed (B) compared to non-inflamed (A) sections. MOR-IR is
mainly seen in small DRG neurons. Scale bar = 20 µm.
This article has not been copyedited and formatted. The final version may differ from this version.JPET Fast Forward. Published on October 30, 2003 as DOI: 10.1124/jpet.103.057257
at ASPE
T Journals on Septem
ber 17, 2018jpet.aspetjournals.org
Dow
nloaded from
JPET #57257#
22
Tables:
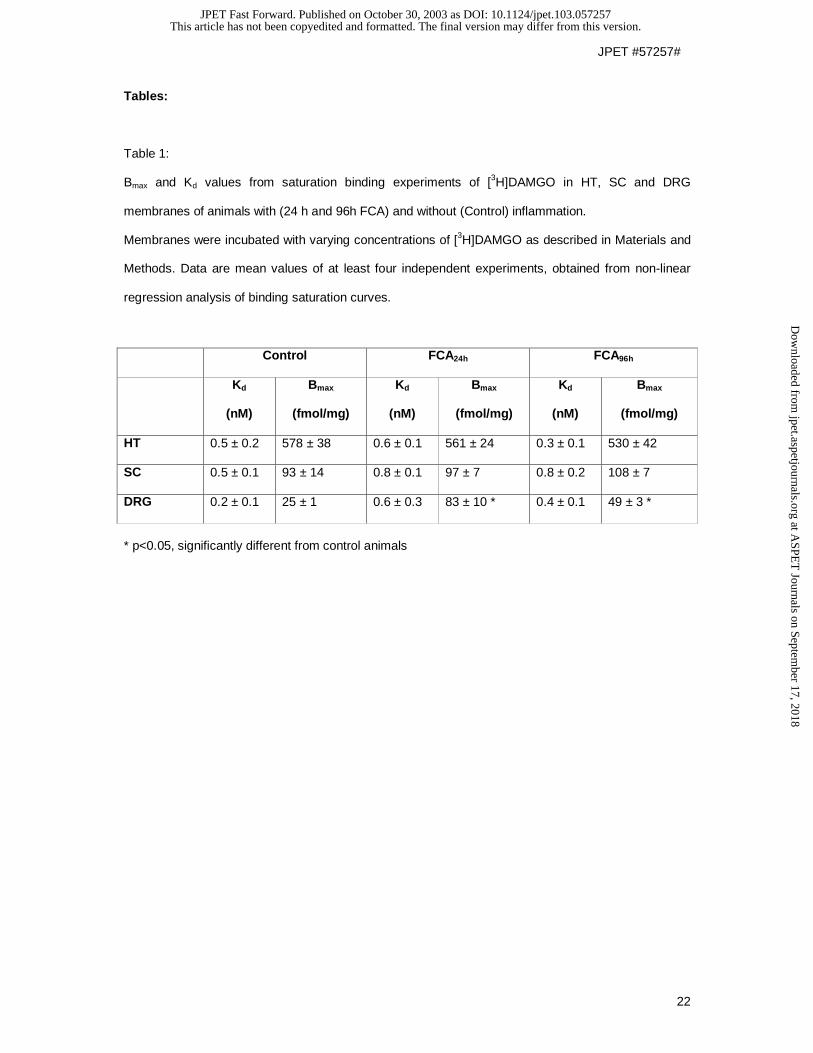
Table 1:
Bmax and Kd values from saturation binding experiments of [3H]DAMGO in HT, SC and DRG
membranes of animals with (24 h and 96h FCA) and without (Control) inflammation.
Membranes were incubated with varying concentrations of [3H]DAMGO as described in Materials and
Methods. Data are mean values of at least four independent experiments, obtained from non-linear
regression analysis of binding saturation curves.
Control FCA24h FCA96h
Kd
(nM)
Bmax
(fmol/mg)
Kd
(nM)
Bmax
(fmol/mg)
Kd
(nM)
Bmax
(fmol/mg)
HT 0.5 ± 0.2 578 ± 38 0.6 ± 0.1 561 ± 24 0.3 ± 0.1 530 ± 42
SC 0.5 ± 0.1 93 ± 14 0.8 ± 0.1 97 ± 7 0.8 ± 0.2 108 ± 7
DRG 0.2 ± 0.1 25 ± 1 0.6 ± 0.3 83 ± 10 * 0.4 ± 0.1 49 ± 3 *
* p<0.05, significantly different from control animals
This article has not been copyedited and formatted. The final version may differ from this version.JPET Fast Forward. Published on October 30, 2003 as DOI: 10.1124/jpet.103.057257
at ASPE
T Journals on Septem
ber 17, 2018jpet.aspetjournals.org
Dow
nloaded from
JPET #57257#
23
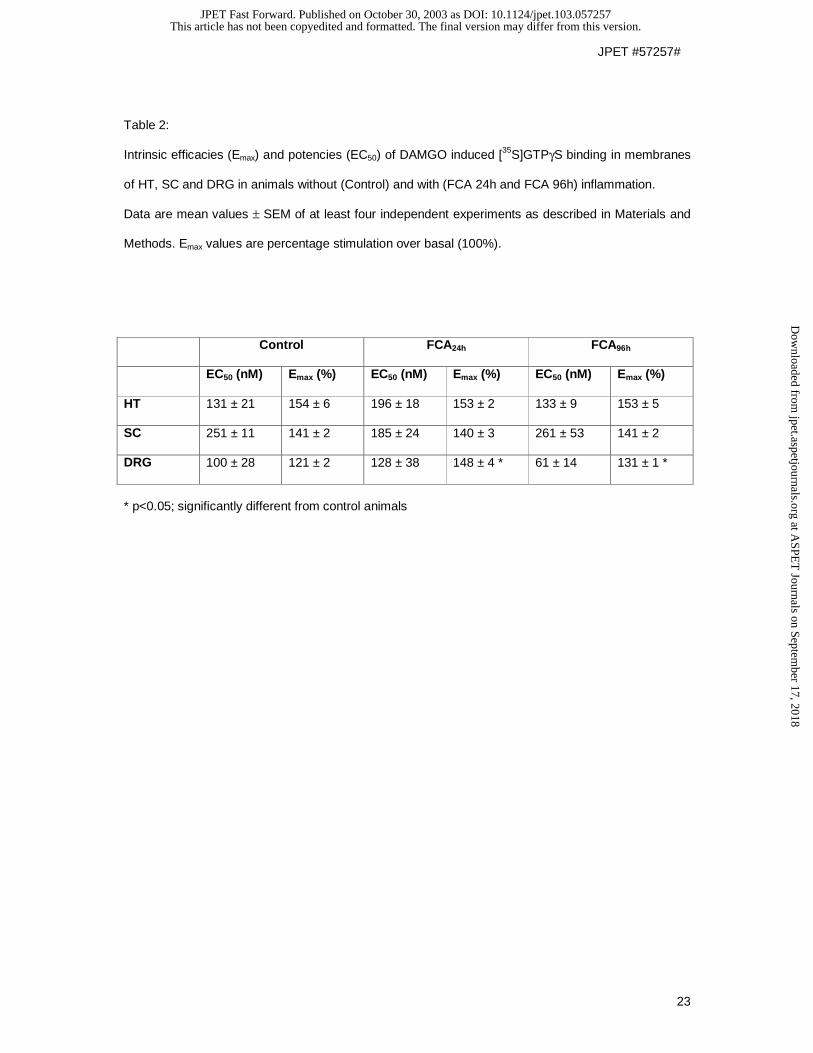
Table 2:
Intrinsic efficacies (Emax) and potencies (EC50) of DAMGO induced [35S]GTPγS binding in membranes
of HT, SC and DRG in animals without (Control) and with (FCA 24h and FCA 96h) inflammation.
Data are mean values ± SEM of at least four independent experiments as described in Materials and
Methods. Emax values are percentage stimulation over basal (100%).
Control FCA24h FCA96h
EC50 (nM) Emax (%) EC50 (nM) Emax (%) EC50 (nM) Emax (%)
HT 131 ± 21 154 ± 6 196 ± 18 153 ± 2 133 ± 9 153 ± 5
SC 251 ± 11 141 ± 2 185 ± 24 140 ± 3 261 ± 53 141 ± 2
DRG 100 ± 28 121 ± 2 128 ± 38 148 ± 4 * 61 ± 14 131 ± 1 *
* p<0.05; significantly different from control animals
This article has not been copyedited and formatted. The final version may differ from this version.JPET Fast Forward. Published on October 30, 2003 as DOI: 10.1124/jpet.103.057257
at ASPE
T Journals on Septem
ber 17, 2018jpet.aspetjournals.org
Dow
nloaded from
JPET #57257#
24
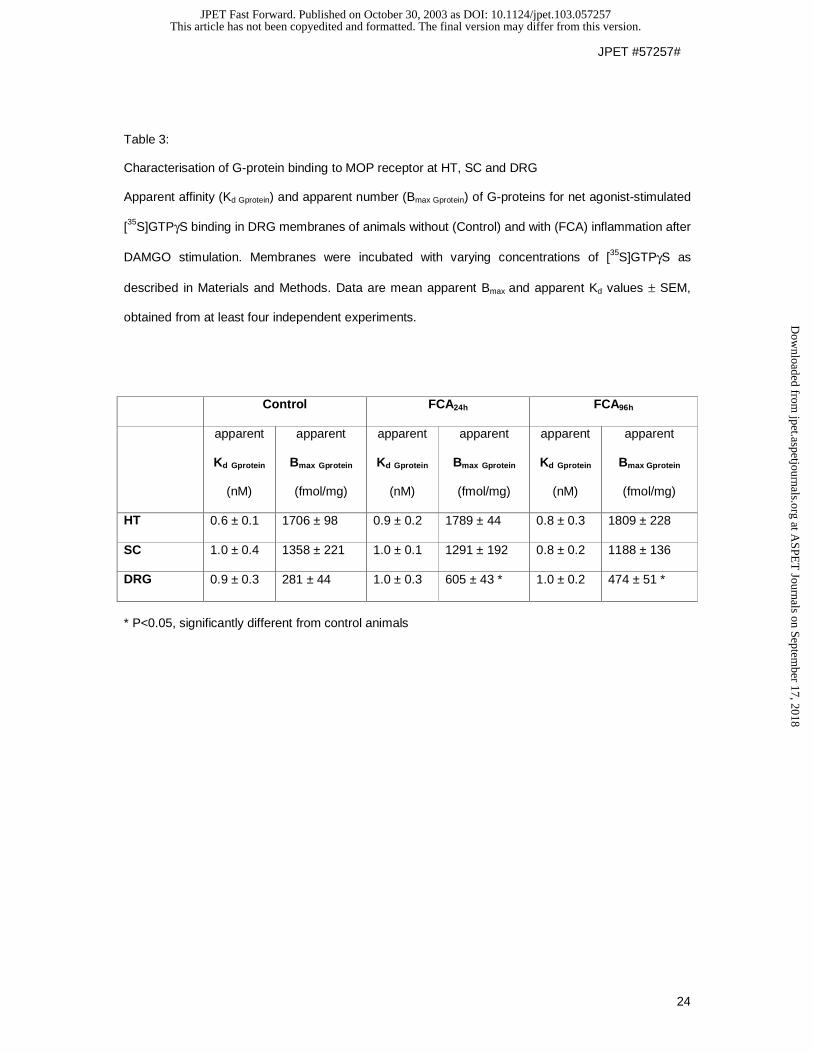
Table 3: Characterisation of G-protein binding to MOP receptor at HT, SC and DRG Apparent affinity (Kd Gprotein) and apparent number (Bmax Gprotein) of G-proteins for net agonist-stimulated
[35S]GTPγS binding in DRG membranes of animals without (Control) and with (FCA) inflammation after
DAMGO stimulation. Membranes were incubated with varying concentrations of [35S]GTPγS as
described in Materials and Methods. Data are mean apparent Bmax and apparent Kd values ± SEM,
obtained from at least four independent experiments.
Control FCA24h FCA96h
apparent
Kd Gprotein
(nM)
apparent
Bmax Gprotein
(fmol/mg)
apparent
Kd Gprotein
(nM)
apparent
Bmax Gprotein
(fmol/mg)
apparent
Kd Gprotein
(nM)
apparent
Bmax Gprotein
(fmol/mg)
HT 0.6 ± 0.1 1706 ± 98 0.9 ± 0.2 1789 ± 44 0.8 ± 0.3 1809 ± 228
SC 1.0 ± 0.4 1358 ± 221 1.0 ± 0.1 1291 ± 192 0.8 ± 0.2 1188 ± 136
DRG 0.9 ± 0.3 281 ± 44 1.0 ± 0.3 605 ± 43 * 1.0 ± 0.2 474 ± 51 *
* P<0.05, significantly different from control animals
This article has not been copyedited and formatted. The final version may differ from this version.JPET Fast Forward. Published on October 30, 2003 as DOI: 10.1124/jpet.103.057257
at ASPE
T Journals on Septem
ber 17, 2018jpet.aspetjournals.org
Dow
nloaded from
0 1 2 3 4 50
250
500
750
ControlFCA 24h
FCA 96h
A
[3H]DAMGO (nM)
[3 H]D
AM
GO
-Bo
un
dfm
ol/m
g p
rote
in
0 1 2 3 4 50
50
100
150
ControlFCA 24hFCA 96h
B
[3H]DAMGO (nM)
[3 H]D
AM
GO
-Bo
un
dfm
ol/m
g p
rote
in
0.0 0.5 1.0 1.5 2.0 2.50
25
50
75
100
Control
FCA 24h
FCA 96h
C
[3H]DAMGO (nM)
[3 H]D
AM
GO
-Bo
un
dfm
ol/m
g p
rote
in
Fig.1 JPET #57257#This article has not been copyedited and formatted. The final version may differ from this version.JPET Fast Forward. Published on October 30, 2003 as DOI: 10.1124/jpet.103.057257
at ASPE
T Journals on Septem
ber 17, 2018jpet.aspetjournals.org
Dow
nloaded from
-12.5 -10.0 -7.5 -5.0 -2.5
100
125
150
175
ControlFCA 24hFCA 96h
A
Log DAMGO (M)
[35S
]GT
PγS
Bo
un
d(%
bas
elin
e)
-12.5 -10.0 -7.5 -5.0 -2.5
100
125
150
175
ControlFCA 24hFCA 96h
B
Log DAMGO (M)
[35S
]GT
PγS
Bo
un
d(%
bas
elin
e)
-12.5 -10.0 -7.5 -5.0 -2.5
100
125
150
175
Control
FCA 24h
FCA 96h
C
Log DAMGO (M)
[35S
]GT
PγS
Bo
un
d(%
bas
elin
e)
Fig.2 JPET #57257#This article has not been copyedited and formatted. The final version may differ from this version.JPET Fast Forward. Published on October 30, 2003 as DOI: 10.1124/jpet.103.057257
at ASPE
T Journals on Septem
ber 17, 2018jpet.aspetjournals.org
Dow
nloaded from
0.0 0.5 1.0 1.5 2.0 2.50
500
1000
1500 ControlFCA 96h
FCA 24h
A
[35S] GTP γ S (nM)
[35S
] G
TP
γ S
-Bo
un
dfm
ol/m
g P
rote
in
0.0 0.5 1.0 1.5 2.0 2.50
250
500
750
1000
1250
ControlFCA 24hFCA 96h
B
[35S] GTP γ S (nM)
[35S
] GT
Pγ
S -B
ou
nd
fmol
/mg
Pro
tein
0.0 0.5 1.0 1.5 2.0 2.50
100
200
300
400
500
FCA 96h
Control
FCA 24h
C
[35S] GTP γ S (nM)
[35S
] GT
Pγ
S -B
ou
nd
fmol
/mg
Pro
tein
Fig.3 JPET #57257#This article has not been copyedited and formatted. The final version may differ from this version.JPET Fast Forward. Published on October 30, 2003 as DOI: 10.1124/jpet.103.057257
at ASPE
T Journals on Septem
ber 17, 2018jpet.aspetjournals.org
Dow
nloaded from
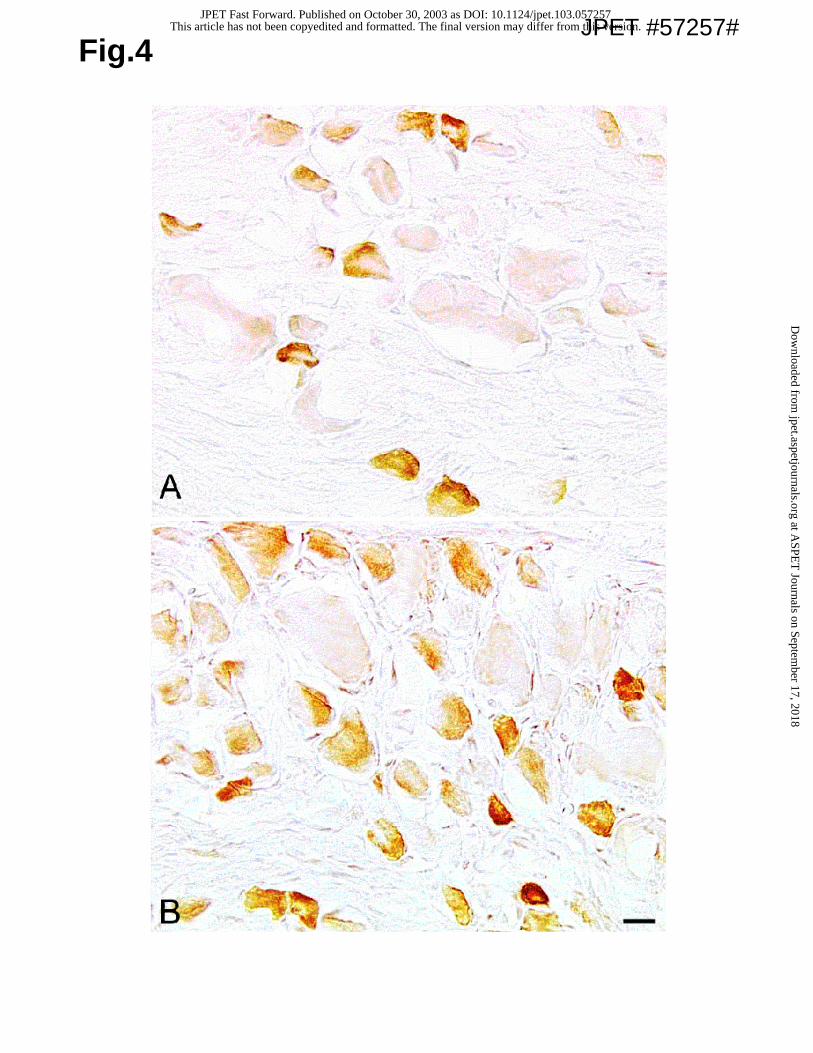
Fig.4JPET #57257#This article has not been copyedited and formatted. The final version may differ from this version.
JPET Fast Forward. Published on October 30, 2003 as DOI: 10.1124/jpet.103.057257 at A
SPET
Journals on September 17, 2018
jpet.aspetjournals.orgD
ownloaded from