Embed Size (px)
Citation preview
p 8 c
Westinghouse Astronuclear Laboratory
E I E 1[
t
1 'I
W A N L-TME-1467 Ju 1 ~ 1 5 , 1 9 6 6
PERFORMANCE OF JPL TUBULAR THERMOELECTRIC MOOULE(TEST ASSEMBLY 9 0 9 E 6 8 7 )
C o n t r ac t CU -38 8002
This work was p e r f o n d for die Jet Propulsion Labontory, Czliforria Institute of Technology, sponsored by the N?tional Aeronautics 4 Space A&t.t&on mda Contract NB7-100.
Westinghouse Astronucloar Laboratory
P.O. Box 10864 Pittsburgh, Pa. 15236
l INFORMATION CATEGORY 1
I AUTHORIZED CLASSIFIER DATE I
https://ntrs.nasa.gov/search.jsp?R=19670003610 2018-07-06T23:03:28+00:00Z
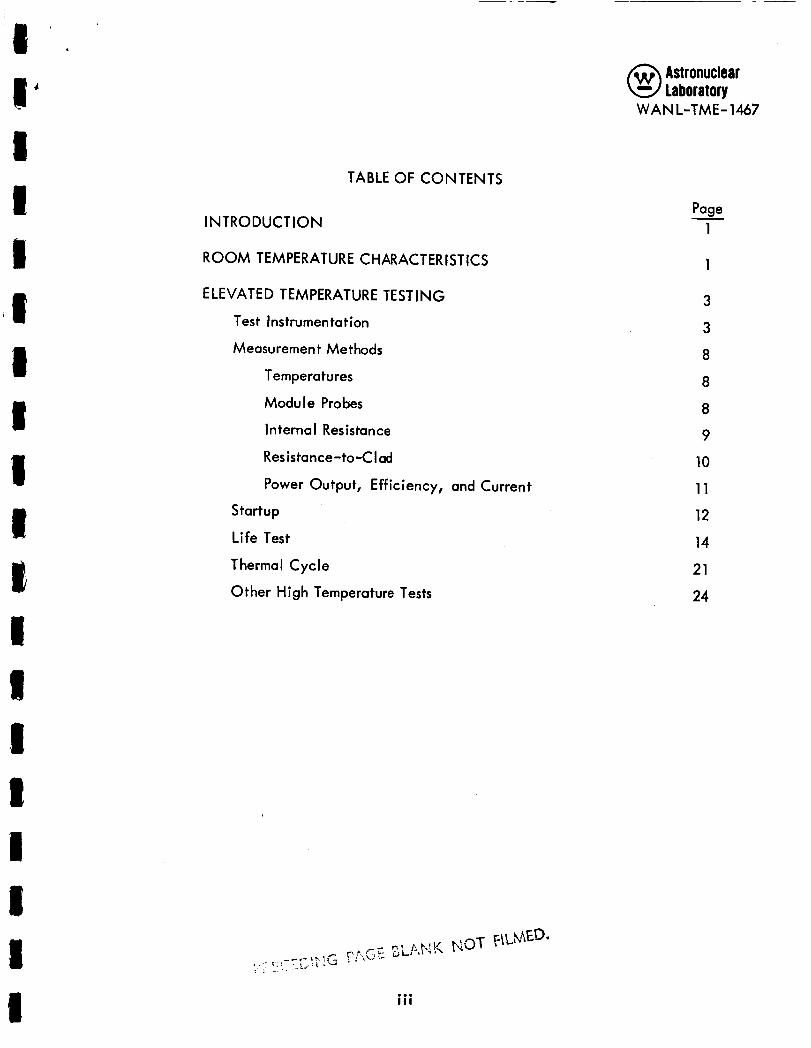
TABLE OF CONTENTS
I NTRODUCT ION
ROOM TEMPER AT URE C H AR ACT ER I ST IC S
ELEVATED TEMPERATURE TESTING
Test Instrumentation
Measurement Methods
Temperatures
Modu I e Probes
In terna I Resistance
Resistance-to-C I ad
Power Output, Efficiency, and Current
Startup
Life Test
Thermal Cycle
Other High Temperature Tests
... 1 1 1
Astronuclear Laboratory
WANL-TME- 1467
Page 1 -
1
3
3
8
8
8
9
10
1 1
12
14
21
24
Figure
1
2
3
4
5
6
7
8
9
10
11
12
13
14
15
16
17
18
19
20
21
22
Astronuclear laboratory
WAN L-TME- 1467
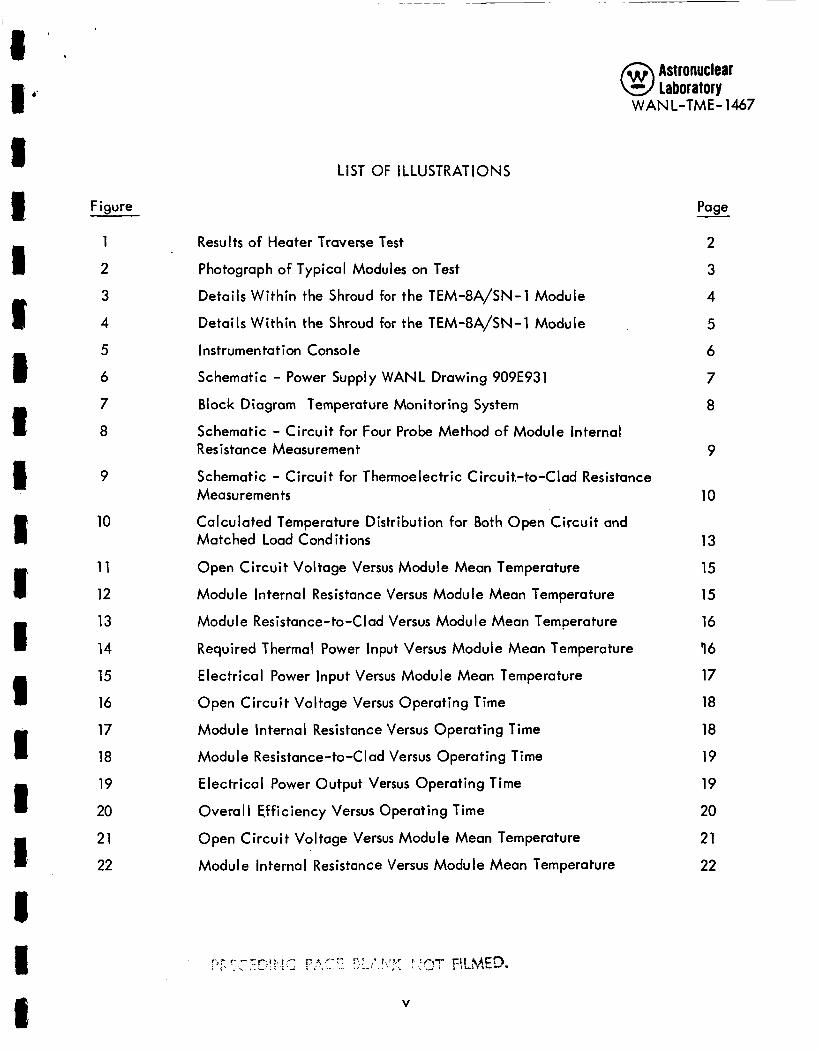
LIST OF ILLUSTRATIONS
Results of Heater Traverse Test
Photograph of Typical Modules on Test
Details Within the Shroud for the TEM-8A/SN-1 Module
Details Within the Shroud for the TEM-8A/SN-1 Module
Instrumen tat ion Console
Schematic - Power Supply WANL Drawing 909E931
Block Diagram Temperature Monitoring System
Schematic - Circuit for Four Probe Method of Module Internal Resistance Measurement
Schematic - Circuit for Thermoelectric C ircui t,-to-C I ad Resistance Measurements
Calculated Temperature Distribution for Both Open Circuit and Matched Load Conditions
Open Circuit Voltage Versus Module Mean Temperature
Module Internal Resistance Versus Module Mean Temperature
Module Resistance-to-Clad Versus Module Mean Temperature
Required Thermal Power Input Versus Module Mean Temperature
Electrical Power Input Versus Module Mean Temperature
Open Circuit Voltage Versus Operating Time
Module Internal Resistance Versus Operating Time
Module Resistance-to-C I ad Versus Operating Time
Electrical Power Output Versus Operating Time
Overal I Efficiency Versus Operating Time
Open Circuit Voltage Versus Module Mean Temperature
Module Internal Resistance Versus Module Mean Temperature
V
Page
2
3
4
5
6
7
8
-
9
10
13
15
15
16
16
17
18
18
19
19
20
21
22
Astronuclear laboratory
WANL-TME-1467
LIST OF ILLUSTRATIONS (CONTINUED)
Figure
23
24
25 26
Table
Module Resistance-to-Clad Versus Module Mean Temperature
Required Thermal Power Input Versus Module Mean Temperature
Electrical Power Input Versus Module Mean Temperature
Post Seasoning Module Performance Overall Efficiency vs Operating Time
LIST OF TABLES
Room Temperature Resistance Measurements
Selected Performance Parameters Calculated for First Point at Life Test Conditions
Measured Resistance Values at Selected Points in Testing History
v i
Page
22
23
23
25
Page
1
-
13
24
Astronuclear Laboratory
L-TME - 1467
Circuit (ohms)
,112
. lo2
. lo2
.125
.127
INTRODUCTION
Circuit to Clad (ohms)
6968
6758
6132
6367
6272
This report documents test data taken on a tubular thermoelectric module produced
by Westinghouse Astronuclear Laboratory for the Jet Propulsion Laboratory under Jet Propulsion
Laboratory
909E686GOlA It i s further identified by the code TEM-8A, Serial Number 1. The details
of i t s design and fabrication were previously described in WAN L-TME-1438, Design Analysis
of JPL Tubular Thermoelectric Module.
contract CU-388002. The design of the module i s defined by WANL drawing
ROOM TEMPERATURE CHARACTERISTICS
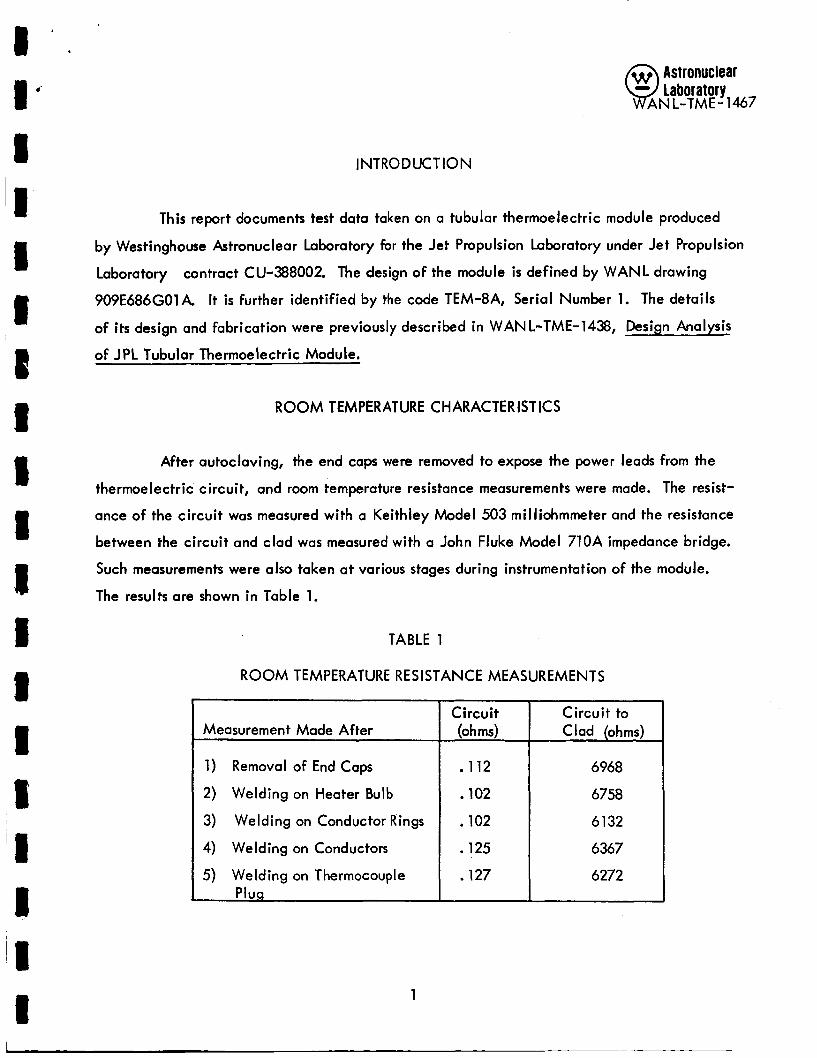
After autoclaving, the end caps were removed to expose the power leads from the
thermoelectric circuit, and room temperature resistance measurements were made. The resist-
ance of the circuit was measured with a Keithley Model 503 milliohmmeter and the resistance
between the circuit and clad was measured with a John Fluke Model 710A impedance bridge.
Such measurements were also taken at various stages during instrumentation of the module.
The results are shown in Table 1.
TABLE 1
ROOM TEMPERATURE RE S I STANCE MEASUR EM EN T S
Measurement Made After
1) Removal of End Caps
2) Welding on Heater Bulb
3) Welding on Conductor Rings
4) Welding on Conductors
5) Welding on Thermocouple Plua
I 1
w Astronuclear 0 Laboratory W A N L -TME - 1 467
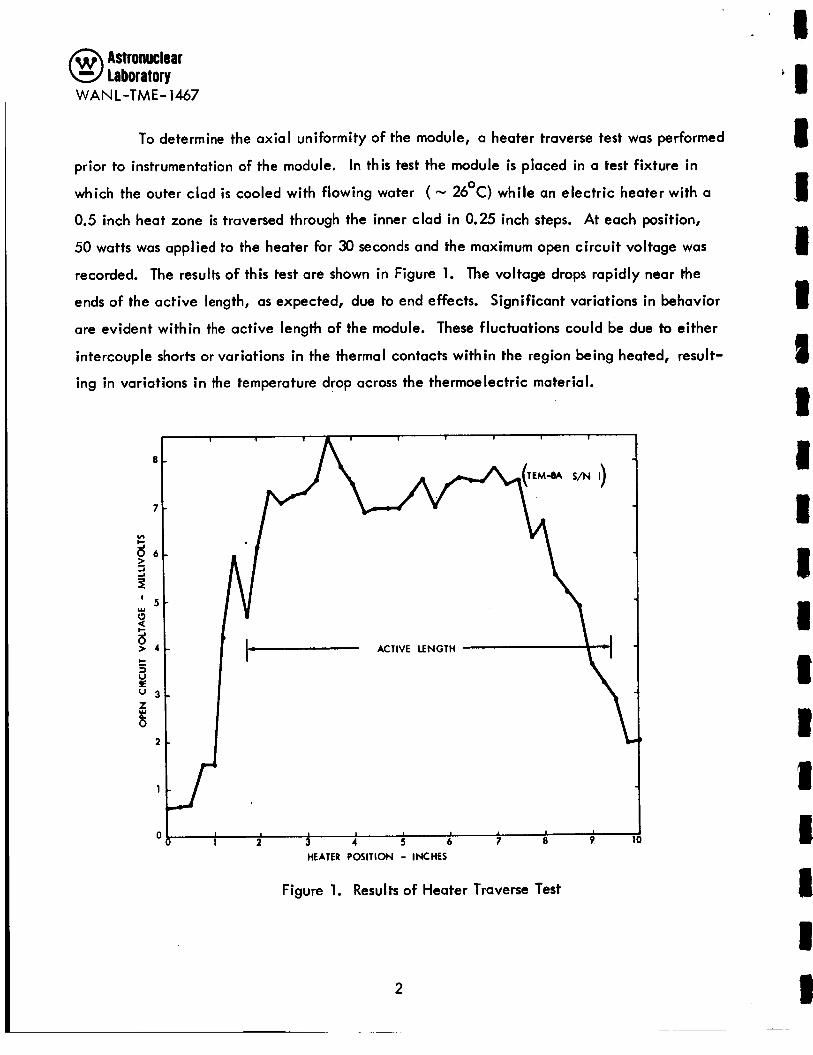
To determine the axial uniformity of the module, a heater traverse test was performed
prior to instrumentation of the module. In this test the module i s placed in a test fixture in
which the outer clad i s cooled with flowing water ( - 26OC) while an electric heater with a
0.5 inch heat zone i s traversed through the inner clad in 0.25 inch steps. At each position,
50 watts was applied to the heater for 30 seconds and the maximum open circuit voltage was
recorded. The results of this test are shown in Figure 1. The voltage drops rapidly near the
ends of the active length, as expected, due to end effects. Significant variations in behavior
are evident within the active length of the module. These fluctuations could be due to either
intercouple shorts or variations in the thermal contacts within the region being heated, result-
ing in variations i n the temperature drop across the thermoelectric material.
I
1 1 I 1 I 2 3 4 5 6 7 8 9 10 0
HEATER POSITION - INCHES
Figure 1. Results of Heater Traverse Test
2
Ast ronuclear laboratory
WANL-TME- 1467
E LEV ATE D TEMPER AT URE TEST IN G
TEST INSTRUMENTATION
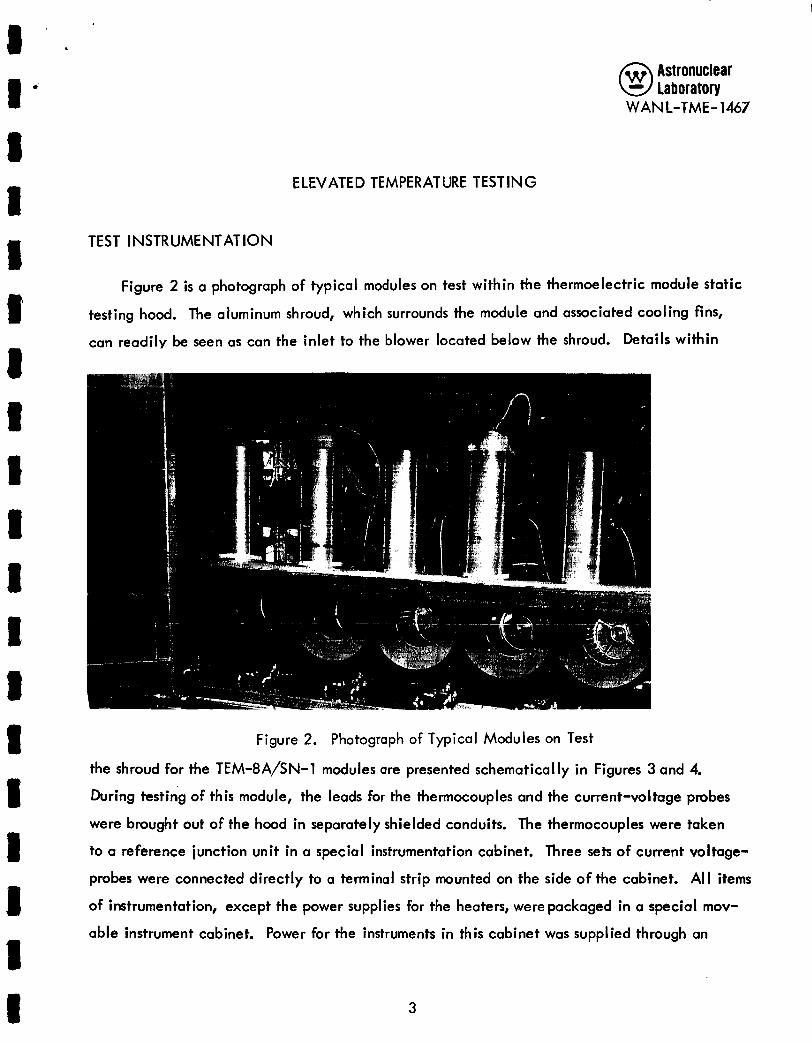
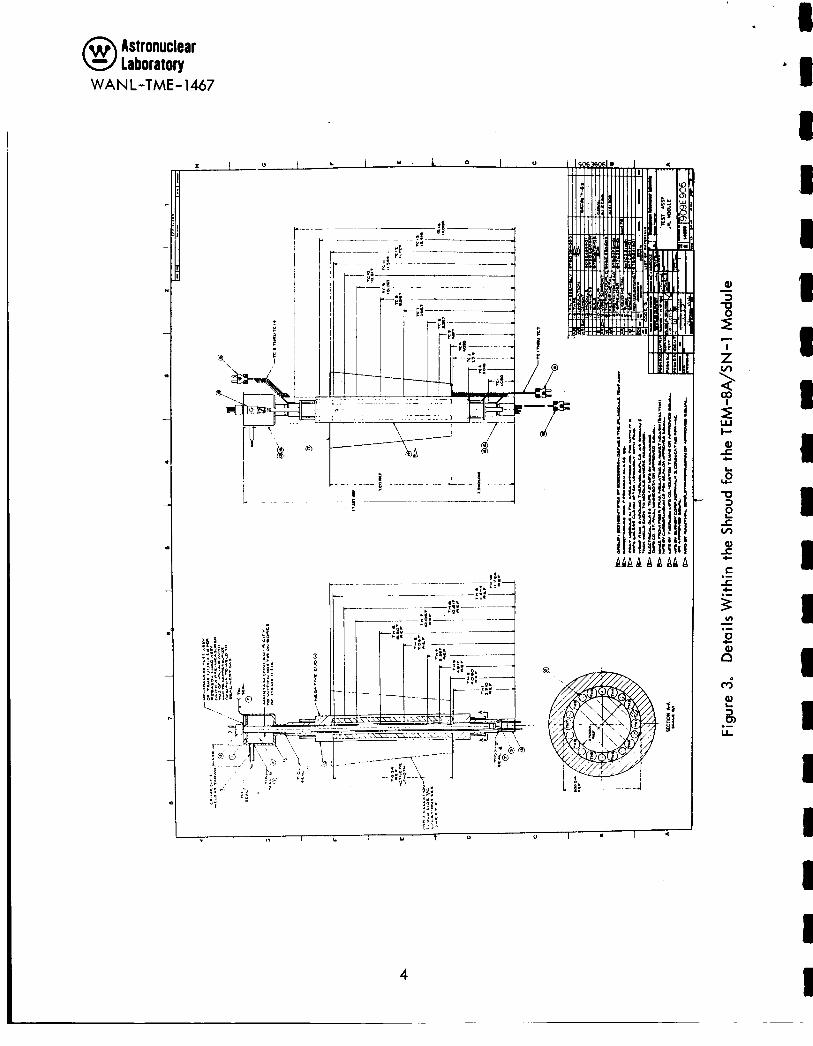
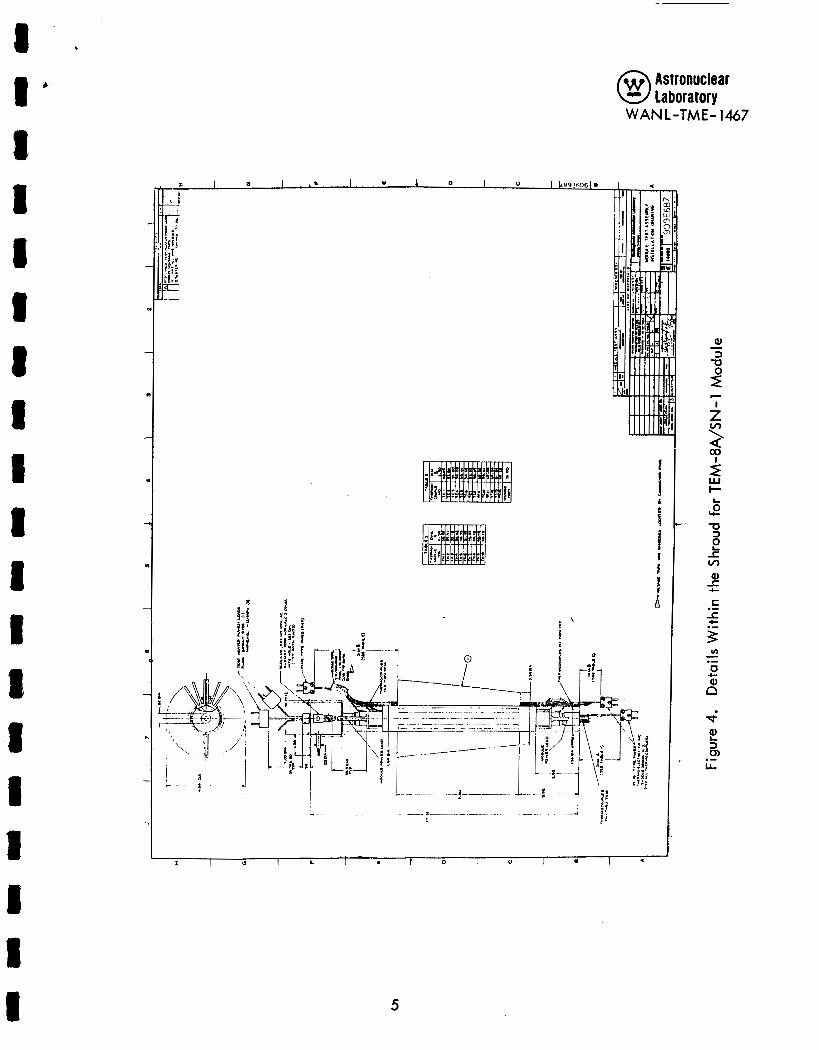
Figure 2 i s a photograph of typical modules on test within the thermoelectric module static
testing hood. The aluminum shroud, which surrounds the module and associated cooling fins,
can readily be seen as can the inlet to the blower located below the shroud. Details within
Figure 2. Photograph of Typical Modules on Test
the shroud for the TEM-8A/SN-1 modules are presented schematically in Figures 3 and 4.
During testing of this module, the leads for the thermocouples and the current-voltage probes
were brought out of the hood in separately shielded conduits. The thermocouples were taken
to a reference junction unit in a special instrumentation cabinet. Three sets of current voltage-
probes were connected directly to a terminal strip mounted on the side of the cabinet. A l l items
of instrumentation, except the power supplies for the heaters, were packaged in a special mov-
able instrument cabinet. Power for the instruments in this cabinet was supplied through an
3
Astronuclear @ Laboratory WANL-TME- 1467
Y. I V I
r -
I I I I
.-
AAn A A A A A A
I I L I t 0 I U I m I <
4
c Q)
f L
Y 0
Q)
f
3 v) - .- e
m“
8
. Astronuclear laboratory
WANL-TME- 1467
I i 0 I L 1 0 I U I m I <
5
Astronudear laboratory
WANL-TME-1467
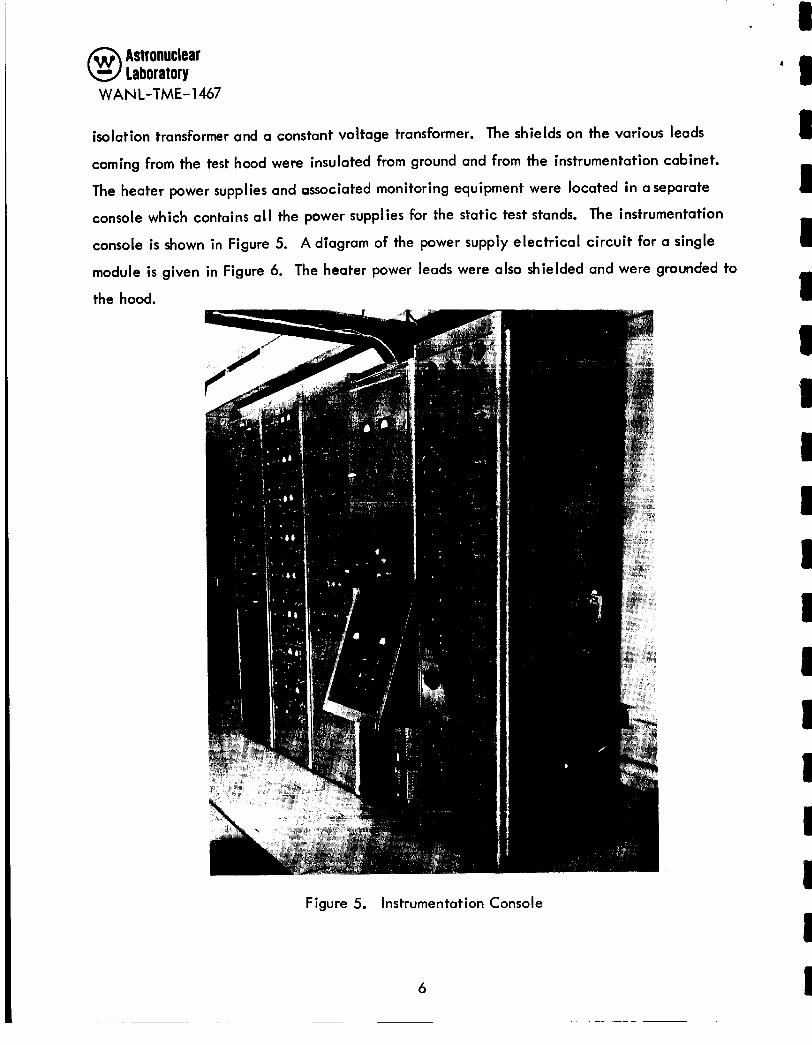
isolation transformer and a constant vollage transformer. The shields on the various leads
coming from the test hood were insulated from ground and from the instrumentation cabinet.
The heater power supplies and associated monitoring equipment were located in a separate
console which contains a l l the power supplies for the static test stands. The instrumentation
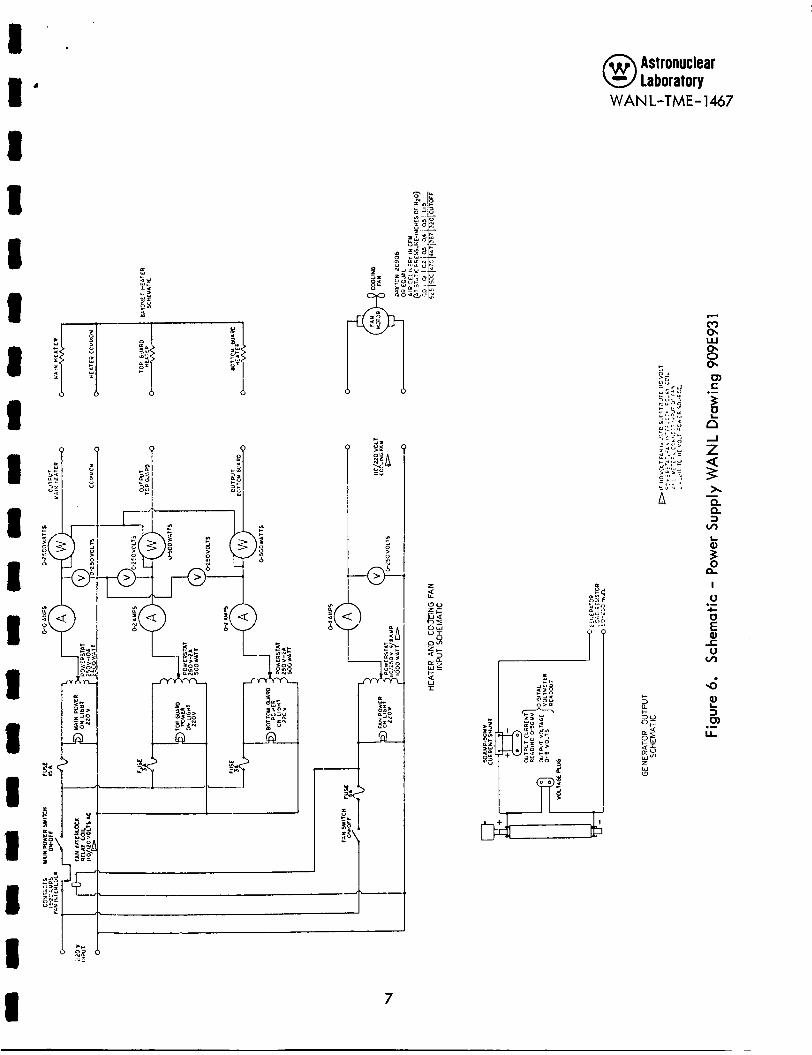
console i s shown in Figure 5. A diagram of the power supply electrical circuit for a single
module i s given in Figure 6. The heater power leads were also shielded and were grounded to
the hood.
Figure 5. Instrumentation Console
6
~
1
1
1 I 1
Astronuclear laboratory
WANL-TME-1467
I
3
I t
1 ; P
c m OI
I
0 .-
I- 3 a
7
Astronuclear laboratory
WANL-TME-1467
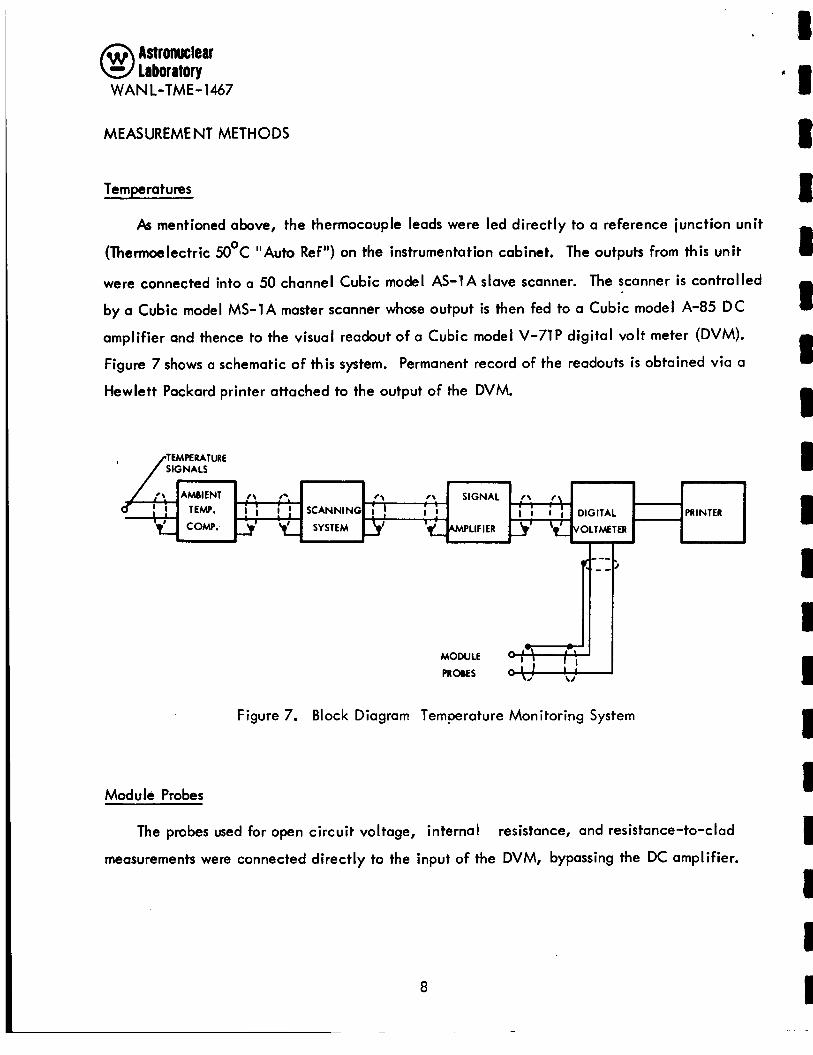
MEASUREMENT METHODS
Temperatures
As mentioned above, the thermocouple leads were led directly to a reference junction unit
(Thermoelectric 50°C "Auto Ref") on the instrumentation cabinet. The outputs from this unit
were connected into a 50 channel Cubic model AS-1 A slave scanner. The scanner i s control led
by a Cubic model MS-1A master scanner whose output is then fed to a Cubic model A-85 DC
amplifier and thence to the visual readout of a Cubic model V-71P digital volt meter (DVM).
Figure 7 shows a schematic of this system. Permanent record of the readouts i s obtained via a
Hewlett Packard printer attached to the output of the DVM.
TEMPERATURE SIGNALS
' / .
MODULE
P R O M S
Figure 7. Block Diagram Temperature Monitoring System
Module Probes
The probes used for open circuit voltage, internal resistance, and resistance-to-clad
measurements were connected directly to the input of the DVM, bypassing the DC amplifier.
8
I ' I 8 I I 1 1 I I I I I I I I 1 1 I 1
Astronuclear Laboratory
W A N L-TME- 1467
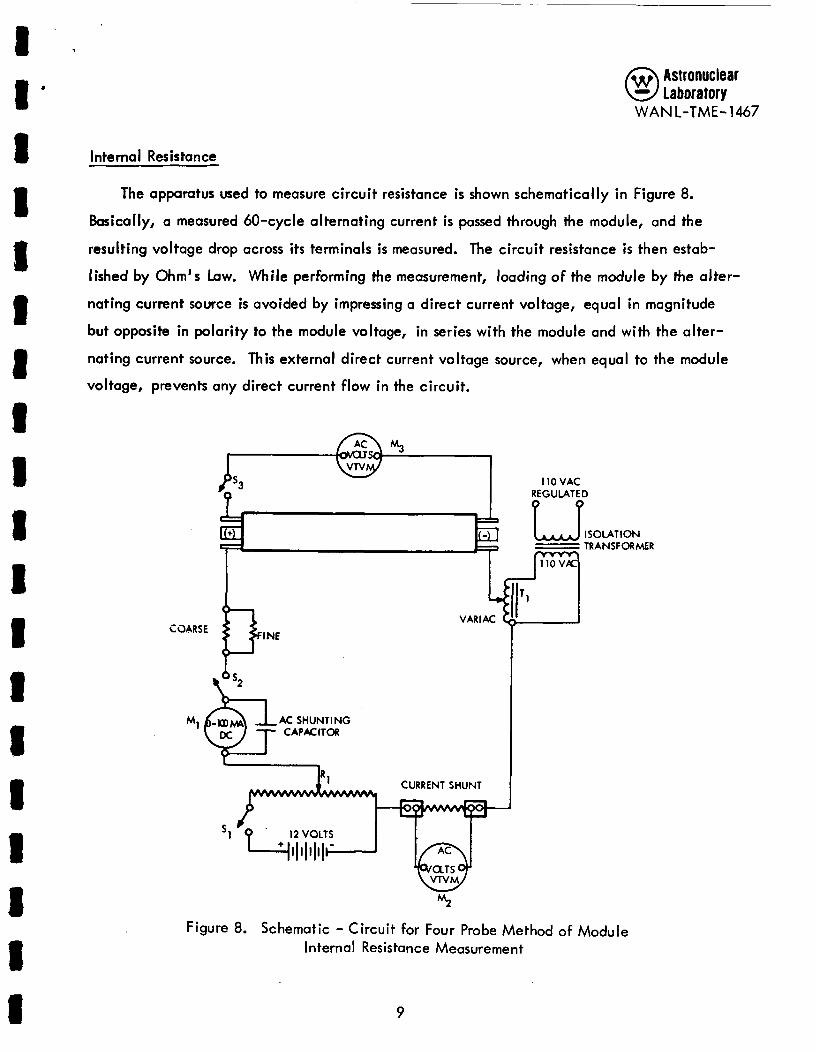
I nte ma I Resistance
The apparatus used to measure circuit resistance i s shown schematically in Figure 8.
Basically, a measured 60-cycle alternating current i s passed through the module, and the
resulting voltage drop across i t s terminals i s measured. The circuit resistance i s then estab-
lished by Ohm's Law. While performing the measurement, loading of the module by the alter-
nating current source i s avoided by impressing a direct current voltage, equal in magnitude
but opposite in polarity to the module voltage, in series wi th the module and wi th the alter-
nating current source. This external direct current voltage source, when equal to the module
voltage, prevents any direct current flow in the circuit.
I NE COARSE
AC SHUNTING M1 @= CAPKITOR
VARIAC Li
CURRENT SHUNT
VTVM
Mz
1 IO VAC REGULATED
I I
Figure 8. Schematic - Circuit for Four Probe Method of Module Internal Resistance Measurement
9
Laboratory WAN L-TME- 1467
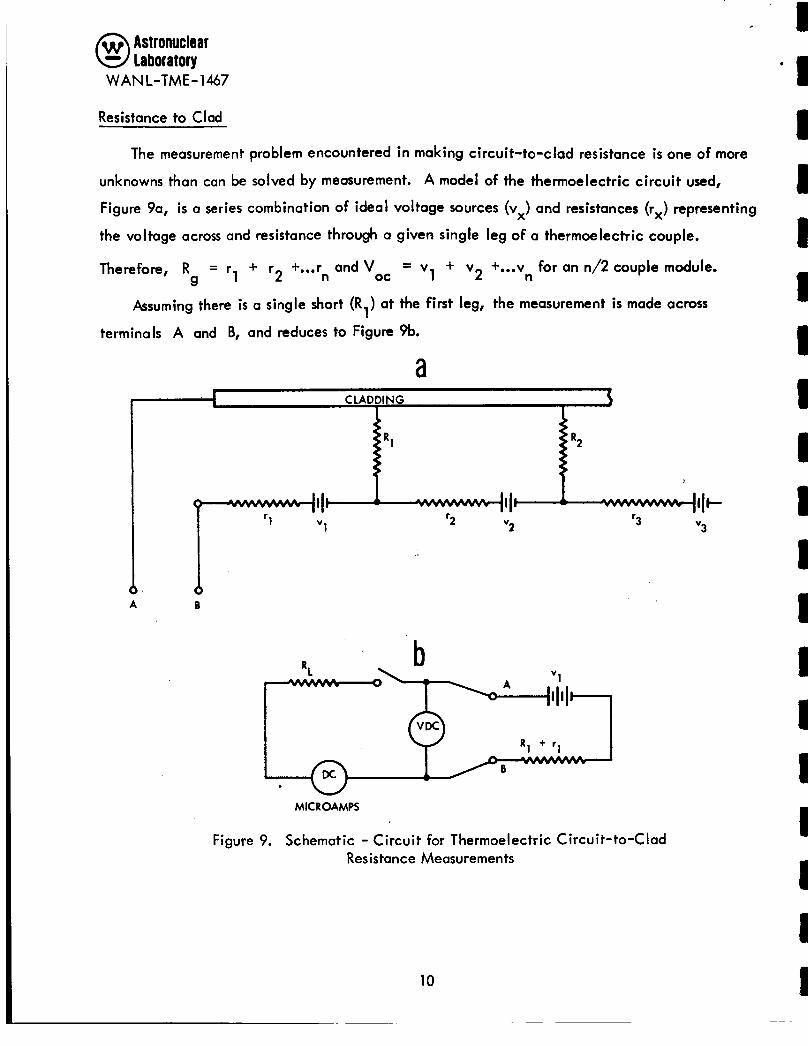
Resistance to Clad
The measurement problem encountered i n making circuit-to-clad resistance is one of more
unknowns than can be solved by measurement. A model of the thermoelectric circuit used,
Figure 9a, i s a series combination of ideal voltage sources (v,) and resistances (rx) representing
the voltage across and resistance through a given single leg of a thermoelectric couple.
The refore, R g
- + - '1 +... r and V - '2 n oc - v1 + v2 +... v for an n/2 couple module.
n
Assuming there i s a single short (R1) at the first leg, the measurement i s made acmss
terminals A and B, and reduces to Figure 9b.
a CLADDING I
R2
W l l + v3 '3
111 v2
A B
MICROAMPS
Figure 9. Schematic - Circuit for Thermoelectric Circuit-to-Clad Resistance Measurements
10
I ' 1 I I I 1 1 1 I 1 1 1 I 1 I 1 I I 1
Astronuclear laboraton
WANL-TME-1467
The resistance R + r i s calculated from Ohm's law 1 1
where:
v1 (4 = voltage across A and B with no load. 8 L' v1 (L) = voltage across A and B when loaded with the resistor R
= load current flowing in the circuit. IL
Normally, R >> r 1 1 and thus (Rl + rl) R1 which i s then taken as the leakage resist-
ance circuit to clad. @ 1 I I
When multiple leakage paths from circuit to clad occur, the analysis i s more complex,
however, the same method of measurement i s used and the value obtained i s the effective
leakage resistance of the parallel resistances from circuit to clad, R C.
used successfully when the value of R is less than 500, 000 ohms. For higher values of R
the difference between v and v
now under investigation for measurements in the megohm range. As yet, no shorts have
This method has been
C'
i s not large enough to be detected. Other methods are C
oc L
developed where R < R c g'
Power Output, Efficiency and Current
Using the open circuit voltage, internal resistance and average hot and cold clad tempera-
tures measured by the above techniques, the electrical power output, P 'I, and the current, I, of the device were then calculated for matched load conditions to
the overall efficiency, e' 8
a
I 8
11
laboratory WAN L-TME - 1467
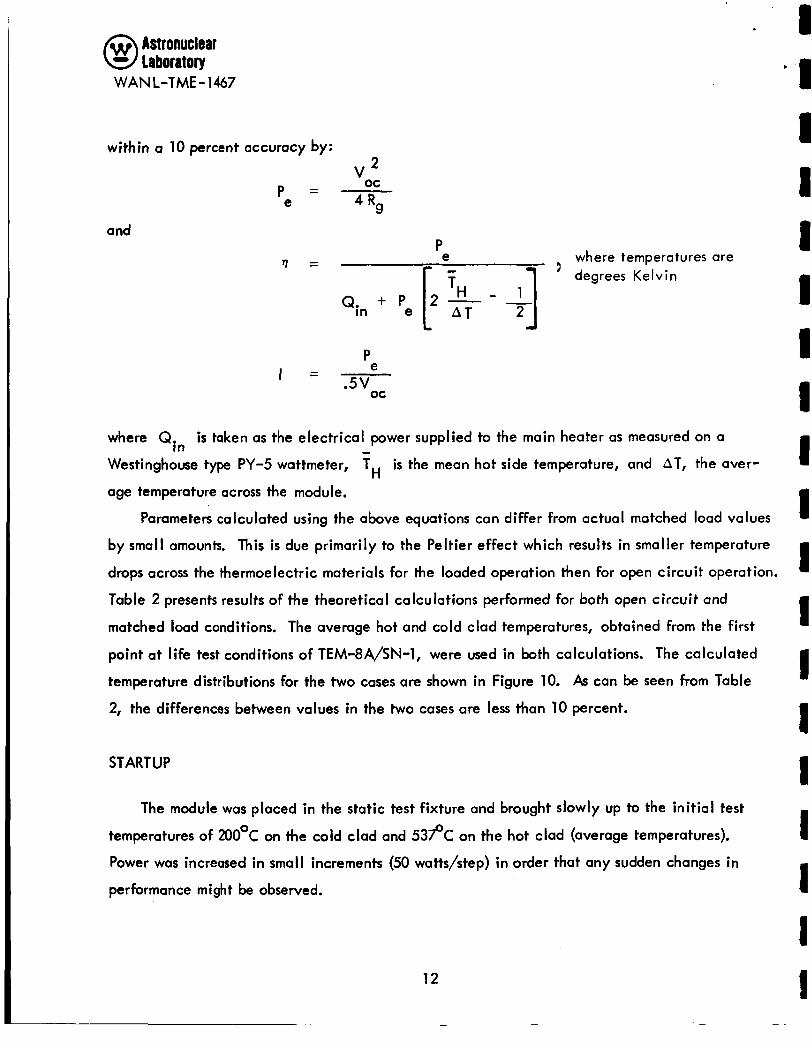
within a 10 percent accuracy by: V 2
e Rg
oc P =
and
e where temperatures are P
? = ' degrees Ke I v in
Q. in + P e [."-4 A T
e P
.5v oc
I =
where Qin i s taken as the electrical power supplied to the main heater as measured on a
Westinghouse type PY-5 wattmeter, TH i s the mean hot side temperature, and AT, the aver-
age temperature across the module.
-
Parameters calculated using the above equations can differ from actual matched load values
by small amounts. This i s due primarily to the Peltier effect which results in smaller temperature
drops across the thermoelectric materials for the loaded operation then for open circuit operation.
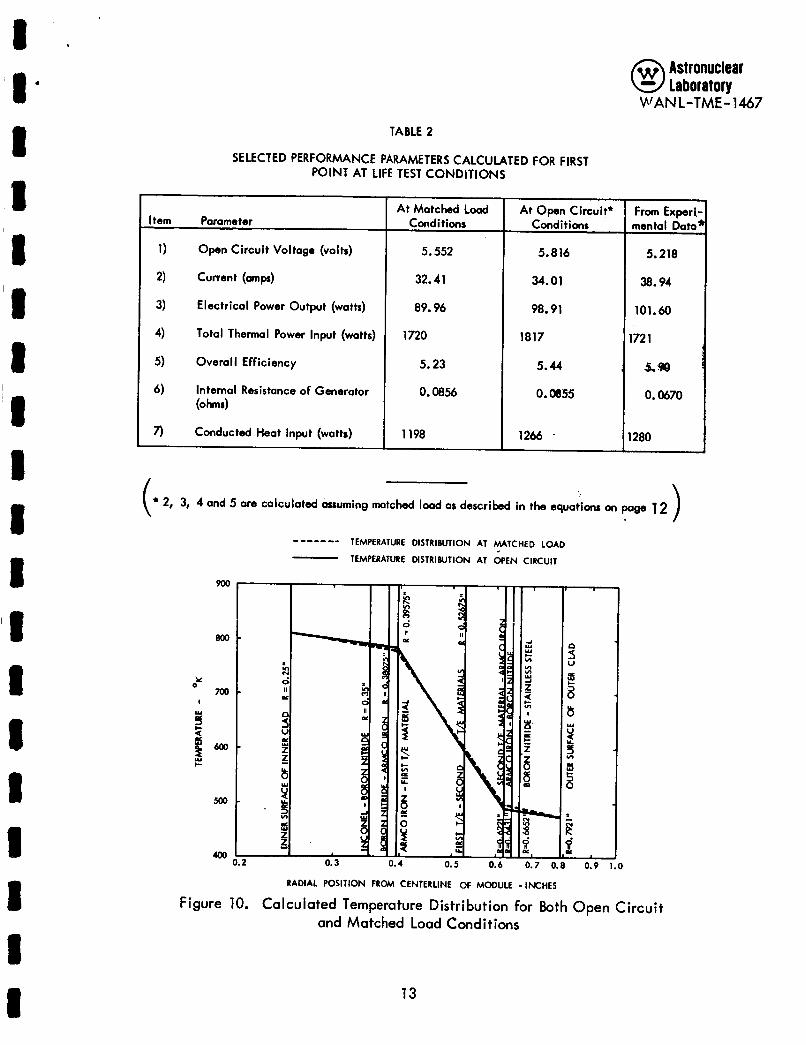
Table 2 presents results of the theoretical calculations performed for both open circuit and
matched load conditions. The average hot and cold clad temperatures, obtained from the first
point at life test conditions of TEM-8A/SN-l, were used in both calculations. The calculated
temperature distributions for the two cases are shown in Figure 10. As can be seen from Table
2, the differences between values in the two cases are less than 10 percent.
STARTUP
1
I 1 1 1 I 1 I 1 1 I
a
I The module was placed in the static test fixture and brought lowly up to the init ial test
temperatures of 200°C on the cold clad and 5 3 f C on the hot clad (average temperatures).
Power was increased in small increments (50 watts/step) in order that any sudden changes in
performance might be observed.
12
Astronuclear laboratory
WANL-TME- 1467
At Open Circuit* Conditions
TABLE 2
From Experi. mental Data:
SELECTED PERFORMANCE PARAMETERS CALCULATED FOR FIRST POINT AT LIFE TEST CONDITIONS
I
Item Parameter
1) Open Circuit Voltage (volts)
2) Current (amps)
3) Electrical Power Output (watts)
4)
5) Overall Efficiency
6) Internal Resistance of Generator
Total Thermal Power Input (watts)
(ohms)
7) Conducted Heat Input (watts)
5.218
38.94
101.60
172 1
0.0670
At Matched Load Conditions
5.552
32.41
89.96
1720
5.23
0.0856
1198
5.8 16
34.01
98.91
1817
5.44
0.0855
1266 . 1280
f
) \ * 2, 3, 4 and 5 are calculated assuming matched load as described in the equations on page 12
------- TEMPERATURE DISTRIBUTION AT MATCHED LOAD - TEMPERATURE MSTRlWTlON AT OPEN CIRCUIT
RADIAL POSITION FROM CENTERLINE of MODULE -INCHES
Figure 10. Calculated Temperature Distribution for Both Open Circuit and Matched Load Conditions
13
laboratory WANC-TME-1467
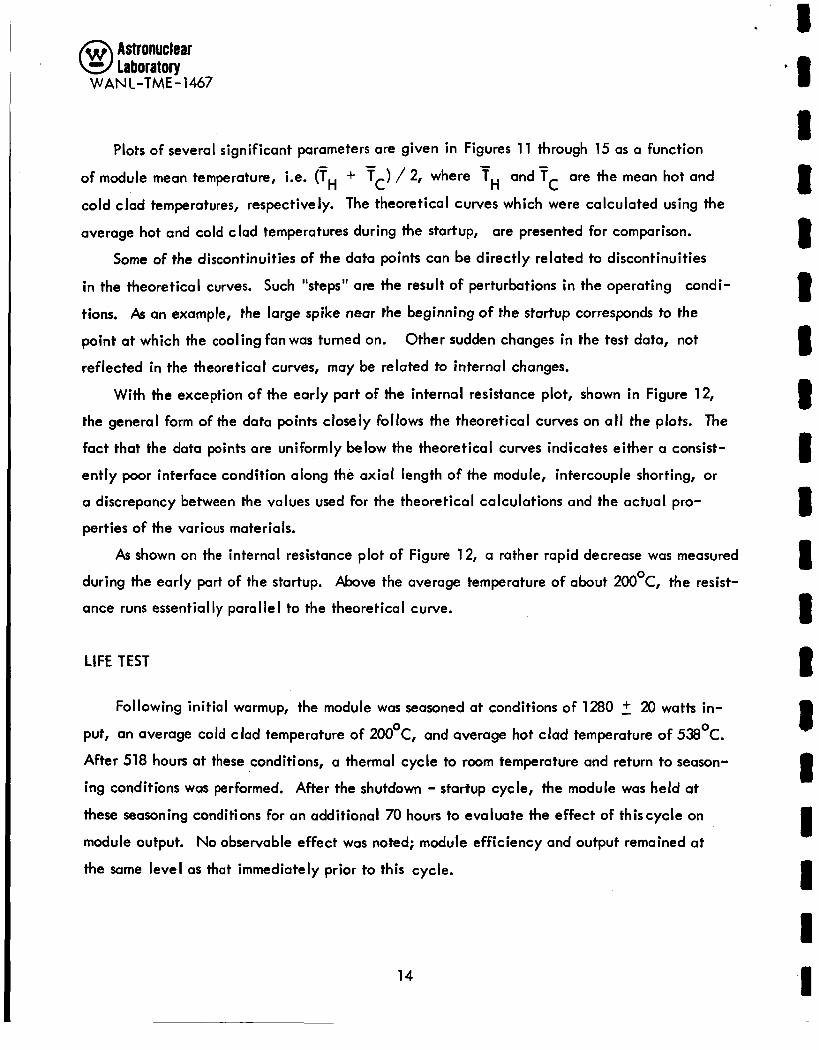
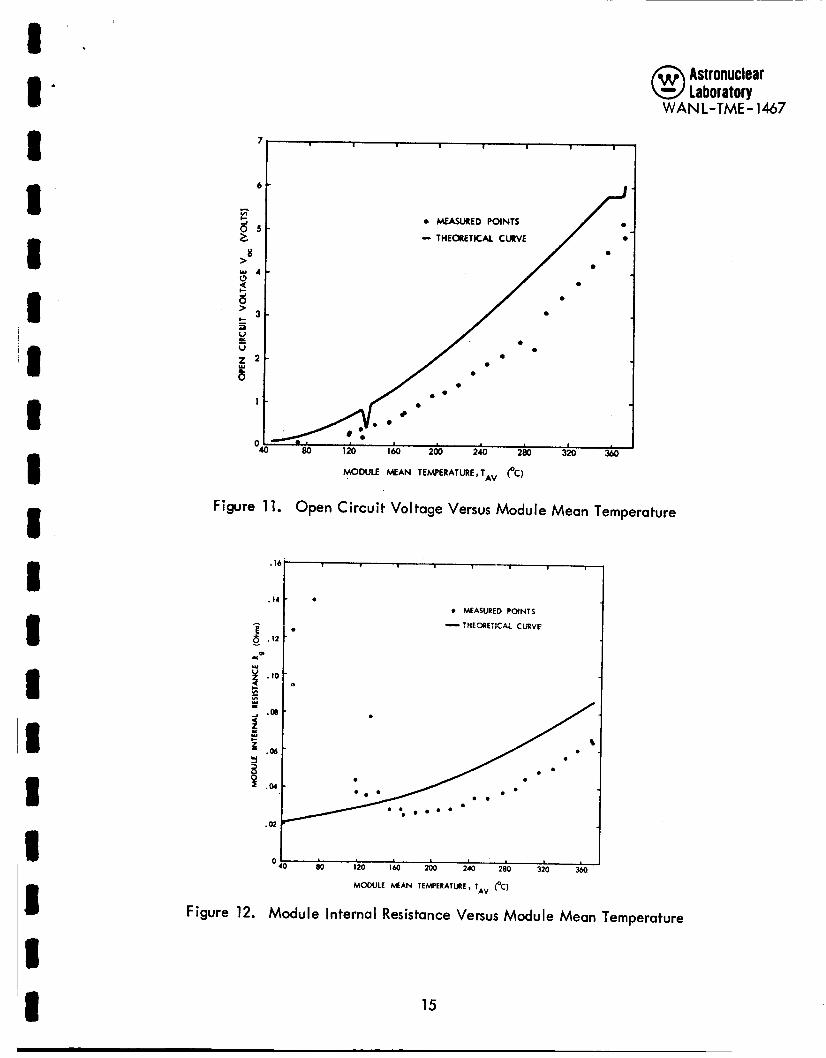
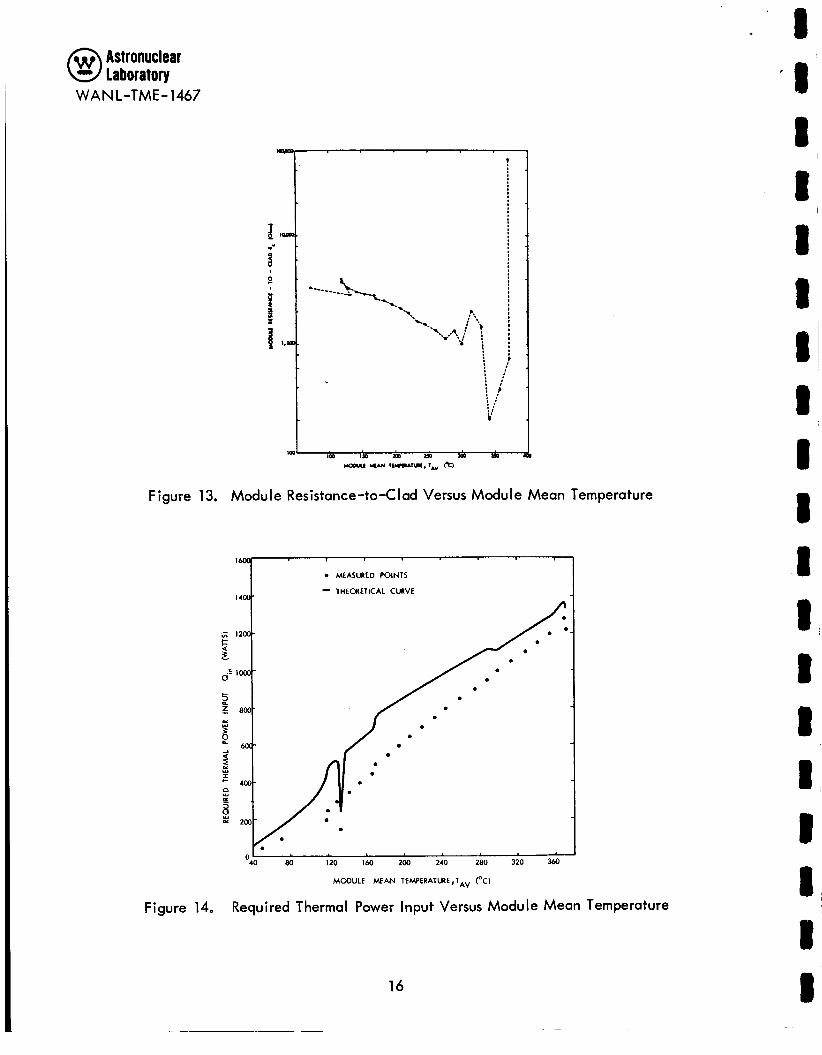
Plots of several significant parameters are given in Figures 11 through 15 as a function - - of module mean temperature, i.e. (T,, + Tc) / 2, where and TC are the mean hot and H cold clad temperatures, respectively. The theoretical curves which were calculated using the
average hot and cold clad temperatures during the startup, are presented for comparison.
Some of the discontinuities of the data points can be directly related to discontinuities
in the theoretical curves. Such l'stepsl' are the result of perturbations in the operating condi-
tions. As an example, the large spike near the beginning of the startup corresponds to the
point at which the cooling fan was turned on. Other sudden changes in the test data, not
reflected in the theoretical curves, may be related to internal changes.
With the exception of the early part of the internal resistance plot, shown in Figure 12,
the general form of the data points closely follows the theoretical curves on a l l the plots. The
fact that the data points are uniformly below the theoretical curves indicates either a consist-
ently poor interface condition along the axial length of the module, intercouple shorting, or
a discrepancy between the values used for the theoretical calculations and the actual pro-
perties of the various materials.
As shown on the internal resistance plot of Figure 12, a rather rapid decrease was measured
during the early part of the startup. Above the average temperature of about 2OO0C, the resist-
ance runs essentially parallel to the theoretical curve.
LIFE TEST
Following initial warmup, the module was seasoned at conditions of 1280 2 20 watts in-
put, an average cold clad temperature of 2OO0C, and average hot clad temperature of 538OC.
After 518 hours at these conditions, a thermal cycle to room temperature and return to season-
ing conditions was performed. After the shutdown - startup cycle, the module was held at
these seasoning conditions for an additional 70 hours to evaluate the effect of thiscycle on
module output. No observable effect was noted; module efficiency and output remained at
the same level as that immediately prior to this cycle.
14
Astronuclear laboratory
WANL-TME- 1467
7 1 1 1 1 I I I
6 -
- v)
0 MEASIRED POINTS
- THEORETKAL CUVE 5 -
2 8 >
s 2 '-
3 - ji' t a
v Y - g 2 -
1 -
120 I 6 0 200 240 280 320 360
MODULE MEAN TEMPERATURE, TAv eC)
Figure 11. Open Circuit Voltage Versus Module Mean Temperature
MEASURED POINTS - THE31E::CA: CilriVE
80 120 160 200 240 280 320 360
MODULE MEAN TEMPERATME , TAy (OC)
Figure 12. Module Internal Resistance Versus Module Mean Temperature
15
Astronuclear laboratory
W A N L-TME - 1467
16OW
. .-
Figure 13.
0 MEASURED POINTS
.- THEORETICAL CURVE
Module Resistance-to-Clad Versus Module Mean
0 5 I? I
Temperature
I I f $ 1 c 4 M
o!o Bb 120 164 200 240 280 320 360
MODULE MEAN TEMF'ERATURE,TAy (OC)
Figure 14. Required Thermal Power Input Versus Module Mean Temperature
16
8 8 ' 8 8 8 t 8 8 8 I I 8 8 1 I I i I e
Astronuclear Laboratory
WANL-TME-1467
~~
"4 m 120 IM 200 240 280 m 360
MOOUU MAN rwufurmE,iAV fc)
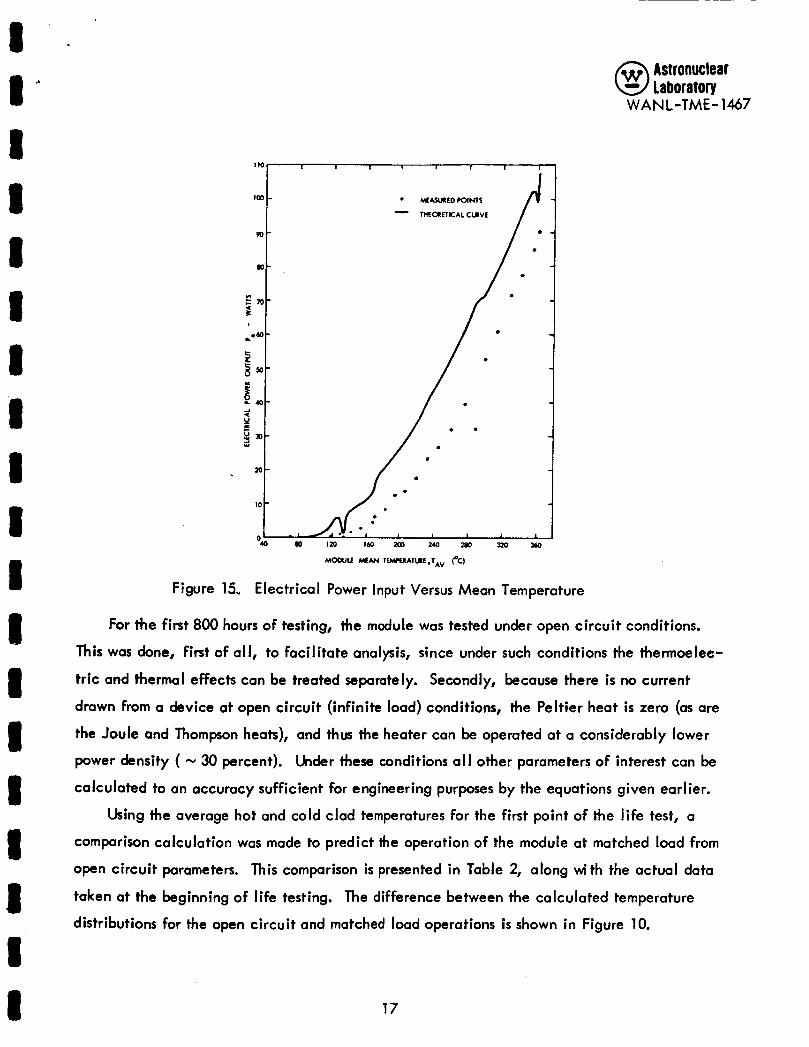
Figure 15, Electrical Power Input Versus Mean Temperature
For the first 800 hours of testing, the module was tested under open circuit conditicns.
This was done, first of all, to facilitate analysis, since under such conditions the thermoelec-
tric and thermal effects can be treated separately. Secondly, because there i s no current
drawn from a device at open circuit (infinite load) conditions, the Peltier heat i s zero (as are
the Joule and Thompson heats), and thus the heater can be operated at a considerably lower
power density ( - 30 percent). Ulder these conditions a l l other parameters of interest can be
calculated to an accuracy sufficient for engineering purposes by the equations given earlier.
Using the average hot and cold clad temperatures for the first point of the l i fe test, a
comparison calculation was made to predict the operation of the module at matched load from
open circuit parameters. This comparison is presented in Table 2, along with the actual data
taken at the beginning of l i fe testing. The difference between the calculated temperature
distributions for the open circuit and matched load operations i s shown in Figure 10.
17
Astronuclear @ Laboratory WAN L-TME - 1467
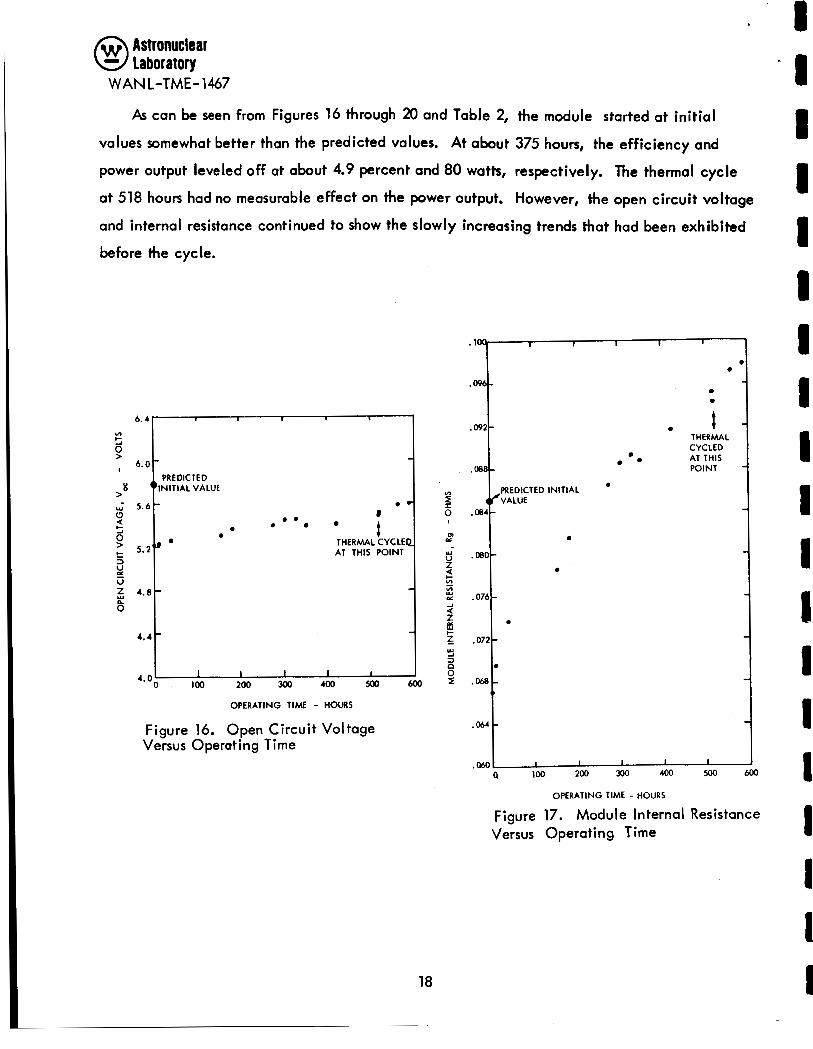
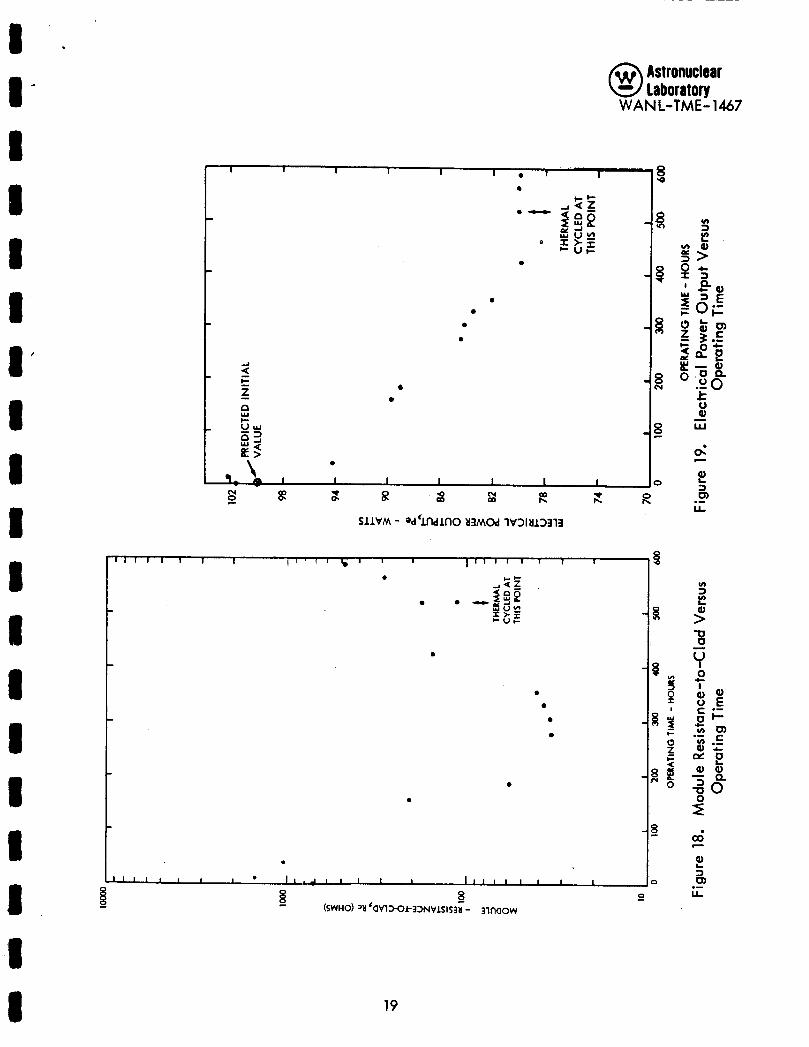
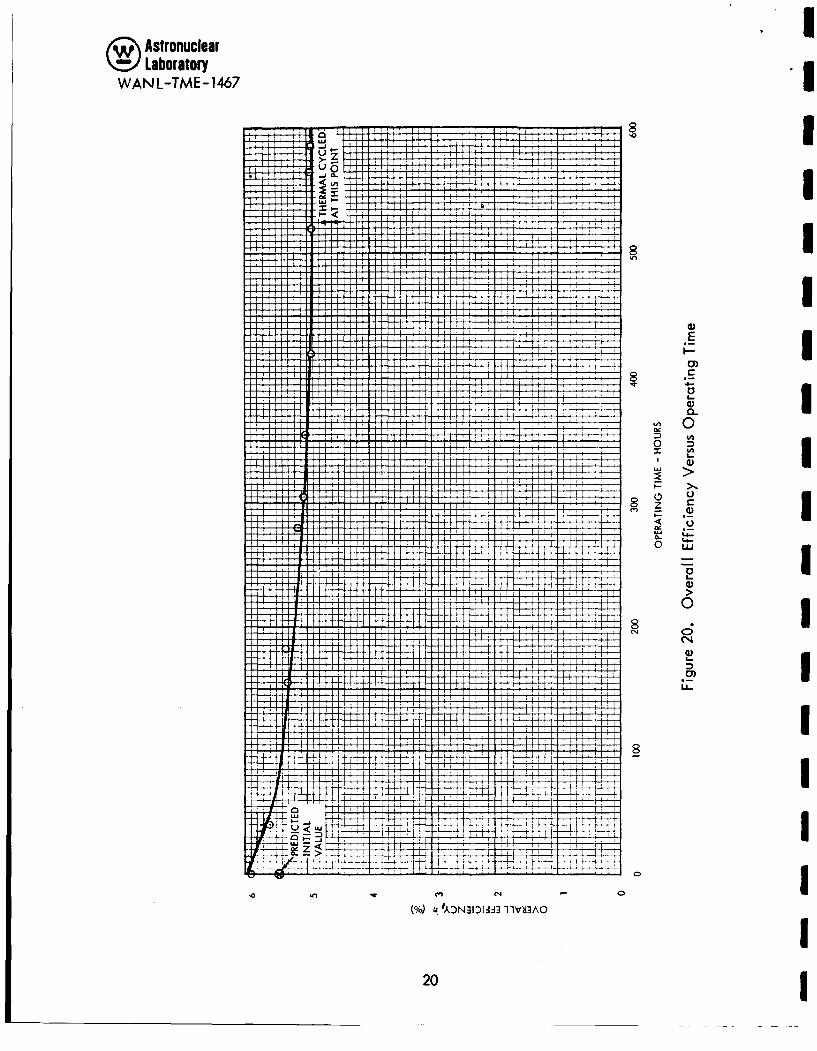
As can be seen from Figures 16 through 20 and Table 2, the module started at init ial
values somewhat better than the predicted values. At about 375 hours, the efficiency and
power output leveled off at about 4.9 percent and 80 watts, respectively. The thermal cycle
at 518 hours had no measurable effect on the power output. However, the open circuit voltage
and internal resistance continued to show the slowly increasing trends that had been exhibited
before the cycle.
6.4 I I 1 I I v)
PREDICTED
b
4 * 4 t
b b O b
THERMAL CYCLE AT THIS P O I N T
I I 1 I I I 0 100 200 300 400 500 600
4.0‘
OPERATING TIME - HOURS
VI
I 0
m
I
r*
y1 U
f 5
;i’ f z a
VI ul r*
W k-
W 2
0 z
I I 1 I I
b
b b
b # THERMAL CYCLED AT THIS POINT
0 b *
b
Figure 16. Open Circuit Voltage Versus Operating Time
.a601 I I I I I 4 100 2 0 0 3 0 0 400 5 0 0 6 0 0
OPERATING TIME - HOURS
Figure 17. Module Internal Resistance Versus Operating Time
18
1 3 1 I I
I 1 I 1 I 1 1 I 1 I I I I
a
laboratory WANL-TME- 1467
I 1 I I I 1 . 1 I 0
0
0
0
e 0
0
0
0
- 1 I I I I I I - 0 , !
8! 9. 8 8 QD e x R cy t cy 0,
0
0
0
0
0
0
a
19
'0 0 - Y 0
2 2 3 0) L .-
Astronuclear @ Laboratory WANL-TME-1467
I 'I I I I 1 I 1 I I 1 I I I I I I I I
8 ' .
Astronuclear Laboratory
WANL-TME- 1467
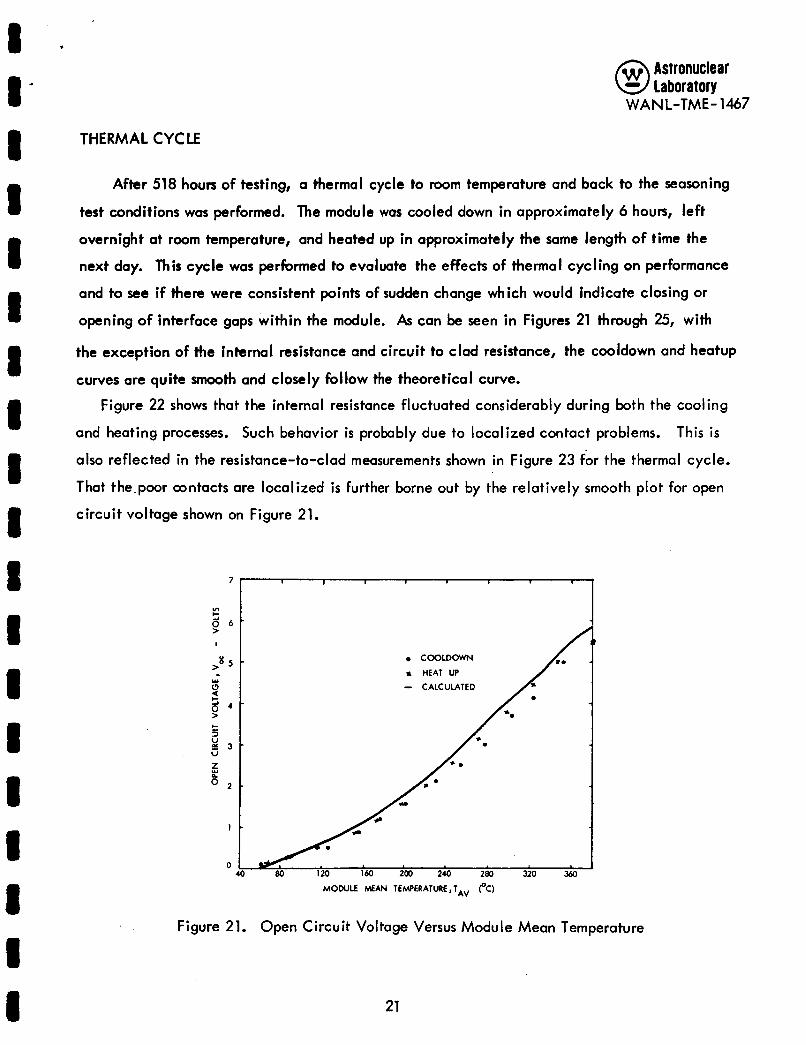
THERMAL CYCLE
After 518 hours of testing, a thermal cycle to room temperature and back to the seasoning
I 8 8 I
test conditions was performed. The module was cooled down in approximately 6 houfi, left
overnight at room temperature, and heated up in approximately the same length of time the
next day. This cycle was performed to evaluate the effects of thermal cycling on performance
and to see if there were consistent points of sudden change which would indicate closing or
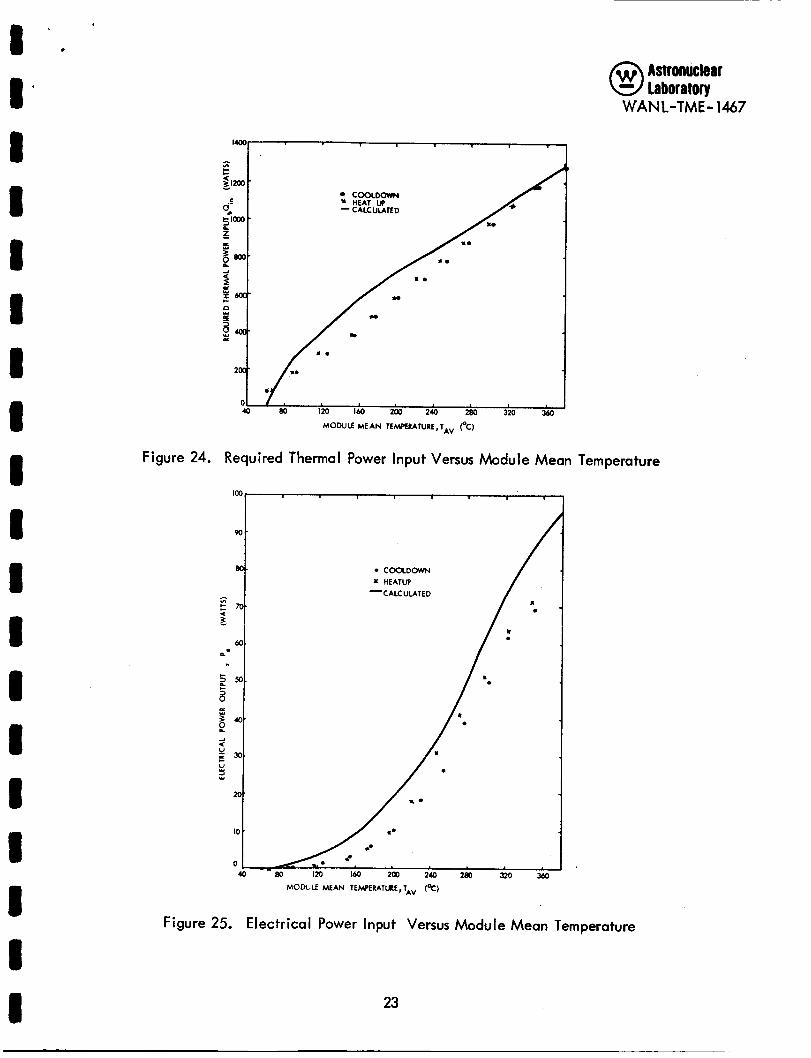
opening of interface gaps within the module, As can be seen in Figures 21 through 25, with
the exception of the internal resistance and circuit to clad resistance, the cooldown and heatup
curves are quite smooth and closely follow the theoretical curve. 8
I 8
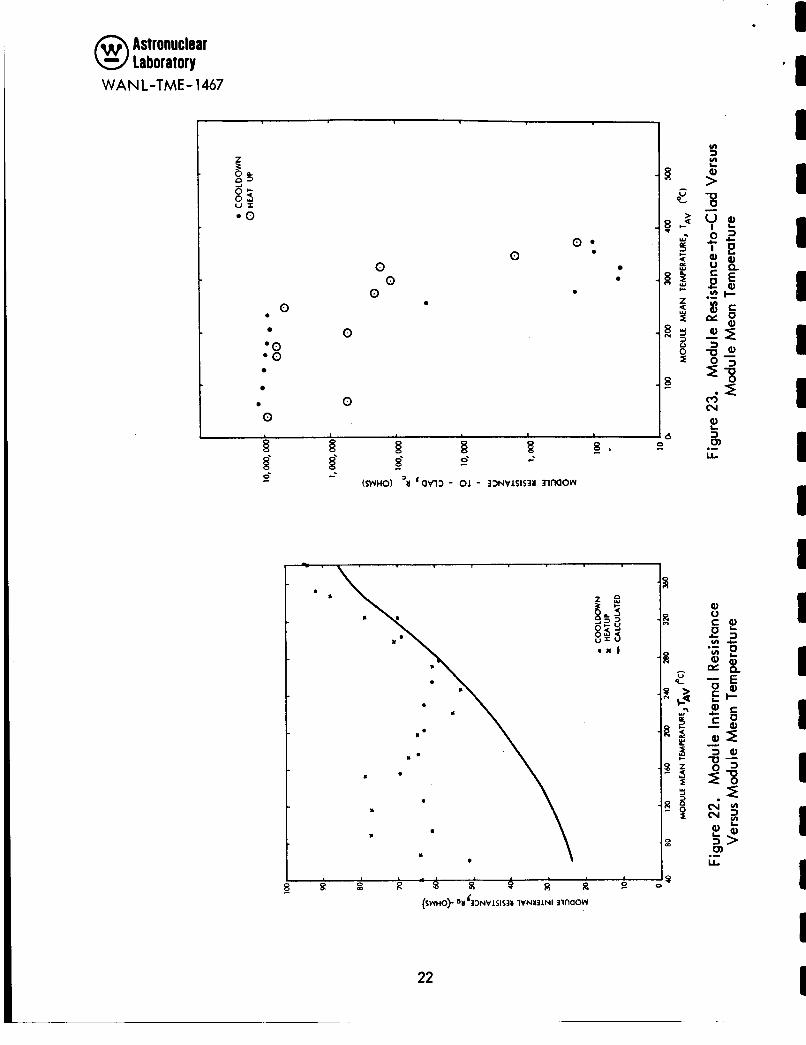
Figure 22 shows that the internal resistance fluctuated considerably during both the cooling
and heating processes. Such behavior i s probably due to localized contact problems.
also reflected in the resistance-to-clad measurements shown in Figure 23 for the thermal cycle.
That the-poor contacts are localized i s further borne out by the relatively smooth plot for open
circuit voltage shown on Figure 21.
This i s
7 1 I I I I .
ul
5 6 - > I
COOLDOWN
> B 5 n HEAT UP
- - CALCUUTED
!= 3
U
Z
u 3 -
Y
1 -
I20 160 200 240 280 320 360 MODULE MEAN TEMPERATURE, TAV T C )
Figure 21. Open Circuit Voltage Versus Module Mean Temperature
21
Astronuclear laboratory
WANL-TME- 1467
0
'0 '0
0
0 0 0
0 a
0'
'
E
I 3 0) L .-
1 I I I 1 1 1 1
22
n c c
s Irn CO0LM)vM ’ HEAT W - CALCUUTLD
2 160 200 240 280 320 360
Astronuclear @ Laboratory WANL-TME- 1467
MODULE MEAN TEMPFJUTURE,TAV e C )
Figure 24. Required Thermal Power Input Versus Module Mean Temperature
COOLDOWN X HEATUP
-CALCULATED /
MODLLE MEAN TEMPERATLIIE,TAv (OC)
Figure 25. Electrical Power Input Versus Module Mean Temperature
23
Astronuclear @ Laboratory WAN L-TME- 1467
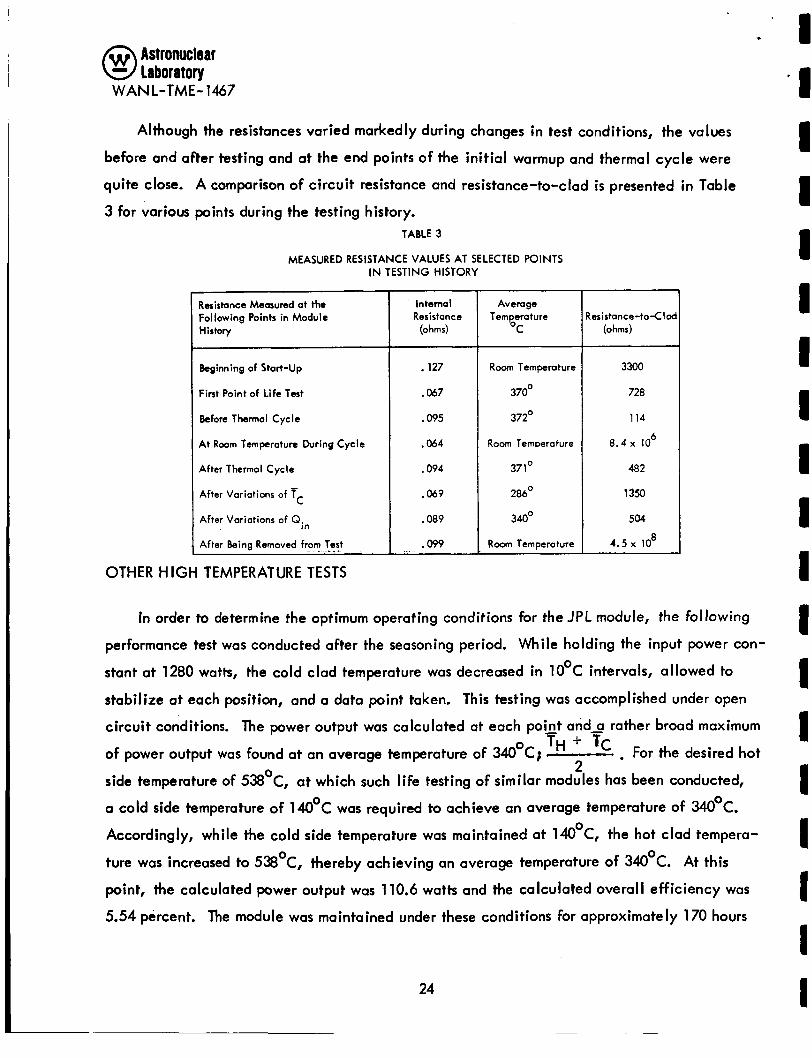
Although the resistances varied markedly during changes in test conditions, the values
before and after testing and at the end points of the init ial warmup and thermal cycle were
quite close. A comparison of circuit resistance and resistance-to-clad i s presented in Table
3 for various points during the testing history. TABLE 3
MEASURED RESISTANCE VALUES AT SELECTED POINTS IN TESTING HISTORY
Resistance Measured at the Following Points in Module History
~~ ~~
Beginning of Start-up
First Point of Life Test
Before Thermal Cycle
At Roam Temperature During Cycle
After Thermal Cycle
After Variations o f f
After Variations of Qjn
After Being Removed from 1e:t
C
Internal Resistance
(ohms)
. 127
.067
.095
.a4
.094
.a9
.089
.099
Average Temperature
O C
Room Temperature
370'
372O
Room Temperature
371'
286'
340°
Room Temperature
.esistance-toCloc (ohms)
3300
728
114 6 8 . 4 ~ 10
482
1350
504 8 4 . 5 x 10
OTHER HIGH TEMPERATURE TESTS
In order to determine the optimum operating conditions for the JPL module, the following
performance test was conducted after the seasoning period. While holding the input power con-
stant at 1280 watts, the cold clad temperature was decreased in 10°C intervals, allowed to
stabilize at each position, and a data point taken. This testing was accomplished under open
circuit conditions. The power output was calculated at each pict ands rather broad maximum
. For the desired hot of power output was found at an average temperature of 340 C; side temperature of 538 C, at which such life testing of similar modules has been conducted,
a cold side temperature of 140°C was required to achieve an average temperature of 340 C.
Accordingly, while the cold side temperature was maintained at 140 C, the hot clad tempera-
ture was increased to 538 C, thereby achieving an average temperature of 340 C. At this
point, the calculated power output was 110.6 watts and the calculated overall efficiency was
5.54 percent. The module was maintained under these conditions for approximately 170 hours
o TH + TC 2 0
0
0
0 0
24
I *I 1 I I 1 I 1 I 1 I I I 1 I 1 I I I
I ' . I' I I I 1 I I I 8 I I I 8 I 8 I I I
Astronuclear laboratory
WANL-TME-1467
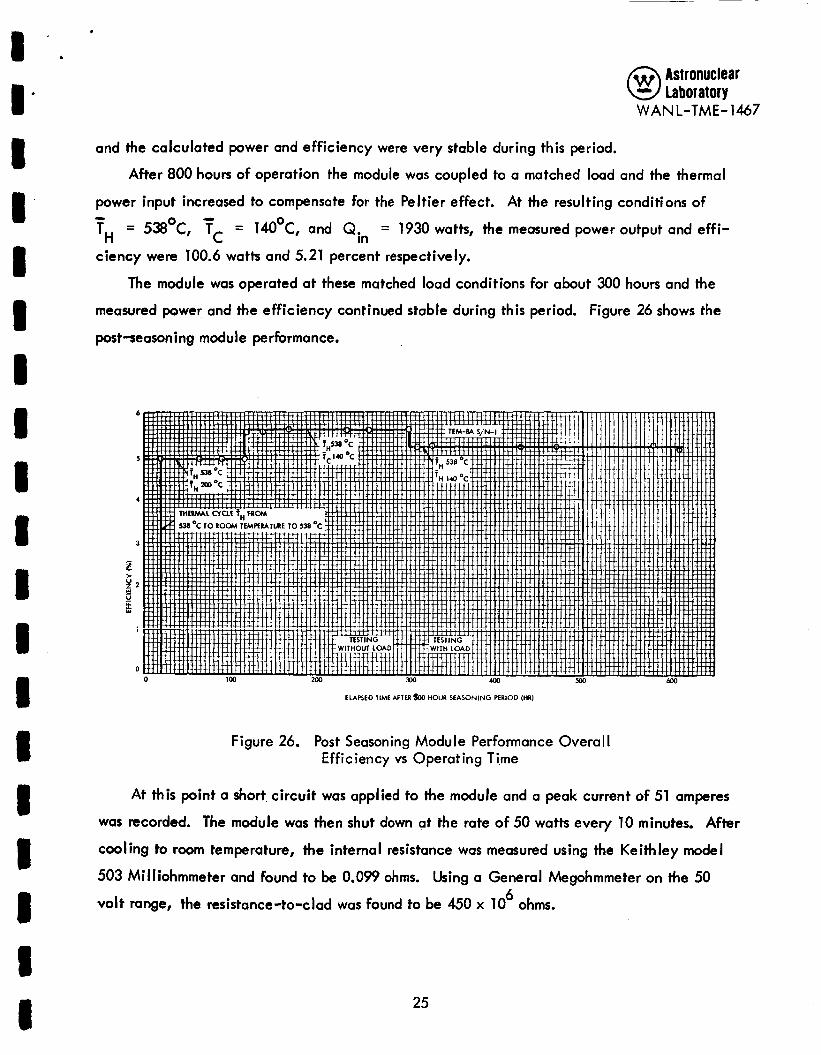
and the calculated power and efficiency were very stable during this period.
After 800 hours of operation the module was coupled to a matched load and the thermal
power input increased to compensate for the Peltier effect. At the resulting conditions of
= 538OC, Tc = 14OoC, and Qin = 1930 watts, the measured power output and eff i- TH ciency were 100.6 watts and 5.21 percent respectively.
The module was operated at these matched load conditions for about 300 hours and the
measured power and the efficiency continued stable during this period. Figure 26 shows the
post-seasoning module performance.
ELAPSED IlMf AFTER %€I HOUR SEASONING PERIOD (HR)
Figure 26. Post Seasoning Module Performance Overal I Efficiency vs Operating Ti,me
At this point a short circuit was applied to the module and a peak current of 51 amperes
was recorded. The module was then shut down at the rate of 50 watts every 10 minutes. After
cooling to room temperature, the internal resistance was measured using the Keithley model
503 Milliohmmeter and found to be 0.099 ohms. Using a General Megohmmeter on the 50
volt range, the resistance-to-clad was found to be 450 x 10 ohms. 6
25