Embed Size (px)
Citation preview
Global Equity Research 03 February 2009
Microfinance
Shedding Light on Microfinance Equity Valuation: Past and Present
J.P. Morgan Global Research
See page 59 for analyst certification and important disclosures, including non-US analyst disclosures. J.P. Morgan does and seeks to do business with companies covered in its research reports. As a result, investors should be aware that the firm may have a conflict of interest that could affect the objectivity of this report. Investors should consider this report as only a single factor in making their investment decision. Customers of J.P. Morgan in the United States can receive independent, third-party research on the company or companies covered in this report, at no cost to them, where such research is available. Customers can access this independent research at www.morganmarkets.com or can call 1-800-477-0406 toll free to request a copy of this research.
Nick O’Donohoe Global Head of Research [email protected]
J.P. Morgan Securities Ltd.
Frederic Rozeira de MarizAC * Latin American Banks Analyst [email protected]
Banco J.P. Morgan SA
CGAP Elizabeth Littlefield Chief Executive Officer [email protected]
Xavier Reille Lead Microfinance Specialist [email protected]
Christoph Kneiding Microfinance Specialist [email protected]
This report is the result of a collaborative effort between CGAP (Consultative Group to Assist the Poor) and J.P. Morgan. J.P. Morgan analysts are solely responsible for the investment opinions and recommendations in this report.
* Registered/qualified as a research analyst under NYSE/NASD rules
Global Research03 February 2009
2
Global Research 03 February 2009
Nick O'Donohoe [email protected] Elizabeth Littlefield [email protected]
Executive Summary This report is the result of a collaborative effort between CGAP1 (Consultative Group to Assist the Poor) and J.P. Morgan. J.P. Morgan analysts are solely responsible for the investment opinions and recommendations in this report.
Our objective is to provide benchmarks for valuation of microfinance equity, both private and publicly listed. Our analysis is based on two datasets: a sample of 144 private equity transactions, which represents the largest such dataset gathered to date, and data on 10 publicly traded microfinance institutions (MFIs) and low-income consumer lenders.2
MFIs will certainly be affected by the financial crisis ricocheting across the globe, but we believe that the sector is fundamentally sound. Larger institutions, especially those with diversified funding sources, such as retail deposits, are best positioned to manage the effects of economic and financial contraction. Valuations may change, but we believe the long-term outlook for equity investment in microfinance is positive.
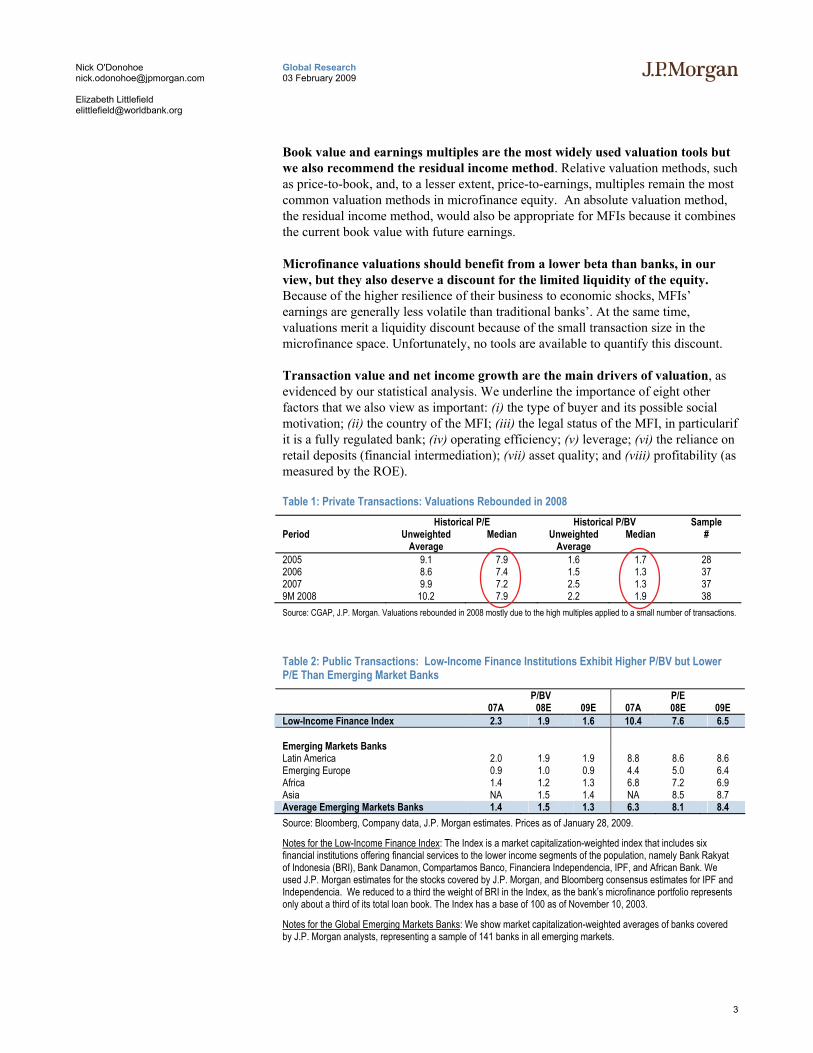
Private equity valuations for MFIs have varied widely over the past few years. Historical median valuations in our private sample have varied between 1.3x and 1.9x historical book, and between 7.2x and 7.9x historical earnings over the four-year period, as shown in Table 1 below. The considerable range of these indicators may indicate the lack of market consensus on MFI valuation.
Publicly listed Low-Income Finance Institutions (LIFIs) have outperformed traditional banks. Since its creation in 2003, our Low-Income Finance Index has outperformed the Global MSCI World Financials index3 by 238% (and has outperformed this benchmark by 10% since the Lehman bankruptcy in September 2008). LIFIs now trade slightly higher than traditional banks on price-to-book basis (1.9x 08 book for LIFIs versus 1.5x for emerging banks as of January 28, 2009). On a 2009 price-to-earnings basis, LIFIs are trading at a 22% discount to traditional banks, as shown in Table 2.
Investors should not value MFIs the same way they value traditional banks. We highlight five characteristics that differentiate MFIs from traditional banks and that, we argue, justify a slightly different valuation approach: a double bottom line that aims for both social and financial returns; excellent asset quality; high net interest margins (NIMs); high operating costs, and longer-term funding available from developmental investors.
1 CGAP is an independent policy and research center dedicated to advancing financial access for the world's poor. It is supported by over 30 development agencies and private foundations that share a common mission to alleviate poverty. Housed at the World Bank, CGAP provides market intelligence, promotes standards, develops innovative solutions and offers advisory services to governments, microfinance providers, donors, and investors. 2 Because there are few publicly listed MFIs, we considered a group of 10 financial institutions targeting low-income individuals, and note that their business models are very diverse. 3 The Global MSCI World Financials Index is a free-float weighted equity index. It was developed with a base value of 100 as of December 31, 1998.
3
Global Research 03 February 2009
Nick O'Donohoe [email protected] Elizabeth Littlefield [email protected]
Book value and earnings multiples are the most widely used valuation tools but we also recommend the residual income method. Relative valuation methods, such as price-to-book, and, to a lesser extent, price-to-earnings, multiples remain the most common valuation methods in microfinance equity. An absolute valuation method, the residual income method, would also be appropriate for MFIs because it combines the current book value with future earnings.
Microfinance valuations should benefit from a lower beta than banks, in our view, but they also deserve a discount for the limited liquidity of the equity. Because of the higher resilience of their business to economic shocks, MFIs’ earnings are generally less volatile than traditional banks’. At the same time, valuations merit a liquidity discount because of the small transaction size in the microfinance space. Unfortunately, no tools are available to quantify this discount.
Transaction value and net income growth are the main drivers of valuation, as evidenced by our statistical analysis. We underline the importance of eight other factors that we also view as important: (i) the type of buyer and its possible social motivation; (ii) the country of the MFI; (iii) the legal status of the MFI, in particularif it is a fully regulated bank; (iv) operating efficiency; (v) leverage; (vi) the reliance on retail deposits (financial intermediation); (vii) asset quality; and (viii) profitability (as measured by the ROE).
Table 1: Private Transactions: Valuations Rebounded in 2008 Historical P/E Historical P/BV Sample
Period Unweighted Average
Median Unweighted Average
Median #
2005 9.1 7.9 1.6 1.7 28 2006 8.6 7.4 1.5 1.3 37 2007 9.9 7.2 2.5 1.3 37 9M 2008 10.2 7.9 2.2 1.9 38 Source: CGAP, J.P. Morgan. Valuations rebounded in 2008 mostly due to the high multiples applied to a small number of transactions.
Table 2: Public Transactions: Low-Income Finance Institutions Exhibit Higher P/BV but Lower P/E Than Emerging Market Banks
P/BV P/E 07A 08E 09E 07A 08E 09E
Low-Income Finance Index 2.3 1.9 1.6 10.4 7.6 6.5
Emerging Markets Banks Latin America 2.0 1.9 1.9 8.8 8.6 8.6 Emerging Europe 0.9 1.0 0.9 4.4 5.0 6.4 Africa 1.4 1.2 1.3 6.8 7.2 6.9 Asia NA 1.5 1.4 NA 8.5 8.7 Average Emerging Markets Banks 1.4 1.5 1.3 6.3 8.1 8.4 Source: Bloomberg, Company data, J.P. Morgan estimates. Prices as of January 28, 2009.
Notes for the Low-Income Finance Index: The Index is a market capitalization-weighted index that includes six financial institutions offering financial services to the lower income segments of the population, namely Bank Rakyat of Indonesia (BRI), Bank Danamon, Compartamos Banco, Financiera Independencia, IPF, and African Bank. We used J.P. Morgan estimates for the stocks covered by J.P. Morgan, and Bloomberg consensus estimates for IPF and Independencia. We reduced to a third the weight of BRI in the Index, as the bank’s microfinance portfolio represents only about a third of its total loan book. The Index has a base of 100 as of November 10, 2003.
Notes for the Global Emerging Markets Banks: We show market capitalization-weighted averages of banks covered by J.P. Morgan analysts, representing a sample of 141 banks in all emerging markets.
4
Global Research 03 February 2009
Nick O'Donohoe [email protected] Elizabeth Littlefield [email protected]
Table of Contents Executive Summary .................................................................2 Introduction ..............................................................................6 1. Microfinance versus Traditional Banking........................9 What Makes Microfinance Financials Different? ........................................................9 A. Double Bottom Line................................................................................................9 B. High Net Interest Margins Driven by High Lending Rates...................................10 C. High Asset Quality Is Driven by Original Collection Method ..............................11 D. High Operating Costs Are Driven by Small Transactions ....................................12 E. Longer-Term Funding ...........................................................................................13 2. Technical Overview of Valuation Methods ....................16 Relative Valuation: P/BV Multiple............................................................................16 Relative Valuation: P/E Multiple...............................................................................18 Absolute Valuation: Discounting Future Flows.........................................................18 Remarks on the Cost of Equity ..................................................................................19 Remarks on Liquidity ................................................................................................21 Valuation Methods Complement Each Other ............................................................21 3. Valuation of Private Equity Transactions - Microfinance Institutions ..............................................................................23 Valuation Between 1.3 - 1.9x Historical Book; 7.2 - 7.9x Historical Earnings .........23 Back to Basics: Drivers of Valuation Are Usually Profitability and Income Growth24 Transaction Size and Net Income Growth Are the Main Drivers of Valuations........27 4. Valuation of public transactions – Low-Income Finance Institutions ..............................................................................32 Introducing the Low-Income Finance Index..............................................................32 Performance of Individual LIFIs Post Listing............................................................34 Convergence of Multiples..........................................................................................36 Impact of a Listing on an LIFI’s Operations..............................................................37 Conclusions............................................................................39
Appendices Appendix I: Glossary..............................................................40 Appendix II: Multiples for Private Equity Transactions.......42 Appendix III: Listing Information...........................................44 Appendix IV: Emerging Markets Banks Valuations.............45 Appendix V: Description of LIFIs in Sample ........................49

5
Global Research 03 February 2009
Nick O'Donohoe [email protected] Elizabeth Littlefield [email protected]
The authors would like to acknowledge the contribution of Christina Leijonhufvud, head of the Social Sector Finance team at J.P. Morgan, and Mia Feldman of the Social Sector Finance team; Neil Gupte, analyst in Equity Research for Asian Financials; Thomas Anduze-Acher in the Latin American Financials Equity Research team; Richard Rosenberg, senior advisor at CGAP; Barbara Gahwiler and Mathieu Lebegue, microfinance analysts at CGAP.
The authors also acknowledge the contributions at J.P. Morgan of Sunil Garg, head of Equity Research for Asia; Aditya Srinath, head of Equity Research for Indonesia; Victoria Miles, head of Emerging Markets Corporate Research; Paul Formanko, head of Equity Research for Banks in Emerging Europe and Central Asia; Mervin Naidoo, senior analyst for South African Banks; and Saul Martinez, senior analyst for Latin American Financial Institutions.
Finally, we are thankful to Adrian Gonzalez from the Microfinance Information eXchange; Deborah Drake and other CMEF members; Alex Silva and Brian Busch of Omtrix; and Clay Obrian of Opportunity International, for sharing their views on the microfinance sector and for their support.
The authors remain responsible for the opinions expressed in this report and for any inaccuracies.
6
Global Research 03 February 2009
Nick O'Donohoe [email protected] Elizabeth Littlefield [email protected]
Introduction Equity investment in microfinance is small, but growing fast. As of December 2008, there were 24 specialized microfinance equity funds with total assets of US$1.5 billion under management. Institutional investors are also showing interest in this new market niche. Leading pension funds, such as TIAA CREF in the United States and ABP in Europe, have made microfinance equity allocations of over US$100 million as part of their socially responsible investment (SRI) strategies. Others are researching the field and waiting for clearer market conditions to invest. Venture capital companies such as Sequoia and a few large private equity funds such as Legatum4 are testing the market with small equity investments in MFIs, with near- term potential for an initial public offering (IPO) in key emerging markets, like India.
While interest in microfinance equity investments soars, the actual microfinance equity market is still in its infancy. Primary issuances are still limited by the small pool of investable MFIs and by the absence of an organized secondary market. A vast majority of transactions are in the form of private placements. To date, only two pure microfinance IPOs have taken place (Compartamos in Mexico and Equity Bank in Kenya), and current market conditions are not favorable to new ones.
The scarcity of information on microfinance valuation is a major challenge to establishing microfinance equity as an investment niche. Investors and MFIs are looking for reliable and accessible market references to improve equity pricing. However, little research has been done on microfinance equity valuation, due to the difficulty in accessing private data.5
This paper is an attempt to offer some useful benchmarks to investors, microfinance managers and analysts and help build market transparency.
As we write this paper, we are caught up in an unprecedented financial crisis and a truly global economic contraction. Liquidity shortages, currency dislocations and global recession will all affect MFIs and their clients in different ways.6 The impact of the crisis should become clearer over the course of 2009. In the short run, we expect to see higher costs of funding due to tighter credit and to weaker emerging markets currencies relative to dollar-denominated loans. In the medium term we can foresee slower growth and lower earnings power.
MFIs will have to seek funding from public agencies and development finance institutions7 to maintain their liquidity as commercial funders withdraw. They will need to strengthen their asset and liability management capabilities and be ever more vigilant about credit standards to maintain their outstanding asset quality. The crisis may force some consolidation in the sector and it will almost certainly put pressure on valuations. We anticipate no new listings in the short term. As for valuations, we expect multiples of private transactions to drop toward 1x book value in 2009 from a
4 Sequoia invested US$11.5 million in SKS, a leading Indian MFI, and Legatum invested in Share, another microfinance leader in India. 5 Barclay O’Brien, Valuing Microfinance Institutions, Savings and Development- Quaterly Review Issue 3-2006, Milan. 6 See CGAP Virtual Conference: “Microfinance and the Financial Crisis”, November 18-20, 2008. 7 Please see the glossary in Appendix I for a definition of development finance institutions.
7
Global Research 03 February 2009
Nick O'Donohoe [email protected] Elizabeth Littlefield [email protected]
median of 1.9x in 2008. However, the strong fundamentals of the microfinance industry and the commitment of public and socially responsible investors should bolster pricing going forward. MFIs with a solid funding base and strong asset quality should emerge stronger from this turbulence, and we can expect valuations to bounce back in 2010.
Our ambition is to provide a benchmark for valuation. In this paper, we intend to address some of the key questions facing microfinance investors and MFIs: What is unique about the microfinance sector that may justify an original valuation approach? What are the valuation methodologies used? What are the key valuation drivers for private placements in microfinance? What is the performance of microfinance on the private and public markets, in both absolute and relative terms? What are the challenges ahead for this new market niche in the context of the financial crisis?
This paper consists of four parts. In the first part, we underline what makes MFIs different from traditional banks. We then describe commonly used valuation methods and their applications in the context of MFIs. In a third part, we look at data from our sample of 144 private transactions and discuss the key determinants of valuation. Finally, we look at the performance of publicly listed low-income finance institutions and analyze the impact of listing on the franchise performance.
This report is the result of the collaboration between CGAP and J.P. Morgan. CGAP brings its deep microfinance market knowledge and J.P. Morgan its equity research skills and emerging markets expertise.
Methodology & Sample for the Study
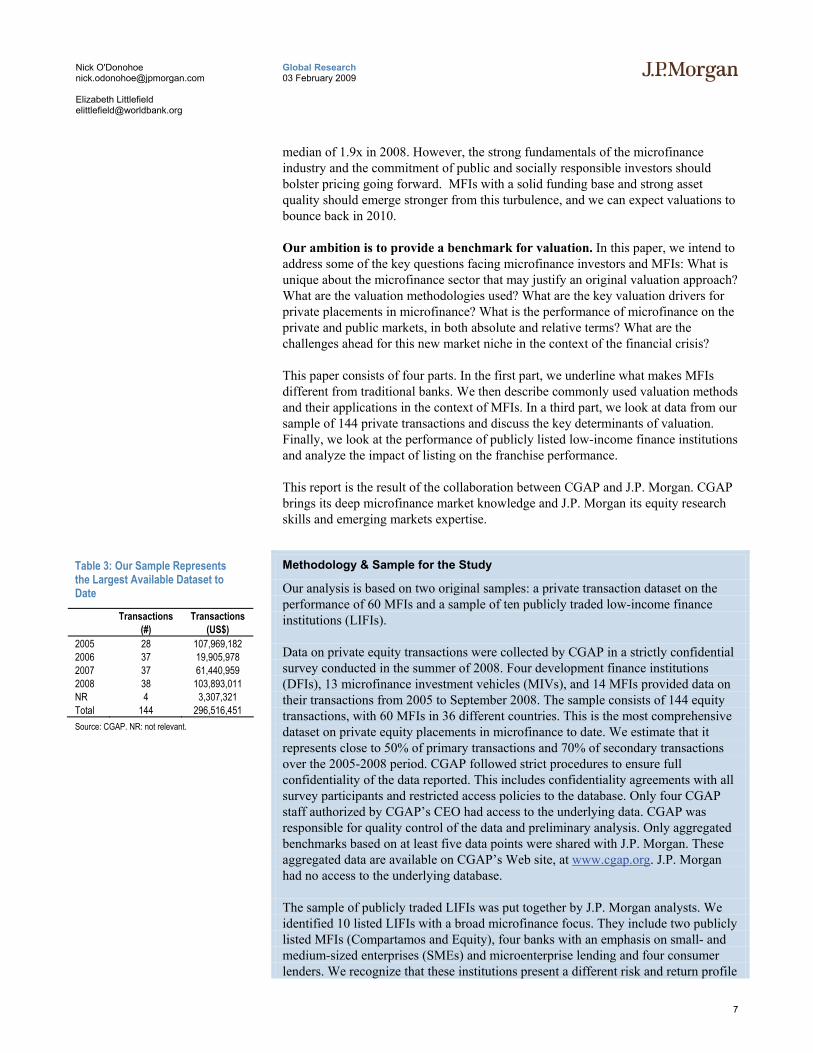
Our analysis is based on two original samples: a private transaction dataset on the performance of 60 MFIs and a sample of ten publicly traded low-income finance institutions (LIFIs).
Data on private equity transactions were collected by CGAP in a strictly confidential survey conducted in the summer of 2008. Four development finance institutions (DFIs), 13 microfinance investment vehicles (MIVs), and 14 MFIs provided data on their transactions from 2005 to September 2008. The sample consists of 144 equity transactions, with 60 MFIs in 36 different countries. This is the most comprehensive dataset on private equity placements in microfinance to date. We estimate that it represents close to 50% of primary transactions and 70% of secondary transactions over the 2005-2008 period. CGAP followed strict procedures to ensure full confidentiality of the data reported. This includes confidentiality agreements with all survey participants and restricted access policies to the database. Only four CGAP staff authorized by CGAP’s CEO had access to the underlying data. CGAP was responsible for quality control of the data and preliminary analysis. Only aggregated benchmarks based on at least five data points were shared with J.P. Morgan. These aggregated data are available on CGAP’s Web site, at www.cgap.org. J.P. Morgan had no access to the underlying database.
The sample of publicly traded LIFIs was put together by J.P. Morgan analysts. We identified 10 listed LIFIs with a broad microfinance focus. They include two publicly listed MFIs (Compartamos and Equity), four banks with an emphasis on small- and medium-sized enterprises (SMEs) and microenterprise lending and four consumer lenders. We recognize that these institutions present a different risk and return profile
Table 3: Our Sample Represents the Largest Available Dataset to Date
Transactions (#)
Transactions (US$)
2005 28 107,969,182 2006 37 19,905,978 2007 37 61,440,959 2008 38 103,893,011 NR 4 3,307,321 Total 144 296,516,451 Source: CGAP. NR: not relevant.
8
Global Research 03 February 2009
Nick O'Donohoe [email protected] Elizabeth Littlefield [email protected]
for investors than traditional MFIs. They do not necessarily have an explicit social agenda, and their loan portfolio is less concentrated on microenterprise lending and more exposed to economic shocks. However, these institutions provide interesting valuation comparables for MFIs because they operate in the same market. A short description of each institution is included in Appendix V at the end of this report.
Microfinance Equity Market
As of 2007, there were 397 banks and nonbank financial institutions reporting to the MIX - the reference database for microfinance performance - with an aggregate equity base of roughly US$5.2bn. 85% of the equity investment is concentrated in the largest 100 MFIs. Eastern Europe and Latin America account for almost two-thirds of the microfinance equity. New share issuance is also increasing rapidly and passed the US$1 billion milestone in 2007.8
MFIs have built an impressive track record and their financial performance has been documented by the MIX since 1995. In 2007, the average asset size of microfinance banks grew by a notable 40%.9 Returns are solid with a median ROE of 14.1% in 2007. Asset quality remains high, with a median portfolio at risk over 30 days (PaR30) of merely 1.4%. However, MFIs are being affected by the global economic crisis, and the performance of the microfinance industry is likely to deteriorate in 2009.
On the funding side, development finance institutions (DFIs) such as IFC, the KfW and the EBRD have been early equity investors in microfinance. Their aggregate microfinance equity portfolio was valued at US$900 million as of 2007 and is growing very fast. The second group of investors consists of 24 specialized funds with an equity focus, private equity funds or holding companies of microfinance banks. These funds are still relatively small in size, but growing very rapidly. Their total assets under management were estimated at US$1.5 billion in December 2008.10
Since 2007, large private equity firms such as Sequoia and Legatum11 have made equity investments in select microfinance markets such as India. We estimate that the total amount invested by these institutions is in excess of US$200 million. Finally, leading pension funds with an SRI focus are making asset allocations in specialized microfinance equity funds.
8 According to Adrian Gonzalez; analysis based on MIX 2007 data. 9 Adrian Gonzalez & team, MIX, based on microfinance banks reporting to the MIX in 2007. 10 Based on CGAP MIV survey 2008 and CGAP estimates for growth projection in 2008. 11 Blackstone, Carlyle eye microfinance firms, The Economic Times, India, October 12, 2007.
9
Global Research 03 February 2009
Nick O'Donohoe [email protected] Elizabeth Littlefield [email protected]
1. Microfinance versus Traditional Banking Do MFIs deserve a premium over traditional banks? In this section, we assess the key differences and similarities between mainstream banks and MFIs from a financial analysis perspective.
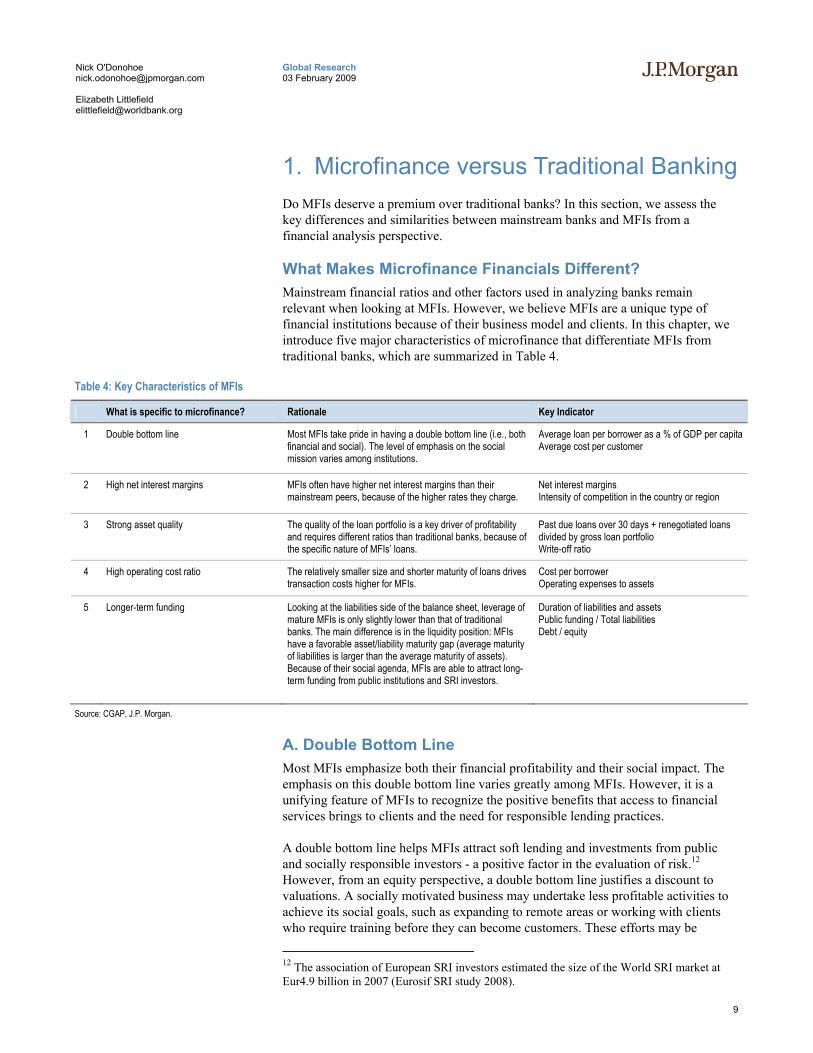
What Makes Microfinance Financials Different? Mainstream financial ratios and other factors used in analyzing banks remain relevant when looking at MFIs. However, we believe MFIs are a unique type of financial institutions because of their business model and clients. In this chapter, we introduce five major characteristics of microfinance that differentiate MFIs from traditional banks, which are summarized in Table 4.
Table 4: Key Characteristics of MFIs
What is specific to microfinance? Rationale Key Indicator
1 Double bottom line Most MFIs take pride in having a double bottom line (i.e., both financial and social). The level of emphasis on the social mission varies among institutions.
Average loan per borrower as a % of GDP per capita Average cost per customer
2 High net interest margins MFIs often have higher net interest margins than their mainstream peers, because of the higher rates they charge.
Net interest margins Intensity of competition in the country or region
3 Strong asset quality The quality of the loan portfolio is a key driver of profitability and requires different ratios than traditional banks, because of the specific nature of MFIs’ loans.
Past due loans over 30 days + renegotiated loans divided by gross loan portfolio Write-off ratio
4 High operating cost ratio The relatively smaller size and shorter maturity of loans drives transaction costs higher for MFIs.
Cost per borrower Operating expenses to assets
5 Longer-term funding Looking at the liabilities side of the balance sheet, leverage of mature MFIs is only slightly lower than that of traditional banks. The main difference is in the liquidity position: MFIs have a favorable asset/liability maturity gap (average maturity of liabilities is larger than the average maturity of assets). Because of their social agenda, MFIs are able to attract long-term funding from public institutions and SRI investors.
Duration of liabilities and assets Public funding / Total liabilities Debt / equity
Source: CGAP, J.P. Morgan.
A. Double Bottom Line Most MFIs emphasize both their financial profitability and their social impact. The emphasis on this double bottom line varies greatly among MFIs. However, it is a unifying feature of MFIs to recognize the positive benefits that access to financial services brings to clients and the need for responsible lending practices.
A double bottom line helps MFIs attract soft lending and investments from public and socially responsible investors - a positive factor in the evaluation of risk.12 However, from an equity perspective, a double bottom line justifies a discount to valuations. A socially motivated business may undertake less profitable activities to achieve its social goals, such as expanding to remote areas or working with clients who require training before they can become customers. These efforts may be
12 The association of European SRI investors estimated the size of the World SRI market at Eur4.9 billion in 2007 (Eurosif SRI study 2008).
10
Global Research 03 February 2009
Nick O'Donohoe [email protected] Elizabeth Littlefield [email protected]
reflected in a higher cost structure for the business, although in some cases, this may also be rewarded with higher yields.
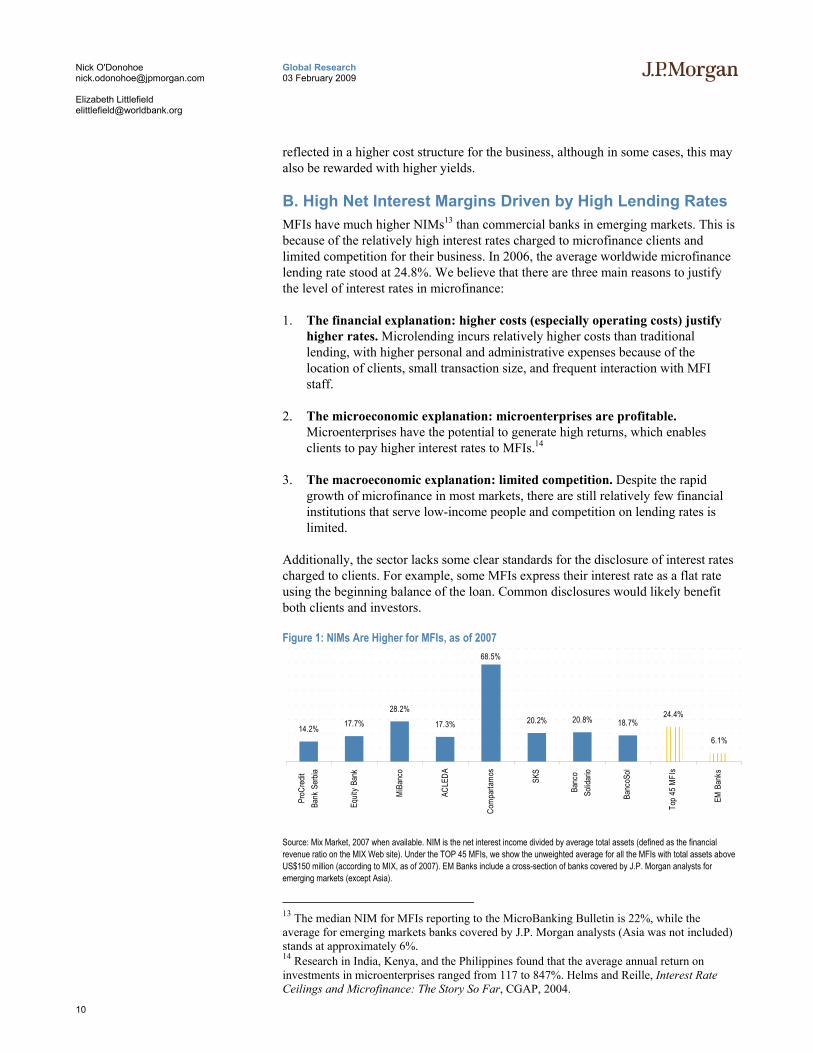
B. High Net Interest Margins Driven by High Lending Rates MFIs have much higher NIMs13 than commercial banks in emerging markets. This is because of the relatively high interest rates charged to microfinance clients and limited competition for their business. In 2006, the average worldwide microfinance lending rate stood at 24.8%. We believe that there are three main reasons to justify the level of interest rates in microfinance:
1. The financial explanation: higher costs (especially operating costs) justify higher rates. Microlending incurs relatively higher costs than traditional lending, with higher personal and administrative expenses because of the location of clients, small transaction size, and frequent interaction with MFI staff.
2. The microeconomic explanation: microenterprises are profitable. Microenterprises have the potential to generate high returns, which enables clients to pay higher interest rates to MFIs.14
3. The macroeconomic explanation: limited competition. Despite the rapid growth of microfinance in most markets, there are still relatively few financial institutions that serve low-income people and competition on lending rates is limited.
Additionally, the sector lacks some clear standards for the disclosure of interest rates charged to clients. For example, some MFIs express their interest rate as a flat rate using the beginning balance of the loan. Common disclosures would likely benefit both clients and investors.
Figure 1: NIMs Are Higher for MFIs, as of 2007
14.2% 17.7%28.2%
17.3%
68.5%
20.2% 20.8% 18.7%24.4%
6.1%
ProC
redit
Bank
Ser
bia
Equit
y Ba
nk
MiB
anco
ACLE
DA
Com
parta
mos
SKS
Banc
oSo
lidar
io
Banc
oSol
Top
45 M
FIs
EM B
anks
Source: Mix Market, 2007 when available. NIM is the net interest income divided by average total assets (defined as the financial revenue ratio on the MIX Web site). Under the TOP 45 MFIs, we show the unweighted average for all the MFIs with total assets above US$150 million (according to MIX, as of 2007). EM Banks include a cross-section of banks covered by J.P. Morgan analysts for emerging markets (except Asia).
13 The median NIM for MFIs reporting to the MicroBanking Bulletin is 22%, while the average for emerging markets banks covered by J.P. Morgan analysts (Asia was not included) stands at approximately 6%. 14 Research in India, Kenya, and the Philippines found that the average annual return on investments in microenterprises ranged from 117 to 847%. Helms and Reille, Interest Rate Ceilings and Microfinance: The Story So Far, CGAP, 2004.
11
Global Research 03 February 2009
Nick O'Donohoe [email protected] Elizabeth Littlefield [email protected]
Effects of the crisis on NIMs The financial crisis is having a significant effect on MFI NIMs. MFIs report increased liquidity pressures to CGAP and funding cost increases between 200 basis points (bps) to 500bps since September 2008, because of tighter credit conditions in the local interbank market and from foreign lenders.15 To preserve their margins, MFIs are increasing their lending rates, but some are experiencing difficulties in passing the full cost increase onto their clients. These measures are unpopular in the context of the economic downturn and may conflict with the MFI’s social agenda.
Not all MFIs will be affected by credit scarcity. MFIs with a large share of demand and savings deposits depend less on bank borrowing. Also, MFIs with access to government funding or concessional funding from development investors should fare better and maintain comfortable NIMs.
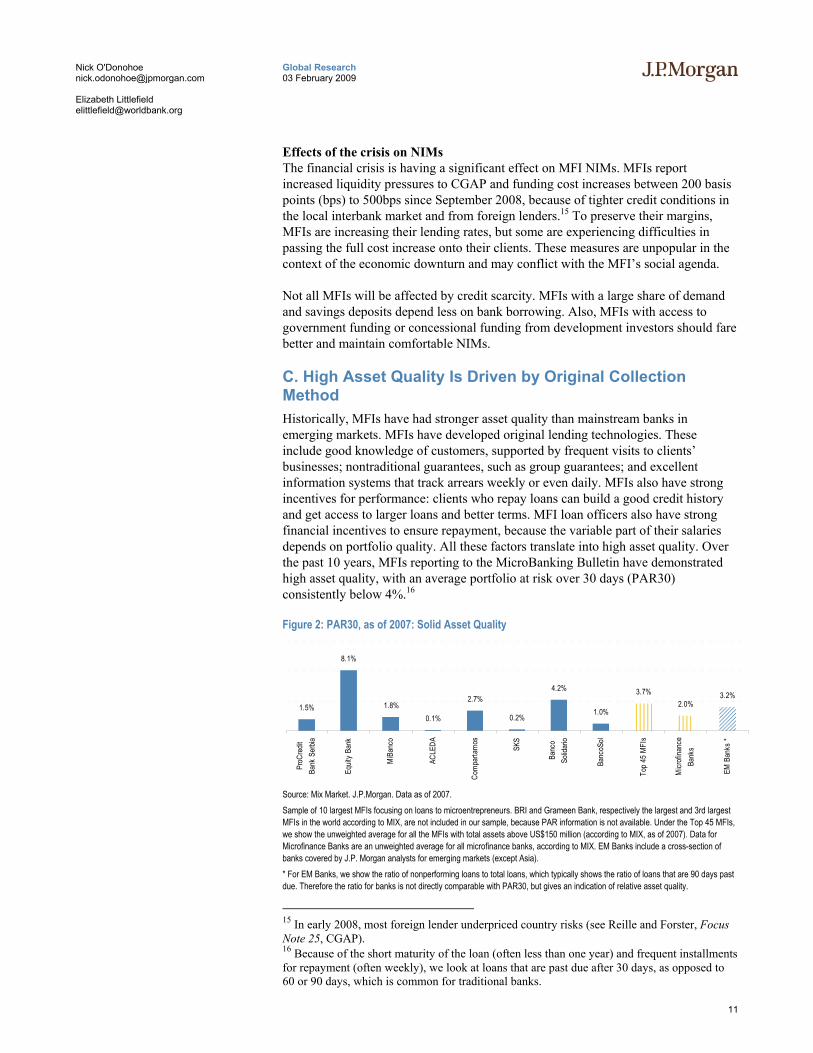
C. High Asset Quality Is Driven by Original Collection Method Historically, MFIs have had stronger asset quality than mainstream banks in emerging markets. MFIs have developed original lending technologies. These include good knowledge of customers, supported by frequent visits to clients’ businesses; nontraditional guarantees, such as group guarantees; and excellent information systems that track arrears weekly or even daily. MFIs also have strong incentives for performance: clients who repay loans can build a good credit history and get access to larger loans and better terms. MFI loan officers also have strong financial incentives to ensure repayment, because the variable part of their salaries depends on portfolio quality. All these factors translate into high asset quality. Over the past 10 years, MFIs reporting to the MicroBanking Bulletin have demonstrated high asset quality, with an average portfolio at risk over 30 days (PAR30) consistently below 4%.16
Figure 2: PAR30, as of 2007: Solid Asset Quality
1.5%
8.1%
1.8%0.1%
2.7%
0.2%
4.2%
1.0%
3.7%2.0%
3.2%
ProC
redit
Bank
Ser
bia
Equit
y Ba
nk
MiB
anco
ACLE
DA
Com
parta
mos
SKS
Banc
oSo
lidar
io
Banc
oSol
Top
45 M
FIs
Micr
ofina
nce
Bank
s
EM B
anks
*
Source: Mix Market. J.P.Morgan. Data as of 2007. Sample of 10 largest MFIs focusing on loans to microentrepreneurs. BRI and Grameen Bank, respectively the largest and 3rd largest MFIs in the world according to MIX, are not included in our sample, because PAR information is not available. Under the Top 45 MFIs, we show the unweighted average for all the MFIs with total assets above US$150 million (according to MIX, as of 2007). Data for Microfinance Banks are an unweighted average for all microfinance banks, according to MIX. EM Banks include a cross-section of banks covered by J.P. Morgan analysts for emerging markets (except Asia). * For EM Banks, we show the ratio of nonperforming loans to total loans, which typically shows the ratio of loans that are 90 days past due. Therefore the ratio for banks is not directly comparable with PAR30, but gives an indication of relative asset quality.
15 In early 2008, most foreign lender underpriced country risks (see Reille and Forster, Focus Note 25, CGAP). 16 Because of the short maturity of the loan (often less than one year) and frequent installments for repayment (often weekly), we look at loans that are past due after 30 days, as opposed to 60 or 90 days, which is common for traditional banks.
12
Global Research 03 February 2009
Nick O'Donohoe [email protected] Elizabeth Littlefield [email protected]
PAR30 shows the value of all loans outstanding (principal and interest) that have one payment past due for more than 30 days. It is important to look at PAR30 in conjunction with the write-off ratio, to ensure that the MFI is not maintaining a low PAR30 by writing off delinquent loans.
Effect of the crisis on asset quality As of January 2009, the effect of the current financial crisis on asset quality is not yet apparent. Microlending has proven to be resilient to economic shocks in the past, such as during financial crises in East Asia and Latin America. This is because microfinance customers tend to operate in the informal sector and to be less integrated into the global economy. They also often provide essential products, such as food or basic services, that remain in high demand even in times of crisis. However, the current financial crisis and the triple effect of economic downturn, fall in remittances, and higher food prices have not been experienced before. It may well translate into lower asset quality for MFIs.
Well-managed MFIs that have a conservative credit policy and a focus on microenterprise lending should remain resilient. MFIs with weak credit standards and large exposure to small and medium-sized enterprises (SMEs), housing, and consumer lending are likely to be affected the most.
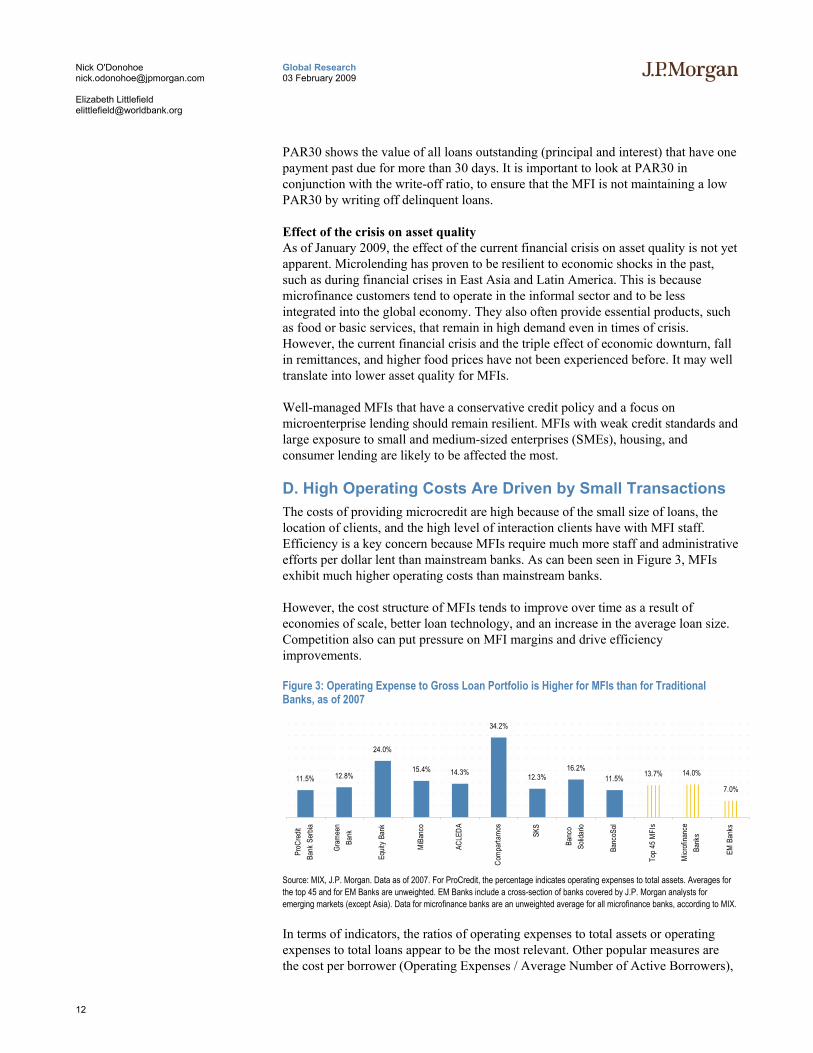
D. High Operating Costs Are Driven by Small Transactions The costs of providing microcredit are high because of the small size of loans, the location of clients, and the high level of interaction clients have with MFI staff. Efficiency is a key concern because MFIs require much more staff and administrative efforts per dollar lent than mainstream banks. As can been seen in Figure 3, MFIs exhibit much higher operating costs than mainstream banks.
However, the cost structure of MFIs tends to improve over time as a result of economies of scale, better loan technology, and an increase in the average loan size. Competition also can put pressure on MFI margins and drive efficiency improvements.
Figure 3: Operating Expense to Gross Loan Portfolio is Higher for MFIs than for Traditional Banks, as of 2007
11.5% 12.8%
24.0%
15.4% 14.3%
34.2%
12.3%16.2%
11.5% 13.7% 14.0%
7.0%
ProC
redit
Bank
Ser
bia
Gram
een
Bank
Equit
y Ba
nk
MiB
anco
ACLE
DA
Com
parta
mos
SKS
Banc
oSo
lidar
io
Banc
oSol
Top
45 M
FIs
Micr
ofina
nce
Bank
s
EM B
anks
Source: MIX, J.P. Morgan. Data as of 2007. For ProCredit, the percentage indicates operating expenses to total assets. Averages for the top 45 and for EM Banks are unweighted. EM Banks include a cross-section of banks covered by J.P. Morgan analysts for emerging markets (except Asia). Data for microfinance banks are an unweighted average for all microfinance banks, according to MIX.
In terms of indicators, the ratios of operating expenses to total assets or operating expenses to total loans appear to be the most relevant. Other popular measures are the cost per borrower (Operating Expenses / Average Number of Active Borrowers),
13
Global Research 03 February 2009
Nick O'Donohoe [email protected] Elizabeth Littlefield [email protected]
staff productivity (Number of Active Borrowers / Total Staff), and the loan officer productivity (Number of Active Borrowers / Number of Loan Officers).
Effect of the crisis on operating costs MFIs have seen their operating costs increase in the first half of 2008 as a result of inflation and higher input costs. Staff costs and transportation costs have been affected the most, with a spike of over 30% reported in Latin American countries. In 2009, we expect inflation to return to lower levels, thus reducing the pressure on wage increases and transportation costs. However, operational efficiency, as measured by operating expenses to loans, may decrease as a result of slow or even negative growth in the microfinance portfolio. MFI staff productivity might also suffer as credit agents allocate more time to loan monitoring and collection.
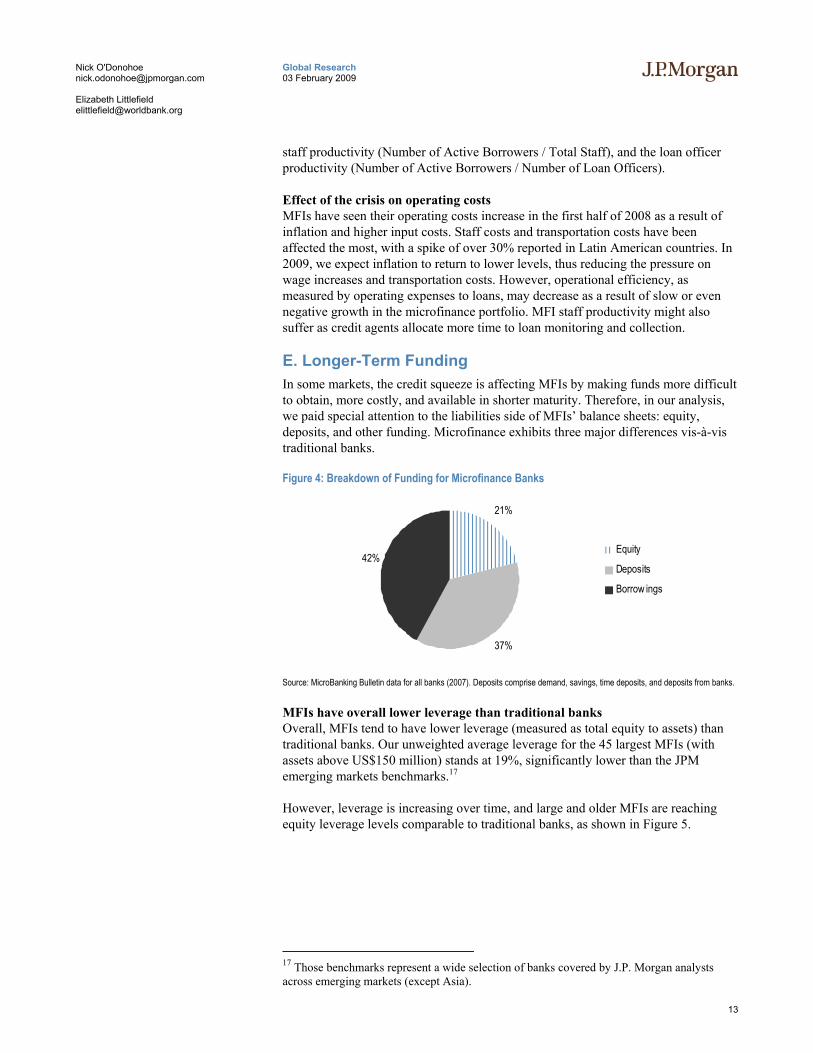
E. Longer-Term Funding In some markets, the credit squeeze is affecting MFIs by making funds more difficult to obtain, more costly, and available in shorter maturity. Therefore, in our analysis, we paid special attention to the liabilities side of MFIs’ balance sheets: equity, deposits, and other funding. Microfinance exhibits three major differences vis-à-vis traditional banks.
Figure 4: Breakdown of Funding for Microfinance Banks
21%
37%
42%Equity
Deposits
Borrow ings
Source: MicroBanking Bulletin data for all banks (2007). Deposits comprise demand, savings, time deposits, and deposits from banks.
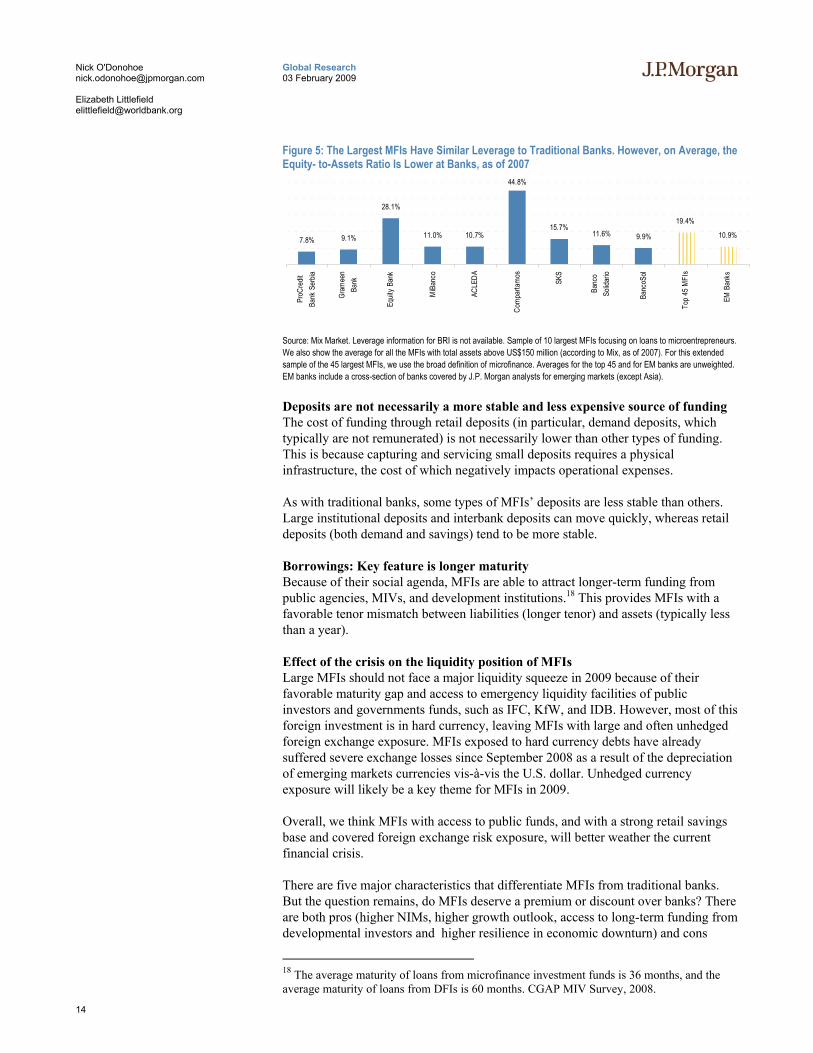
MFIs have overall lower leverage than traditional banks Overall, MFIs tend to have lower leverage (measured as total equity to assets) than traditional banks. Our unweighted average leverage for the 45 largest MFIs (with assets above US$150 million) stands at 19%, significantly lower than the JPM emerging markets benchmarks.17
However, leverage is increasing over time, and large and older MFIs are reaching equity leverage levels comparable to traditional banks, as shown in Figure 5.
17 Those benchmarks represent a wide selection of banks covered by J.P. Morgan analysts across emerging markets (except Asia).
14
Global Research 03 February 2009
Nick O'Donohoe [email protected] Elizabeth Littlefield [email protected]
Figure 5: The Largest MFIs Have Similar Leverage to Traditional Banks. However, on Average, the Equity- to-Assets Ratio Is Lower at Banks, as of 2007
7.8% 9.1%
28.1%
11.0% 10.7%
44.8%
15.7%11.6% 9.9%
19.4%
10.9%
ProC
redit
Bank
Ser
bia
Gram
een
Bank
Equit
y Ba
nk
MiB
anco
ACLE
DA
Com
parta
mos
SKS
Banc
oSo
lidar
io
Banc
oSol
Top
45 M
FIs
EM B
anks
Source: Mix Market. Leverage information for BRI is not available. Sample of 10 largest MFIs focusing on loans to microentrepreneurs. We also show the average for all the MFIs with total assets above US$150 million (according to Mix, as of 2007). For this extended sample of the 45 largest MFIs, we use the broad definition of microfinance. Averages for the top 45 and for EM banks are unweighted. EM banks include a cross-section of banks covered by J.P. Morgan analysts for emerging markets (except Asia).
Deposits are not necessarily a more stable and less expensive source of funding The cost of funding through retail deposits (in particular, demand deposits, which typically are not remunerated) is not necessarily lower than other types of funding. This is because capturing and servicing small deposits requires a physical infrastructure, the cost of which negatively impacts operational expenses.
As with traditional banks, some types of MFIs’ deposits are less stable than others. Large institutional deposits and interbank deposits can move quickly, whereas retail deposits (both demand and savings) tend to be more stable.
Borrowings: Key feature is longer maturity Because of their social agenda, MFIs are able to attract longer-term funding from public agencies, MIVs, and development institutions.18 This provides MFIs with a favorable tenor mismatch between liabilities (longer tenor) and assets (typically less than a year).
Effect of the crisis on the liquidity position of MFIs Large MFIs should not face a major liquidity squeeze in 2009 because of their favorable maturity gap and access to emergency liquidity facilities of public investors and governments funds, such as IFC, KfW, and IDB. However, most of this foreign investment is in hard currency, leaving MFIs with large and often unhedged foreign exchange exposure. MFIs exposed to hard currency debts have already suffered severe exchange losses since September 2008 as a result of the depreciation of emerging markets currencies vis-à-vis the U.S. dollar. Unhedged currency exposure will likely be a key theme for MFIs in 2009.
Overall, we think MFIs with access to public funds, and with a strong retail savings base and covered foreign exchange risk exposure, will better weather the current financial crisis.
There are five major characteristics that differentiate MFIs from traditional banks. But the question remains, do MFIs deserve a premium or discount over banks? There are both pros (higher NIMs, higher growth outlook, access to long-term funding from developmental investors and higher resilience in economic downturn) and cons
18 The average maturity of loans from microfinance investment funds is 36 months, and the average maturity of loans from DFIs is 60 months. CGAP MIV Survey, 2008.

15
Global Research 03 February 2009
Nick O'Donohoe [email protected] Elizabeth Littlefield [email protected]
(social agenda, small size, lower efficiency, and reputation risks of lending to the poor). A premium or discount should be evaluated case by case, based on the MFI characteristics and market environment.
16
Global Research 03 February 2009
Nick O'Donohoe [email protected] Elizabeth Littlefield [email protected]
2. Technical Overview of Valuation Methods This chapter addresses commonly used approaches to equity valuation. The three most widely used valuation techniques involve two types of multiples and future cash flows. Multiples can be based on historical values (trailing multiple) or future estimates (forward multiple) of prior transactions of the same institutions or comparables transactions at other institutions.
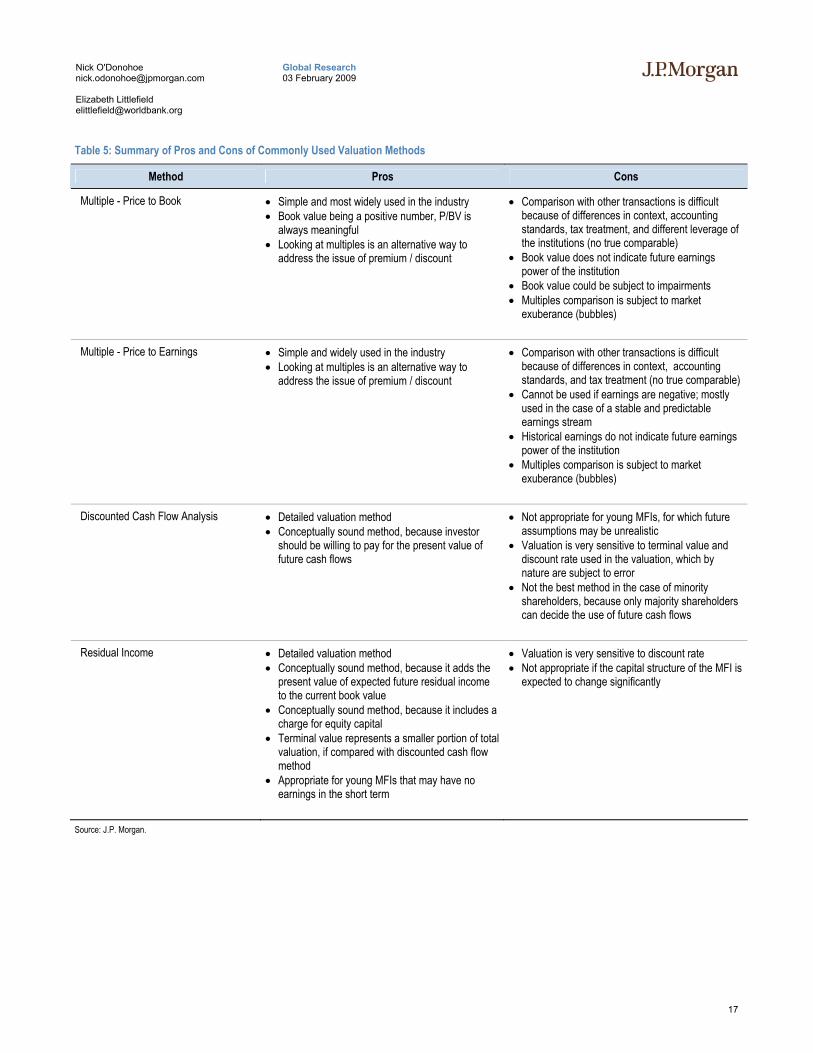
Table 5 summarizes four approaches and highlights their relative advantages and limitations. Investors tend to rely on both absolute and relative valuation methods. We recommend residual income analysis as a sound absolute valuation method; we also advise investors to cross-check valuation with multiples of comparable transactions and companies, which stand for the relative approach.
Relative Valuation: P/BV Multiple The price-to-book value (P/BV) multiple is the ratio of the market price per share to the book value per share of the company. To find book value, we subtract total assets from total liabilities. Since we are looking for the value of common stock only, we also subtract the value of preferred stock. Book value, being a balance sheet item, is cumulative in nature (unlike earnings per share, which is a flow item) and represents the investment of shareholders in the firm over time. The driver of P/BV is the return on equity (ROE) of the institution.
Finance companies typically hold a large share of relatively liquid assets, making this a widely used and relevant valuation measure for the financial services industry—book value is meant to reflect the net market value of assets. For non-financial firms, the balance sheet often reflects historical values for assets. In the case of financial institutions, book value is also referred to as net asset value (NAV).
Another advantage of the P/BV multiple is that book value is a positive number and is usually subject to less volatility than earnings, making the P/BV multiple more useful than price-to-earnings (P/E) multiples. In fact, in the case of negative earnings, P/E multiples are meaningless.
One of the main limitations of this ratio is that book value ignores some assets that may be critical to the company, such as the value of human capital. In most cases, MFIs tend to have little to no intangible assets or goodwill. However, investors should look at write-off policies (which vary among MFIs) and unhedged foreign exchange exposures to adjust book values, because those two items can significantly impair capital.
The P/BV multiple is by far the most commonly used methodology in microfinance.
17
Global Research 03 February 2009
Nick O'Donohoe [email protected] Elizabeth Littlefield [email protected]
Table 5: Summary of Pros and Cons of Commonly Used Valuation Methods
Method Pros Cons
Multiple - Price to Book • Simple and most widely used in the industry • Book value being a positive number, P/BV is
always meaningful • Looking at multiples is an alternative way to
address the issue of premium / discount
• Comparison with other transactions is difficult because of differences in context, accounting standards, tax treatment, and different leverage of the institutions (no true comparable)
• Book value does not indicate future earnings power of the institution
• Book value could be subject to impairments • Multiples comparison is subject to market
exuberance (bubbles)
Multiple - Price to Earnings • Simple and widely used in the industry • Looking at multiples is an alternative way to
address the issue of premium / discount
• Comparison with other transactions is difficult because of differences in context, accounting standards, and tax treatment (no true comparable)
• Cannot be used if earnings are negative; mostly used in the case of a stable and predictable earnings stream
• Historical earnings do not indicate future earnings power of the institution
• Multiples comparison is subject to market exuberance (bubbles)
Discounted Cash Flow Analysis • Detailed valuation method • Conceptually sound method, because investor
should be willing to pay for the present value of future cash flows
• Not appropriate for young MFIs, for which future assumptions may be unrealistic
• Valuation is very sensitive to terminal value and discount rate used in the valuation, which by nature are subject to error
• Not the best method in the case of minority shareholders, because only majority shareholders can decide the use of future cash flows
Residual Income • Detailed valuation method • Conceptually sound method, because it adds the
present value of expected future residual income to the current book value
• Conceptually sound method, because it includes a charge for equity capital
• Terminal value represents a smaller portion of total valuation, if compared with discounted cash flow method
• Appropriate for young MFIs that may have no earnings in the short term
• Valuation is very sensitive to discount rate • Not appropriate if the capital structure of the MFI is
expected to change significantly
Source: J.P. Morgan.
18
Global Research 03 February 2009
Nick O'Donohoe [email protected] Elizabeth Littlefield [email protected]
Relative Valuation: P/E Multiple The P/E multiple is the ratio of the market price per share to the earnings per share (EPS) of the company. Two types of P/E measures are commonly used: the trailing P/E and the forward P/E. The trailing P/E compares the current market price to the EPS of the four most recent quarters of the company. This measure is commonly quoted in newspapers. The forward P/E compares the current market price of the stock to an estimate of future EPS. The driver of the P/E multiple is the estimated EPS growth of the institution.
The main advantage of the P/E multiple is that earnings power (EPS) is the chief focus of analysts and investors. As such, it is widely used and recognized.
The main limitations of the P/E multiple rest in the fact that earnings can be volatile, or even negative, in which case P/E becomes meaningless. This is particularly true for young MFIs. Also, companies can have different accounting rules, which make intertemporal and intercompany comparisons difficult. In particular, differing provisioning policies for loan losses and tax credits may have a significant effect on the net income reported by the company and can blur comparisons. As in the case of book value, varying accounting practices mean that analysts are expected to adjust reported numbers to come up with a recurring net income figure, which would reflect the actual earnings power of the company.
A key point to keep in mind with the P/E multiple is the potential dilution of earnings caused by the conversion of options, warrants, and convertible bonds to common stock.
Absolute Valuation: Discounting Future Flows Defining future earnings flows and discounting them to the present is another common valuation method. The main advantage of this method is that it is more detailed than the multiples analysis and requires the analysis to make explicit forecasts of revenues for the company over a number of years (most often, forecasts are for 5 to 10 years). On the other hand, because it is so detailed, it is also a complex methodology that requires understanding assumptions underlying projections of revenues.
The discounted cash flow (DCF) valuation is appropriate for young MFIs that are growing rapidly. In our private transactions study, the DCF method was used by less than 10% of respondents, while all investors reported using the P/BV multiple and most also used P/E multiples.
Different types of earnings flows can be discounted. These depend on the definition of cash flows that is chosen. The purpose of this method is to define the earnings power of a company and therefore the amount of cash it will generate for investors. Some analysts may choose dividends as a good proxy for cash, while others may look at free cash flow to the firm (FCFF), free cash flow to equity investors (FCFE) described below, or residual income (described below). At the end of the explicit forecast period, a terminal value is calculated assuming a constant growth rate for earnings into the indefinite future. Once defined, those future cash flows are discounted to the present using a discounting factor—in effect, these various calculation approaches find the present value of a future stream of cash.
19
Global Research 03 February 2009
Nick O'Donohoe [email protected] Elizabeth Littlefield [email protected]
The difficulty of DCF valuations lies in their dependence on two inputs: (i) the terminal growth rate of earnings and (ii) the discount rate used (the cost of equity). An important limitation of DCF valuations is that a sizeable part of the final value of equity comes from the terminal value, and this terminal value is very sensitive to changes in those two assumptions. Changes to these estimates lead to large variations in the price calculated.
For MFIs, the most appropriate DCF methods are the FCFE model and the residual income analysis. Dividend discount models are more relevant for stable and mature financial institutions that have a defined dividend policy.
FCFE FCFE starts with the cash flows available to equity holders in the firm. It consists of the sum of the operational cash flow (net income plus any noncash items, such as provisions), the investing cash flow, and the financing cash flow. Because they represent the cash available to equity holders only, they are discounted at the cost of equity.
Residual income analysis Unlike the pure DCF techniques, which forecast future cash flow values and discount them back to the present, the residual income model is a hybrid that starts with the current book value and adds the present value of expected future residual income. Residual income is the difference between net income and the opportunity cost to shareholders to invest in the MFI’s equity (calculated as the cost of equity multiplied by book value). The main advantage of this method over pure DCF is that the terminal value represents a smaller part of the total valuation.
It is particularly useful in situations where the firm is either not paying dividends or is paying them in an irregular pattern. Also, for young, growing MFIs that will start generating a positive free cash flow only in the future, it is easier to use the current book value as a base for valuation. However, the method may not be appropriate for companies that will see their capital structure change dramatically, in particular in the case of an MFI that increases its leverage or is expected to make acquisitions.
Remarks on the Cost of Equity The cost of equity (COE) is the return that the providers of equity capital expect in return for their funds. The most commonly used method of finding the COE is the capital asset pricing model (CAPM), where the COE is the sum of the risk-free rate (rf) and a premium for bearing the stock’s risk. This premium is the product of the stock’s beta (β) (sensitivity of the stock price to changes in the market return) and the market risk premium (MRP), which is the expected market return over the risk-free rate.
COE = rf + β * MRP
The risk-free rate is calculated as the yield on long-term government bonds. Investors commonly use the 10-year U.S. government bond as a proxy for the risk-free rate and add to it a country risk. MRP is the expected return of the market (in this case, the equity market) over the risk-free rate on the long run. We follow the convention and

20
Global Research 03 February 2009
Nick O'Donohoe [email protected] Elizabeth Littlefield [email protected]
consider an MRP of 5%, on average. Following a historical approach, the analysis suggests that the equity risk premium gravitates around 5–7%.19
Remarks on beta and Diversification Effect The main unknown in this CAPM equation is therefore β. As already noted, beta represents the sensitivity of the stock price to changes in a specific equity market. A beta of 0.9 indicates that the stock price of the company moves by 0.9 when the benchmark index moves by 1. This suggests that adding a stock with lower beta could help minimize the overall volatility of a portfolio.
We believe that in the long run, MFIs should have a lower beta than traditional financial institutions and therefore should offer diversification benefits to portfolio managers. We see three main reasons to support our assumption on the counter cyclicality of MFIs:
1. MFIs have original risk management techniques. The following characteristics of microfinance can be seen as effective risk management techniques: disburse small loans, shorten maturities, keep a large client base, maintain intimate/direct knowledge of customer, use dynamic incentives by conditioning new loans on full repayment of a previous ones, require borrowers to deposit a percentage of the loan at a bank, and sometimes rely on peer group knowledge of a borrower’s repayment capacity and social pressure for repayment. Based on historical delinquency data, it seems that these techniques more than compensate for the absence of collateral.
2. Their client base operates in safer sectors. Microfinance customers tend to operate in the informal sector and be less integrated into the formal economy. They provide small-ticket items and offer essential products, such as food or clothing. Because they serve the needs of their close community, microborrowers are also less dependent on imports and currency fluctuations.
3. MFIs’ funding tends to have a longer maturity than their assets. As mentioned previously, we believe that MFIs, on average, have a favorable duration mismatch. The main reason for this is that they are able to attract lines of credit from public agencies, DFIs, and social investors, which tend to have long tenures.
Empirical evidence tends to suggest that MFIs fare relatively better than other financial institutions in the event of an economic recession, in particular for asset quality. The resilience of microfinance to economic shocks has been documented in numerous country case studies (including Indonesia, Bolivia, and Mexico).20 In 2001, a U.S. deceleration affected the traditional banking sector in Mexico but had little effect on Compartamos’ operations. Microfinance banks in Indonesia fared much better than mainstream banks during the 1999 crisis, in particular when looking at asset quality. Two recent econometric analyses also found no strong and statistically significant correlation between GDP growth and the financial performance of MFIs, although data availability is still too scarce to draw solid conclusions.21
19 Dimson, Marsh, and Staunton, Triumph of the Optimists, Princeton University Press, 2002. 20 Glenn D. Westley, Microfinance in the Caribbean: how to go further, Inter American Development Bank, 2005, Technical paper. 21 Adrian Gonzalez, Resilience of microfinance institutions to national macroeconomic events: an econometric analysis of MFI asset quality, MIX discussion paper No 1, Washington DC,
21
Global Research 03 February 2009
Nick O'Donohoe [email protected] Elizabeth Littlefield [email protected]
At the same time, we recognize that MFIs are more exposed to regulatory risks. Change in banking regulations, such as caps on interest rates, can undermine the profitability of microfinance. Also, MFIs lending to the poor at relatively high interest rates are exposed to political pressure and media scrutiny.
Overall, however, our view is that MFIs tend to present a lower operational risk than traditional banks, which in turn justifies a lower beta.
Remarks on Liquidity Most investors in the microfinance space would reduce normal valuation by some liquidity (or illiquidity) discount, reflecting the absence of a liquid market for MFI shares. Based on our conversations with market participants, we believe that reasonable illiquidity discounts would range between 10% and 30% of the normal value of the MFI. The value of the discount would depend on a series of factors, such as the liquidity on the local stock exchange where the MFI would be traded, the percentage of free float, and shareholding structure.
Academic research has tried to apply concepts of option pricing to the problem of liquidity, by valuing liquidity in a similar way as an option to sell a share (put option).22 We believe this approach is interesting conceptually, but gives limited empirical guidance to investors, because of the limitations of the model’s assumptions.
Our view is that relative valuation methods (comparable transactions and companies) allow investors to go around the problem of liquidity discounts (and other discounts for that matter) and, therefore, should be used in conjunction with the absolute methods described above.
Valuation Methods Complement Each Other In some cases (mostly for Indian MFIs), we came across more original valuation tools, such as multiples of price to loan book or price to number of clients. They remind us of multiples used to value Internet companies (before the bubble burst). The rationale behind those is that an MFI should be able to extract value from its loan book and each of its customers. However, we find those multiples of limited use, because investors have no benchmark to draw conclusions from them and eventually will want to look at current book value and future earnings power.
Valuation models based on an absolute approach (DCF, residual income) or on a comparative transaction approach are all useful frameworks. When the assumptions in the models are consistent, those different approaches should give similar values. In practice, it may not always be possible to forecast every line item of the financial statements with the same degree of accuracy.
In the case of a young, fast-growing MFI or an MFI that is not likely to have positive cash flows in the short term, projecting future cash flows may be difficult. In which 2007; Nicholas Krauss and Walter I., Can microfinance reduce portfolio volatility? NYU Stern School of Business, Working paper, New York, 2008. 22 Dyl, Edward and George Jiang, “Valuing Illiquid Common Stock,” Financial Analysts Journal, vol.64, Number 4, pp. 40-47.

22
Global Research 03 February 2009
Nick O'Donohoe [email protected] Elizabeth Littlefield [email protected]
case, the residual income model may prove more useful. For more established MFIs with a stable earnings stream, the DCF model is appropriate. As for most companies, looking at the multiples of comparable companies or comparable transactions in the past is an important and necessary cross-check in the valuation process.
Appendix IV contains a table with current multiples for all financial institutions covered by J.P. Morgan Emerging Markets analysts.
23
Global Research 03 February 2009
Nick O'Donohoe [email protected] Elizabeth Littlefield [email protected]
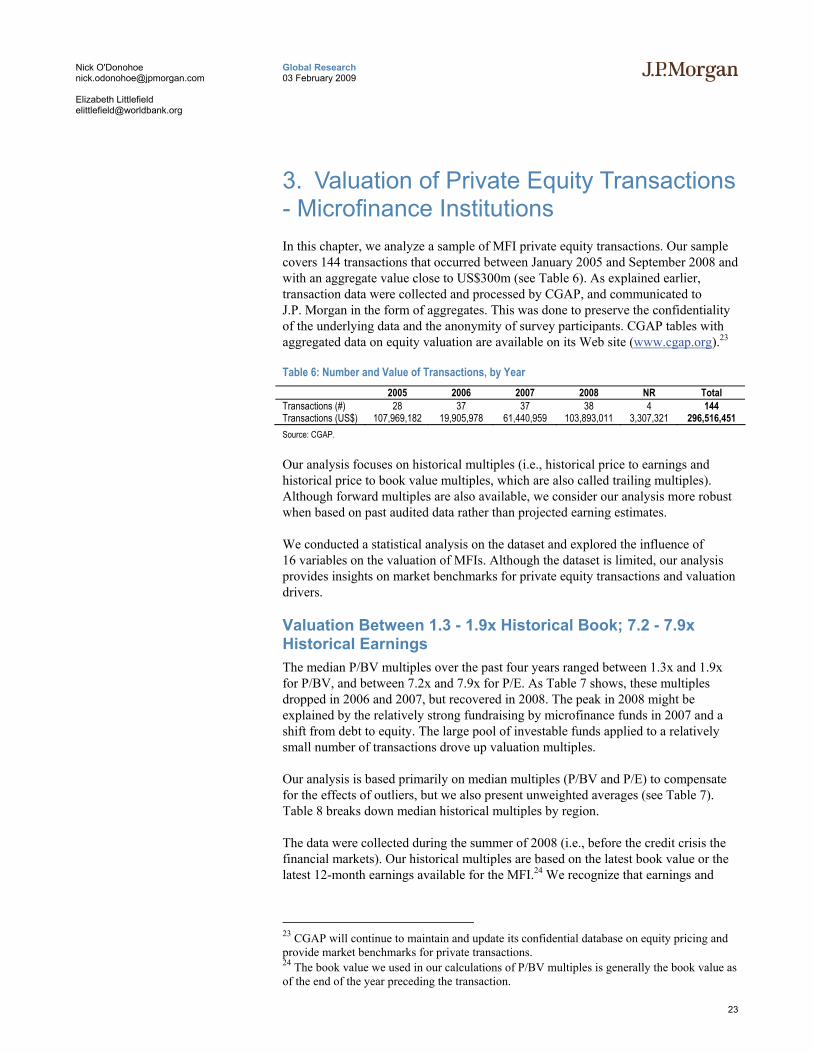
3. Valuation of Private Equity Transactions - Microfinance Institutions In this chapter, we analyze a sample of MFI private equity transactions. Our sample covers 144 transactions that occurred between January 2005 and September 2008 and with an aggregate value close to US$300m (see Table 6). As explained earlier, transaction data were collected and processed by CGAP, and communicated to J.P. Morgan in the form of aggregates. This was done to preserve the confidentiality of the underlying data and the anonymity of survey participants. CGAP tables with aggregated data on equity valuation are available on its Web site (www.cgap.org).23
Table 6: Number and Value of Transactions, by Year 2005 2006 2007 2008 NR Total
Transactions (#) 28 37 37 38 4 144 Transactions (US$) 107,969,182 19,905,978 61,440,959 103,893,011 3,307,321 296,516,451 Source: CGAP.
Our analysis focuses on historical multiples (i.e., historical price to earnings and historical price to book value multiples, which are also called trailing multiples). Although forward multiples are also available, we consider our analysis more robust when based on past audited data rather than projected earning estimates.
We conducted a statistical analysis on the dataset and explored the influence of 16 variables on the valuation of MFIs. Although the dataset is limited, our analysis provides insights on market benchmarks for private equity transactions and valuation drivers.
Valuation Between 1.3 - 1.9x Historical Book; 7.2 - 7.9x Historical Earnings The median P/BV multiples over the past four years ranged between 1.3x and 1.9x for P/BV, and between 7.2x and 7.9x for P/E. As Table 7 shows, these multiples dropped in 2006 and 2007, but recovered in 2008. The peak in 2008 might be explained by the relatively strong fundraising by microfinance funds in 2007 and a shift from debt to equity. The large pool of investable funds applied to a relatively small number of transactions drove up valuation multiples.
Our analysis is based primarily on median multiples (P/BV and P/E) to compensate for the effects of outliers, but we also present unweighted averages (see Table 7). Table 8 breaks down median historical multiples by region.
The data were collected during the summer of 2008 (i.e., before the credit crisis the financial markets). Our historical multiples are based on the latest book value or the latest 12-month earnings available for the MFI.24 We recognize that earnings and
23 CGAP will continue to maintain and update its confidential database on equity pricing and provide market benchmarks for private transactions. 24 The book value we used in our calculations of P/BV multiples is generally the book value as of the end of the year preceding the transaction.
24
Global Research 03 February 2009
Nick O'Donohoe [email protected] Elizabeth Littlefield [email protected]
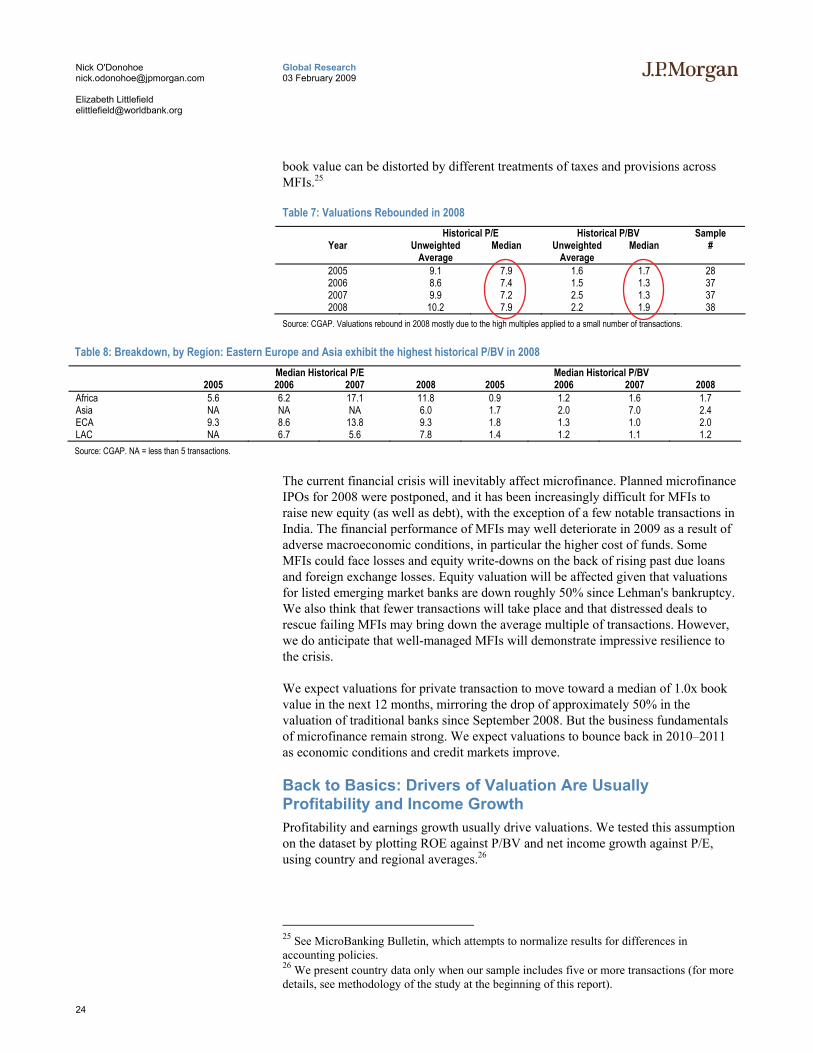
book value can be distorted by different treatments of taxes and provisions across MFIs.25
Table 7: Valuations Rebounded in 2008 Historical P/E Historical P/BV Sample
Year Unweighted Average
Median Unweighted Average
Median #
2005 9.1 7.9 1.6 1.7 28 2006 8.6 7.4 1.5 1.3 37 2007 9.9 7.2 2.5 1.3 37 2008 10.2 7.9 2.2 1.9 38
Source: CGAP. Valuations rebound in 2008 mostly due to the high multiples applied to a small number of transactions.
Table 8: Breakdown, by Region: Eastern Europe and Asia exhibit the highest historical P/BV in 2008 Median Historical P/E Median Historical P/BV 2005 2006 2007 2008 2005 2006 2007 2008
Africa 5.6 6.2 17.1 11.8 0.9 1.2 1.6 1.7 Asia NA NA NA 6.0 1.7 2.0 7.0 2.4 ECA 9.3 8.6 13.8 9.3 1.8 1.3 1.0 2.0 LAC NA 6.7 5.6 7.8 1.4 1.2 1.1 1.2 Source: CGAP. NA = less than 5 transactions.
The current financial crisis will inevitably affect microfinance. Planned microfinance IPOs for 2008 were postponed, and it has been increasingly difficult for MFIs to raise new equity (as well as debt), with the exception of a few notable transactions in India. The financial performance of MFIs may well deteriorate in 2009 as a result of adverse macroeconomic conditions, in particular the higher cost of funds. Some MFIs could face losses and equity write-downs on the back of rising past due loans and foreign exchange losses. Equity valuation will be affected given that valuations for listed emerging market banks are down roughly 50% since Lehman's bankruptcy. We also think that fewer transactions will take place and that distressed deals to rescue failing MFIs may bring down the average multiple of transactions. However, we do anticipate that well-managed MFIs will demonstrate impressive resilience to the crisis.
We expect valuations for private transaction to move toward a median of 1.0x book value in the next 12 months, mirroring the drop of approximately 50% in the valuation of traditional banks since September 2008. But the business fundamentals of microfinance remain strong. We expect valuations to bounce back in 2010–2011 as economic conditions and credit markets improve.
Back to Basics: Drivers of Valuation Are Usually Profitability and Income Growth Profitability and earnings growth usually drive valuations. We tested this assumption on the dataset by plotting ROE against P/BV and net income growth against P/E, using country and regional averages.26
25 See MicroBanking Bulletin, which attempts to normalize results for differences in accounting policies. 26 We present country data only when our sample includes five or more transactions (for more details, see methodology of the study at the beginning of this report).
25
Global Research 03 February 2009
Nick O'Donohoe [email protected] Elizabeth Littlefield [email protected]
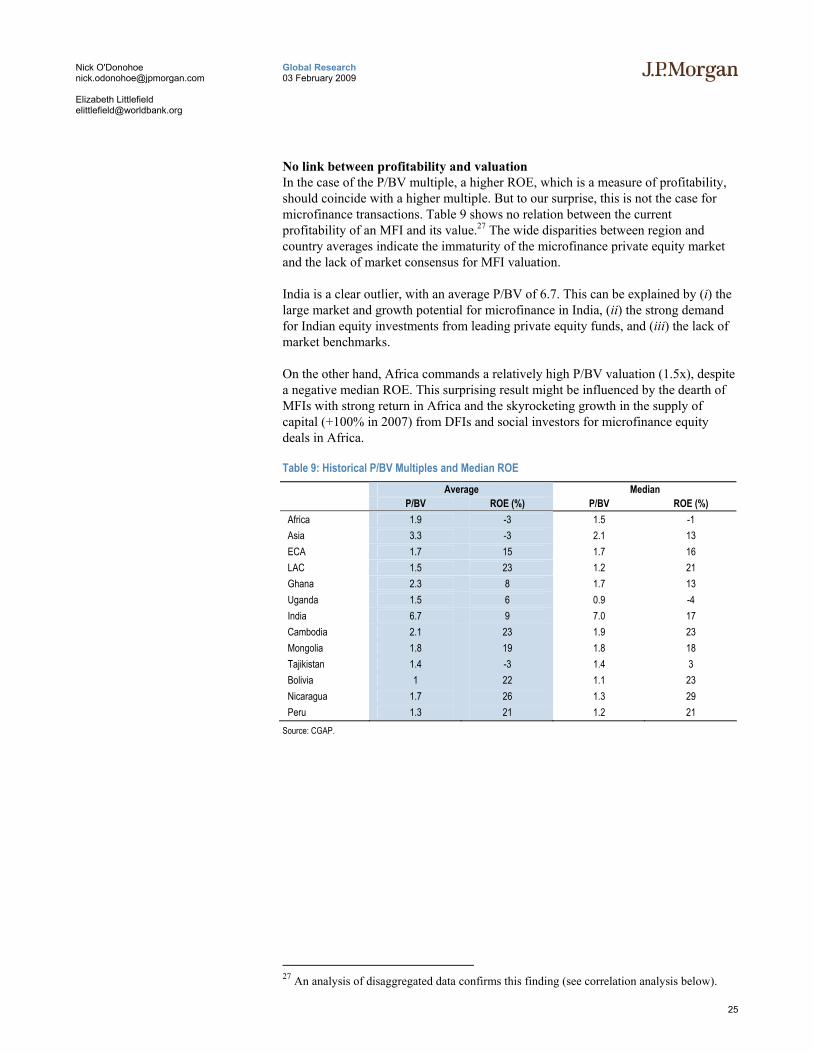
No link between profitability and valuation In the case of the P/BV multiple, a higher ROE, which is a measure of profitability, should coincide with a higher multiple. But to our surprise, this is not the case for microfinance transactions. Table 9 shows no relation between the current profitability of an MFI and its value.27 The wide disparities between region and country averages indicate the immaturity of the microfinance private equity market and the lack of market consensus for MFI valuation.
India is a clear outlier, with an average P/BV of 6.7. This can be explained by (i) the large market and growth potential for microfinance in India, (ii) the strong demand for Indian equity investments from leading private equity funds, and (iii) the lack of market benchmarks.
On the other hand, Africa commands a relatively high P/BV valuation (1.5x), despite a negative median ROE. This surprising result might be influenced by the dearth of MFIs with strong return in Africa and the skyrocketing growth in the supply of capital (+100% in 2007) from DFIs and social investors for microfinance equity deals in Africa.
Table 9: Historical P/BV Multiples and Median ROE Average Median P/BV ROE (%) P/BV ROE (%)
Africa 1.9 -3 1.5 -1 Asia 3.3 -3 2.1 13 ECA 1.7 15 1.7 16 LAC 1.5 23 1.2 21 Ghana 2.3 8 1.7 13 Uganda 1.5 6 0.9 -4 India 6.7 9 7.0 17 Cambodia 2.1 23 1.9 23 Mongolia 1.8 19 1.8 18 Tajikistan 1.4 -3 1.4 3 Bolivia 1 22 1.1 23 Nicaragua 1.7 26 1.3 29 Peru 1.3 21 1.2 21
Source: CGAP.
27 An analysis of disaggregated data confirms this finding (see correlation analysis below).
26
Global Research 03 February 2009
Nick O'Donohoe [email protected] Elizabeth Littlefield [email protected]
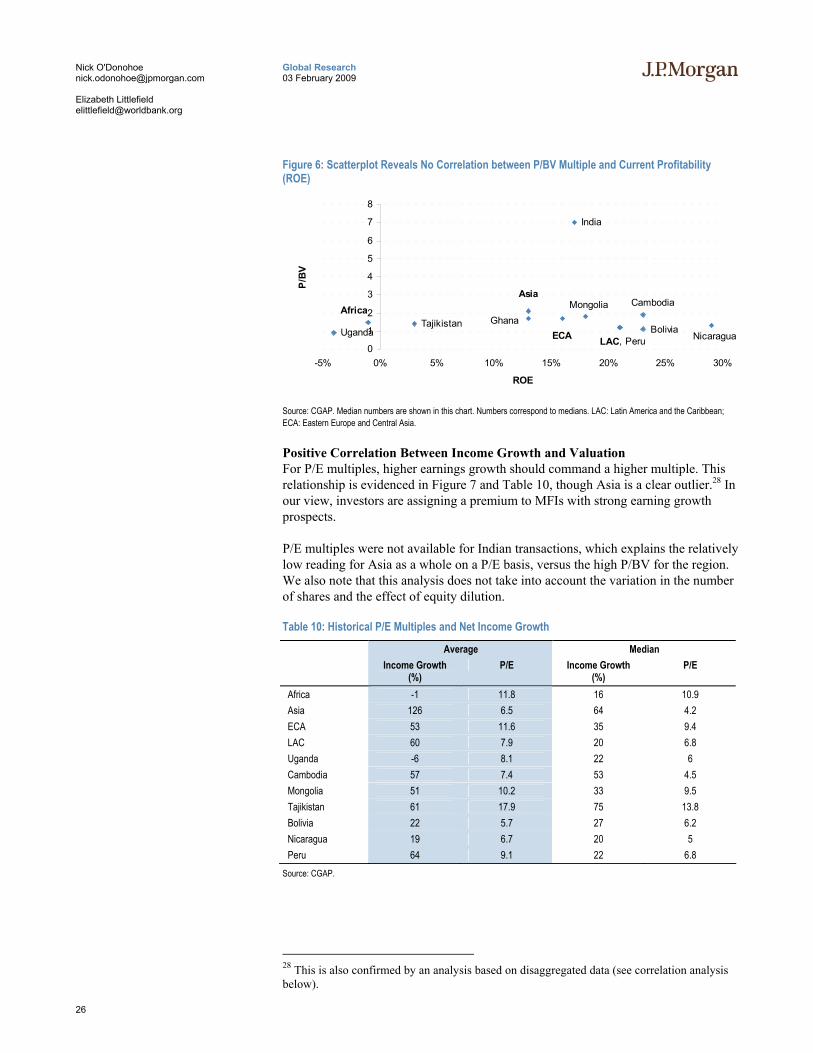
Figure 6: Scatterplot Reveals No Correlation between P/BV Multiple and Current Profitability (ROE)
Nicaragua
Cambodia
TajikistanAfrica
Uganda
Asia
Ghana
LAC, PeruBolivia
Mongolia
ECA
India
0
1
2
3
4
5
6
7
8
-5% 0% 5% 10% 15% 20% 25% 30%
ROE
P/BV
Source: CGAP. Median numbers are shown in this chart. Numbers correspond to medians. LAC: Latin America and the Caribbean; ECA: Eastern Europe and Central Asia.
Positive Correlation Between Income Growth and Valuation For P/E multiples, higher earnings growth should command a higher multiple. This relationship is evidenced in Figure 7 and Table 10, though Asia is a clear outlier.28 In our view, investors are assigning a premium to MFIs with strong earning growth prospects.
P/E multiples were not available for Indian transactions, which explains the relatively low reading for Asia as a whole on a P/E basis, versus the high P/BV for the region. We also note that this analysis does not take into account the variation in the number of shares and the effect of equity dilution.
Table 10: Historical P/E Multiples and Net Income Growth
Average Median Income Growth
(%) P/E Income Growth
(%) P/E
Africa -1 11.8 16 10.9 Asia 126 6.5 64 4.2 ECA 53 11.6 35 9.4 LAC 60 7.9 20 6.8 Uganda -6 8.1 22 6 Cambodia 57 7.4 53 4.5 Mongolia 51 10.2 33 9.5 Tajikistan 61 17.9 75 13.8 Bolivia 22 5.7 27 6.2 Nicaragua 19 6.7 20 5 Peru 64 9.1 22 6.8
Source: CGAP.
28 This is also confirmed by an analysis based on disaggregated data (see correlation analysis below).
27
Global Research 03 February 2009
Nick O'Donohoe [email protected] Elizabeth Littlefield [email protected]
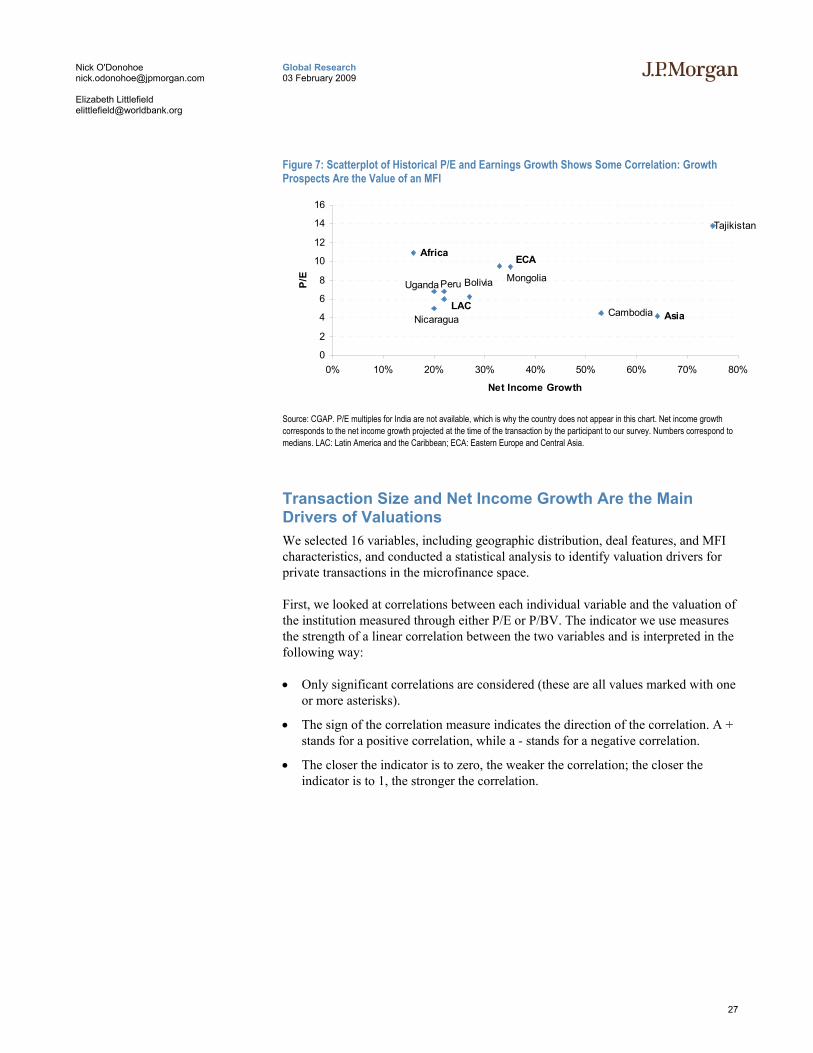
Figure 7: Scatterplot of Historical P/E and Earnings Growth Shows Some Correlation: Growth Prospects Are the Value of an MFI
Tajikistan
Africa
Mongolia
ECA
AsiaCambodiaNicaragua
LAC
BoliviaUganda Peru
0
2
4
6
8
10
12
14
16
0% 10% 20% 30% 40% 50% 60% 70% 80%
Net Income Growth
P/E
Source: CGAP. P/E multiples for India are not available, which is why the country does not appear in this chart. Net income growth corresponds to the net income growth projected at the time of the transaction by the participant to our survey. Numbers correspond to medians. LAC: Latin America and the Caribbean; ECA: Eastern Europe and Central Asia.
Transaction Size and Net Income Growth Are the Main Drivers of Valuations We selected 16 variables, including geographic distribution, deal features, and MFI characteristics, and conducted a statistical analysis to identify valuation drivers for private transactions in the microfinance space.
First, we looked at correlations between each individual variable and the valuation of the institution measured through either P/E or P/BV. The indicator we use measures the strength of a linear correlation between the two variables and is interpreted in the following way:
• Only significant correlations are considered (these are all values marked with one or more asterisks).
• The sign of the correlation measure indicates the direction of the correlation. A + stands for a positive correlation, while a - stands for a negative correlation.
• The closer the indicator is to zero, the weaker the correlation; the closer the indicator is to 1, the stronger the correlation.
28
Global Research 03 February 2009
Nick O'Donohoe [email protected] Elizabeth Littlefield [email protected]
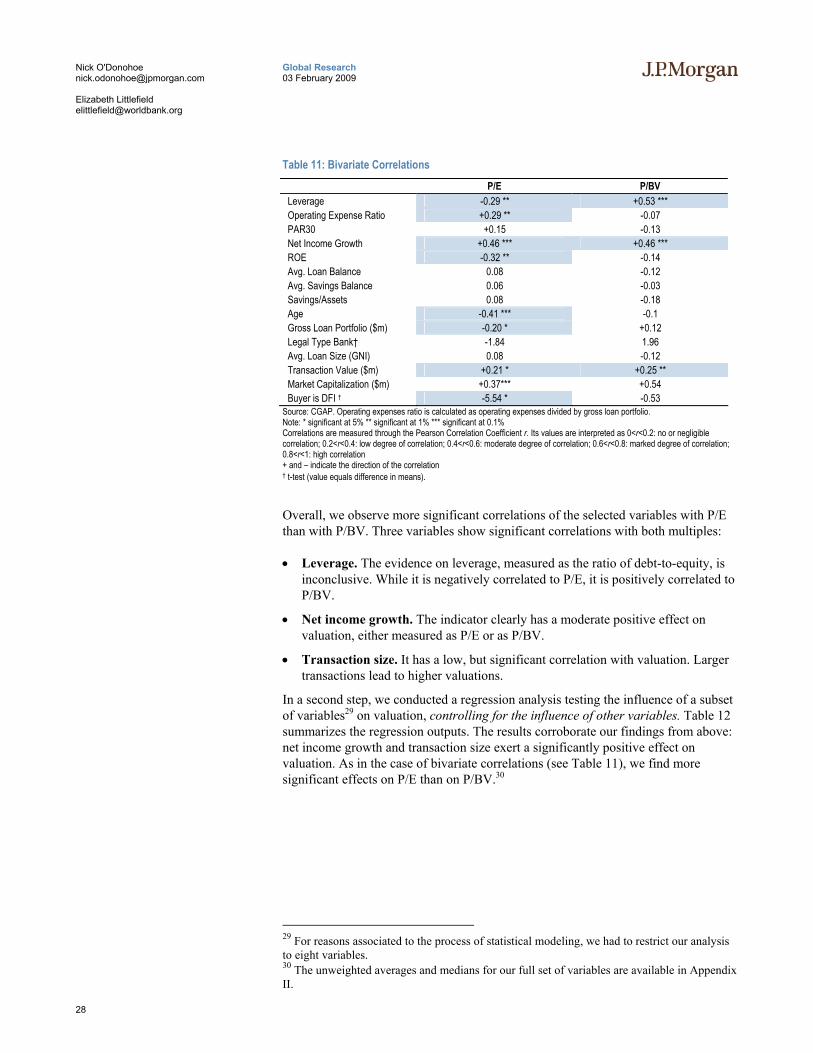
Table 11: Bivariate Correlations P/E P/BV
Leverage -0.29 ** +0.53 *** Operating Expense Ratio +0.29 ** -0.07 PAR30 +0.15 -0.13 Net Income Growth +0.46 *** +0.46 *** ROE -0.32 ** -0.14 Avg. Loan Balance 0.08 -0.12 Avg. Savings Balance 0.06 -0.03 Savings/Assets 0.08 -0.18 Age -0.41 *** -0.1 Gross Loan Portfolio ($m) -0.20 * +0.12 Legal Type Bank† -1.84 1.96 Avg. Loan Size (GNI) 0.08 -0.12 Transaction Value ($m) +0.21 * +0.25 ** Market Capitalization ($m) +0.37*** +0.54 Buyer is DFI † -5.54 * -0.53
Source: CGAP. Operating expenses ratio is calculated as operating expenses divided by gross loan portfolio. Note: * significant at 5% ** significant at 1% *** significant at 0.1% Correlations are measured through the Pearson Correlation Coefficient r. Its values are interpreted as 0<r<0.2: no or negligible correlation; 0.2<r<0.4: low degree of correlation; 0.4<r<0.6: moderate degree of correlation; 0.6<r<0.8: marked degree of correlation; 0.8<r<1: high correlation + and – indicate the direction of the correlation † t-test (value equals difference in means).
Overall, we observe more significant correlations of the selected variables with P/E than with P/BV. Three variables show significant correlations with both multiples:
• Leverage. The evidence on leverage, measured as the ratio of debt-to-equity, is inconclusive. While it is negatively correlated to P/E, it is positively correlated to P/BV.
• Net income growth. The indicator clearly has a moderate positive effect on valuation, either measured as P/E or as P/BV.
• Transaction size. It has a low, but significant correlation with valuation. Larger transactions lead to higher valuations.
In a second step, we conducted a regression analysis testing the influence of a subset of variables29 on valuation, controlling for the influence of other variables. Table 12 summarizes the regression outputs. The results corroborate our findings from above: net income growth and transaction size exert a significantly positive effect on valuation. As in the case of bivariate correlations (see Table 11), we find more significant effects on P/E than on P/BV.30
29 For reasons associated to the process of statistical modeling, we had to restrict our analysis to eight variables. 30 The unweighted averages and medians for our full set of variables are available in Appendix II.
29
Global Research 03 February 2009
Nick O'Donohoe [email protected] Elizabeth Littlefield [email protected]
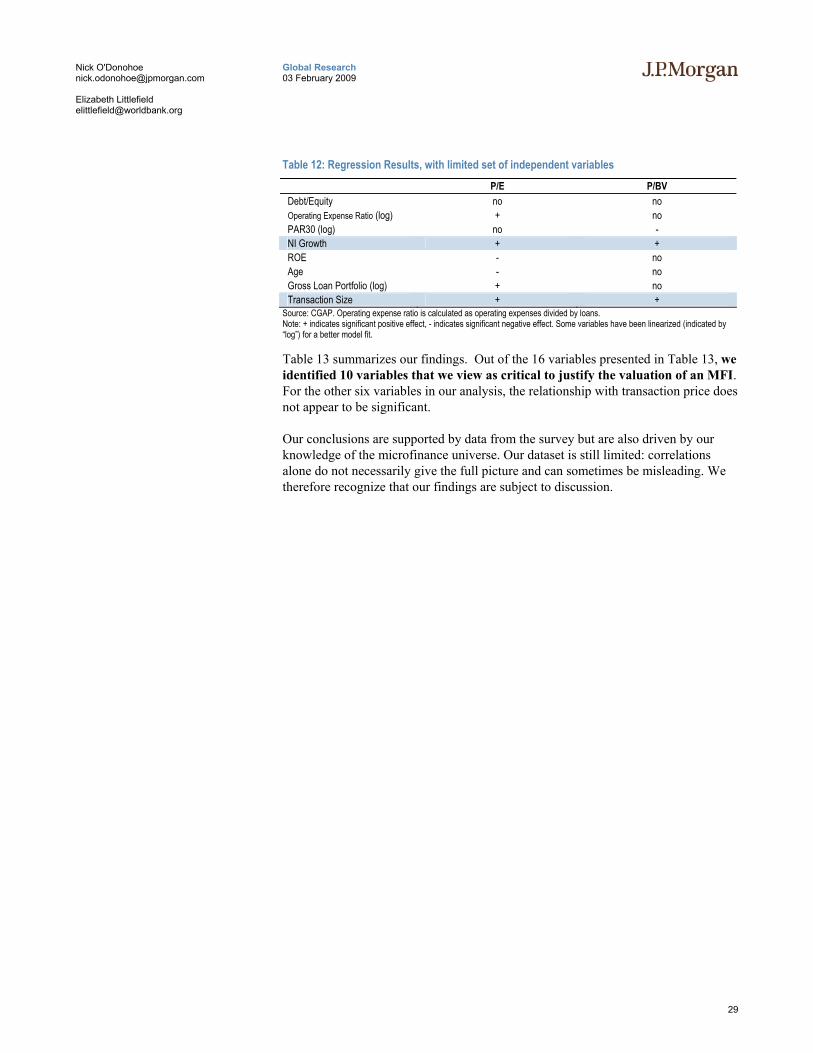
Table 12: Regression Results, with limited set of independent variables P/E P/BV
Debt/Equity no no Operating Expense Ratio (log) + no PAR30 (log) no - NI Growth + + ROE - no Age - no Gross Loan Portfolio (log) + no Transaction Size + +
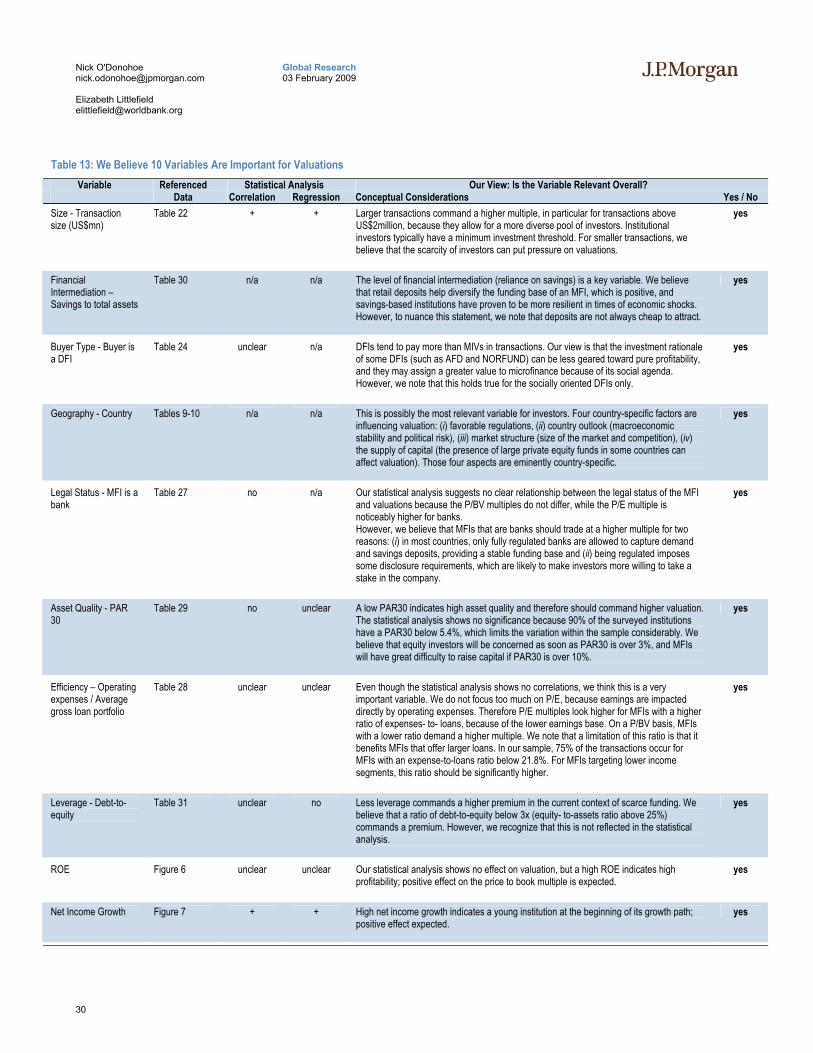
Source: CGAP. Operating expense ratio is calculated as operating expenses divided by loans. Note: + indicates significant positive effect, - indicates significant negative effect. Some variables have been linearized (indicated by “log”) for a better model fit. Table 13 summarizes our findings. Out of the 16 variables presented in Table 13, we identified 10 variables that we view as critical to justify the valuation of an MFI. For the other six variables in our analysis, the relationship with transaction price does not appear to be significant.
Our conclusions are supported by data from the survey but are also driven by our knowledge of the microfinance universe. Our dataset is still limited: correlations alone do not necessarily give the full picture and can sometimes be misleading. We therefore recognize that our findings are subject to discussion.
30
Global Research 03 February 2009
Nick O'Donohoe [email protected] Elizabeth Littlefield [email protected]
Table 13: We Believe 10 Variables Are Important for Valuations Variable Referenced Statistical Analysis Our View: Is the Variable Relevant Overall?
Data Correlation Regression Conceptual Considerations Yes / No Size - Transaction size (US$mn)
Table 22 + + Larger transactions command a higher multiple, in particular for transactions above US$2million, because they allow for a more diverse pool of investors. Institutional investors typically have a minimum investment threshold. For smaller transactions, we believe that the scarcity of investors can put pressure on valuations.
yes
Financial Intermediation – Savings to total assets
Table 30 n/a n/a The level of financial intermediation (reliance on savings) is a key variable. We believe that retail deposits help diversify the funding base of an MFI, which is positive, and savings-based institutions have proven to be more resilient in times of economic shocks. However, to nuance this statement, we note that deposits are not always cheap to attract.
yes
Buyer Type - Buyer is a DFI
Table 24 unclear n/a DFIs tend to pay more than MIVs in transactions. Our view is that the investment rationale of some DFIs (such as AFD and NORFUND) can be less geared toward pure profitability, and they may assign a greater value to microfinance because of its social agenda. However, we note that this holds true for the socially oriented DFIs only.
yes
Geography - Country Tables 9-10 n/a n/a This is possibly the most relevant variable for investors. Four country-specific factors are influencing valuation: (i) favorable regulations, (ii) country outlook (macroeconomic stability and political risk), (iii) market structure (size of the market and competition), (iv) the supply of capital (the presence of large private equity funds in some countries can affect valuation). Those four aspects are eminently country-specific.
yes
Legal Status - MFI is a bank
Table 27 no n/a Our statistical analysis suggests no clear relationship between the legal status of the MFI and valuations because the P/BV multiples do not differ, while the P/E multiple is noticeably higher for banks. However, we believe that MFIs that are banks should trade at a higher multiple for two reasons: (i) in most countries, only fully regulated banks are allowed to capture demand and savings deposits, providing a stable funding base and (ii) being regulated imposes some disclosure requirements, which are likely to make investors more willing to take a stake in the company.
yes
Asset Quality - PAR 30
Table 29 no unclear A low PAR30 indicates high asset quality and therefore should command higher valuation. The statistical analysis shows no significance because 90% of the surveyed institutions have a PAR30 below 5.4%, which limits the variation within the sample considerably. We believe that equity investors will be concerned as soon as PAR30 is over 3%, and MFIs will have great difficulty to raise capital if PAR30 is over 10%.
yes
Efficiency – Operating expenses / Average gross loan portfolio
Table 28 unclear unclear Even though the statistical analysis shows no correlations, we think this is a very important variable. We do not focus too much on P/E, because earnings are impacted directly by operating expenses. Therefore P/E multiples look higher for MFIs with a higher ratio of expenses- to- loans, because of the lower earnings base. On a P/BV basis, MFIs with a lower ratio demand a higher multiple. We note that a limitation of this ratio is that it benefits MFIs that offer larger loans. In our sample, 75% of the transactions occur for MFIs with an expense-to-loans ratio below 21.8%. For MFIs targeting lower income segments, this ratio should be significantly higher.
yes
Leverage - Debt-to-equity
Table 31 unclear no Less leverage commands a higher premium in the current context of scarce funding. We believe that a ratio of debt-to-equity below 3x (equity- to-assets ratio above 25%) commands a premium. However, we recognize that this is not reflected in the statistical analysis.
yes
ROE Figure 6 unclear unclear Our statistical analysis shows no effect on valuation, but a high ROE indicates high profitability; positive effect on the price to book multiple is expected.
yes
Net Income Growth Figure 7 + + High net income growth indicates a young institution at the beginning of its growth path; positive effect expected.
yes
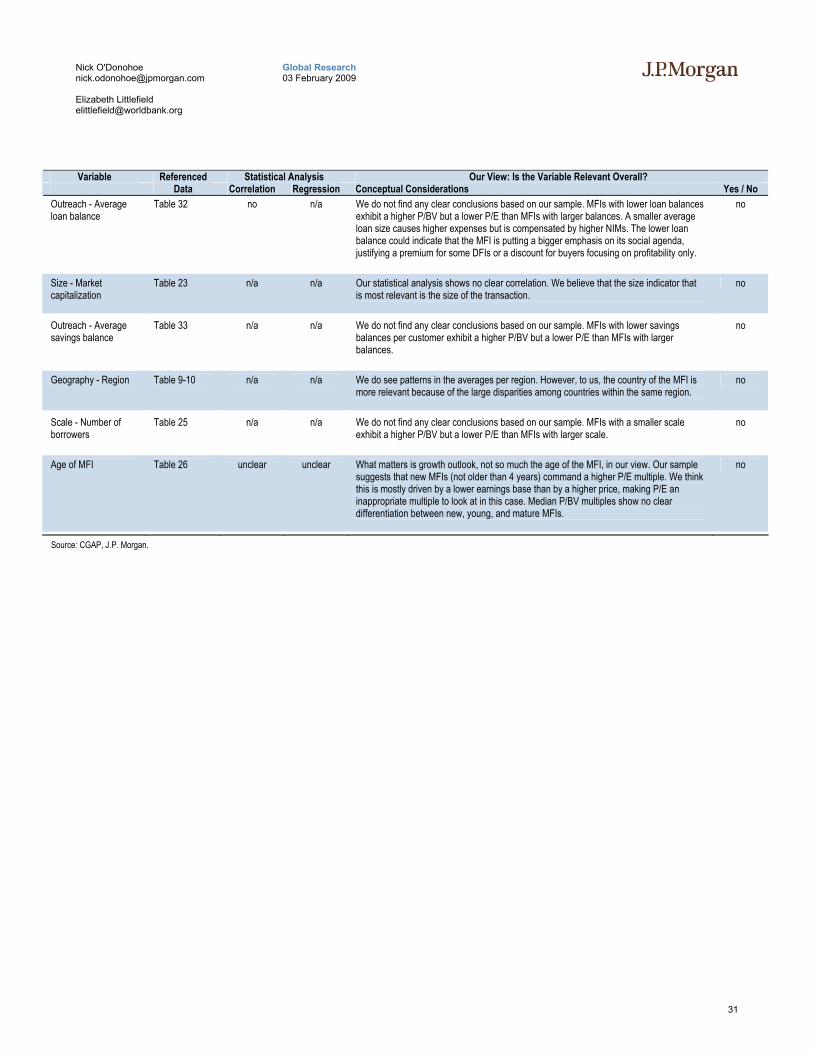
31
Global Research 03 February 2009
Nick O'Donohoe [email protected] Elizabeth Littlefield [email protected]
Variable Referenced Statistical Analysis Our View: Is the Variable Relevant Overall?
Data Correlation Regression Conceptual Considerations Yes / No Outreach - Average loan balance
Table 32 no n/a We do not find any clear conclusions based on our sample. MFIs with lower loan balances exhibit a higher P/BV but a lower P/E than MFIs with larger balances. A smaller average loan size causes higher expenses but is compensated by higher NIMs. The lower loan balance could indicate that the MFI is putting a bigger emphasis on its social agenda, justifying a premium for some DFIs or a discount for buyers focusing on profitability only.
no
Size - Market capitalization
Table 23 n/a n/a Our statistical analysis shows no clear correlation. We believe that the size indicator that is most relevant is the size of the transaction.
no
Outreach - Average savings balance
Table 33 n/a n/a We do not find any clear conclusions based on our sample. MFIs with lower savings balances per customer exhibit a higher P/BV but a lower P/E than MFIs with larger balances.
no
Geography - Region Table 9-10 n/a n/a We do see patterns in the averages per region. However, to us, the country of the MFI is more relevant because of the large disparities among countries within the same region.
no
Scale - Number of borrowers
Table 25 n/a n/a We do not find any clear conclusions based on our sample. MFIs with a smaller scale exhibit a higher P/BV but a lower P/E than MFIs with larger scale.
no
Age of MFI Table 26 unclear unclear What matters is growth outlook, not so much the age of the MFI, in our view. Our sample suggests that new MFIs (not older than 4 years) command a higher P/E multiple. We think this is mostly driven by a lower earnings base than by a higher price, making P/E an inappropriate multiple to look at in this case. Median P/BV multiples show no clear differentiation between new, young, and mature MFIs.
no
Source: CGAP, J.P. Morgan.
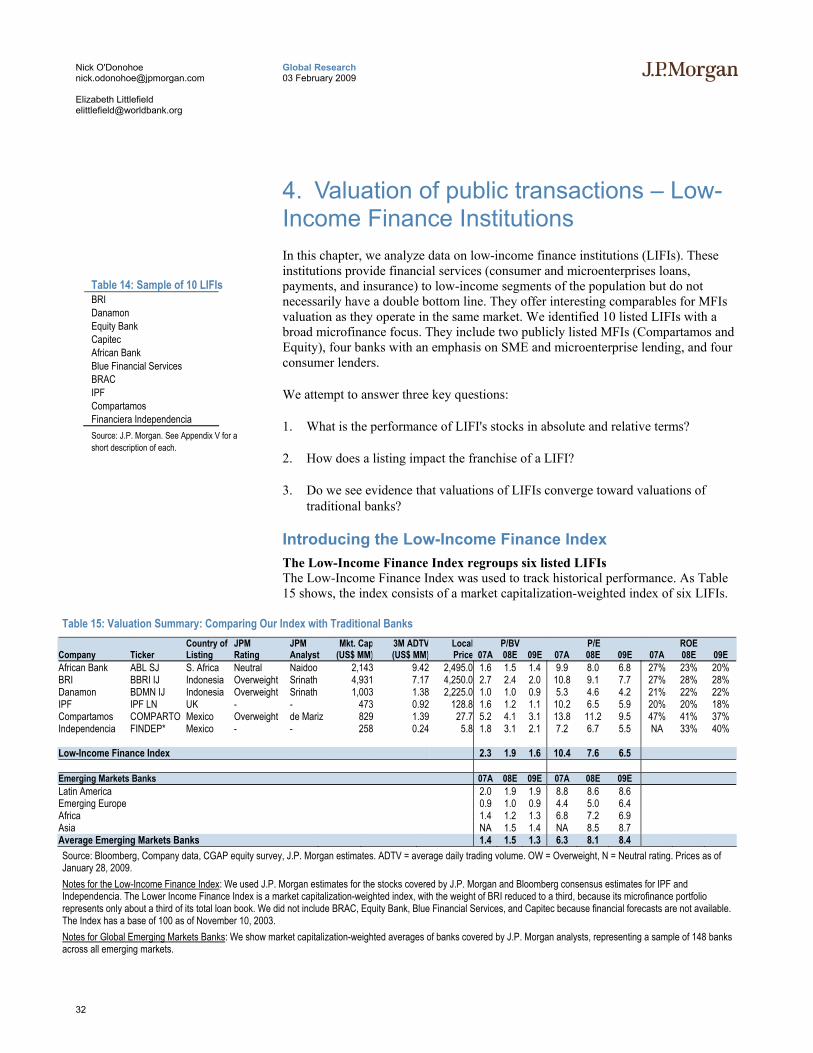
32
Global Research 03 February 2009
Nick O'Donohoe [email protected] Elizabeth Littlefield [email protected]
4. Valuation of public transactions – Low-Income Finance Institutions In this chapter, we analyze data on low-income finance institutions (LIFIs). These institutions provide financial services (consumer and microenterprises loans, payments, and insurance) to low-income segments of the population but do not necessarily have a double bottom line. They offer interesting comparables for MFIs valuation as they operate in the same market. We identified 10 listed LIFIs with a broad microfinance focus. They include two publicly listed MFIs (Compartamos and Equity), four banks with an emphasis on SME and microenterprise lending, and four consumer lenders.
We attempt to answer three key questions:
1. What is the performance of LIFI's stocks in absolute and relative terms?
2. How does a listing impact the franchise of a LIFI?
3. Do we see evidence that valuations of LIFIs converge toward valuations of traditional banks?
Introducing the Low-Income Finance Index The Low-Income Finance Index regroups six listed LIFIs The Low-Income Finance Index was used to track historical performance. As Table 15 shows, the index consists of a market capitalization-weighted index of six LIFIs.
Table 15: Valuation Summary: Comparing Our Index with Traditional Banks Country of JPM JPM Mkt. Cap 3M ADTV Local P/BV P/E ROE
Company Ticker Listing Rating Analyst (US$ MM) (US$ MM) Price 07A 08E 09E 07A 08E 09E 07A 08E 09E African Bank ABL SJ S. Africa Neutral Naidoo 2,143 9.42 2,495.0 1.6 1.5 1.4 9.9 8.0 6.8 27% 23% 20% BRI BBRI IJ Indonesia Overweight Srinath 4,931 7.17 4,250.0 2.7 2.4 2.0 10.8 9.1 7.7 27% 28% 28% Danamon BDMN IJ Indonesia Overweight Srinath 1,003 1.38 2,225.0 1.0 1.0 0.9 5.3 4.6 4.2 21% 22% 22% IPF IPF LN UK - - 473 0.92 128.8 1.6 1.2 1.1 10.2 6.5 5.9 20% 20% 18% Compartamos COMPARTO Mexico Overweight de Mariz 829 1.39 27.7 5.2 4.1 3.1 13.8 11.2 9.5 47% 41% 37% Independencia FINDEP* Mexico - - 258 0.24 5.8 1.8 3.1 2.1 7.2 6.7 5.5 NA 33% 40%
Low-Income Finance Index 2.3 1.9 1.6 10.4 7.6 6.5 Emerging Markets Banks 07A 08E 09E 07A 08E 09E Latin America 2.0 1.9 1.9 8.8 8.6 8.6 Emerging Europe 0.9 1.0 0.9 4.4 5.0 6.4 Africa 1.4 1.2 1.3 6.8 7.2 6.9 Asia NA 1.5 1.4 NA 8.5 8.7 Average Emerging Markets Banks 1.4 1.5 1.3 6.3 8.1 8.4 Source: Bloomberg, Company data, CGAP equity survey, J.P. Morgan estimates. ADTV = average daily trading volume. OW = Overweight, N = Neutral rating. Prices as of January 28, 2009. Notes for the Low-Income Finance Index: We used J.P. Morgan estimates for the stocks covered by J.P. Morgan and Bloomberg consensus estimates for IPF and Independencia. The Lower Income Finance Index is a market capitalization-weighted index, with the weight of BRI reduced to a third, because its microfinance portfolio represents only about a third of its total loan book. We did not include BRAC, Equity Bank, Blue Financial Services, and Capitec because financial forecasts are not available. The Index has a base of 100 as of November 10, 2003. Notes for Global Emerging Markets Banks: We show market capitalization-weighted averages of banks covered by J.P. Morgan analysts, representing a sample of 148 banks across all emerging markets.
Table 14: Sample of 10 LIFIs BRI Danamon Equity Bank Capitec African Bank Blue Financial Services BRAC IPF Compartamos Financiera Independencia Source: J.P. Morgan. See Appendix V for a short description of each.
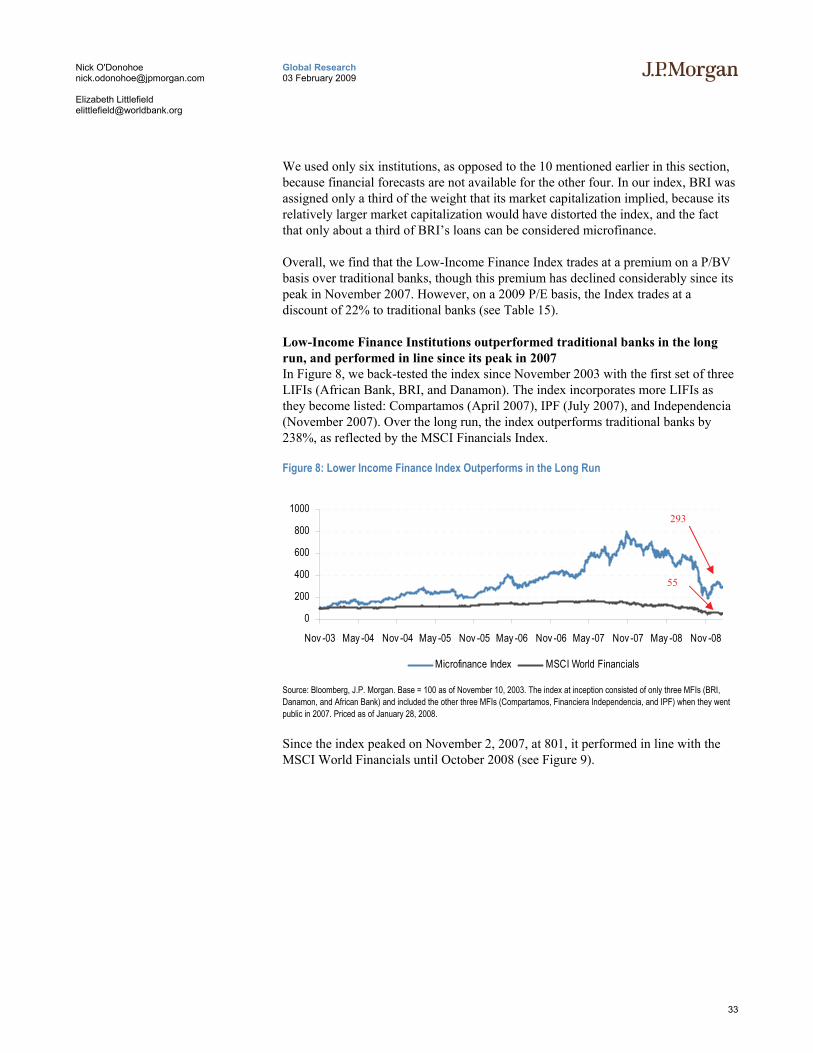
33
Global Research 03 February 2009
Nick O'Donohoe [email protected] Elizabeth Littlefield [email protected]
We used only six institutions, as opposed to the 10 mentioned earlier in this section, because financial forecasts are not available for the other four. In our index, BRI was assigned only a third of the weight that its market capitalization implied, because its relatively larger market capitalization would have distorted the index, and the fact that only about a third of BRI’s loans can be considered microfinance.
Overall, we find that the Low-Income Finance Index trades at a premium on a P/BV basis over traditional banks, though this premium has declined considerably since its peak in November 2007. However, on a 2009 P/E basis, the Index trades at a discount of 22% to traditional banks (see Table 15).
Low-Income Finance Institutions outperformed traditional banks in the long run, and performed in line since its peak in 2007 In Figure 8, we back-tested the index since November 2003 with the first set of three LIFIs (African Bank, BRI, and Danamon). The index incorporates more LIFIs as they become listed: Compartamos (April 2007), IPF (July 2007), and Independencia (November 2007). Over the long run, the index outperforms traditional banks by 238%, as reflected by the MSCI Financials Index.
Figure 8: Lower Income Finance Index Outperforms in the Long Run
0
200
400
600
800
1000
Nov -03 May -04 Nov -04 May -05 Nov -05 May -06 Nov -06 May -07 Nov -07 May -08 Nov -08
Microfinance Index MSCI World Financials
Source: Bloomberg, J.P. Morgan. Base = 100 as of November 10, 2003. The index at inception consisted of only three MFIs (BRI, Danamon, and African Bank) and included the other three MFIs (Compartamos, Financiera Independencia, and IPF) when they went public in 2007. Priced as of January 28, 2008.
Since the index peaked on November 2, 2007, at 801, it performed in line with the MSCI World Financials until October 2008 (see Figure 9).
293
55
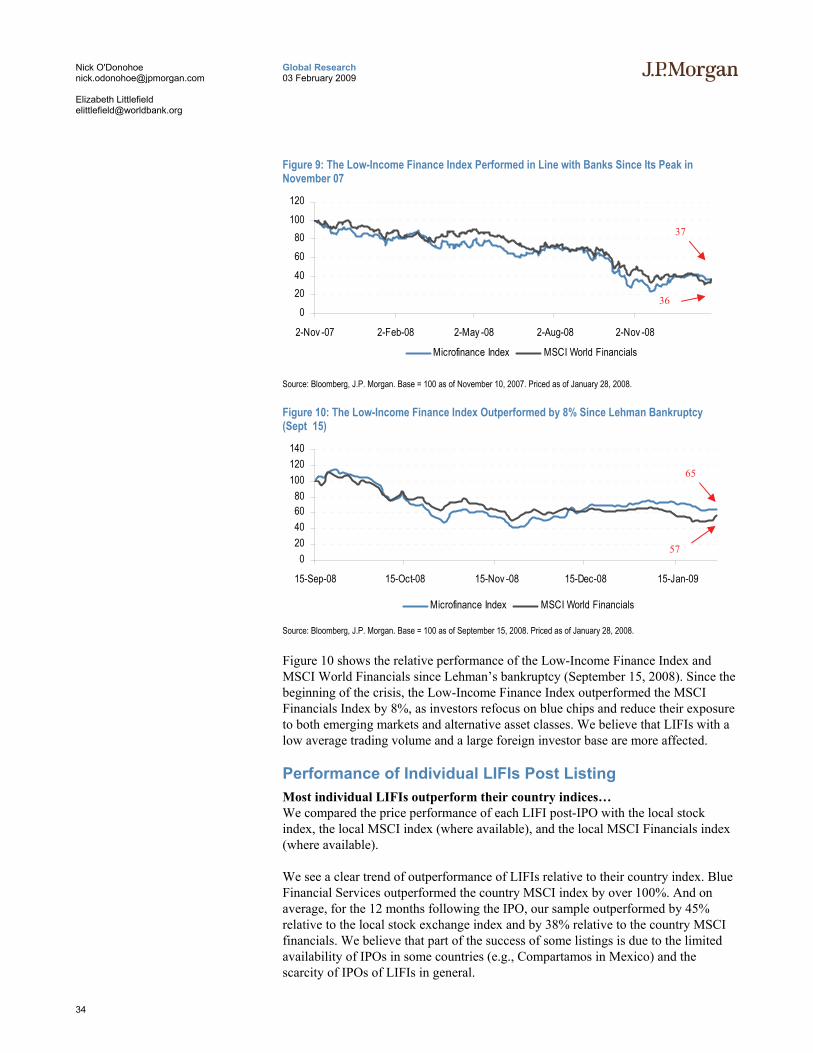
34
Global Research 03 February 2009
Nick O'Donohoe [email protected] Elizabeth Littlefield [email protected]
Figure 9: The Low-Income Finance Index Performed in Line with Banks Since Its Peak in November 07
020406080
100120
2-Nov -07 2-Feb-08 2-May -08 2-Aug-08 2-Nov -08
Microfinance Index MSCI World Financials
Source: Bloomberg, J.P. Morgan. Base = 100 as of November 10, 2007. Priced as of January 28, 2008.
Figure 10: The Low-Income Finance Index Outperformed by 8% Since Lehman Bankruptcy (Sept 15)
020406080
100120140
15-Sep-08 15-Oct-08 15-Nov -08 15-Dec-08 15-Jan-09
Microfinance Index MSCI World Financials
Source: Bloomberg, J.P. Morgan. Base = 100 as of September 15, 2008. Priced as of January 28, 2008.
Figure 10 shows the relative performance of the Low-Income Finance Index and MSCI World Financials since Lehman’s bankruptcy (September 15, 2008). Since the beginning of the crisis, the Low-Income Finance Index outperformed the MSCI Financials Index by 8%, as investors refocus on blue chips and reduce their exposure to both emerging markets and alternative asset classes. We believe that LIFIs with a low average trading volume and a large foreign investor base are more affected.
Performance of Individual LIFIs Post Listing Most individual LIFIs outperform their country indices… We compared the price performance of each LIFI post-IPO with the local stock index, the local MSCI index (where available), and the local MSCI Financials index (where available).
We see a clear trend of outperformance of LIFIs relative to their country index. Blue Financial Services outperformed the country MSCI index by over 100%. And on average, for the 12 months following the IPO, our sample outperformed by 45% relative to the local stock exchange index and by 38% relative to the country MSCI financials. We believe that part of the success of some listings is due to the limited availability of IPOs in some countries (e.g., Compartamos in Mexico) and the scarcity of IPOs of LIFIs in general.
37
36
65
57
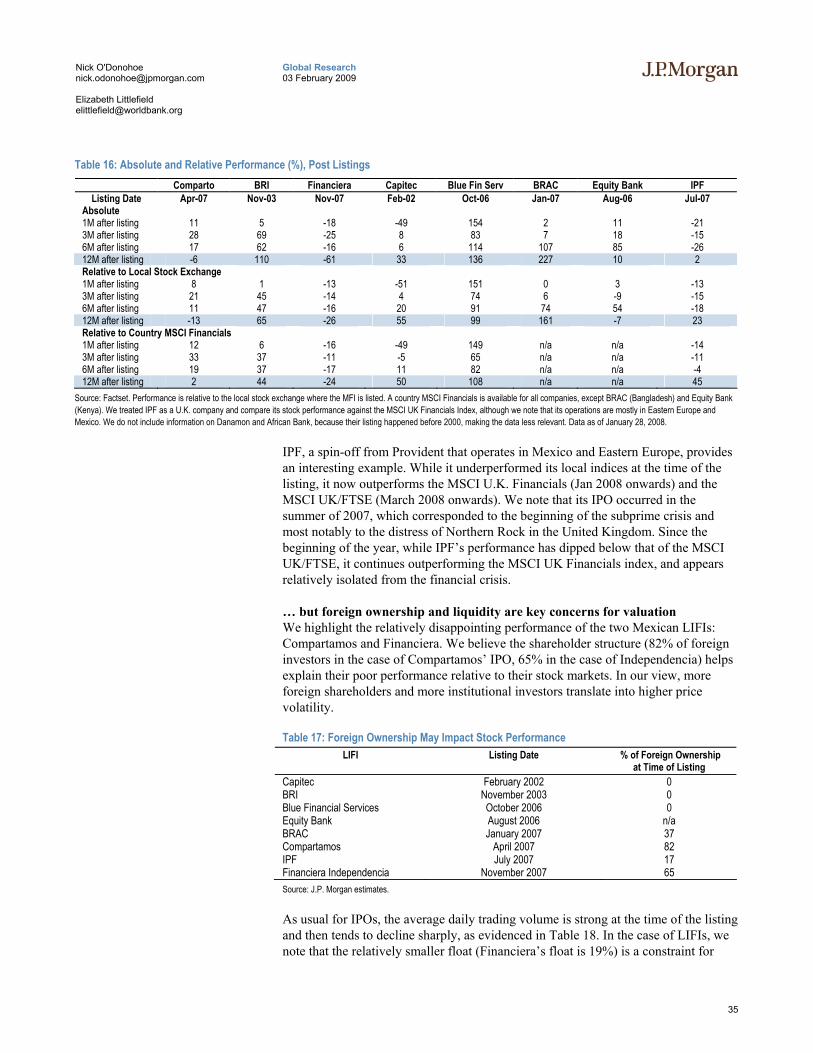
35
Global Research 03 February 2009
Nick O'Donohoe [email protected] Elizabeth Littlefield [email protected]
Table 16: Absolute and Relative Performance (%), Post Listings Comparto BRI Financiera Capitec Blue Fin Serv BRAC Equity Bank IPF
Listing Date Apr-07 Nov-03 Nov-07 Feb-02 Oct-06 Jan-07 Aug-06 Jul-07 Absolute 1M after listing 11 5 -18 -49 154 2 11 -21 3M after listing 28 69 -25 8 83 7 18 -15 6M after listing 17 62 -16 6 114 107 85 -26 12M after listing -6 110 -61 33 136 227 10 2 Relative to Local Stock Exchange 1M after listing 8 1 -13 -51 151 0 3 -13 3M after listing 21 45 -14 4 74 6 -9 -15 6M after listing 11 47 -16 20 91 74 54 -18 12M after listing -13 65 -26 55 99 161 -7 23 Relative to Country MSCI Financials 1M after listing 12 6 -16 -49 149 n/a n/a -14 3M after listing 33 37 -11 -5 65 n/a n/a -11 6M after listing 19 37 -17 11 82 n/a n/a -4 12M after listing 2 44 -24 50 108 n/a n/a 45
Source: Factset. Performance is relative to the local stock exchange where the MFI is listed. A country MSCI Financials is available for all companies, except BRAC (Bangladesh) and Equity Bank (Kenya). We treated IPF as a U.K. company and compare its stock performance against the MSCI UK Financials Index, although we note that its operations are mostly in Eastern Europe and Mexico. We do not include information on Danamon and African Bank, because their listing happened before 2000, making the data less relevant. Data as of January 28, 2008.
IPF, a spin-off from Provident that operates in Mexico and Eastern Europe, provides an interesting example. While it underperformed its local indices at the time of the listing, it now outperforms the MSCI U.K. Financials (Jan 2008 onwards) and the MSCI UK/FTSE (March 2008 onwards). We note that its IPO occurred in the summer of 2007, which corresponded to the beginning of the subprime crisis and most notably to the distress of Northern Rock in the United Kingdom. Since the beginning of the year, while IPF’s performance has dipped below that of the MSCI UK/FTSE, it continues outperforming the MSCI UK Financials index, and appears relatively isolated from the financial crisis.
… but foreign ownership and liquidity are key concerns for valuation We highlight the relatively disappointing performance of the two Mexican LIFIs: Compartamos and Financiera. We believe the shareholder structure (82% of foreign investors in the case of Compartamos’ IPO, 65% in the case of Independencia) helps explain their poor performance relative to their stock markets. In our view, more foreign shareholders and more institutional investors translate into higher price volatility.
Table 17: Foreign Ownership May Impact Stock Performance LIFI Listing Date % of Foreign Ownership
at Time of Listing Capitec February 2002 0 BRI November 2003 0 Blue Financial Services October 2006 0 Equity Bank August 2006 n/a BRAC January 2007 37 Compartamos April 2007 82 IPF July 2007 17 Financiera Independencia November 2007 65 Source: J.P. Morgan estimates.
As usual for IPOs, the average daily trading volume is strong at the time of the listing and then tends to decline sharply, as evidenced in Table 18. In the case of LIFIs, we note that the relatively smaller float (Financiera’s float is 19%) is a constraint for
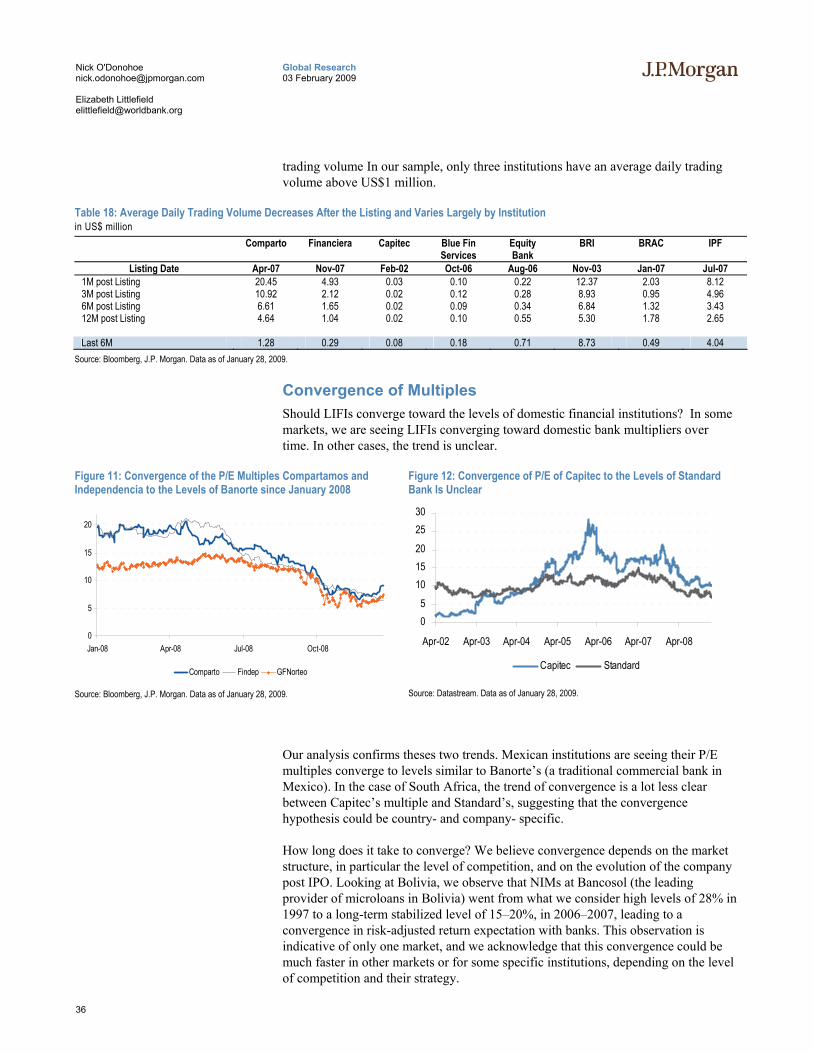
36
Global Research 03 February 2009
Nick O'Donohoe [email protected] Elizabeth Littlefield [email protected]
trading volume In our sample, only three institutions have an average daily trading volume above US$1 million.
Table 18: Average Daily Trading Volume Decreases After the Listing and Varies Largely by Institution in US$ million
Comparto Financiera Capitec Blue Fin Services
Equity Bank
BRI BRAC IPF
Listing Date Apr-07 Nov-07 Feb-02 Oct-06 Aug-06 Nov-03 Jan-07 Jul-07 1M post Listing 20.45 4.93 0.03 0.10 0.22 12.37 2.03 8.12 3M post Listing 10.92 2.12 0.02 0.12 0.28 8.93 0.95 4.96 6M post Listing 6.61 1.65 0.02 0.09 0.34 6.84 1.32 3.43 12M post Listing 4.64 1.04 0.02 0.10 0.55 5.30 1.78 2.65
Last 6M 1.28 0.29 0.08 0.18 0.71 8.73 0.49 4.04
Source: Bloomberg, J.P. Morgan. Data as of January 28, 2009.
Convergence of Multiples Should LIFIs converge toward the levels of domestic financial institutions? In some markets, we are seeing LIFIs converging toward domestic bank multipliers over time. In other cases, the trend is unclear.
Figure 11: Convergence of the P/E Multiples Compartamos and Independencia to the Levels of Banorte since January 2008
0
5
10
15
20
Jan-08 Apr-08 Jul-08 Oct-08
Comparto Findep GFNorteo
Source: Bloomberg, J.P. Morgan. Data as of January 28, 2009.
Figure 12: Convergence of P/E of Capitec to the Levels of Standard Bank Is Unclear
05
1015202530
Apr-02 Apr-03 Apr-04 Apr-05 Apr-06 Apr-07 Apr-08
Capitec Standard
Source: Datastream. Data as of January 28, 2009.
Our analysis confirms theses two trends. Mexican institutions are seeing their P/E multiples converge to levels similar to Banorte’s (a traditional commercial bank in Mexico). In the case of South Africa, the trend of convergence is a lot less clear between Capitec’s multiple and Standard’s, suggesting that the convergence hypothesis could be country- and company- specific.
How long does it take to converge? We believe convergence depends on the market structure, in particular the level of competition, and on the evolution of the company post IPO. Looking at Bolivia, we observe that NIMs at Bancosol (the leading provider of microloans in Bolivia) went from what we consider high levels of 28% in 1997 to a long-term stabilized level of 15–20%, in 2006–2007, leading to a convergence in risk-adjusted return expectation with banks. This observation is indicative of only one market, and we acknowledge that this convergence could be much faster in other markets or for some specific institutions, depending on the level of competition and their strategy.
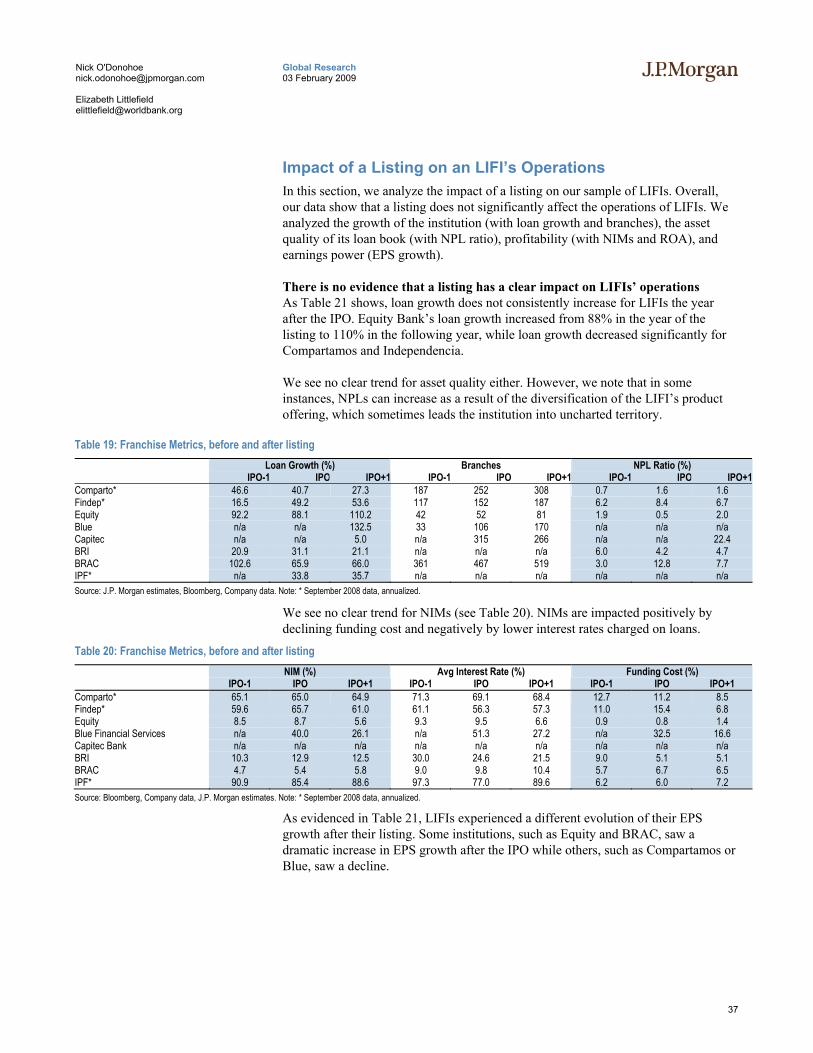
37
Global Research 03 February 2009
Nick O'Donohoe [email protected] Elizabeth Littlefield [email protected]
Impact of a Listing on an LIFI’s Operations In this section, we analyze the impact of a listing on our sample of LIFIs. Overall, our data show that a listing does not significantly affect the operations of LIFIs. We analyzed the growth of the institution (with loan growth and branches), the asset quality of its loan book (with NPL ratio), profitability (with NIMs and ROA), and earnings power (EPS growth).
There is no evidence that a listing has a clear impact on LIFIs’ operations As Table 21 shows, loan growth does not consistently increase for LIFIs the year after the IPO. Equity Bank’s loan growth increased from 88% in the year of the listing to 110% in the following year, while loan growth decreased significantly for Compartamos and Independencia.
We see no clear trend for asset quality either. However, we note that in some instances, NPLs can increase as a result of the diversification of the LIFI’s product offering, which sometimes leads the institution into uncharted territory.
Table 19: Franchise Metrics, before and after listing Loan Growth (%) Branches NPL Ratio (%)
IPO-1 IPO IPO+1 IPO-1 IPO IPO+1 IPO-1 IPO IPO+1Comparto* 46.6 40.7 27.3 187 252 308 0.7 1.6 1.6 Findep* 16.5 49.2 53.6 117 152 187 6.2 8.4 6.7 Equity 92.2 88.1 110.2 42 52 81 1.9 0.5 2.0 Blue n/a n/a 132.5 33 106 170 n/a n/a n/a Capitec n/a n/a 5.0 n/a 315 266 n/a n/a 22.4 BRI 20.9 31.1 21.1 n/a n/a n/a 6.0 4.2 4.7 BRAC 102.6 65.9 66.0 361 467 519 3.0 12.8 7.7 IPF* n/a 33.8 35.7 n/a n/a n/a n/a n/a n/a Source: J.P. Morgan estimates, Bloomberg, Company data. Note: * September 2008 data, annualized.
We see no clear trend for NIMs (see Table 20). NIMs are impacted positively by declining funding cost and negatively by lower interest rates charged on loans.
Table 20: Franchise Metrics, before and after listing NIM (%) Avg Interest Rate (%) Funding Cost (%) IPO-1 IPO IPO+1 IPO-1 IPO IPO+1 IPO-1 IPO IPO+1
Comparto* 65.1 65.0 64.9 71.3 69.1 68.4 12.7 11.2 8.5 Findep* 59.6 65.7 61.0 61.1 56.3 57.3 11.0 15.4 6.8 Equity 8.5 8.7 5.6 9.3 9.5 6.6 0.9 0.8 1.4 Blue Financial Services n/a 40.0 26.1 n/a 51.3 27.2 n/a 32.5 16.6 Capitec Bank n/a n/a n/a n/a n/a n/a n/a n/a n/a BRI 10.3 12.9 12.5 30.0 24.6 21.5 9.0 5.1 5.1 BRAC 4.7 5.4 5.8 9.0 9.8 10.4 5.7 6.7 6.5 IPF* 90.9 85.4 88.6 97.3 77.0 89.6 6.2 6.0 7.2 Source: Bloomberg, Company data, J.P. Morgan estimates. Note: * September 2008 data, annualized.
As evidenced in Table 21, LIFIs experienced a different evolution of their EPS growth after their listing. Some institutions, such as Equity and BRAC, saw a dramatic increase in EPS growth after the IPO while others, such as Compartamos or Blue, saw a decline.
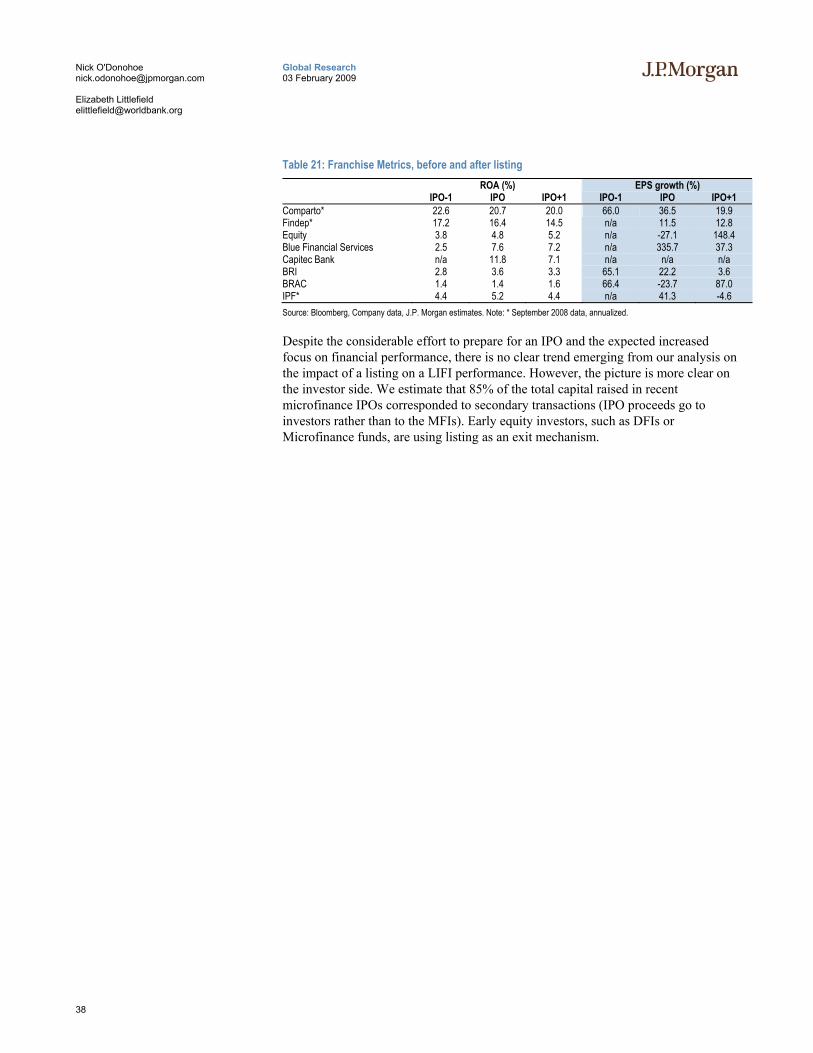
38
Global Research 03 February 2009
Nick O'Donohoe [email protected] Elizabeth Littlefield [email protected]
Table 21: Franchise Metrics, before and after listing ROA (%) EPS growth (%) IPO-1 IPO IPO+1 IPO-1 IPO IPO+1
Comparto* 22.6 20.7 20.0 66.0 36.5 19.9 Findep* 17.2 16.4 14.5 n/a 11.5 12.8 Equity 3.8 4.8 5.2 n/a -27.1 148.4 Blue Financial Services 2.5 7.6 7.2 n/a 335.7 37.3 Capitec Bank n/a 11.8 7.1 n/a n/a n/a BRI 2.8 3.6 3.3 65.1 22.2 3.6 BRAC 1.4 1.4 1.6 66.4 -23.7 87.0 IPF* 4.4 5.2 4.4 n/a 41.3 -4.6 Source: Bloomberg, Company data, J.P. Morgan estimates. Note: * September 2008 data, annualized. Despite the considerable effort to prepare for an IPO and the expected increased focus on financial performance, there is no clear trend emerging from our analysis on the impact of a listing on a LIFI performance. However, the picture is more clear on the investor side. We estimate that 85% of the total capital raised in recent microfinance IPOs corresponded to secondary transactions (IPO proceeds go to investors rather than to the MFIs). Early equity investors, such as DFIs or Microfinance funds, are using listing as an exit mechanism.
39
Global Research 03 February 2009
Nick O'Donohoe [email protected] Elizabeth Littlefield [email protected]
Conclusions This report sheds new light on equity valuation in microfinance and offers some of the first industry benchmarks for microfinance valuations.
Our view is that MFIs differ from traditional banks and justify a different valuation approach. MFIs are double-bottom-line institutions aiming for both social and financial returns. They exhibit better asset quality, higher net interest margins but higher operating costs than emerging market banks. They also benefit from longer-term funding available from development investors.
The private equity market for microfinance is still young and is lacking consensus over valuation approaches. Valuation for microfinance has varied widely over the past three years. Net income growth and transaction size appear to be the main valuation drivers considered by investors although we also identified eight other important factors.
The median multiples in our private sample varied between 1.3x to 1.9x historical book and 7.2x to 9.2x historical earnings from 2005 to September 2008. These relatively high valuations compared to emerging market banks reflect the strong business fundamentals of microfinance and increasing investor interest in microfinance.
Publicly listed low-income finance institutions (LIFIs) are interesting comparables for microfinance institutions. LIFIs outperformed traditional banks by 238% since the creation of the index in November 2003. Also, since the Lehman bankruptcy in September 2008, they have outperformed the Global MSCI World Financials index by 8%.
The financial crisis is already taking its toll on microfinance but the full impact will likely be seen this year. Adverse economic conditions should lead to slower growth and deterioration in MFI financial performance. The coming year will also test the assumption that microfinance is more resilient than traditional banking to economic shocks and can maintain high asset quality in times of turmoil
We believe that 2009 will be a transformational year for microfinance. MFIs will have to refocus on their fundamentals, increase credit standards to maintain high asset quality, diversify their funding sources, close their currency mismatch and keep expenses on track. Investors will also push for higher corporate governance and public disclosure standard. The crisis should also be an opportunity for restructuring and consolidation in the sector.
In 2009, we expect private transactions valuations to decrease towards 1x historical book value in the private market. However, the strong fundamentals of the microfinance industry and the commitment of public and private investors should bolster pricing going forward. MFIs with a solid funding base and strong asset quality should emerge stronger from this turbulence, and we can expect valuation to bounce back in 2010. The long-term outlook for equity investment in microfinance remains positive.
40
Global Research 03 February 2009
Nick O'Donohoe [email protected] Elizabeth Littlefield [email protected]
Appendix I: Glossary Development Finance Institutions (DFIs) are the private sector arms of government-owned bilateral agencies and multilateral institutions, such as the World Bank. DFIs have been established to provide investments and advisory services to build the private sector in developing countries. They include multilateral organizations such as IFC (International Finance Corporation, a subsidiary of the World Bank) and bilateral financial institutions, such as the German KfW (Kreditanstalt für Wiederaufbau).
DFIs have been early investors in microfinance. Most DFIs started financing microfinance in the late 1990s following on the grant funding of donor agencies since the 1970s. DFIs are bringing a commercial approach to the microfinance industry, providing quasi-commercial loans, equity, and guarantees to microfinance institutions. There were 19 DFIs active in microfinance in 2007. Their total microfinance portfolio is in excess of US$4 billion and is growing at an annual rate of 55%. Most of DFIs’ investments are in fixed income (60%), and are concentrated in the largest MFIs. But DFIs’ equity investments are also on the rise and reached US$890 million in December 2007. According to CGAP’s 2008 Funder Survey, four DFIs - KfW, IFC, FMO and EBRD - account for 80% of the total DFI equity investments in microfinance.
Microfinance Investment Vehicles (MIVs) are specialized microfinance funds or investment vehicles intermediating capital between investors and MFIs. There were 93 active MIVs in 2007 with total assets under management of US$5.4 billion. MIVs comprise a diverse range of organizations in term of investor base, instruments and legal setup. The largest MIV groups are regulated mutual funds, structured finance vehicles and holding companies. MIV investments have quadrupled since 2005, and this growth is set to continue. Individual investors and foundations were early backers and continue to provide one-third of the MIV capital. DFIs were also early subscribers and drove several MIV start-ups, such as the equity fund Profund. Today, institutional investors are providing the mainstay of MIVs’ funding with a 40% share. MIVs are invested primarily in fixed income (78%) in large MFIs in Eastern Europe and Latin America. But equity investments are growing rapidly (+95% in 2007) and passed the US$1.5 billion milestone in 2008. The largest fund is Procredit, a German holding of 19 greenfield banks. According to CGAP’s 2008 MIV survey, the average return for private equity funds in microfinance is 12.5 % (average gross internal rate of return for funds with 2002 vintage year).
Sustainable and Responsible Investment (SRI) is a generic term covering ethical investments, responsible investments and sustainable investments that combine investors’ financial objectives with their concerns about environmental, social and governance (ESG) issues. SRI investors can use a broad range of investment strategies including ethical exclusion, negative screening, positive screening and shareholder engagements. Institutional investors such as pension funds integrating ESG factors in their investment decisions are part of the broad SRI markets. According to the Eurosif SRI study 2008, the broad SRI market is estimated at Eur5 trillion, including Eur2 trillion in the United States and Eur2.6 trillion in Europe.
41
Global Research 03 February 2009
Nick O'Donohoe [email protected] Elizabeth Littlefield [email protected]
Microfinance Institutions (MFIs) provide microloans specifically for low-income borrowers who are typically self-employed or owners of tiny informal businesses, rather than salaried workers. The loan size is small (on average US$3,000 in Europe and Central Asia31 and less than US$1,000 elsewhere), and lenders rely on alternative lending techniques that generally do not rely on conventional collateral. Most of the 1,300 institutions that report to MixMarket - the industry information exchange - have microenterprise lending as a core product but are increasingly offering other types of loans, such as mortgage loans and consumer loans for salaried workers, and savings accounts. MFIs exist in a variety of legal forms, from credit unions and NGOs to formal non-bank financial institutions and regulated banks. Many of them are increasingly moving away from donor subsidies to leverage commercial capital (usually debt, deposits, and equity investments). Most MFIs see themselves as having a double bottom line, aiming for both profit and social impact.
31 MicroBanking Bulletin 7, MicroBanking Bulletin average for 2007.
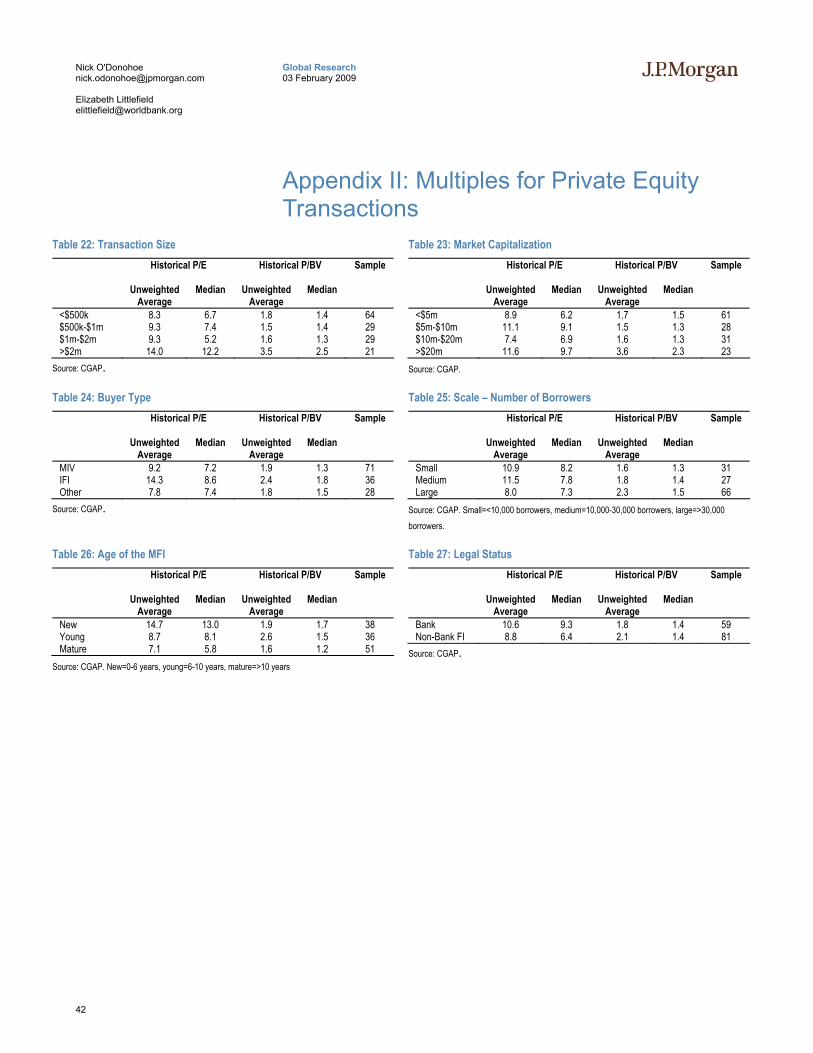
42
Global Research 03 February 2009
Nick O'Donohoe [email protected] Elizabeth Littlefield [email protected]
Appendix II: Multiples for Private Equity Transactions
Table 22: Transaction Size
Historical P/E
Historical P/BV
Sample
Unweighted
Average Median Unweighted
Average Median
<$500k 8.3 6.7 1.8 1.4 64 $500k-$1m 9.3 7.4 1.5 1.4 29 $1m-$2m 9.3 5.2 1.6 1.3 29 >$2m 14.0 12.2 3.5 2.5 21
Source: CGAP.
Table 23: Market Capitalization
Historical P/E
Historical P/BV
Sample
Unweighted
Average Median Unweighted
Average Median
<$5m 8.9 6.2 1.7 1.5 61 $5m-$10m 11.1 9.1 1.5 1.3 28 $10m-$20m 7.4 6.9 1.6 1.3 31 >$20m 11.6 9.7 3.6 2.3 23
Source: CGAP.
Table 24: Buyer Type
Historical P/E
Historical P/BV
Sample
Unweighted
Average Median Unweighted
Average Median
MIV 9.2 7.2 1.9 1.3 71 IFI 14.3 8.6 2.4 1.8 36 Other 7.8 7.4 1.8 1.5 28
Source: CGAP.
Table 25: Scale – Number of Borrowers
Historical P/E
Historical P/BV
Sample
Unweighted
Average Median Unweighted
Average Median
Small 10.9 8.2 1.6 1.3 31 Medium 11.5 7.8 1.8 1.4 27 Large 8.0 7.3 2.3 1.5 66
Source: CGAP. Small=<10,000 borrowers, medium=10,000-30,000 borrowers, large=>30,000 borrowers.
Table 26: Age of the MFI
Historical P/E
Historical P/BV
Sample
Unweighted
Average Median Unweighted
Average Median
New 14.7 13.0 1.9 1.7 38 Young 8.7 8.1 2.6 1.5 36 Mature 7.1 5.8 1.6 1.2 51
Source: CGAP. New=0-6 years, young=6-10 years, mature=>10 years
Table 27: Legal Status
Historical P/E
Historical P/BV
Sample
Unweighted
Average Median Unweighted
Average Median
Bank 10.6 9.3 1.8 1.4 59 Non-Bank FI 8.8 6.4 2.1 1.4 81
Source: CGAP.
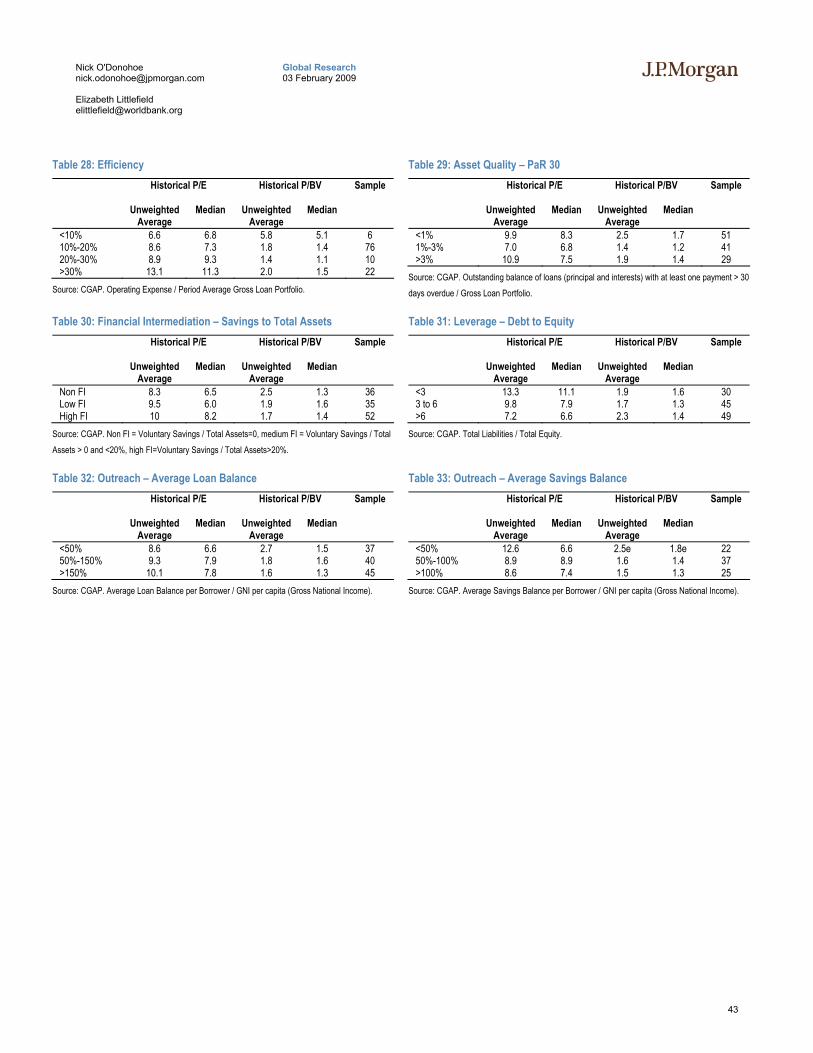
43
Global Research 03 February 2009
Nick O'Donohoe [email protected] Elizabeth Littlefield [email protected]
Table 28: Efficiency
Historical P/E
Historical P/BV
Sample
Unweighted
Average Median Unweighted
Average Median
<10% 6.6 6.8 5.8 5.1 6 10%-20% 8.6 7.3 1.8 1.4 76 20%-30% 8.9 9.3 1.4 1.1 10 >30% 13.1 11.3 2.0 1.5 22
Source: CGAP. Operating Expense / Period Average Gross Loan Portfolio.
Table 29: Asset Quality – PaR 30
Historical P/E
Historical P/BV
Sample
Unweighted
Average Median Unweighted
Average Median
<1% 9.9 8.3 2.5 1.7 51 1%-3% 7.0 6.8 1.4 1.2 41 >3% 10.9 7.5 1.9 1.4 29
Source: CGAP. Outstanding balance of loans (principal and interests) with at least one payment > 30 days overdue / Gross Loan Portfolio.
Table 30: Financial Intermediation – Savings to Total Assets
Historical P/E
Historical P/BV
Sample
Unweighted
Average Median Unweighted
Average Median
Non FI 8.3 6.5 2.5 1.3 36 Low FI 9.5 6.0 1.9 1.6 35 High FI 10 8.2 1.7 1.4 52
Source: CGAP. Non FI = Voluntary Savings / Total Assets=0, medium FI = Voluntary Savings / Total Assets > 0 and <20%, high FI=Voluntary Savings / Total Assets>20%.
Table 31: Leverage – Debt to Equity
Historical P/E
Historical P/BV
Sample
Unweighted
Average Median Unweighted
Average Median
<3 13.3 11.1 1.9 1.6 30 3 to 6 9.8 7.9 1.7 1.3 45 >6 7.2 6.6 2.3 1.4 49
Source: CGAP. Total Liabilities / Total Equity.
Table 32: Outreach – Average Loan Balance
Historical P/E
Historical P/BV
Sample
Unweighted
Average Median Unweighted
Average Median
<50% 8.6 6.6 2.7 1.5 37 50%-150% 9.3 7.9 1.8 1.6 40 >150% 10.1 7.8 1.6 1.3 45
Source: CGAP. Average Loan Balance per Borrower / GNI per capita (Gross National Income).
Table 33: Outreach – Average Savings Balance
Historical P/E
Historical P/BV
Sample
Unweighted
Average Median Unweighted
Average Median
<50% 12.6 6.6 2.5e 1.8e 22 50%-100% 8.9 8.9 1.6 1.4 37 >100% 8.6 7.4 1.5 1.3 25
Source: CGAP. Average Savings Balance per Borrower / GNI per capita (Gross National Income).
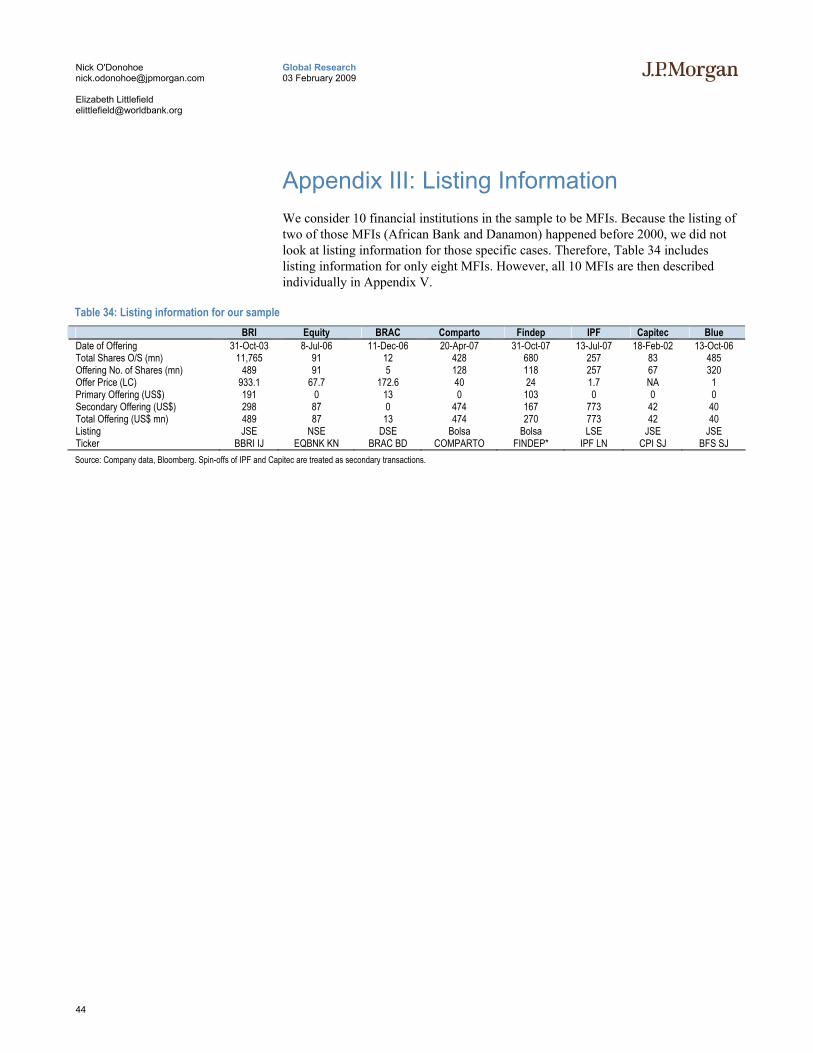
44
Global Research 03 February 2009
Nick O'Donohoe [email protected] Elizabeth Littlefield [email protected]
Appendix III: Listing Information We consider 10 financial institutions in the sample to be MFIs. Because the listing of two of those MFIs (African Bank and Danamon) happened before 2000, we did not look at listing information for those specific cases. Therefore, Table 34 includes listing information for only eight MFIs. However, all 10 MFIs are then described individually in Appendix V.
Table 34: Listing information for our sample BRI Equity BRAC Comparto Findep IPF Capitec Blue
Date of Offering 31-Oct-03 8-Jul-06 11-Dec-06 20-Apr-07 31-Oct-07 13-Jul-07 18-Feb-02 13-Oct-06 Total Shares O/S (mn) 11,765 91 12 428 680 257 83 485 Offering No. of Shares (mn) 489 91 5 128 118 257 67 320 Offer Price (LC) 933.1 67.7 172.6 40 24 1.7 NA 1 Primary Offering (US$) 191 0 13 0 103 0 0 0 Secondary Offering (US$) 298 87 0 474 167 773 42 40 Total Offering (US$ mn) 489 87 13 474 270 773 42 40 Listing JSE NSE DSE Bolsa Bolsa LSE JSE JSE Ticker BBRI IJ EQBNK KN BRAC BD COMPARTO FINDEP* IPF LN CPI SJ BFS SJ Source: Company data, Bloomberg. Spin-offs of IPF and Capitec are treated as secondary transactions.
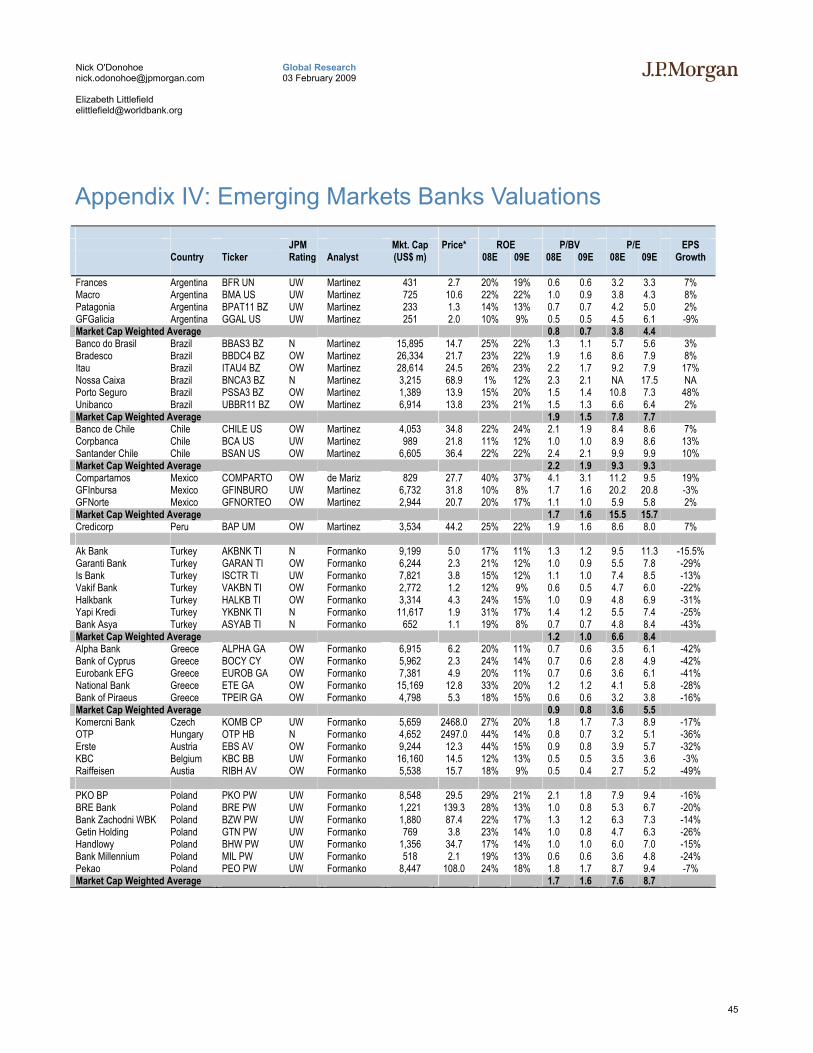
45
Global Research 03 February 2009
Nick O'Donohoe [email protected] Elizabeth Littlefield [email protected]
Appendix IV: Emerging Markets Banks Valuations JPM Mkt. Cap Price* ROE P/BV P/E EPS Country Ticker Rating Analyst (US$ m) 08E 09E 08E 09E 08E 09E Growth Frances Argentina BFR UN UW Martinez 431 2.7 20% 19% 0.6 0.6 3.2 3.3 7% Macro Argentina BMA US UW Martinez 725 10.6 22% 22% 1.0 0.9 3.8 4.3 8% Patagonia Argentina BPAT11 BZ UW Martinez 233 1.3 14% 13% 0.7 0.7 4.2 5.0 2% GFGalicia Argentina GGAL US UW Martinez 251 2.0 10% 9% 0.5 0.5 4.5 6.1 -9% Market Cap Weighted Average 0.8 0.7 3.8 4.4 Banco do Brasil Brazil BBAS3 BZ N Martinez 15,895 14.7 25% 22% 1.3 1.1 5.7 5.6 3% Bradesco Brazil BBDC4 BZ OW Martinez 26,334 21.7 23% 22% 1.9 1.6 8.6 7.9 8% Itau Brazil ITAU4 BZ OW Martinez 28,614 24.5 26% 23% 2.2 1.7 9.2 7.9 17% Nossa Caixa Brazil BNCA3 BZ N Martinez 3,215 68.9 1% 12% 2.3 2.1 NA 17.5 NA Porto Seguro Brazil PSSA3 BZ OW Martinez 1,389 13.9 15% 20% 1.5 1.4 10.8 7.3 48% Unibanco Brazil UBBR11 BZ OW Martinez 6,914 13.8 23% 21% 1.5 1.3 6.6 6.4 2% Market Cap Weighted Average 1.9 1.5 7.8 7.7 Banco de Chile Chile CHILE US OW Martinez 4,053 34.8 22% 24% 2.1 1.9 8.4 8.6 7% Corpbanca Chile BCA US UW Martinez 989 21.8 11% 12% 1.0 1.0 8.9 8.6 13% Santander Chile Chile BSAN US OW Martinez 6,605 36.4 22% 22% 2.4 2.1 9.9 9.9 10% Market Cap Weighted Average 2.2 1.9 9.3 9.3 Compartamos Mexico COMPARTO OW de Mariz 829 27.7 40% 37% 4.1 3.1 11.2 9.5 19% GFInbursa Mexico GFINBURO UW Martinez 6,732 31.8 10% 8% 1.7 1.6 20.2 20.8 -3% GFNorte Mexico GFNORTEO OW Martinez 2,944 20.7 20% 17% 1.1 1.0 5.9 5.8 2% Market Cap Weighted Average 1.7 1.6 15.5 15.7 Credicorp Peru BAP UM OW Martinez 3,534 44.2 25% 22% 1.9 1.6 8.6 8.0 7% Ak Bank Turkey AKBNK TI N Formanko 9,199 5.0 17% 11% 1.3 1.2 9.5 11.3 -15.5% Garanti Bank Turkey GARAN TI OW Formanko 6,244 2.3 21% 12% 1.0 0.9 5.5 7.8 -29% Is Bank Turkey ISCTR TI UW Formanko 7,821 3.8 15% 12% 1.1 1.0 7.4 8.5 -13% Vakif Bank Turkey VAKBN TI OW Formanko 2,772 1.2 12% 9% 0.6 0.5 4.7 6.0 -22% Halkbank Turkey HALKB TI OW Formanko 3,314 4.3 24% 15% 1.0 0.9 4.8 6.9 -31% Yapi Kredi Turkey YKBNK TI N Formanko 11,617 1.9 31% 17% 1.4 1.2 5.5 7.4 -25% Bank Asya Turkey ASYAB TI N Formanko 652 1.1 19% 8% 0.7 0.7 4.8 8.4 -43% Market Cap Weighted Average 1.2 1.0 6.6 8.4 Alpha Bank Greece ALPHA GA OW Formanko 6,915 6.2 20% 11% 0.7 0.6 3.5 6.1 -42% Bank of Cyprus Greece BOCY CY OW Formanko 5,962 2.3 24% 14% 0.7 0.6 2.8 4.9 -42% Eurobank EFG Greece EUROB GA OW Formanko 7,381 4.9 20% 11% 0.7 0.6 3.6 6.1 -41% National Bank Greece ETE GA OW Formanko 15,169 12.8 33% 20% 1.2 1.2 4.1 5.8 -28% Bank of Piraeus Greece TPEIR GA OW Formanko 4,798 5.3 18% 15% 0.6 0.6 3.2 3.8 -16% Market Cap Weighted Average 0.9 0.8 3.6 5.5 Komercni Bank Czech KOMB CP UW Formanko 5,659 2468.0 27% 20% 1.8 1.7 7.3 8.9 -17% OTP Hungary OTP HB N Formanko 4,652 2497.0 44% 14% 0.8 0.7 3.2 5.1 -36% Erste Austria EBS AV OW Formanko 9,244 12.3 44% 15% 0.9 0.8 3.9 5.7 -32% KBC Belgium KBC BB UW Formanko 16,160 14.5 12% 13% 0.5 0.5 3.5 3.6 -3% Raiffeisen Austia RIBH AV OW Formanko 5,538 15.7 18% 9% 0.5 0.4 2.7 5.2 -49% PKO BP Poland PKO PW UW Formanko 8,548 29.5 29% 21% 2.1 1.8 7.9 9.4 -16% BRE Bank Poland BRE PW UW Formanko 1,221 139.3 28% 13% 1.0 0.8 5.3 6.7 -20% Bank Zachodni WBK Poland BZW PW UW Formanko 1,880 87.4 22% 17% 1.3 1.2 6.3 7.3 -14% Getin Holding Poland GTN PW UW Formanko 769 3.8 23% 14% 1.0 0.8 4.7 6.3 -26% Handlowy Poland BHW PW UW Formanko 1,356 34.7 17% 14% 1.0 1.0 6.0 7.0 -15% Bank Millennium Poland MIL PW UW Formanko 518 2.1 19% 13% 0.6 0.6 3.6 4.8 -24% Pekao Poland PEO PW UW Formanko 8,447 108.0 24% 18% 1.8 1.7 8.7 9.4 -7% Market Cap Weighted Average 1.7 1.6 7.6 8.7
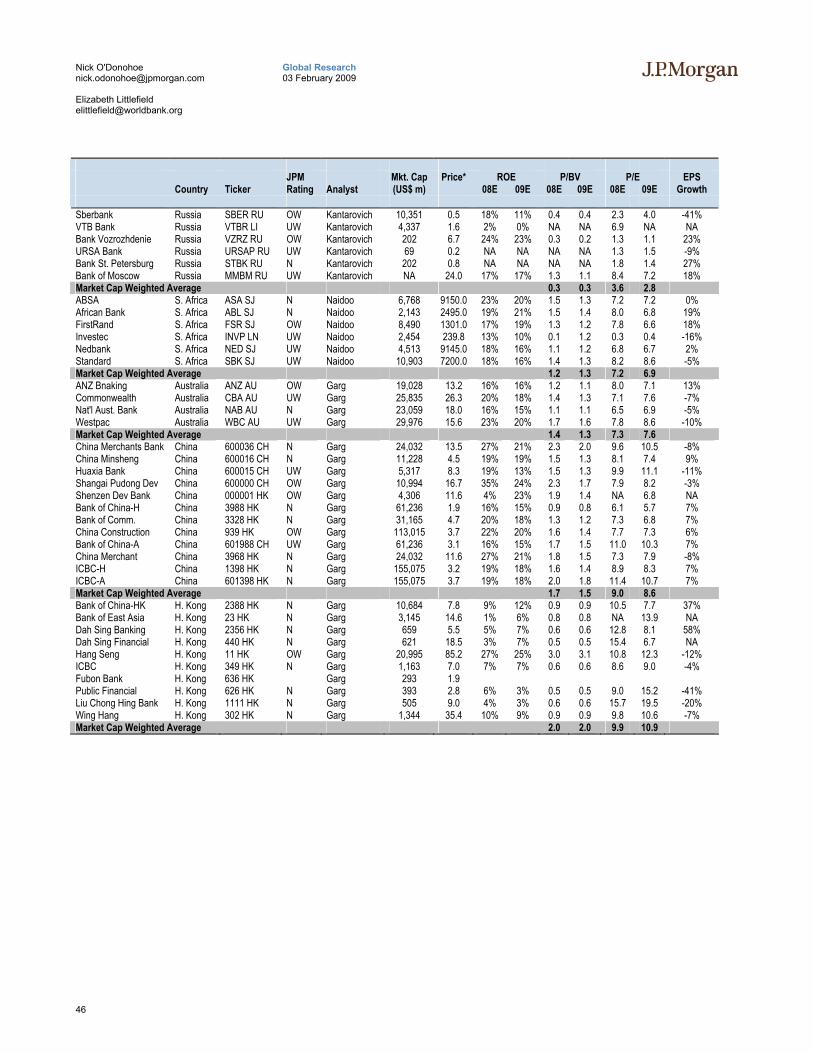
46
Global Research 03 February 2009
Nick O'Donohoe [email protected] Elizabeth Littlefield [email protected]
JPM Mkt. Cap Price* ROE P/BV P/E EPS Country Ticker Rating Analyst (US$ m) 08E 09E 08E 09E 08E 09E Growth Sberbank Russia SBER RU OW Kantarovich 10,351 0.5 18% 11% 0.4 0.4 2.3 4.0 -41% VTB Bank Russia VTBR LI UW Kantarovich 4,337 1.6 2% 0% NA NA 6.9 NA NA Bank Vozrozhdenie Russia VZRZ RU OW Kantarovich 202 6.7 24% 23% 0.3 0.2 1.3 1.1 23% URSA Bank Russia URSAP RU UW Kantarovich 69 0.2 NA NA NA NA 1.3 1.5 -9% Bank St. Petersburg Russia STBK RU N Kantarovich 202 0.8 NA NA NA NA 1.8 1.4 27% Bank of Moscow Russia MMBM RU UW Kantarovich NA 24.0 17% 17% 1.3 1.1 8.4 7.2 18% Market Cap Weighted Average 0.3 0.3 3.6 2.8 ABSA S. Africa ASA SJ N Naidoo 6,768 9150.0 23% 20% 1.5 1.3 7.2 7.2 0% African Bank S. Africa ABL SJ N Naidoo 2,143 2495.0 19% 21% 1.5 1.4 8.0 6.8 19% FirstRand S. Africa FSR SJ OW Naidoo 8,490 1301.0 17% 19% 1.3 1.2 7.8 6.6 18% Investec S. Africa INVP LN UW Naidoo 2,454 239.8 13% 10% 0.1 1.2 0.3 0.4 -16% Nedbank S. Africa NED SJ UW Naidoo 4,513 9145.0 18% 16% 1.1 1.2 6.8 6.7 2% Standard S. Africa SBK SJ UW Naidoo 10,903 7200.0 18% 16% 1.4 1.3 8.2 8.6 -5% Market Cap Weighted Average 1.2 1.3 7.2 6.9 ANZ Bnaking Australia ANZ AU OW Garg 19,028 13.2 16% 16% 1.2 1.1 8.0 7.1 13% Commonwealth Australia CBA AU UW Garg 25,835 26.3 20% 18% 1.4 1.3 7.1 7.6 -7% Nat'l Aust. Bank Australia NAB AU N Garg 23,059 18.0 16% 15% 1.1 1.1 6.5 6.9 -5% Westpac Australia WBC AU UW Garg 29,976 15.6 23% 20% 1.7 1.6 7.8 8.6 -10% Market Cap Weighted Average 1.4 1.3 7.3 7.6 China Merchants Bank China 600036 CH N Garg 24,032 13.5 27% 21% 2.3 2.0 9.6 10.5 -8% China Minsheng China 600016 CH N Garg 11,228 4.5 19% 19% 1.5 1.3 8.1 7.4 9% Huaxia Bank China 600015 CH UW Garg 5,317 8.3 19% 13% 1.5 1.3 9.9 11.1 -11% Shangai Pudong Dev China 600000 CH OW Garg 10,994 16.7 35% 24% 2.3 1.7 7.9 8.2 -3% Shenzen Dev Bank China 000001 HK OW Garg 4,306 11.6 4% 23% 1.9 1.4 NA 6.8 NA Bank of China-H China 3988 HK N Garg 61,236 1.9 16% 15% 0.9 0.8 6.1 5.7 7% Bank of Comm. China 3328 HK N Garg 31,165 4.7 20% 18% 1.3 1.2 7.3 6.8 7% China Construction China 939 HK OW Garg 113,015 3.7 22% 20% 1.6 1.4 7.7 7.3 6% Bank of China-A China 601988 CH UW Garg 61,236 3.1 16% 15% 1.7 1.5 11.0 10.3 7% China Merchant China 3968 HK N Garg 24,032 11.6 27% 21% 1.8 1.5 7.3 7.9 -8% ICBC-H China 1398 HK N Garg 155,075 3.2 19% 18% 1.6 1.4 8.9 8.3 7% ICBC-A China 601398 HK N Garg 155,075 3.7 19% 18% 2.0 1.8 11.4 10.7 7% Market Cap Weighted Average 1.7 1.5 9.0 8.6 Bank of China-HK H. Kong 2388 HK N Garg 10,684 7.8 9% 12% 0.9 0.9 10.5 7.7 37% Bank of East Asia H. Kong 23 HK N Garg 3,145 14.6 1% 6% 0.8 0.8 NA 13.9 NA Dah Sing Banking H. Kong 2356 HK N Garg 659 5.5 5% 7% 0.6 0.6 12.8 8.1 58% Dah Sing Financial H. Kong 440 HK N Garg 621 18.5 3% 7% 0.5 0.5 15.4 6.7 NA Hang Seng H. Kong 11 HK OW Garg 20,995 85.2 27% 25% 3.0 3.1 10.8 12.3 -12% ICBC H. Kong 349 HK N Garg 1,163 7.0 7% 7% 0.6 0.6 8.6 9.0 -4% Fubon Bank H. Kong 636 HK Garg 293 1.9 Public Financial H. Kong 626 HK N Garg 393 2.8 6% 3% 0.5 0.5 9.0 15.2 -41% Liu Chong Hing Bank H. Kong 1111 HK N Garg 505 9.0 4% 3% 0.6 0.6 15.7 19.5 -20% Wing Hang H. Kong 302 HK N Garg 1,344 35.4 10% 9% 0.9 0.9 9.8 10.6 -7% Market Cap Weighted Average 2.0 2.0 9.9 10.9
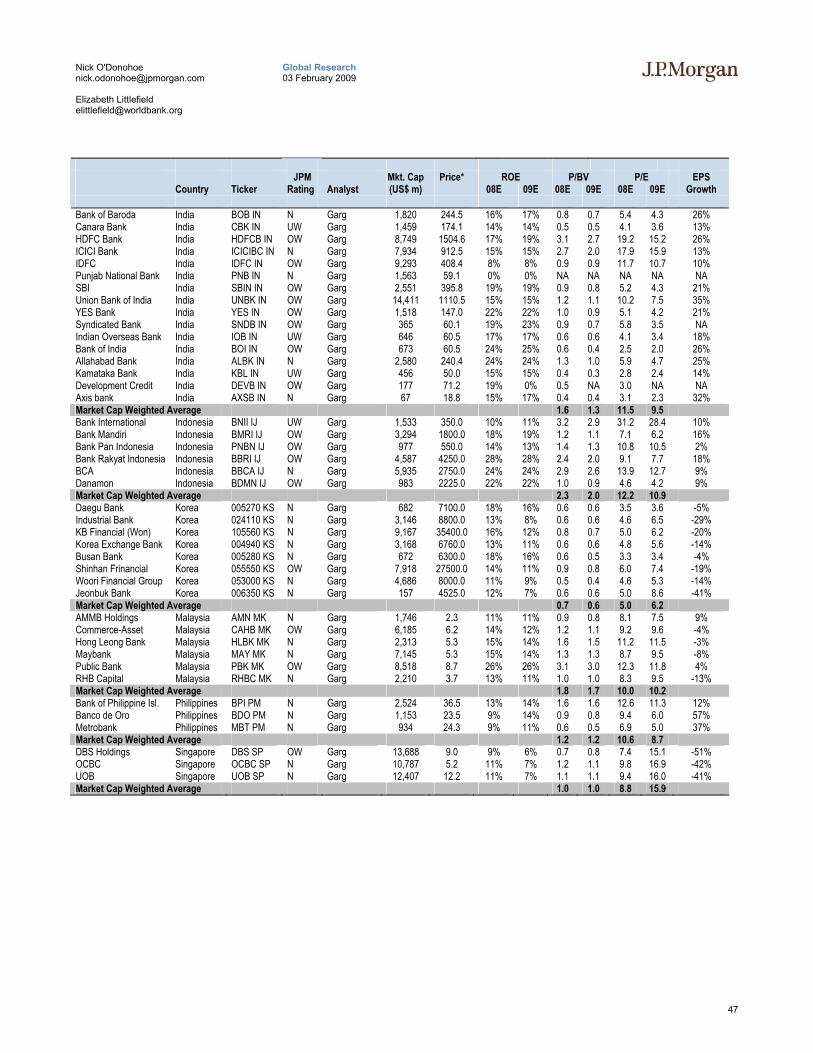
47
Global Research 03 February 2009
Nick O'Donohoe [email protected] Elizabeth Littlefield [email protected]
JPM Mkt. Cap Price* ROE P/BV P/E EPS Country Ticker Rating Analyst (US$ m) 08E 09E 08E 09E 08E 09E Growth Bank of Baroda India BOB IN N Garg 1,820 244.5 16% 17% 0.8 0.7 5.4 4.3 26% Canara Bank India CBK IN UW Garg 1,459 174.1 14% 14% 0.5 0.5 4.1 3.6 13% HDFC Bank India HDFCB IN OW Garg 8,749 1504.6 17% 19% 3.1 2.7 19.2 15.2 26% ICICI Bank India ICICIBC IN N Garg 7,934 912.5 15% 15% 2.7 2.0 17.9 15.9 13% IDFC India IDFC IN OW Garg 9,293 408.4 8% 8% 0.9 0.9 11.7 10.7 10% Punjab National Bank India PNB IN N Garg 1,563 59.1 0% 0% NA NA NA NA NA SBI India SBIN IN OW Garg 2,551 395.8 19% 19% 0.9 0.8 5.2 4.3 21% Union Bank of India India UNBK IN OW Garg 14,411 1110.5 15% 15% 1.2 1.1 10.2 7.5 35% YES Bank India YES IN OW Garg 1,518 147.0 22% 22% 1.0 0.9 5.1 4.2 21% Syndicated Bank India SNDB IN OW Garg 365 60.1 19% 23% 0.9 0.7 5.8 3.5 NA Indian Overseas Bank India IOB IN UW Garg 646 60.5 17% 17% 0.6 0.6 4.1 3.4 18% Bank of India India BOI IN OW Garg 673 60.5 24% 25% 0.6 0.4 2.5 2.0 26% Allahabad Bank India ALBK IN N Garg 2,580 240.4 24% 24% 1.3 1.0 5.9 4.7 25% Kamataka Bank India KBL IN UW Garg 456 50.0 15% 15% 0.4 0.3 2.8 2.4 14% Development Credit India DEVB IN OW Garg 177 71.2 19% 0% 0.5 NA 3.0 NA NA Axis bank India AXSB IN N Garg 67 18.8 15% 17% 0.4 0.4 3.1 2.3 32% Market Cap Weighted Average 1.6 1.3 11.5 9.5 Bank International Indonesia BNII IJ UW Garg 1,533 350.0 10% 11% 3.2 2.9 31.2 28.4 10% Bank Mandiri Indonesia BMRI IJ OW Garg 3,294 1800.0 18% 19% 1.2 1.1 7.1 6.2 16% Bank Pan Indonesia Indonesia PNBN IJ OW Garg 977 550.0 14% 13% 1.4 1.3 10.8 10.5 2% Bank Rakyat Indonesia Indonesia BBRI IJ OW Garg 4,587 4250.0 28% 28% 2.4 2.0 9.1 7.7 18% BCA Indonesia BBCA IJ N Garg 5,935 2750.0 24% 24% 2.9 2.6 13.9 12.7 9% Danamon Indonesia BDMN IJ OW Garg 983 2225.0 22% 22% 1.0 0.9 4.6 4.2 9% Market Cap Weighted Average 2.3 2.0 12.2 10.9 Daegu Bank Korea 005270 KS N Garg 682 7100.0 18% 16% 0.6 0.6 3.5 3.6 -5% Industrial Bank Korea 024110 KS N Garg 3,146 8800.0 13% 8% 0.6 0.6 4.6 6.5 -29% KB Financial (Won) Korea 105560 KS N Garg 9,167 35400.0 16% 12% 0.8 0.7 5.0 6.2 -20% Korea Exchange Bank Korea 004940 KS N Garg 3,168 6760.0 13% 11% 0.6 0.6 4.8 5.6 -14% Busan Bank Korea 005280 KS N Garg 672 6300.0 18% 16% 0.6 0.5 3.3 3.4 -4% Shinhan Frinancial Korea 055550 KS OW Garg 7,918 27500.0 14% 11% 0.9 0.8 6.0 7.4 -19% Woori Financial Group Korea 053000 KS N Garg 4,686 8000.0 11% 9% 0.5 0.4 4.6 5.3 -14% Jeonbuk Bank Korea 006350 KS N Garg 157 4525.0 12% 7% 0.6 0.6 5.0 8.6 -41% Market Cap Weighted Average 0.7 0.6 5.0 6.2 AMMB Holdings Malaysia AMN MK N Garg 1,746 2.3 11% 11% 0.9 0.8 8.1 7.5 9% Commerce-Asset Malaysia CAHB MK OW Garg 6,185 6.2 14% 12% 1.2 1.1 9.2 9.6 -4% Hong Leong Bank Malaysia HLBK MK N Garg 2,313 5.3 15% 14% 1.6 1.5 11.2 11.5 -3% Maybank Malaysia MAY MK N Garg 7,145 5.3 15% 14% 1.3 1.3 8.7 9.5 -8% Public Bank Malaysia PBK MK OW Garg 8,518 8.7 26% 26% 3.1 3.0 12.3 11.8 4% RHB Capital Malaysia RHBC MK N Garg 2,210 3.7 13% 11% 1.0 1.0 8.3 9.5 -13% Market Cap Weighted Average 1.8 1.7 10.0 10.2 Bank of Philippine Isl. Philippines BPI PM N Garg 2,524 36.5 13% 14% 1.6 1.6 12.6 11.3 12% Banco de Oro Philippines BDO PM N Garg 1,153 23.5 9% 14% 0.9 0.8 9.4 6.0 57% Metrobank Philippines MBT PM N Garg 934 24.3 9% 11% 0.6 0.5 6.9 5.0 37% Market Cap Weighted Average 1.2 1.2 10.6 8.7 DBS Holdings Singapore DBS SP OW Garg 13,688 9.0 9% 6% 0.7 0.8 7.4 15.1 -51% OCBC Singapore OCBC SP N Garg 10,787 5.2 11% 7% 1.2 1.1 9.8 16.9 -42% UOB Singapore UOB SP N Garg 12,407 12.2 11% 7% 1.1 1.1 9.4 16.0 -41% Market Cap Weighted Average 1.0 1.0 8.8 15.9
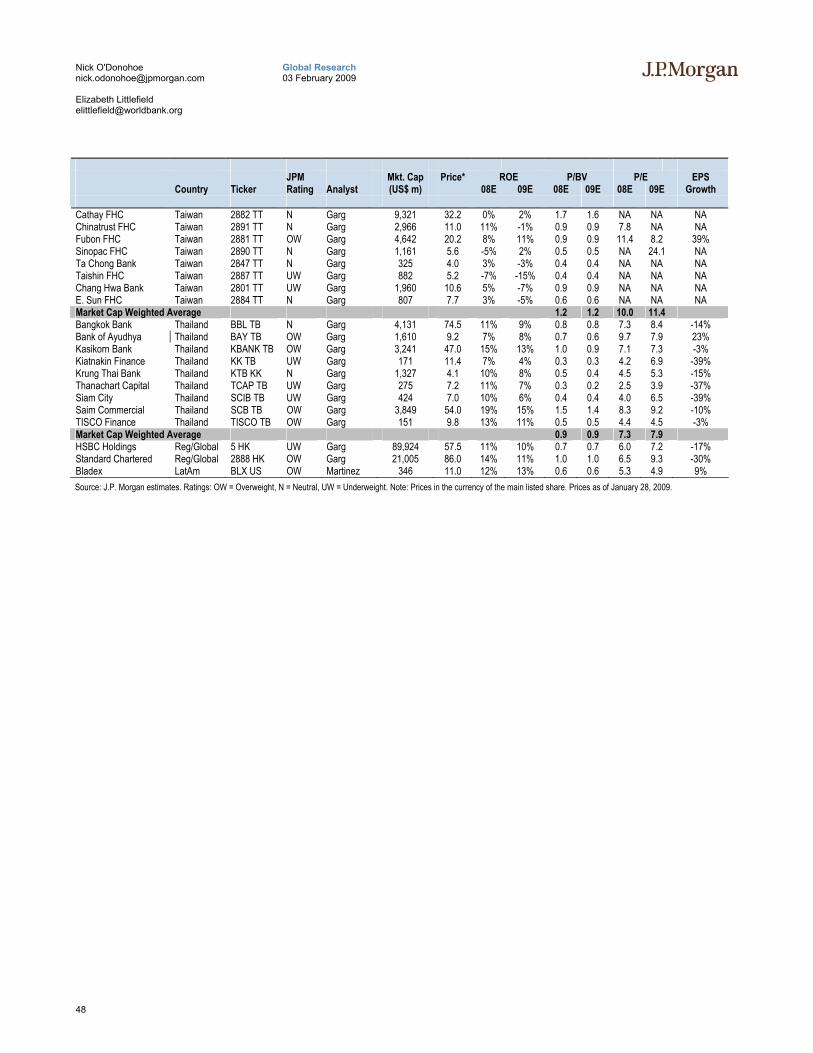
48
Global Research 03 February 2009
Nick O'Donohoe [email protected] Elizabeth Littlefield [email protected]
JPM Mkt. Cap Price* ROE P/BV P/E EPS Country Ticker Rating Analyst (US$ m) 08E 09E 08E 09E 08E 09E Growth
Cathay FHC Taiwan 2882 TT N Garg 9,321 32.2 0% 2% 1.7 1.6 NA NA NA Chinatrust FHC Taiwan 2891 TT N Garg 2,966 11.0 11% -1% 0.9 0.9 7.8 NA NA Fubon FHC Taiwan 2881 TT OW Garg 4,642 20.2 8% 11% 0.9 0.9 11.4 8.2 39% Sinopac FHC Taiwan 2890 TT N Garg 1,161 5.6 -5% 2% 0.5 0.5 NA 24.1 NA Ta Chong Bank Taiwan 2847 TT N Garg 325 4.0 3% -3% 0.4 0.4 NA NA NA Taishin FHC Taiwan 2887 TT UW Garg 882 5.2 -7% -15% 0.4 0.4 NA NA NA Chang Hwa Bank Taiwan 2801 TT UW Garg 1,960 10.6 5% -7% 0.9 0.9 NA NA NA E. Sun FHC Taiwan 2884 TT N Garg 807 7.7 3% -5% 0.6 0.6 NA NA NA Market Cap Weighted Average 1.2 1.2 10.0 11.4 Bangkok Bank Thailand BBL TB N Garg 4,131 74.5 11% 9% 0.8 0.8 7.3 8.4 -14% Bank of Ayudhya Thailand BAY TB OW Garg 1,610 9.2 7% 8% 0.7 0.6 9.7 7.9 23% Kasikorn Bank Thailand KBANK TB OW Garg 3,241 47.0 15% 13% 1.0 0.9 7.1 7.3 -3% Kiatnakin Finance Thailand KK TB UW Garg 171 11.4 7% 4% 0.3 0.3 4.2 6.9 -39% Krung Thai Bank Thailand KTB KK N Garg 1,327 4.1 10% 8% 0.5 0.4 4.5 5.3 -15% Thanachart Capital Thailand TCAP TB UW Garg 275 7.2 11% 7% 0.3 0.2 2.5 3.9 -37% Siam City Thailand SCIB TB UW Garg 424 7.0 10% 6% 0.4 0.4 4.0 6.5 -39% Saim Commercial Thailand SCB TB OW Garg 3,849 54.0 19% 15% 1.5 1.4 8.3 9.2 -10% TISCO Finance Thailand TISCO TB OW Garg 151 9.8 13% 11% 0.5 0.5 4.4 4.5 -3% Market Cap Weighted Average 0.9 0.9 7.3 7.9 HSBC Holdings Reg/Global 5 HK UW Garg 89,924 57.5 11% 10% 0.7 0.7 6.0 7.2 -17% Standard Chartered Reg/Global 2888 HK OW Garg 21,005 86.0 14% 11% 1.0 1.0 6.5 9.3 -30% Bladex LatAm BLX US OW Martinez 346 11.0 12% 13% 0.6 0.6 5.3 4.9 9% Source: J.P. Morgan estimates. Ratings: OW = Overweight, N = Neutral, UW = Underweight. Note: Prices in the currency of the main listed share. Prices as of January 28, 2009.
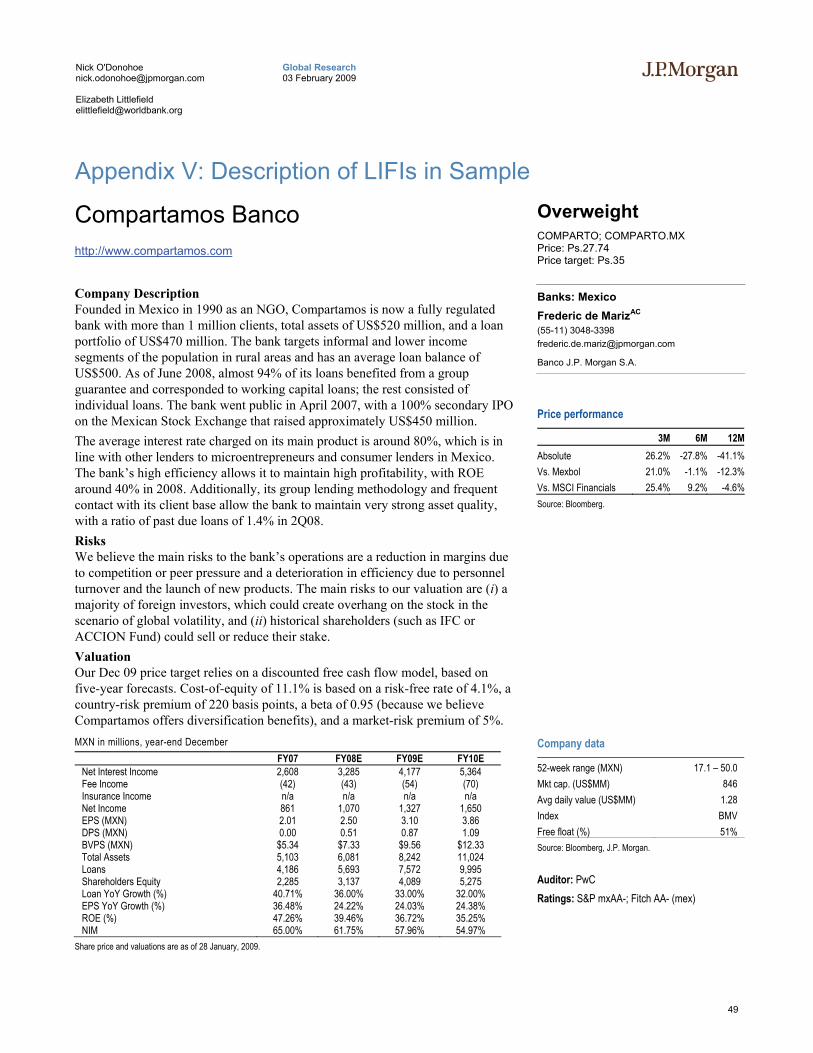
49
Global Research 03 February 2009
Nick O'Donohoe [email protected] Elizabeth Littlefield [email protected]
Appendix V: Description of LIFIs in Sample
Compartamos Banco http://www.compartamos.com
Overweight COMPARTO; COMPARTO.MX Price: Ps.27.74 Price target: Ps.35
Company Description Founded in Mexico in 1990 as an NGO, Compartamos is now a fully regulated bank with more than 1 million clients, total assets of US$520 million, and a loan portfolio of US$470 million. The bank targets informal and lower income segments of the population in rural areas and has an average loan balance of US$500. As of June 2008, almost 94% of its loans benefited from a group guarantee and corresponded to working capital loans; the rest consisted of individual loans. The bank went public in April 2007, with a 100% secondary IPO on the Mexican Stock Exchange that raised approximately US$450 million. The average interest rate charged on its main product is around 80%, which is in line with other lenders to microentrepreneurs and consumer lenders in Mexico. The bank’s high efficiency allows it to maintain high profitability, with ROE around 40% in 2008. Additionally, its group lending methodology and frequent contact with its client base allow the bank to maintain very strong asset quality, with a ratio of past due loans of 1.4% in 2Q08. Risks We believe the main risks to the bank’s operations are a reduction in margins due to competition or peer pressure and a deterioration in efficiency due to personnel turnover and the launch of new products. The main risks to our valuation are (i) a majority of foreign investors, which could create overhang on the stock in the scenario of global volatility, and (ii) historical shareholders (such as IFC or ACCION Fund) could sell or reduce their stake. Valuation Our Dec 09 price target relies on a discounted free cash flow model, based on five-year forecasts. Cost-of-equity of 11.1% is based on a risk-free rate of 4.1%, a country-risk premium of 220 basis points, a beta of 0.95 (because we believe Compartamos offers diversification benefits), and a market-risk premium of 5%.
Banks: Mexico Frederic de MarizAC (55-11) 3048-3398 [email protected]
Banco J.P. Morgan S.A.
Price performance
3M 6M 12MAbsolute 26.2% -27.8% -41.1%Vs. Mexbol 21.0% -1.1% -12.3%Vs. MSCI Financials 25.4% 9.2% -4.6%Source: Bloomberg.
MXN in millions, year-end December FY07 FY08E FY09E FY10E
Net Interest Income 2,608 3,285 4,177 5,364 Fee Income (42) (43) (54) (70) Insurance Income n/a n/a n/a n/a Net Income 861 1,070 1,327 1,650 EPS (MXN) 2.01 2.50 3.10 3.86 DPS (MXN) 0.00 0.51 0.87 1.09 BVPS (MXN) $5.34 $7.33 $9.56 $12.33 Total Assets 5,103 6,081 8,242 11,024 Loans 4,186 5,693 7,572 9,995 Shareholders Equity 2,285 3,137 4,089 5,275 Loan YoY Growth (%) 40.71% 36.00% 33.00% 32.00% EPS YoY Growth (%) 36.48% 24.22% 24.03% 24.38% ROE (%) 47.26% 39.46% 36.72% 35.25% NIM 65.00% 61.75% 57.96% 54.97%
Share price and valuations are as of 28 January, 2009.
Company data
52-week range (MXN) 17.1 – 50.0 Mkt cap. (US$MM) 846 Avg daily value (US$MM) 1.28 Index BMV Free float (%) 51% Source: Bloomberg, J.P. Morgan.
Auditor: PwC Ratings: S&P mxAA-; Fitch AA- (mex)
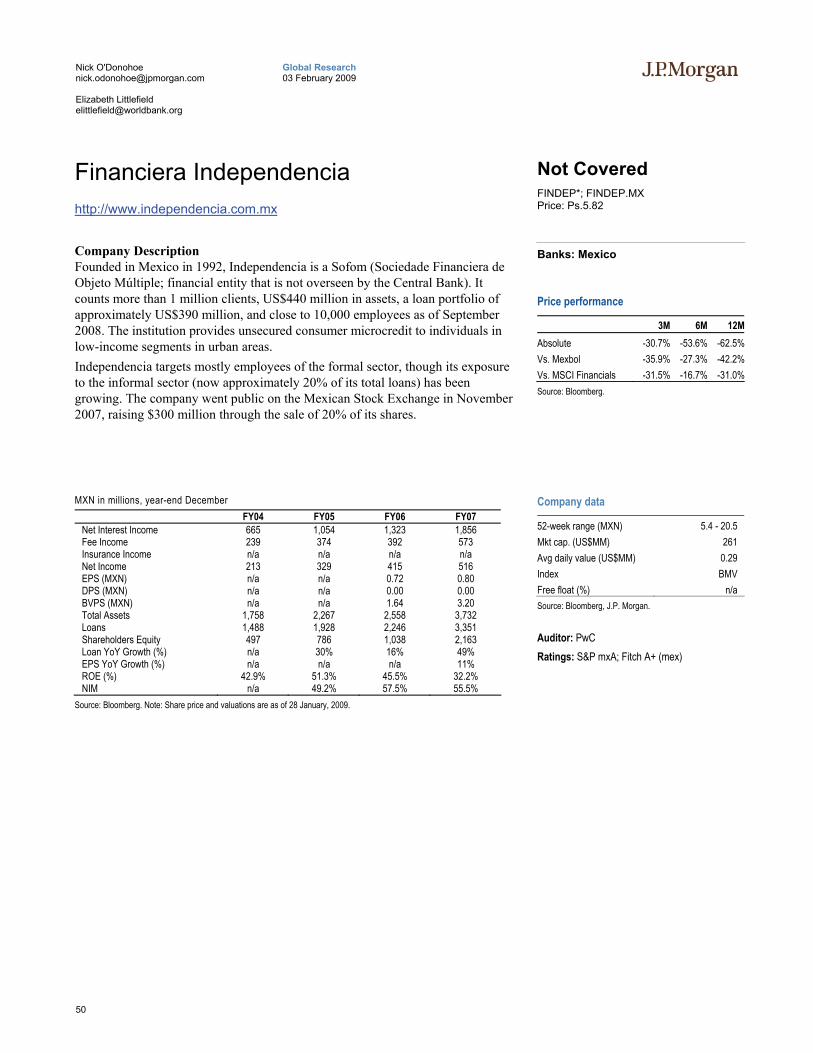
50
Global Research 03 February 2009
Nick O'Donohoe [email protected] Elizabeth Littlefield [email protected]
Financiera Independencia http://www.independencia.com.mx
Not Covered FINDEP*; FINDEP.MX Price: Ps.5.82
Company Description Founded in Mexico in 1992, Independencia is a Sofom (Sociedade Financiera de Objeto Múltiple; financial entity that is not overseen by the Central Bank). It counts more than 1 million clients, US$440 million in assets, a loan portfolio of approximately US$390 million, and close to 10,000 employees as of September 2008. The institution provides unsecured consumer microcredit to individuals in low-income segments in urban areas. Independencia targets mostly employees of the formal sector, though its exposure to the informal sector (now approximately 20% of its total loans) has been growing. The company went public on the Mexican Stock Exchange in November 2007, raising $300 million through the sale of 20% of its shares.
Banks: Mexico
Price performance
3M 6M 12MAbsolute -30.7% -53.6% -62.5%Vs. Mexbol -35.9% -27.3% -42.2%Vs. MSCI Financials -31.5% -16.7% -31.0%Source: Bloomberg.
MXN in millions, year-end December FY04 FY05 FY06 FY07
Net Interest Income 665 1,054 1,323 1,856 Fee Income 239 374 392 573 Insurance Income n/a n/a n/a n/a Net Income 213 329 415 516 EPS (MXN) n/a n/a 0.72 0.80 DPS (MXN) n/a n/a 0.00 0.00 BVPS (MXN) n/a n/a 1.64 3.20 Total Assets 1,758 2,267 2,558 3,732 Loans 1,488 1,928 2,246 3,351 Shareholders Equity 497 786 1,038 2,163 Loan YoY Growth (%) n/a 30% 16% 49% EPS YoY Growth (%) n/a n/a n/a 11% ROE (%) 42.9% 51.3% 45.5% 32.2% NIM n/a 49.2% 57.5% 55.5%
Source: Bloomberg. Note: Share price and valuations are as of 28 January, 2009.
Company data
52-week range (MXN) 5.4 - 20.5 Mkt cap. (US$MM) 261 Avg daily value (US$MM) 0.29 Index BMV Free float (%) n/aSource: Bloomberg, J.P. Morgan.
Auditor: PwC Ratings: S&P mxA; Fitch A+ (mex)
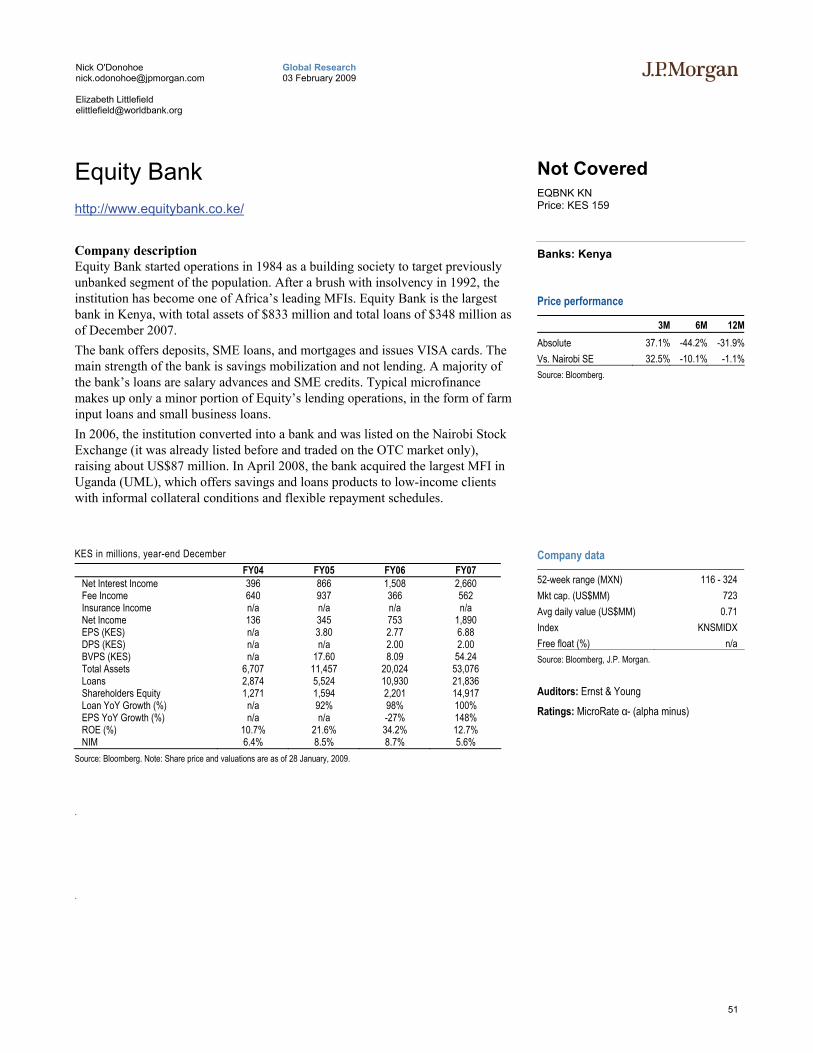
51
Global Research 03 February 2009
Nick O'Donohoe [email protected] Elizabeth Littlefield [email protected]
Equity Bank http://www.equitybank.co.ke/
Not Covered EQBNK KN Price: KES 159
Company description Equity Bank started operations in 1984 as a building society to target previously unbanked segment of the population. After a brush with insolvency in 1992, the institution has become one of Africa’s leading MFIs. Equity Bank is the largest bank in Kenya, with total assets of $833 million and total loans of $348 million as of December 2007. The bank offers deposits, SME loans, and mortgages and issues VISA cards. The main strength of the bank is savings mobilization and not lending. A majority of the bank’s loans are salary advances and SME credits. Typical microfinance makes up only a minor portion of Equity’s lending operations, in the form of farm input loans and small business loans. In 2006, the institution converted into a bank and was listed on the Nairobi Stock Exchange (it was already listed before and traded on the OTC market only), raising about US$87 million. In April 2008, the bank acquired the largest MFI in Uganda (UML), which offers savings and loans products to low-income clients with informal collateral conditions and flexible repayment schedules.
Banks: Kenya
Price performance
3M 6M 12MAbsolute 37.1% -44.2% -31.9%Vs. Nairobi SE 32.5% -10.1% -1.1%Source: Bloomberg.
KES in millions, year-end December FY04 FY05 FY06 FY07
Net Interest Income 396 866 1,508 2,660 Fee Income 640 937 366 562 Insurance Income n/a n/a n/a n/a Net Income 136 345 753 1,890 EPS (KES) n/a 3.80 2.77 6.88 DPS (KES) n/a n/a 2.00 2.00 BVPS (KES) n/a 17.60 8.09 54.24 Total Assets 6,707 11,457 20,024 53,076 Loans 2,874 5,524 10,930 21,836 Shareholders Equity 1,271 1,594 2,201 14,917 Loan YoY Growth (%) n/a 92% 98% 100% EPS YoY Growth (%) n/a n/a -27% 148% ROE (%) 10.7% 21.6% 34.2% 12.7% NIM 6.4% 8.5% 8.7% 5.6%
Source: Bloomberg. Note: Share price and valuations are as of 28 January, 2009.
Company data
52-week range (MXN) 116 - 324 Mkt cap. (US$MM) 723 Avg daily value (US$MM) 0.71 Index KNSMIDX Free float (%) n/aSource: Bloomberg, J.P. Morgan.
Auditors: Ernst & Young Ratings: MicroRate α- (alpha minus)
.
.
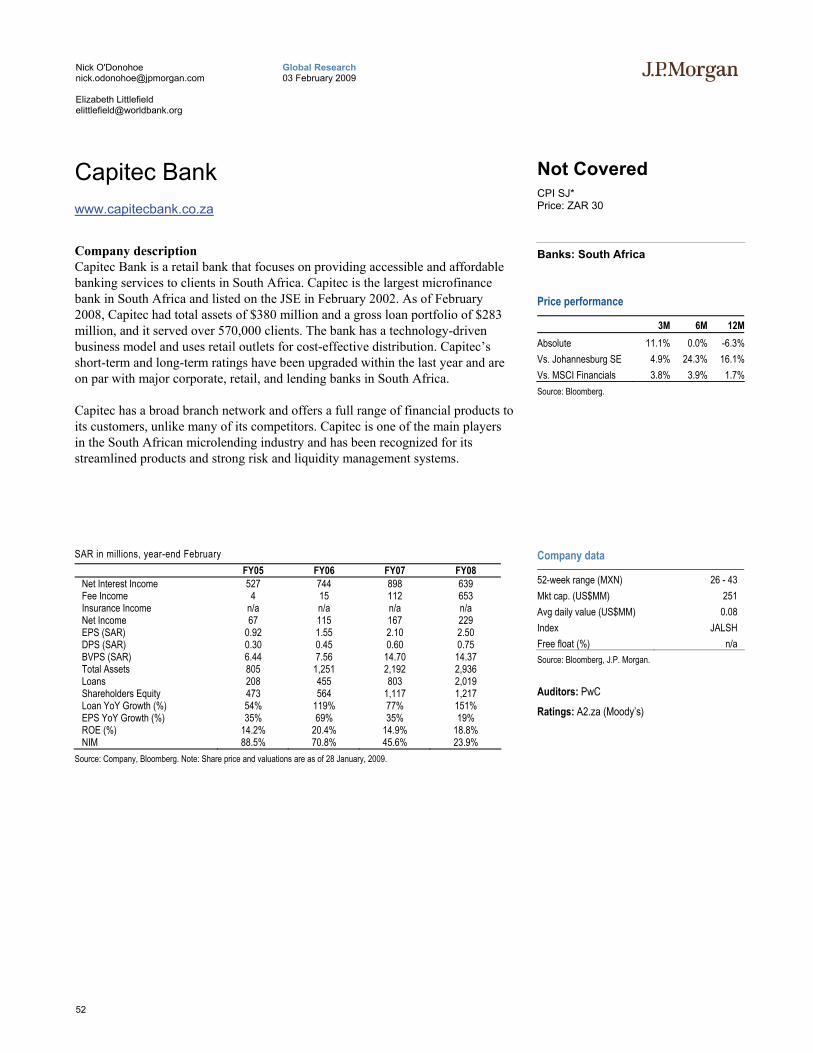
52
Global Research 03 February 2009
Nick O'Donohoe [email protected] Elizabeth Littlefield [email protected]
Capitec Bank www.capitecbank.co.za
Not Covered CPI SJ* Price: ZAR 30
Company description Capitec Bank is a retail bank that focuses on providing accessible and affordable banking services to clients in South Africa. Capitec is the largest microfinance bank in South Africa and listed on the JSE in February 2002. As of February 2008, Capitec had total assets of $380 million and a gross loan portfolio of $283 million, and it served over 570,000 clients. The bank has a technology-driven business model and uses retail outlets for cost-effective distribution. Capitec’s short-term and long-term ratings have been upgraded within the last year and are on par with major corporate, retail, and lending banks in South Africa.
Capitec has a broad branch network and offers a full range of financial products to its customers, unlike many of its competitors. Capitec is one of the main players in the South African microlending industry and has been recognized for its streamlined products and strong risk and liquidity management systems.
Banks: South Africa
Price performance
3M 6M 12MAbsolute 11.1% 0.0% -6.3%Vs. Johannesburg SE 4.9% 24.3% 16.1%Vs. MSCI Financials 3.8% 3.9% 1.7%Source: Bloomberg.
SAR in millions, year-end February FY05 FY06 FY07 FY08
Net Interest Income 527 744 898 639 Fee Income 4 15 112 653 Insurance Income n/a n/a n/a n/a Net Income 67 115 167 229 EPS (SAR) 0.92 1.55 2.10 2.50 DPS (SAR) 0.30 0.45 0.60 0.75 BVPS (SAR) 6.44 7.56 14.70 14.37 Total Assets 805 1,251 2,192 2,936 Loans 208 455 803 2,019 Shareholders Equity 473 564 1,117 1,217 Loan YoY Growth (%) 54% 119% 77% 151% EPS YoY Growth (%) 35% 69% 35% 19% ROE (%) 14.2% 20.4% 14.9% 18.8% NIM 88.5% 70.8% 45.6% 23.9%
Source: Company, Bloomberg. Note: Share price and valuations are as of 28 January, 2009.
Company data
52-week range (MXN) 26 - 43 Mkt cap. (US$MM) 251 Avg daily value (US$MM) 0.08 Index JALSH Free float (%) n/aSource: Bloomberg, J.P. Morgan.
Auditors: PwC Ratings: A2.za (Moody’s)
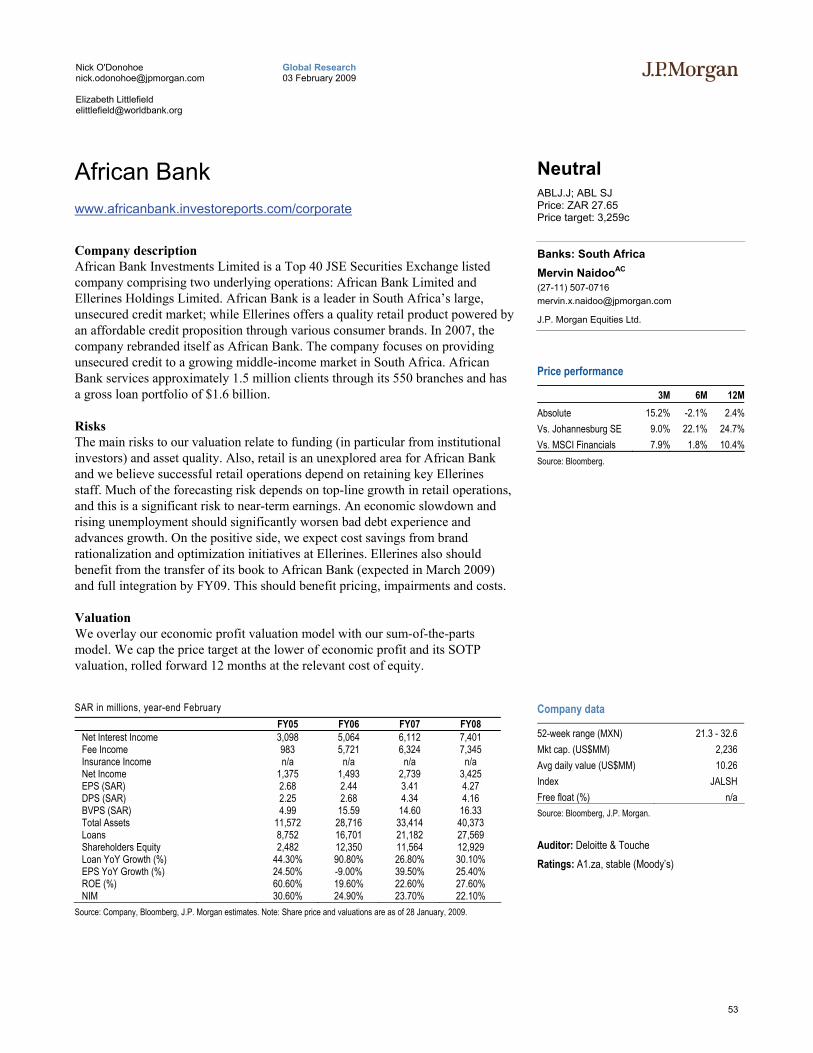
53
Global Research 03 February 2009
Nick O'Donohoe [email protected] Elizabeth Littlefield [email protected]
African Bank www.africanbank.investoreports.com/corporate
Neutral ABLJ.J; ABL SJ Price: ZAR 27.65 Price target: 3,259c
Company description African Bank Investments Limited is a Top 40 JSE Securities Exchange listed company comprising two underlying operations: African Bank Limited and Ellerines Holdings Limited. African Bank is a leader in South Africa’s large, unsecured credit market; while Ellerines offers a quality retail product powered by an affordable credit proposition through various consumer brands. In 2007, the company rebranded itself as African Bank. The company focuses on providing unsecured credit to a growing middle-income market in South Africa. African Bank services approximately 1.5 million clients through its 550 branches and has a gross loan portfolio of $1.6 billion.
Risks The main risks to our valuation relate to funding (in particular from institutional investors) and asset quality. Also, retail is an unexplored area for African Bank and we believe successful retail operations depend on retaining key Ellerines staff. Much of the forecasting risk depends on top-line growth in retail operations, and this is a significant risk to near-term earnings. An economic slowdown and rising unemployment should significantly worsen bad debt experience and advances growth. On the positive side, we expect cost savings from brand rationalization and optimization initiatives at Ellerines. Ellerines also should benefit from the transfer of its book to African Bank (expected in March 2009) and full integration by FY09. This should benefit pricing, impairments and costs.
Valuation We overlay our economic profit valuation model with our sum-of-the-parts model. We cap the price target at the lower of economic profit and its SOTP valuation, rolled forward 12 months at the relevant cost of equity.
Banks: South Africa Mervin NaidooAC (27-11) 507-0716 [email protected]
J.P. Morgan Equities Ltd.
Price performance
3M 6M 12MAbsolute 15.2% -2.1% 2.4%Vs. Johannesburg SE 9.0% 22.1% 24.7%Vs. MSCI Financials 7.9% 1.8% 10.4%Source: Bloomberg.
SAR in millions, year-end February FY05 FY06 FY07 FY08 Net Interest Income 3,098 5,064 6,112 7,401 Fee Income 983 5,721 6,324 7,345 Insurance Income n/a n/a n/a n/a Net Income 1,375 1,493 2,739 3,425 EPS (SAR) 2.68 2.44 3.41 4.27 DPS (SAR) 2.25 2.68 4.34 4.16 BVPS (SAR) 4.99 15.59 14.60 16.33 Total Assets 11,572 28,716 33,414 40,373 Loans 8,752 16,701 21,182 27,569 Shareholders Equity 2,482 12,350 11,564 12,929 Loan YoY Growth (%) 44.30% 90.80% 26.80% 30.10% EPS YoY Growth (%) 24.50% -9.00% 39.50% 25.40% ROE (%) 60.60% 19.60% 22.60% 27.60% NIM 30.60% 24.90% 23.70% 22.10%
Source: Company, Bloomberg, J.P. Morgan estimates. Note: Share price and valuations are as of 28 January, 2009.
Company data
52-week range (MXN) 21.3 - 32.6 Mkt cap. (US$MM) 2,236 Avg daily value (US$MM) 10.26 Index JALSH Free float (%) n/aSource: Bloomberg, J.P. Morgan.
Auditor: Deloitte & Touche Ratings: A1.za, stable (Moody’s)
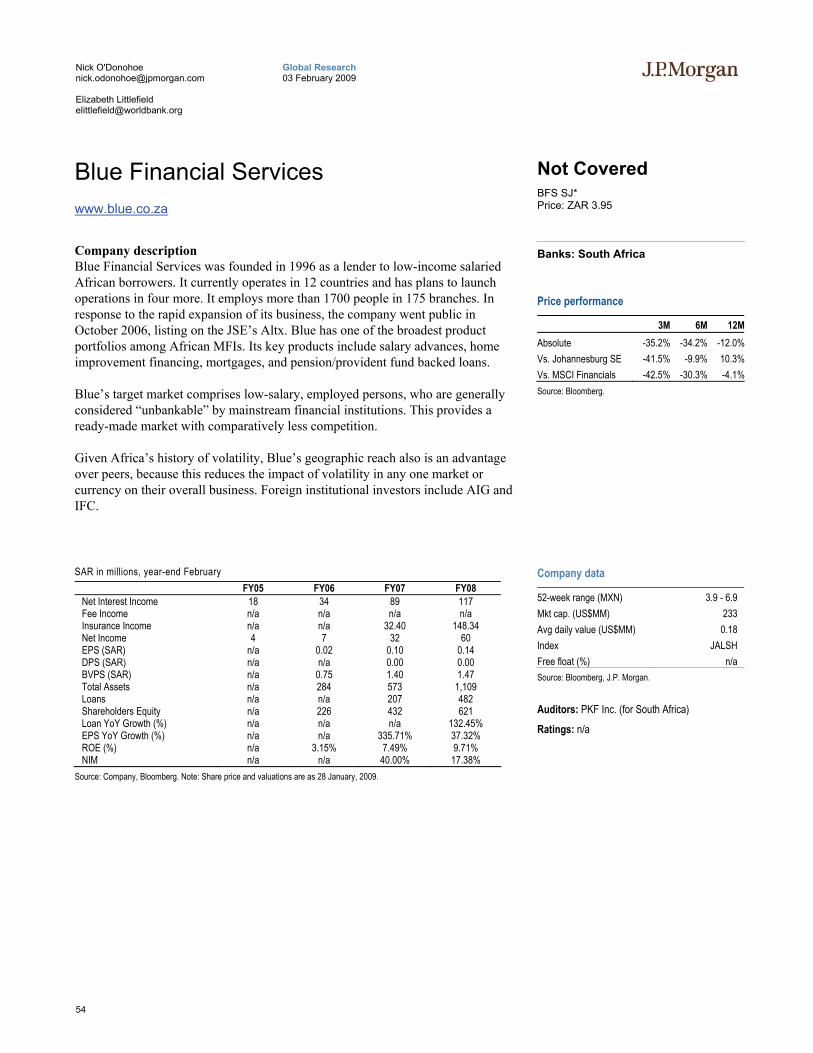
54
Global Research 03 February 2009
Nick O'Donohoe [email protected] Elizabeth Littlefield [email protected]
Blue Financial Services www.blue.co.za
Not Covered BFS SJ* Price: ZAR 3.95
Company description Blue Financial Services was founded in 1996 as a lender to low-income salaried African borrowers. It currently operates in 12 countries and has plans to launch operations in four more. It employs more than 1700 people in 175 branches. In response to the rapid expansion of its business, the company went public in October 2006, listing on the JSE’s Altx. Blue has one of the broadest product portfolios among African MFIs. Its key products include salary advances, home improvement financing, mortgages, and pension/provident fund backed loans.
Blue’s target market comprises low-salary, employed persons, who are generally considered “unbankable” by mainstream financial institutions. This provides a ready-made market with comparatively less competition.
Given Africa’s history of volatility, Blue’s geographic reach also is an advantage over peers, because this reduces the impact of volatility in any one market or currency on their overall business. Foreign institutional investors include AIG and IFC.
Banks: South Africa
Price performance
3M 6M 12MAbsolute -35.2% -34.2% -12.0%Vs. Johannesburg SE -41.5% -9.9% 10.3%Vs. MSCI Financials -42.5% -30.3% -4.1%Source: Bloomberg.
SAR in millions, year-end February FY05 FY06 FY07 FY08
Net Interest Income 18 34 89 117 Fee Income n/a n/a n/a n/a Insurance Income n/a n/a 32.40 148.34 Net Income 4 7 32 60 EPS (SAR) n/a 0.02 0.10 0.14 DPS (SAR) n/a n/a 0.00 0.00 BVPS (SAR) n/a 0.75 1.40 1.47 Total Assets n/a 284 573 1,109 Loans n/a n/a 207 482 Shareholders Equity n/a 226 432 621 Loan YoY Growth (%) n/a n/a n/a 132.45% EPS YoY Growth (%) n/a n/a 335.71% 37.32% ROE (%) n/a 3.15% 7.49% 9.71% NIM n/a n/a 40.00% 17.38%
Source: Company, Bloomberg. Note: Share price and valuations are as 28 January, 2009.
Company data
52-week range (MXN) 3.9 - 6.9 Mkt cap. (US$MM) 233 Avg daily value (US$MM) 0.18 Index JALSH Free float (%) n/aSource: Bloomberg, J.P. Morgan.
Auditors: PKF Inc. (for South Africa) Ratings: n/a
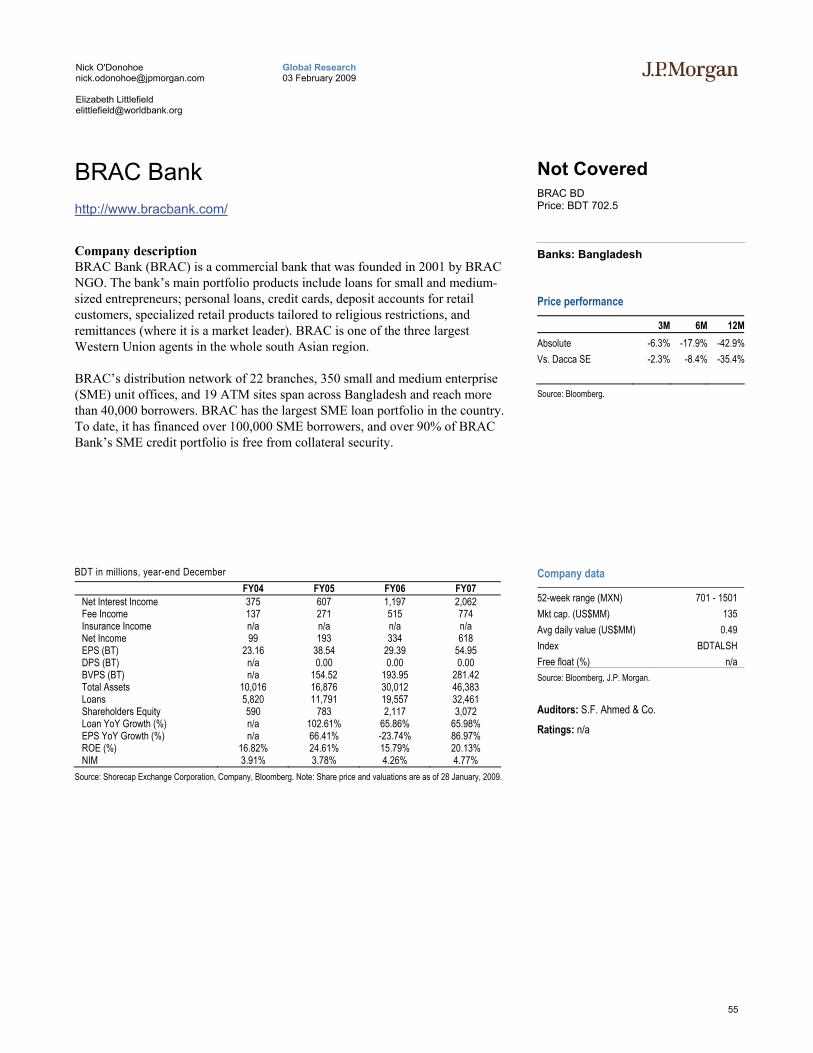
55
Global Research 03 February 2009
Nick O'Donohoe [email protected] Elizabeth Littlefield [email protected]
BRAC Bank http://www.bracbank.com/
Not Covered BRAC BD Price: BDT 702.5
Company description BRAC Bank (BRAC) is a commercial bank that was founded in 2001 by BRAC NGO. The bank’s main portfolio products include loans for small and medium-sized entrepreneurs; personal loans, credit cards, deposit accounts for retail customers, specialized retail products tailored to religious restrictions, and remittances (where it is a market leader). BRAC is one of the three largest Western Union agents in the whole south Asian region.
BRAC’s distribution network of 22 branches, 350 small and medium enterprise (SME) unit offices, and 19 ATM sites span across Bangladesh and reach more than 40,000 borrowers. BRAC has the largest SME loan portfolio in the country. To date, it has financed over 100,000 SME borrowers, and over 90% of BRAC Bank’s SME credit portfolio is free from collateral security.
Banks: Bangladesh
Price performance
3M 6M 12MAbsolute -6.3% -17.9% -42.9%Vs. Dacca SE -2.3% -8.4% -35.4% Source: Bloomberg.
BDT in millions, year-end December FY04 FY05 FY06 FY07
Net Interest Income 375 607 1,197 2,062 Fee Income 137 271 515 774 Insurance Income n/a n/a n/a n/a Net Income 99 193 334 618 EPS (BT) 23.16 38.54 29.39 54.95 DPS (BT) n/a 0.00 0.00 0.00 BVPS (BT) n/a 154.52 193.95 281.42 Total Assets 10,016 16,876 30,012 46,383 Loans 5,820 11,791 19,557 32,461 Shareholders Equity 590 783 2,117 3,072 Loan YoY Growth (%) n/a 102.61% 65.86% 65.98% EPS YoY Growth (%) n/a 66.41% -23.74% 86.97% ROE (%) 16.82% 24.61% 15.79% 20.13% NIM 3.91% 3.78% 4.26% 4.77%
Source: Shorecap Exchange Corporation, Company, Bloomberg. Note: Share price and valuations are as of 28 January, 2009.
Company data
52-week range (MXN) 701 - 1501 Mkt cap. (US$MM) 135 Avg daily value (US$MM) 0.49 Index BDTALSH Free float (%) n/aSource: Bloomberg, J.P. Morgan.
Auditors: S.F. Ahmed & Co. Ratings: n/a
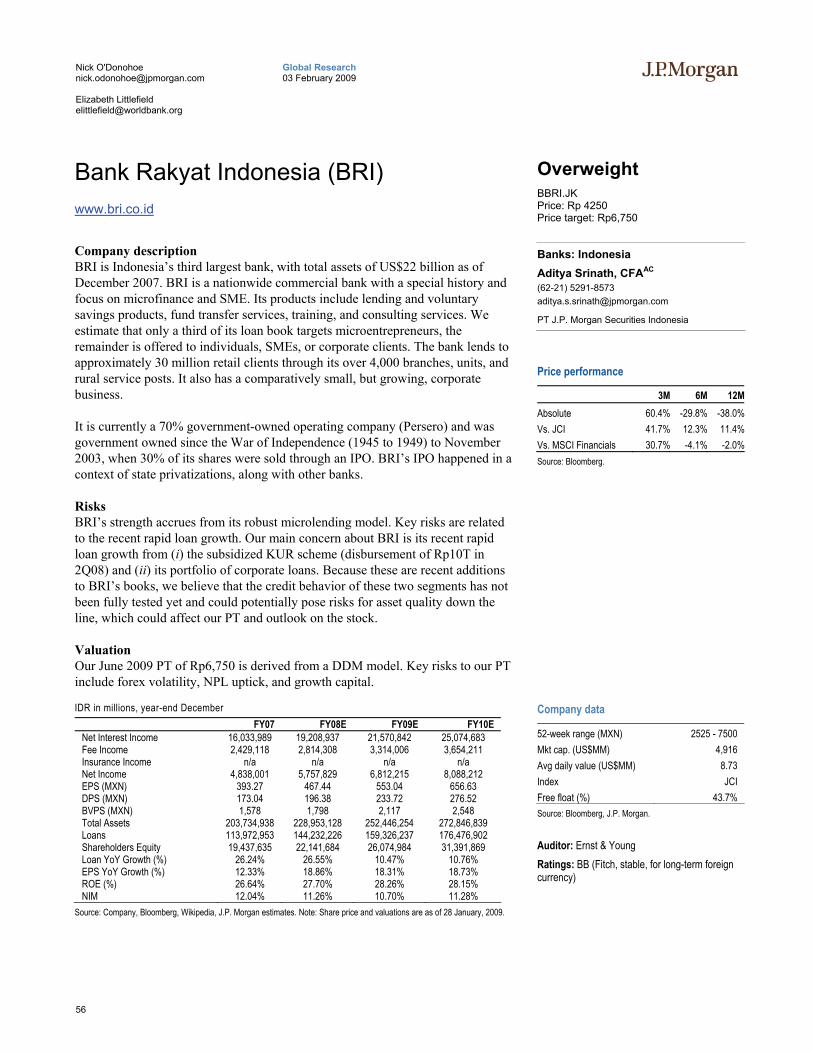
56
Global Research 03 February 2009
Nick O'Donohoe [email protected] Elizabeth Littlefield [email protected]
Bank Rakyat Indonesia (BRI) www.bri.co.id
Overweight BBRI.JK Price: Rp 4250 Price target: Rp6,750
Company description BRI is Indonesia’s third largest bank, with total assets of US$22 billion as of December 2007. BRI is a nationwide commercial bank with a special history and focus on microfinance and SME. Its products include lending and voluntary savings products, fund transfer services, training, and consulting services. We estimate that only a third of its loan book targets microentrepreneurs, the remainder is offered to individuals, SMEs, or corporate clients. The bank lends to approximately 30 million retail clients through its over 4,000 branches, units, and rural service posts. It also has a comparatively small, but growing, corporate business.
It is currently a 70% government-owned operating company (Persero) and was government owned since the War of Independence (1945 to 1949) to November 2003, when 30% of its shares were sold through an IPO. BRI’s IPO happened in a context of state privatizations, along with other banks.
Risks BRI’s strength accrues from its robust microlending model. Key risks are related to the recent rapid loan growth. Our main concern about BRI is its recent rapid loan growth from (i) the subsidized KUR scheme (disbursement of Rp10T in 2Q08) and (ii) its portfolio of corporate loans. Because these are recent additions to BRI’s books, we believe that the credit behavior of these two segments has not been fully tested yet and could potentially pose risks for asset quality down the line, which could affect our PT and outlook on the stock.
Valuation Our June 2009 PT of Rp6,750 is derived from a DDM model. Key risks to our PT include forex volatility, NPL uptick, and growth capital.
Banks: Indonesia Aditya Srinath, CFAAC (62-21) 5291-8573 [email protected]
PT J.P. Morgan Securities Indonesia
Price performance
3M 6M 12MAbsolute 60.4% -29.8% -38.0%Vs. JCI 41.7% 12.3% 11.4%Vs. MSCI Financials 30.7% -4.1% -2.0%Source: Bloomberg.
IDR in millions, year-end December FY07 FY08E FY09E FY10E Net Interest Income 16,033,989 19,208,937 21,570,842 25,074,683 Fee Income 2,429,118 2,814,308 3,314,006 3,654,211 Insurance Income n/a n/a n/a n/a Net Income 4,838,001 5,757,829 6,812,215 8,088,212 EPS (MXN) 393.27 467.44 553.04 656.63 DPS (MXN) 173.04 196.38 233.72 276.52 BVPS (MXN) 1,578 1,798 2,117 2,548 Total Assets 203,734,938 228,953,128 252,446,254 272,846,839 Loans 113,972,953 144,232,226 159,326,237 176,476,902 Shareholders Equity 19,437,635 22,141,684 26,074,984 31,391,869 Loan YoY Growth (%) 26.24% 26.55% 10.47% 10.76% EPS YoY Growth (%) 12.33% 18.86% 18.31% 18.73% ROE (%) 26.64% 27.70% 28.26% 28.15% NIM 12.04% 11.26% 10.70% 11.28%
Source: Company, Bloomberg, Wikipedia, J.P. Morgan estimates. Note: Share price and valuations are as of 28 January, 2009.
Company data
52-week range (MXN) 2525 - 7500 Mkt cap. (US$MM) 4,916 Avg daily value (US$MM) 8.73 Index JCI Free float (%) 43.7% Source: Bloomberg, J.P. Morgan.
Auditor: Ernst & Young Ratings: BB (Fitch, stable, for long-term foreign currency)
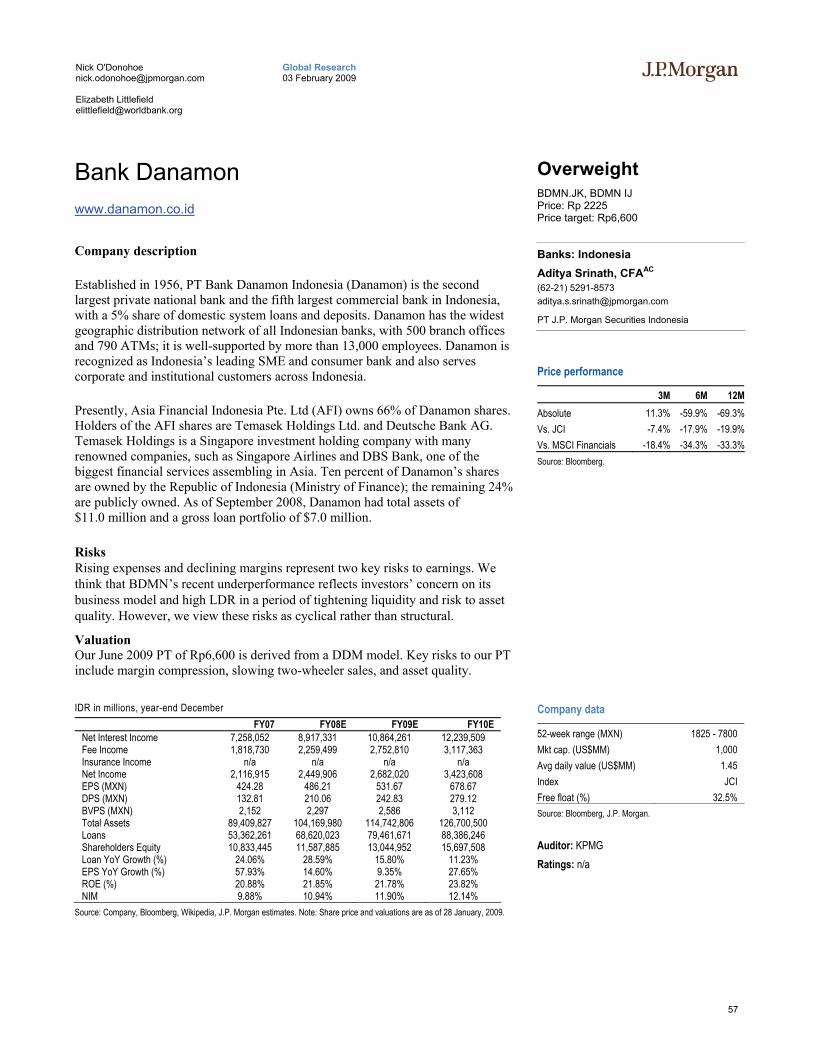
57
Global Research 03 February 2009
Nick O'Donohoe [email protected] Elizabeth Littlefield [email protected]
Bank Danamon www.danamon.co.id
Overweight BDMN.JK, BDMN IJ Price: Rp 2225 Price target: Rp6,600
Company description
Established in 1956, PT Bank Danamon Indonesia (Danamon) is the second largest private national bank and the fifth largest commercial bank in Indonesia, with a 5% share of domestic system loans and deposits. Danamon has the widest geographic distribution network of all Indonesian banks, with 500 branch offices and 790 ATMs; it is well-supported by more than 13,000 employees. Danamon is recognized as Indonesia’s leading SME and consumer bank and also serves corporate and institutional customers across Indonesia.
Presently, Asia Financial Indonesia Pte. Ltd (AFI) owns 66% of Danamon shares. Holders of the AFI shares are Temasek Holdings Ltd. and Deutsche Bank AG. Temasek Holdings is a Singapore investment holding company with many renowned companies, such as Singapore Airlines and DBS Bank, one of the biggest financial services assembling in Asia. Ten percent of Danamon’s shares are owned by the Republic of Indonesia (Ministry of Finance); the remaining 24% are publicly owned. As of September 2008, Danamon had total assets of $11.0 million and a gross loan portfolio of $7.0 million.
Risks Rising expenses and declining margins represent two key risks to earnings. We think that BDMN’s recent underperformance reflects investors’ concern on its business model and high LDR in a period of tightening liquidity and risk to asset quality. However, we view these risks as cyclical rather than structural.
Valuation Our June 2009 PT of Rp6,600 is derived from a DDM model. Key risks to our PT include margin compression, slowing two-wheeler sales, and asset quality.
Banks: Indonesia Aditya Srinath, CFAAC (62-21) 5291-8573 [email protected]
PT J.P. Morgan Securities Indonesia
Price performance
3M 6M 12MAbsolute 11.3% -59.9% -69.3%Vs. JCI -7.4% -17.9% -19.9%Vs. MSCI Financials -18.4% -34.3% -33.3%Source: Bloomberg.
IDR in millions, year-end December FY07 FY08E FY09E FY10E Net Interest Income 7,258,052 8,917,331 10,864,261 12,239,509 Fee Income 1,818,730 2,259,499 2,752,810 3,117,363 Insurance Income n/a n/a n/a n/a Net Income 2,116,915 2,449,906 2,682,020 3,423,608 EPS (MXN) 424.28 486.21 531.67 678.67 DPS (MXN) 132.81 210.06 242.83 279.12 BVPS (MXN) 2,152 2,297 2,586 3,112 Total Assets 89,409,827 104,169,980 114,742,806 126,700,500 Loans 53,362,261 68,620,023 79,461,671 88,386,246 Shareholders Equity 10,833,445 11,587,885 13,044,952 15,697,508 Loan YoY Growth (%) 24.06% 28.59% 15.80% 11.23% EPS YoY Growth (%) 57.93% 14.60% 9.35% 27.65% ROE (%) 20.88% 21.85% 21.78% 23.82% NIM 9.88% 10.94% 11.90% 12.14%
Source: Company, Bloomberg, Wikipedia, J.P. Morgan estimates. Note: Share price and valuations are as of 28 January, 2009.
Company data
52-week range (MXN) 1825 - 7800 Mkt cap. (US$MM) 1,000 Avg daily value (US$MM) 1.45 Index JCI Free float (%) 32.5% Source: Bloomberg, J.P. Morgan.
Auditor: KPMG Ratings: n/a
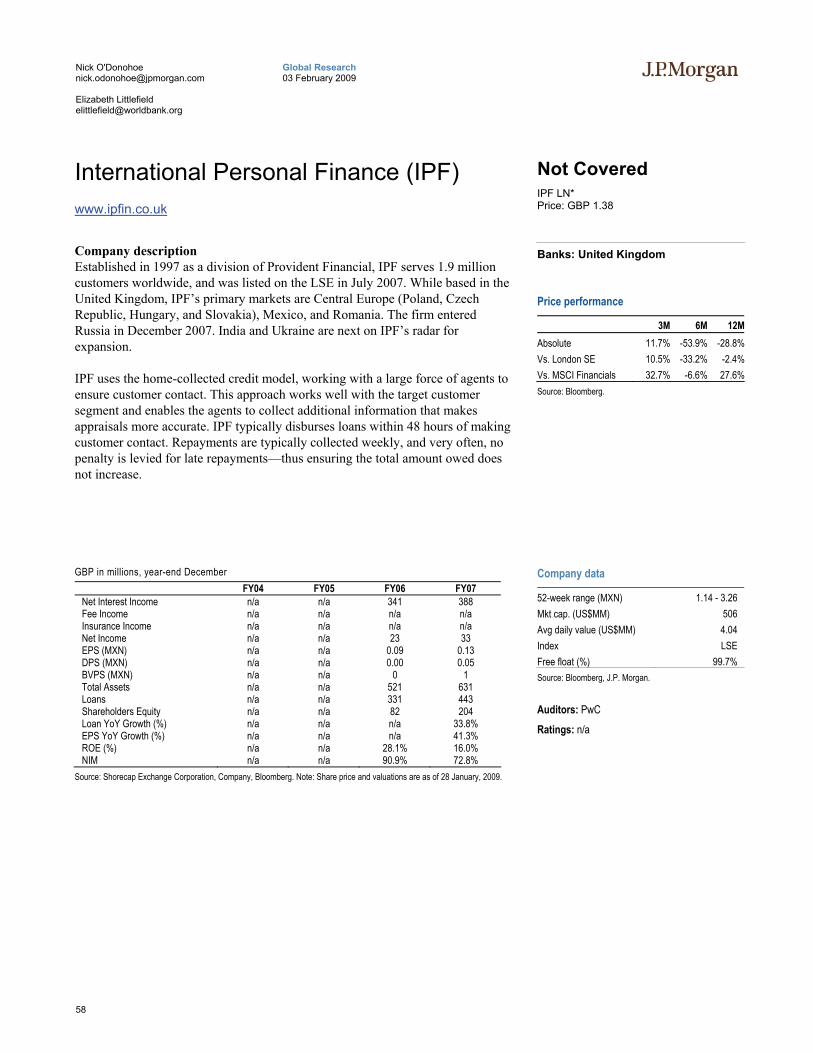
58
Global Research 03 February 2009
Nick O'Donohoe [email protected] Elizabeth Littlefield [email protected]
International Personal Finance (IPF) www.ipfin.co.uk
Not Covered IPF LN* Price: GBP 1.38
Company description Established in 1997 as a division of Provident Financial, IPF serves 1.9 million customers worldwide, and was listed on the LSE in July 2007. While based in the United Kingdom, IPF’s primary markets are Central Europe (Poland, Czech Republic, Hungary, and Slovakia), Mexico, and Romania. The firm entered Russia in December 2007. India and Ukraine are next on IPF’s radar for expansion.
IPF uses the home-collected credit model, working with a large force of agents to ensure customer contact. This approach works well with the target customer segment and enables the agents to collect additional information that makes appraisals more accurate. IPF typically disburses loans within 48 hours of making customer contact. Repayments are typically collected weekly, and very often, no penalty is levied for late repayments—thus ensuring the total amount owed does not increase.
Banks: United Kingdom
Price performance
3M 6M 12MAbsolute 11.7% -53.9% -28.8%Vs. London SE 10.5% -33.2% -2.4%Vs. MSCI Financials 32.7% -6.6% 27.6%Source: Bloomberg.
GBP in millions, year-end December FY04 FY05 FY06 FY07
Net Interest Income n/a n/a 341 388 Fee Income n/a n/a n/a n/a Insurance Income n/a n/a n/a n/a Net Income n/a n/a 23 33 EPS (MXN) n/a n/a 0.09 0.13 DPS (MXN) n/a n/a 0.00 0.05 BVPS (MXN) n/a n/a 0 1 Total Assets n/a n/a 521 631 Loans n/a n/a 331 443 Shareholders Equity n/a n/a 82 204 Loan YoY Growth (%) n/a n/a n/a 33.8% EPS YoY Growth (%) n/a n/a n/a 41.3% ROE (%) n/a n/a 28.1% 16.0% NIM n/a n/a 90.9% 72.8%
Source: Shorecap Exchange Corporation, Company, Bloomberg. Note: Share price and valuations are as of 28 January, 2009.
Company data
52-week range (MXN) 1.14 - 3.26 Mkt cap. (US$MM) 506 Avg daily value (US$MM) 4.04 Index LSE Free float (%) 99.7% Source: Bloomberg, J.P. Morgan.
Auditors: PwC Ratings: n/a
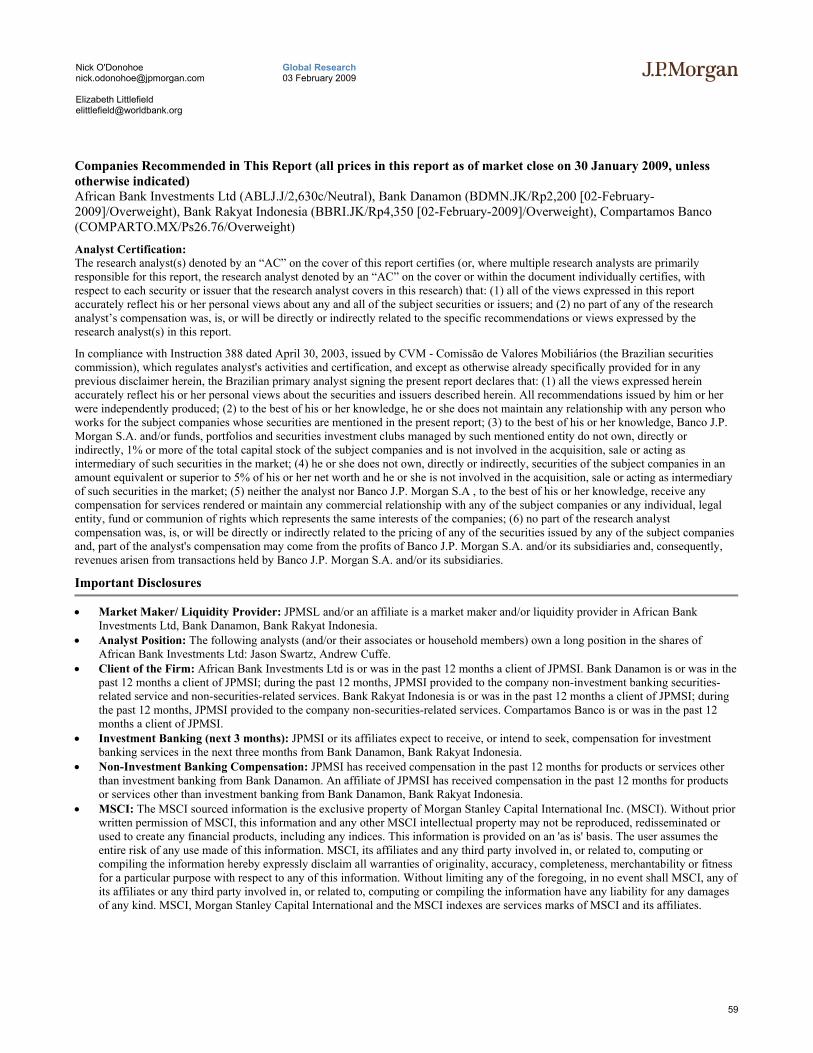
59
Global Research 03 February 2009
Nick O'Donohoe [email protected] Elizabeth Littlefield [email protected]
Companies Recommended in This Report (all prices in this report as of market close on 30 January 2009, unless otherwise indicated) African Bank Investments Ltd (ABLJ.J/2,630c/Neutral), Bank Danamon (BDMN.JK/Rp2,200 [02-February-2009]/Overweight), Bank Rakyat Indonesia (BBRI.JK/Rp4,350 [02-February-2009]/Overweight), Compartamos Banco (COMPARTO.MX/Ps26.76/Overweight)
Analyst Certification: The research analyst(s) denoted by an “AC” on the cover of this report certifies (or, where multiple research analysts are primarily responsible for this report, the research analyst denoted by an “AC” on the cover or within the document individually certifies, with respect to each security or issuer that the research analyst covers in this research) that: (1) all of the views expressed in this report accurately reflect his or her personal views about any and all of the subject securities or issuers; and (2) no part of any of the research analyst’s compensation was, is, or will be directly or indirectly related to the specific recommendations or views expressed by the research analyst(s) in this report.
In compliance with Instruction 388 dated April 30, 2003, issued by CVM - Comissão de Valores Mobiliários (the Brazilian securities commission), which regulates analyst's activities and certification, and except as otherwise already specifically provided for in any previous disclaimer herein, the Brazilian primary analyst signing the present report declares that: (1) all the views expressed herein accurately reflect his or her personal views about the securities and issuers described herein. All recommendations issued by him or her were independently produced; (2) to the best of his or her knowledge, he or she does not maintain any relationship with any person who works for the subject companies whose securities are mentioned in the present report; (3) to the best of his or her knowledge, Banco J.P. Morgan S.A. and/or funds, portfolios and securities investment clubs managed by such mentioned entity do not own, directly or indirectly, 1% or more of the total capital stock of the subject companies and is not involved in the acquisition, sale or acting as intermediary of such securities in the market; (4) he or she does not own, directly or indirectly, securities of the subject companies in an amount equivalent or superior to 5% of his or her net worth and he or she is not involved in the acquisition, sale or acting as intermediary of such securities in the market; (5) neither the analyst nor Banco J.P. Morgan S.A , to the best of his or her knowledge, receive any compensation for services rendered or maintain any commercial relationship with any of the subject companies or any individual, legal entity, fund or communion of rights which represents the same interests of the companies; (6) no part of the research analyst compensation was, is, or will be directly or indirectly related to the pricing of any of the securities issued by any of the subject companies and, part of the analyst's compensation may come from the profits of Banco J.P. Morgan S.A. and/or its subsidiaries and, consequently, revenues arisen from transactions held by Banco J.P. Morgan S.A. and/or its subsidiaries.
Important Disclosures
• Market Maker/ Liquidity Provider: JPMSL and/or an affiliate is a market maker and/or liquidity provider in African Bank Investments Ltd, Bank Danamon, Bank Rakyat Indonesia.
• Analyst Position: The following analysts (and/or their associates or household members) own a long position in the shares of African Bank Investments Ltd: Jason Swartz, Andrew Cuffe.
• Client of the Firm: African Bank Investments Ltd is or was in the past 12 months a client of JPMSI. Bank Danamon is or was in the past 12 months a client of JPMSI; during the past 12 months, JPMSI provided to the company non-investment banking securities-related service and non-securities-related services. Bank Rakyat Indonesia is or was in the past 12 months a client of JPMSI; during the past 12 months, JPMSI provided to the company non-securities-related services. Compartamos Banco is or was in the past 12 months a client of JPMSI.
• Investment Banking (next 3 months): JPMSI or its affiliates expect to receive, or intend to seek, compensation for investment banking services in the next three months from Bank Danamon, Bank Rakyat Indonesia.
• Non-Investment Banking Compensation: JPMSI has received compensation in the past 12 months for products or services other than investment banking from Bank Danamon. An affiliate of JPMSI has received compensation in the past 12 months for products or services other than investment banking from Bank Danamon, Bank Rakyat Indonesia.
• MSCI: The MSCI sourced information is the exclusive property of Morgan Stanley Capital International Inc. (MSCI). Without prior written permission of MSCI, this information and any other MSCI intellectual property may not be reproduced, redisseminated or used to create any financial products, including any indices. This information is provided on an 'as is' basis. The user assumes the entire risk of any use made of this information. MSCI, its affiliates and any third party involved in, or related to, computing or compiling the information hereby expressly disclaim all warranties of originality, accuracy, completeness, merchantability or fitness for a particular purpose with respect to any of this information. Without limiting any of the foregoing, in no event shall MSCI, any of its affiliates or any third party involved in, or related to, computing or compiling the information have any liability for any damages of any kind. MSCI, Morgan Stanley Capital International and the MSCI indexes are services marks of MSCI and its affiliates.
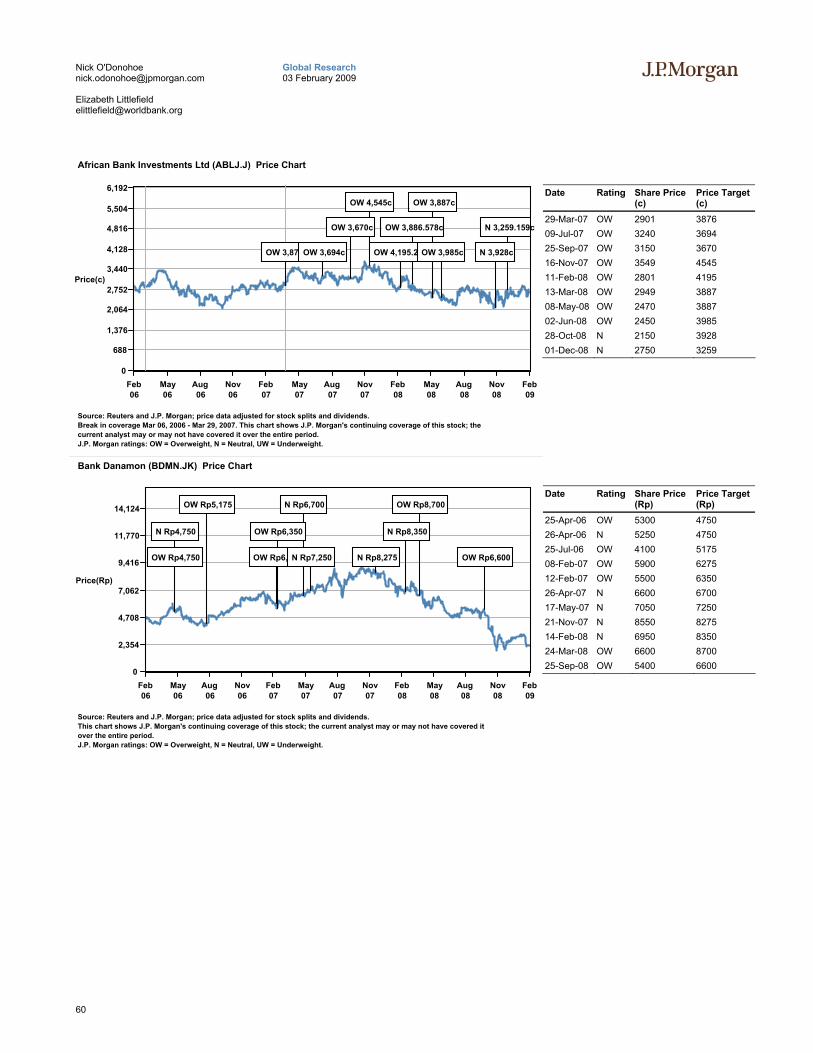
60
Global Research 03 February 2009
Nick O'Donohoe [email protected] Elizabeth Littlefield [email protected]
0
688
1,376
2,064
2,752
3,440
4,128
4,816
5,504
6,192
Price(c)
Feb06
May06
Aug06
Nov06
Feb07
May07
Aug07
Nov07
Feb08
May08
Aug08
Nov08
Feb09
African Bank Investments Ltd (ABLJ.J) Price Chart
OW 4,545c OW 3,887c
OW 3,670c OW 3,886.578c N 3,259.159c
OW 3,876cOW 3,694c OW 4,195.205cOW 3,985c N 3,928c
Source: Reuters and J.P. Morgan; price data adjusted for stock splits and dividends.Break in coverage Mar 06, 2006 - Mar 29, 2007. This chart shows J.P. Morgan's continuing coverage of this stock; thecurrent analyst may or may not have covered it over the entire period.J.P. Morgan ratings: OW = Overweight, N = Neutral, UW = Underweight.
Date Rating Share Price (c)
Price Target (c)
29-Mar-07 OW 2901 3876 09-Jul-07 OW 3240 3694 25-Sep-07 OW 3150 3670 16-Nov-07 OW 3549 4545 11-Feb-08 OW 2801 4195 13-Mar-08 OW 2949 3887 08-May-08 OW 2470 3887 02-Jun-08 OW 2450 3985 28-Oct-08 N 2150 3928 01-Dec-08 N 2750 3259
0
2,354
4,708
7,062
9,416
11,770
14,124
Price(Rp)
Feb06
May06
Aug06
Nov06
Feb07
May07
Aug07
Nov07
Feb08
May08
Aug08
Nov08
Feb09
Bank Danamon (BDMN.JK) Price Chart
OW Rp5,175 N Rp6,700 OW Rp8,700
N Rp4,750 OW Rp6,350 N Rp8,350
OW Rp4,750 OW Rp6,275N Rp7,250 N Rp8,275 OW Rp6,600
Source: Reuters and J.P. Morgan; price data adjusted for stock splits and dividends.This chart shows J.P. Morgan's continuing coverage of this stock; the current analyst may or may not have covered itover the entire period.J.P. Morgan ratings: OW = Overweight, N = Neutral, UW = Underweight.
Date Rating Share Price (Rp)
Price Target (Rp)
25-Apr-06 OW 5300 4750 26-Apr-06 N 5250 4750 25-Jul-06 OW 4100 5175 08-Feb-07 OW 5900 6275 12-Feb-07 OW 5500 6350 26-Apr-07 N 6600 6700 17-May-07 N 7050 7250 21-Nov-07 N 8550 8275 14-Feb-08 N 6950 8350 24-Mar-08 OW 6600 8700 25-Sep-08 OW 5400 6600
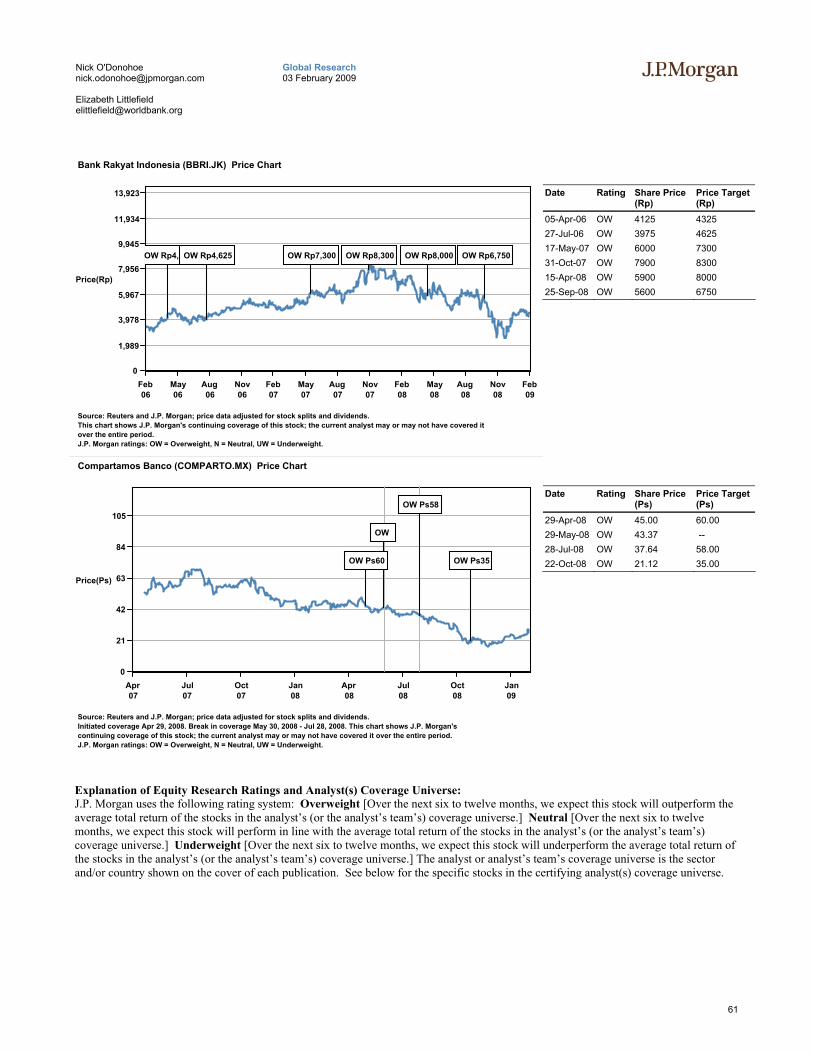
61
Global Research 03 February 2009
Nick O'Donohoe [email protected] Elizabeth Littlefield [email protected]
0
1,989
3,978
5,967
7,956
9,945
11,934
13,923
Price(Rp)
Feb06
May06
Aug06
Nov06
Feb07
May07
Aug07
Nov07
Feb08
May08
Aug08
Nov08
Feb09
Bank Rakyat Indonesia (BBRI.JK) Price Chart
OW Rp4,325OW Rp4,625 OW Rp7,300 OW Rp8,300 OW Rp8,000 OW Rp6,750
Source: Reuters and J.P. Morgan; price data adjusted for stock splits and dividends.This chart shows J.P. Morgan's continuing coverage of this stock; the current analyst may or may not have covered itover the entire period.J.P. Morgan ratings: OW = Overweight, N = Neutral, UW = Underweight.
Date Rating Share Price (Rp)
Price Target (Rp)
05-Apr-06 OW 4125 4325 27-Jul-06 OW 3975 4625 17-May-07 OW 6000 7300 31-Oct-07 OW 7900 8300 15-Apr-08 OW 5900 8000 25-Sep-08 OW 5600 6750
0
21
42
63
84
105
Price(Ps)
Apr07
Jul07
Oct07
Jan08
Apr08
Jul08
Oct08
Jan09
Compartamos Banco (COMPARTO.MX) Price Chart
OW Ps58
OW
OW Ps60 OW Ps35
Source: Reuters and J.P. Morgan; price data adjusted for stock splits and dividends.Initiated coverage Apr 29, 2008. Break in coverage May 30, 2008 - Jul 28, 2008. This chart shows J.P. Morgan'scontinuing coverage of this stock; the current analyst may or may not have covered it over the entire period.J.P. Morgan ratings: OW = Overweight, N = Neutral, UW = Underweight.
Date Rating Share Price (Ps)
Price Target (Ps)
29-Apr-08 OW 45.00 60.00 29-May-08 OW 43.37 -- 28-Jul-08 OW 37.64 58.00 22-Oct-08 OW 21.12 35.00
Explanation of Equity Research Ratings and Analyst(s) Coverage Universe: J.P. Morgan uses the following rating system: Overweight [Over the next six to twelve months, we expect this stock will outperform the average total return of the stocks in the analyst’s (or the analyst’s team’s) coverage universe.] Neutral [Over the next six to twelve months, we expect this stock will perform in line with the average total return of the stocks in the analyst’s (or the analyst’s team’s) coverage universe.] Underweight [Over the next six to twelve months, we expect this stock will underperform the average total return of the stocks in the analyst’s (or the analyst’s team’s) coverage universe.] The analyst or analyst’s team’s coverage universe is the sector and/or country shown on the cover of each publication. See below for the specific stocks in the certifying analyst(s) coverage universe.
62
Global Research 03 February 2009
Nick O'Donohoe [email protected] Elizabeth Littlefield [email protected]
J.P. Morgan Equity Research Ratings Distribution, as of December 31, 2008
Overweight (buy)
Neutral (hold)
Underweight (sell)
JPM Global Equity Research Coverage 38% 44% 18% IB clients* 54% 52% 43% JPMSI Equity Research Coverage 37% 49% 14% IB clients* 76% 71% 62%
*Percentage of investment banking clients in each rating category. For purposes only of NASD/NYSE ratings distribution rules, our Overweight rating falls into a buy rating category; our Neutral rating falls into a hold rating category; and our Underweight rating falls into a sell rating category.
Valuation and Risks: Please see the most recent company-specific research report for an analysis of valuation methodology and risks on any securities recommended herein. Research is available at http://www.morganmarkets.com , or you can contact the analyst named on the front of this note or your J.P. Morgan representative.
Analysts’ Compensation: The equity research analysts responsible for the preparation of this report receive compensation based upon various factors, including the quality and accuracy of research, client feedback, competitive factors, and overall firm revenues, which include revenues from, among other business units, Institutional Equities and Investment Banking.
Registration of non-US Analysts: Unless otherwise noted, the non-US analysts listed on the front of this report are employees of non-US affiliates of JPMSI, are not registered/qualified as research analysts under NASD/NYSE rules, may not be associated persons of JPMSI, and may not be subject to NASD Rule 2711 and NYSE Rule 472 restrictions on communications with covered companies, public appearances, and trading securities held by a research analyst account.
Other Disclosures
J.P. Morgan is the global brand name for J.P. Morgan Securities Inc. (JPMSI) and its non-US affiliates worldwide.
Options related research: If the information contained herein regards options related research, such information is available only to persons who have received the proper option risk disclosure documents. For a copy of the Option Clearing Corporation’s Characteristics and Risks of Standardized Options, please contact your J.P. Morgan Representative or visit the OCC’s website at http://www.optionsclearing.com/publications/risks/riskstoc.pdf.
Legal Entities Disclosures U.S.: JPMSI is a member of NYSE, FINRA and SIPC. J.P. Morgan Futures Inc. is a member of the NFA. JPMorgan Chase Bank, N.A. is a member of FDIC and is authorized and regulated in the UK by the Financial Services Authority. U.K.: J.P. Morgan Securities Ltd. (JPMSL) is a member of the London Stock Exchange and is authorised and regulated by the Financial Services Authority. Registered in England & Wales No. 2711006. Registered Office 125 London Wall, London EC2Y 5AJ. South Africa: J.P. Morgan Equities Limited is a member of the Johannesburg Securities Exchange and is regulated by the FSB. Hong Kong: J.P. Morgan Securities (Asia Pacific) Limited (CE number AAJ321) is regulated by the Hong Kong Monetary Authority and the Securities and Futures Commission in Hong Kong. Korea: J.P. Morgan Securities (Far East) Ltd, Seoul branch, is regulated by the Korea Financial Supervisory Service. Australia: J.P. Morgan Australia Limited (ABN 52 002 888 011/AFS Licence No: 238188) is regulated by ASIC and J.P. Morgan Securities Australia Limited (ABN 61 003 245 234/AFS Licence No: 238066) is a Market Participant with the ASX and regulated by ASIC. Taiwan: J.P.Morgan Securities (Taiwan) Limited is a participant of the Taiwan Stock Exchange (company-type) and regulated by the Taiwan Securities and Futures Bureau. India: J.P. Morgan India Private Limited is a member of the National Stock Exchange of India Limited and Bombay Stock Exchange Limited and is regulated by the Securities and Exchange Board of India. Thailand: JPMorgan Securities (Thailand) Limited is a member of the Stock Exchange of Thailand and is regulated by the Ministry of Finance and the Securities and Exchange Commission. Indonesia: PT J.P. Morgan Securities Indonesia is a member of the Indonesia Stock Exchange and is regulated by the BAPEPAM. Philippines: J.P. Morgan Securities Philippines Inc. is a member of the Philippine Stock Exchange and is regulated by the Securities and Exchange Commission. Brazil: Banco J.P. Morgan S.A. is regulated by the Comissao de Valores Mobiliarios (CVM) and by the Central Bank of Brazil. Mexico: J.P. Morgan Casa de Bolsa, S.A. de C.V., J.P. Morgan Grupo Financiero is a member of the Mexican Stock Exchange and authorized to act as a broker dealer by the National Banking and Securities Exchange Commission. Singapore: This material is issued and distributed in Singapore by J.P. Morgan Securities Singapore Private Limited (JPMSS) [MICA (P) 132/01/2009 and Co. Reg. No.: 199405335R] which is a member of the Singapore Exchange Securities Trading Limited and is regulated by the Monetary Authority of Singapore (MAS) and/or JPMorgan Chase Bank, N.A., Singapore branch (JPMCB Singapore) which is regulated by the MAS. Malaysia: This material is issued and distributed in Malaysia by JPMorgan Securities (Malaysia) Sdn Bhd (18146-X) which is a Participating Organization of Bursa Malaysia Berhad and a holder of Capital Markets Services License issued by the Securities Commission in Malaysia. Pakistan: J. P. Morgan Pakistan Broking (Pvt.) Ltd is a member of the Karachi Stock Exchange and regulated by the Securities and Exchange Commission of Pakistan. Saudi Arabia: J.P. Morgan Saudi Arabia Ltd. is authorised by the Capital Market Authority of the Kingdom of Saudi Arabia (CMA) to carry out dealing as an agent, arranging, advising and custody, with respect to securities business under licence number 35-07079 and its registered address is at 8th Floor, Al-Faisaliyah Tower, King Fahad Road, P.O. Box 51907, Riyadh 11553, Kingdom of Saudi Arabia.
63
Global Research 03 February 2009
Nick O'Donohoe [email protected] Elizabeth Littlefield [email protected]
Country and Region Specific Disclosures U.K. and European Economic Area (EEA): Unless specified to the contrary, issued and approved for distribution in the U.K. and the EEA by JPMSL. Investment research issued by JPMSL has been prepared in accordance with JPMSL's policies for managing conflicts of interest arising as a result of publication and distribution of investment research. Many European regulators require that a firm to establish, implement and maintain such a policy. This report has been issued in the U.K. only to persons of a kind described in Article 19 (5), 38, 47 and 49 of the Financial Services and Markets Act 2000 (Financial Promotion) Order 2005 (all such persons being referred to as "relevant persons"). This document must not be acted on or relied on by persons who are not relevant persons. Any investment or investment activity to which this document relates is only available to relevant persons and will be engaged in only with relevant persons. In other EEA countries, the report has been issued to persons regarded as professional investors (or equivalent) in their home jurisdiction. Australia: This material is issued and distributed by JPMSAL in Australia to “wholesale clients” only. JPMSAL does not issue or distribute this material to “retail clients.” The recipient of this material must not distribute it to any third party or outside Australia without the prior written consent of JPMSAL. For the purposes of this paragraph the terms “wholesale client” and “retail client” have the meanings given to them in section 761G of the Corporations Act 2001. Germany: This material is distributed in Germany by J.P. Morgan Securities Ltd., Frankfurt Branch and J.P.Morgan Chase Bank, N.A., Frankfurt Branch which are regulated by the Bundesanstalt für Finanzdienstleistungsaufsicht. Hong Kong: The 1% ownership disclosure as of the previous month end satisfies the requirements under Paragraph 16.5(a) of the Hong Kong Code of Conduct for persons licensed by or registered with the Securities and Futures Commission. (For research published within the first ten days of the month, the disclosure may be based on the month end data from two months’ prior.) J.P. Morgan Broking (Hong Kong) Limited is the liquidity provider for derivative warrants issued by J.P. Morgan International Derivatives Ltd and listed on The Stock Exchange of Hong Kong Limited. An updated list can be found on HKEx website: http://www.hkex.com.hk/prod/dw/Lp.htm. Japan: There is a risk that a loss may occur due to a change in the price of the shares in the case of share trading, and that a loss may occur due to the exchange rate in the case of foreign share trading. In the case of share trading, JPMorgan Securities Japan Co., Ltd., will be receiving a brokerage fee and consumption tax (shouhizei) calculated by multiplying the executed price by the commission rate which was individually agreed between JPMorgan Securities Japan Co., Ltd., and the customer in advance. Financial Instruments Firms: JPMorgan Securities Japan Co., Ltd., Kanto Local Finance Bureau (kinsho) No. 82 Participating Association / Japan Securities Dealers Association, The Financial Futures Association of Japan. Korea: This report may have been edited or contributed to from time to time by affiliates of J.P. Morgan Securities (Far East) Ltd, Seoul branch. Singapore: JPMSS and/or its affiliates may have a holding in any of the securities discussed in this report; for securities where the holding is 1% or greater, the specific holding is disclosed in the Important Disclosures section above. India: For private circulation only, not for sale. Pakistan: For private circulation only, not for sale. New Zealand: This material is issued and distributed by JPMSAL in New Zealand only to persons whose principal business is the investment of money or who, in the course of and for the purposes of their business, habitually invest money. JPMSAL does not issue or distribute this material to members of "the public" as determined in accordance with section 3 of the Securities Act 1978. The recipient of this material must not distribute it to any third party or outside New Zealand without the prior written consent of JPMSAL.
General: Additional information is available upon request. Information has been obtained from sources believed to be reliable but JPMorgan Chase & Co. or its affiliates and/or subsidiaries (collectively J.P. Morgan) do not warrant its completeness or accuracy except with respect to any disclosures relative to JPMSI and/or its affiliates and the analyst’s involvement with the issuer that is the subject of the research. All pricing is as of the close of market for the securities discussed, unless otherwise stated. Opinions and estimates constitute our judgment as of the date of this material and are subject to change without notice. Past performance is not indicative of future results. This material is not intended as an offer or solicitation for the purchase or sale of any financial instrument. The opinions and recommendations herein do not take into account individual client circumstances, objectives, or needs and are not intended as recommendations of particular securities, financial instruments or strategies to particular clients. The recipient of this report must make its own independent decisions regarding any securities or financial instruments mentioned herein. JPMSI distributes in the U.S. research published by non-U.S. affiliates and accepts responsibility for its contents. Periodic updates may be provided on companies/industries based on company specific developments or announcements, market conditions or any other publicly available information. Clients should contact analysts and execute transactions through a J.P. Morgan subsidiary or affiliate in their home jurisdiction unless governing law permits otherwise.
“Other Disclosures” last revised January 30, 2009.
Copyright 2009 JPMorgan Chase & Co. All rights reserved. This report or any portion hereof may not be reprinted, sold or redistributed without the written consent of J.P. Morgan.

64
Global Research 03 February 2009
Nick O'Donohoe [email protected] Elizabeth Littlefield [email protected]