Embed Size (px)
Citation preview

JPMORGAN CHASE BANK, NATIONAL ASSOCIATION (a wholly-owned subsidiary of JPMorgan Chase & Co.)
CONSOLIDATED FINANCIAL STATEMENTS For the quarterly period ended June 30, 2009

2
TABLE OF CONTENTS
For the quarterly period ended June 30, 2009
Page(s)
Consolidated Financial Statements – JPMorgan Chase Bank, National Association
Consolidated Statements of Income (unaudited) for the three and six months ended June 30, 2009 and 2008 ................ 3
Consolidated Balance Sheets (unaudited) at June 30, 2009, and December 31, 2008....................................................... 4
Consolidated Statements of Changes in Stockholder’s Equity and Comprehensive Income (unaudited) for the six months ended June 30, 2009 and 2008 ..................................................................................................................... 5
Consolidated Statements of Cash Flows (unaudited) for the six months ended June 30, 2009 and 2008 ......................... 6
Notes to Consolidated Financial Statements (unaudited) ............................................................................................ 7–73
Supplementary Information
Selected Quarterly Financial Data (unaudited)................................................................................................................ 74
Selected Annual Financial Data (unaudited) ................................................................................................................... 75
Glossary of Terms.................................................................................................................................................... 76–78

3
JPMORGAN CHASE BANK, NATIONAL ASSOCIATION (a wholly-own subsidiary of JPMorgan Chase & Co.)
CONSOLIDATED STATEMENTS OF INCOME (UNAUDITED)
Three months ended June 30, Six months ended June 30, (in millions) 2009 2008 2009 2008 Revenue Investment banking fees $ 1,057 $ 818 $ 1,796 $ 1,394 Principal transactions 1,931 1,779 5,035 4,254 Lending & deposit-related fees 1,765 1,103 3,448 2,134 Asset management, administration and commissions 2,270 2,503 4,405 5,034 Securities gains(a) 362 333 564 388 Mortgage fees and related income 694 693 2,270 1,217 Credit card income 1,025 831 2,067 1,664 Other income 330 269 605 616 Noninterest revenue 9,434 8,329 20,190 16,701
Interest income 12,497 13,253 26,135 27,587 Interest expense 2,653 6,288 5,828 14,039 Net interest income 9,844 6,965 20,307 13,548 Total net revenue 19,278 15,294 40,497 30,249 Provision for credit losses 5,799 2,533 11,877 6,271 Noninterest expense Compensation expense 5,188 5,277 11,134 8,725 Occupancy expense 814 594 1,598 1,179 Technology, communications and equipment expense 1,003 873 1,999 1,737 Professional & outside services 1,049 987 2,107 1,983 Marketing 152 135 295 285 Other expense 2,880 2,039 5,018 3,638 Amortization of intangibles 152 153 302 304 Merger costs 141 19 317 19 Total noninterest expense 11,379 10,077 22,770 17,870 Income before income tax expense 2,100 2,684 5,850 6,108 Income tax expense 644 674 1,891 1,878 Net income $ 1,456 $ 2,010 $ 3,959 $ 4,230 (a) Securities gains for the three and six months ended June 30, 2009, each included credit losses of $66 million, consisting of $676 million
of gross unrealized losses, net of $610 million recognized in other comprehensive income.
The Notes to Consolidated Financial Statements (unaudited) are an integral part of these statements.

4
JPMORGAN CHASE BANK, NATIONAL ASSOCIATION
(a wholly-own subsidiary of JPMorgan Chase & Co.) CONSOLIDATED BALANCE SHEETS (UNAUDITED)
June 30, December 31,(in millions, except share data) 2009 2008 Assets Cash and due from banks $ 24,279 $ 25,502 Deposits with banks 60,124 127,623 Federal funds sold and securities purchased under resale agreements (included $18,315 and $19,865 at fair value at
June 30, 2009, and December 31, 2008, respectively) 193,364 199,716 Securities borrowed (included $3,360 and $3,381 at fair value at June 30, 2009, and December 31, 2008,
respectively) 48,343 42,658 Trading assets (included assets pledged of $42,209 and $118,079 at June 30, 2009, and December 31, 2008,
respectively) 276,837 365,365 Securities (included $334,589 and $199,710 at fair value at June 30, 2009, and December 31, 2008,
respectively, and assets pledged of $105,594 and $26,376 at June 30, 2009, and December 31, 2008, respectively) 334,618 199,744
Loans (included $1,990 and $6,038 at fair value at June 30, 2009, and December 31, 2008, respectively) 596,605 662,312 Allowance for loan losses (21,995) (17,153)
Loans, net of allowance for loan losses 574,610 645,159
Accrued interest and accounts receivable 45,757 44,345 Premises and equipment 9,601 9,161 Goodwill 27,438 27,371 Other intangible assets:
Mortgage servicing rights 14,430 9,236 Purchased credit card relationships 122 128 All other intangibles 3,089 3,346
Other assets (included $1,450 and $1,780 at fair value at June 30, 2009, and December 31, 2008, respectively) 51,386 46,888
Total assets $ 1,663,998 $ 1,746,242 Liabilities Deposits (included $3,787 and $5,605 at fair value at June 30, 2009, and December 31, 2008, respectively) $ 974,480 $ 1,055,765 Federal funds purchased and securities loaned or sold under repurchase agreements (included $2,957 and $2,968 at
fair value at June 30, 2009, and December 31, 2008, respectively) 258,421 180,716 Other borrowed funds (included $1,098 and $2,714 at fair value at June 30, 2009, and December 31, 2008,
respectively) 52,673 94,953 Trading liabilities 102,267 142,409 Accounts payable and other liabilities (included the allowance for lending-related commitments
of $745 and $656 at June 30, 2009, and December 31, 2008, respectively, and $8 and zero at fair value at June 30, 2009, and December 31, 2008, respectively) 66,060 67,014
Beneficial interests issued by consolidated variable interest entities (included $1,185 and $1,364 at fair value at June 30, 2009, and December 31, 2008, respectively) 10,700 4,156
Long-term debt (included $31,490 and $34,924 at fair value at June 30, 2009, and December 31, 2008, respectively) 67,667 71,862
Junior subordinated deferrable interest debentures held by trusts that issued guaranteed capital debt securities 600 600 Total liabilities 1,532,868 1,617,475 Commitments and contingencies (see Note 24 of these Consolidated Financial Statements) Stockholder’s equity Preferred stock ($1 par value; authorized 15,000,000 shares at June 30, 2009, and December 31, 2008;
issued 0 shares at June 30, 2009, and December 31, 2008, respectively) — — Common stock ($12 par value; authorized 150,000,000 shares at June 30, 2009, and December 31, 2008; issued
148,761,243 shares at June 30, 2009, and December 31, 2008, respectively) 1,785 1,785 Capital surplus 78,031 77,254 Retained earnings 52,267 52,309 Accumulated other comprehensive income (loss) (953) (2,581) Total stockholder’s equity 131,130 128,767 Total liabilities and stockholder’s equity $ 1,663,998 $ 1,746,242
The Notes to Consolidated Financial Statements (unaudited) are an integral part of these statements.

5
JPMORGAN CHASE BANK, NATIONAL ASSOCIATION
(a wholly-own subsidiary of JPMorgan Chase & Co.) CONSOLIDATED STATEMENTS OF CHANGES IN STOCKHOLDER’S EQUITY
AND COMPREHENSIVE INCOME (UNAUDITED)
Six months ended June 30, (in millions) 2009 2008 Common stock Balance at January 1, and June 30 $ 1,785 $ 1,785 Capital surplus Balance at January 1 77,254 62,439 Cash capital contribution from JPMorgan Chase & Co. 604 1 Adjustments to capital due to transactions with JPMorgan Chase & Co. 173 68 Balance at June 30 78,031 62,508 Retained earnings Balance at January 1 52,309 42,808 Net income 3,959 4,230 Cash dividends paid to JPMorgan Chase & Co. (4,000) (1,000) Net legal entity mergers (1) — Balance at June 30 52,267 46,038 Accumulated other comprehensive income (loss) Balance at January 1 (2,581) (686) Other comprehensive income (loss) 1,628 (716) Balance at June 30 (953) (1,402) Total stockholder’s equity $ 131,130 $ 108,929 Comprehensive income Net income $ 3,959 $ 4,230 Other comprehensive income (loss) 1,628 (716) Comprehensive income $ 5,587 $ 3,514
The Notes to Consolidated Financial Statements (unaudited) are an integral part of these statements.

6
JPMORGAN CHASE BANK, NATIONAL ASSOCIATION
(a wholly-own subsidiary of JPMorgan Chase & Co.) CONSOLIDATED STATEMENTS OF CASH FLOWS (UNAUDITED)
Six months ended June 30, (in millions) 2009 2008 Operating activities Net income $ 3,959 $ 4,230 Adjustments to reconcile net income to net cash provided by (used in) operating activities:
Provision for credit losses 11,877 6,271 Depreciation and amortization 1,291 1,190 Amortization of intangibles 302 304 Deferred tax benefit (2,308) (1,099) Investment securities gains (564) (388)
Originations and purchases of loans held-for-sale (9,843) (21,269) Proceeds from sales, securitizations and paydowns of loans held-for-sale 15,787 22,589 Net change in:
Trading assets 117,585 8,137 Securities borrowed (5,704) (14,864) Accrued interest and accounts receivable (1,444) 300 Other assets 15,598 (12,991) Trading liabilities (57,263) (889) Accounts payable and other liabilities 796 (2,241)
Other operating adjustments (2,797) 1,730 Net cash provided by (used in) operating activities 87,272 (8,990) Investing activities Net change in:
Deposits with banks 67,456 (1,854) Federal funds sold and securities purchased under resale agreements 5,877 (15,910)
Held-to-maturity securities: Proceeds 5 5
Available-for-sale securities: Proceeds from maturities 46,747 21,078 Proceeds from sales 65,245 31,403 Purchases (242,832) (85,624)
Proceeds from sales and securitization of loans held-for-investment 21,973 8,838 Other changes in loans, net 33,613 (35,917) Net cash used in business acquisitions or dispositions (29) (174) Net maturities of asset-backed commercial paper guaranteed by the FRBB 130 — All other investing activities, net (918) (2,776) Net cash used in investing activities (2,733) (80,931) Financing activities Net change in:
Deposits (111,747) 39,682 Federal funds purchased and securities loaned or sold under repurchase agreements 77,797 57,880 Other borrowed funds (42,121) (7,602)
Proceeds from the issuance of long-term debt and trust-preferred capital debt securities 9,285 12,238 Repayments of long-term debt and trust-preferred capital debt securities (15,001) (19,653) Cash capital contribution from JPMorgan Chase & Co. 604 1 Cash dividends paid (4,000) (1,000) All other financing activities, net (681) 660 Net cash (used in) provided by financing activities (85,864) 82,206 Effect of exchange rate changes on cash and due from banks 102 244 Net (decrease) in cash and due from banks (1,223) (7,471) Cash and due from banks at the beginning of the year 25,502 38,696 Cash and due from banks at the end of the period $ 24,279 $ 31,225 Cash interest paid $ 5,187 $ 16,143 Cash income taxes paid 4,709 3,335
The Notes to Consolidated Financial Statements (unaudited) are an integral part of these statements.

7
See Glossary of Terms on pages 76–78 of these Consolidated Financial Statements for definitions of terms used throughout the Notes to Consolidated Financial Statements.
NOTES TO CONSOLIDATED FINANCIAL STATEMENTS (Unaudited)
NOTE 1 – BASIS OF PRESENTATION JPMorgan Chase Bank, National Association (“JPMorgan Chase Bank, N.A.”) is a wholly-owned bank subsidiary of JPMorgan Chase & Co. (“JPMorgan Chase”), which is a leading global financial services firm and one of the largest banking institutions in the United States of America (“U.S.”), with operations in more than 60 countries. JPMorgan Chase Bank, N.A. offers a wide range of banking services to its customers both domestically in the U.S. and internationally, including investment banking, financial services for consumers and businesses, financial transactions processing and asset management. Under the J.P. Morgan and Chase brands, JPMorgan Chase Bank, N.A. serves millions of customers in the U.S. and many of the world’s most prominent corporate, institutional and governmental clients.
JPMorgan Chase Bank, N.A. is chartered by the Office of the Comptroller of the Currency (“OCC”), a bureau of the United States Department of the Treasury. JPMorgan Chase Bank, N.A.’s main office is located in Columbus, Ohio, and it has branches in 23 states.
The accounting and financial reporting policies of JPMorgan Chase Bank, N.A. and its subsidiaries conform to accounting principles generally accepted in the United States of America (“U.S. GAAP”). Additionally, where applicable, the policies conform to the accounting and reporting guidelines prescribed by bank regulatory authorities. The unaudited consolidated financial statements prepared in conformity with U.S. GAAP require management to make estimates and assumptions that affect the reported amounts of assets, liabilities, revenue and expense, and the disclosures of contingent assets and liabilities. Actual results could be different from these estimates. In the opinion of management, all normal recurring adjustments have been included for a fair statement of this interim financial information. These unaudited consolidated financial statements should be read in conjunction with the audited consolidated financial statements and related notes thereto included in JPMorgan Chase Bank, N.A.’s Consolidated Financial Statements for the year ended December 31, 2008 (the “2008 Annual Financial Statements”).
Certain amounts in prior periods have been reclassified to conform to the current presentation.
NOTE 2 – ACCOUNTING AND REPORTING DEVELOPMENTS Business combinations/noncontrolling interests in consolidated financial statements In December 2007, the FASB issued SFAS 141R and SFAS 160, which amend the accounting and reporting of business combinations, as well as noncontrolling (i.e., minority) interests. For JPMorgan Chase Bank, N.A., SFAS 141R became effective for business combinations that close on or after January 1, 2009. SFAS 160 became effective for JPMorgan Chase Bank, N.A. for fiscal periods beginning January 1, 2009. In April 2009, the FASB issued FSP FAS 141(R)-1, which amends the accounting for contingencies acquired in a business combination.
SFAS 141R, as amended, will generally only impact the accounting for future business combinations and will impact certain aspects of business combination accounting, such as transaction costs and certain merger-related restructuring reserves, as well as the accounting for partial acquisitions where control is obtained by JPMorgan Chase Bank, N.A. One exception to the prospective application of SFAS 141R relates to accounting for income taxes associated with business combinations that closed prior to January 1, 2009. Once the purchase accounting measurement period closes for these acquisitions, any further adjustments to income taxes recorded as part of these business combinations will impact income tax expense. Previously, further adjustments were predominantly recorded as adjustments to goodwill.
SFAS 160 requires that noncontrolling interests be accounted for and presented as equity if material, rather than as a liability or mezzanine equity. SFAS 160’s presentation and disclosure requirements are to be applied retrospectively. The adoption of the reporting requirements of this pronouncement was not material to JPMorgan Chase Bank, N.A.’s Consolidated Balance Sheets or financial performance.
Accounting for transfers of financial assets and repurchase financing transactions In February 2008, the FASB issued FSP FAS 140-3, which requires an initial transfer of a financial asset and a repurchase financing that was entered into contemporaneously with, or in contemplation of, the initial transfer to be evaluated together as a linked transaction under SFAS 140, unless certain criteria are met. JPMorgan Chase Bank, N.A. adopted FSP FAS 140-3 on January 1, 2009, for new transactions entered into after the date of adoption. The adoption of FSP FAS 140-3 did not have a material impact on the Consolidated Balance Sheets or financial performance.

8
Disclosures about derivative instruments and hedging activities – FASB Statement No. 161 In March 2008, the FASB issued SFAS 161, which amends the disclosure requirements of SFAS 133. SFAS 161 requires increased disclosures about derivative instruments and hedging activities and their effects on an entity’s financial position, financial performance and cash flows. SFAS 161 is effective for fiscal years beginning after November 15, 2008. JPMorgan Chase Bank, N.A. adopted SFAS 161 on January 1, 2009. SFAS 161 only affected JPMorgan Chase Bank, N.A.’s disclosures of derivative instruments and related hedging activities, and not it’s Consolidated Balance Sheets, financial performance or Consolidated Statements of Cash Flows.
Determining whether an instrument (or embedded feature) is indexed to an entity’s own stock In September 2008, the EITF issued EITF 07-5, which establishes a two-step process for evaluating whether equity-linked financial instruments and embedded features are indexed to a company’s own stock for purposes of determining whether the derivative scope exception in SFAS 133 should be applied. EITF 07-5 is effective for fiscal years beginning after December 2008. The adoption of this EITF on January 1, 2009, did not have an impact on JPMorgan Chase Bank, N.A.’s Consolidated Balance Sheets or financial performance.
The recognition and presentation of other-than-temporary impairment In April 2009, the FASB issued FSP FAS 115-2 and FAS 124-2, which amends the other-than-temporary impairment model for debt securities. Under the FSP, an other-than-temporary-impairment must be recognized if an investor has the intent to sell the debt security or if it is more likely than not that it will be required to sell the debt security before recovery of its amortized cost basis. In addition, the FSP changes the amount of impairment to be recognized in current-period earnings when an investor does not have the intent to sell or if it is more likely than not that it will not be required to sell the debt security, as in these cases only the amount of the impairment associated with credit losses is recognized in income. The FSP also requires additional disclosures regarding the calculation of credit losses, as well as factors considered in reaching a conclusion that an investment is not other-than-temporarily impaired. The FSP is effective for interim and annual reporting periods ending after June 15, 2009, with early adoption permitted for periods ending after March 15, 2009. JPMorgan Chase Bank, N.A. elected to early adopt the FSP as of January 1, 2009. For additional information regarding the impact on JPMorgan Chase Bank, N.A. of the adoption of the FSP, see Note 12 on pages 38–43 of these Consolidated Financial Statements.
Determining fair value when the volume and level of activity for the asset or liability have significantly decreased, and identifying transactions that are not orderly In April 2009, the FASB issued FSP FAS 157-4. The FSP provides additional guidance for estimating fair value in accordance with SFAS 157 when the volume and level of activity for the asset or liability have significantly declined. The FSP also includes guidance on identifying circumstances that indicate a transaction is not orderly. The FSP is effective for interim and annual reporting periods ending after June 15, 2009, with early adoption permitted. JPMorgan Chase Bank, N.A. elected to early adopt the FSP in the first quarter of 2009. The application of the FSP did not have an impact on JPMorgan Chase Bank, N.A.’s Consolidated Balance Sheets or financial performance.
Interim disclosures about fair value of financial instruments In April 2009, the FASB issued FSP FAS 107-1 and APB 28-1. The FSP requires the SFAS 107 disclosures about the fair value of financial instruments to be presented in interim financial statements in addition to annual financial statements. The FSP is effective for interim reporting periods ending after June 15, 2009, with early adoption permitted for periods ending after March 15, 2009. JPMorgan Chase Bank, N.A. adopted the additional disclosure requirements for second quarter reporting.
Employers’ disclosures about postretirement benefit plan assets In December 2008, the FASB issued FSP FAS 132(R)-1, which requires more detailed disclosures about employers’ plan assets, including investment strategies, major categories of plan assets, concentrations of risk within plan assets, and valuation techniques used to measure the fair value of plan assets. This FSP is effective for fiscal years ending after December 15, 2009. JPMorgan Chase Bank, N.A. intends to adopt these additional disclosure requirements on the effective date.
Accounting for transfers of financial assets and consolidation of variable interest entities In June 2009, the FASB issued two new standards (SFAS 166 and SFAS 167), which amend the guidance of accounting for the transfers of financial assets and the consolidation of variable interest entities. SFAS 166 eliminates the concept of QSPEs and provides additional guidance with regard to accounting for transfers of financial assets. SFAS 167 changes the approach for determining the primary beneficiary of a VIE from a quantitative risk and reward model to a qualitative model, based on control and economics. Both standards are effective for annual reporting periods beginning after November 15, 2009, including all interim periods within the first annual reporting period. Upon adoption, all existing QSPEs must be evaluated for consolidation. Entities expected to be impacted include revolving securitization entities,

9
bank-administered asset-backed commercial paper conduits, and certain mortgage and consumer securitization entities. JPMorgan Chase Bank, N.A. is still assessing the potential impact of the standards. Subsequent events In May 2009, the FASB issued SFAS 165, which establishes general standards of accounting for and disclosure of events that occur after the balance sheet date but before financial statements are issued or are available to be issued. The statement is effective for interim or annual financial periods ending after June 15, 2009. JPMorgan Chase Bank, N.A. adopted the statement in the second quarter of 2009. The application of the statement did not have any impact on JPMorgan Chase Bank, N.A.’s Consolidated Balance Sheets or financial performance.
NOTE 3 – BUSINESS CHANGES AND DEVELOPMENTS Acquisition of the banking operations of Washington Mutual Bank Refer to Note 3 on pages 10–11 of JPMorgan Chase Bank, N.A.’s 2008 Annual Financial Statements for a discussion of JPMorgan Chase Bank, N.A.’s acquisition of the banking operations of Washington Mutual Bank (“Washington Mutual”) on September 25, 2008, including its purchase price and the allocation of the purchase price to the net assets acquired and the resulting extraordinary gain. The acquisition is being accounted for under the purchase method of accounting in accordance with SFAS 141. The total purchase price to complete the acquisition was $1.9 billion, which was allocated to the Washington Mutual assets acquired and liabilities assumed using their fair values as of September 25, 2008. The allocation of the purchase price may be modified through September 25, 2009, as more information is obtained about the fair value of assets acquired and liabilities assumed.
Unaudited pro forma condensed combined financial information reflecting the Washington Mutual transaction The following unaudited pro forma condensed combined financial information presents the results of operations of JPMorgan Chase Bank, N.A. as they may have appeared for the three and six months ended June 30, 2008, if the Washington Mutual transaction had been completed on January 1, 2008.
Three months ended Six months ended (in millions) June 30, 2008 June 30, 2008 Total net revenue $ 18,843 $ 37,313 Net income 71 329 The unaudited pro forma combined financial information is presented for illustrative purposes only and does not indicate the financial results of the combined company had the companies actually been combined as of January 1, 2008, nor is it indicative of the results of operations in future periods. Included in the unaudited pro forma combined financial information for the three and six months ended June 30, 2008, were pro forma adjustments to reflect the results of operations of Washington Mutual’s banking operations, considering the purchase accounting, valuation and accounting conformity adjustments related to the transaction. The amortization of purchase accounting adjustments to report interest-earnings assets acquired and interest-bearing liabilities assumed at current interest rates is reflected.
Merger with The Bear Stearns Companies Inc. Refer to Note 3 on pages 10–11 of JPMorgan Chase Bank, N.A.’s 2008 Annual Financial Statements for a discussion of the merger on May 30, 2008, of a wholly-owned subsidiary of JPMorgan Chase with The Bear Stearns Companies Inc. (“Bear Stearns”). The merger is being accounted for under the purchase method of accounting in accordance with SFAS 141. The total purchase price to complete the merger was $1.5 billion, which was allocated to the Bear Stearns assets acquired and liabilities assumed using their fair values as of April 8, 2008, and May 30, 2008. Additional information regarding the merger is provided in Note 2 on pages 125–127 of JPMorgan Chase’s Annual Report on Form 10-K for the year ended December 31, 2008, and Note 2 on pages 96–99 of JPMorgan Chase’s Quarterly Report on Form 10-Q for the quarterly period ended June 30, 2009.
Subsequent events JPMorgan Chase Bank, N.A. has performed an evaluation of events that have occurred subsequent to June 30, 2009, and through August 28, 2009 (the date of the issuance of these Consolidated Financial Statements). There have been no subsequent events that occurred during such period that would require disclosure in these Consolidated Financial Statements or would be required to be recognized in the Consolidated Financial Statements as of or for the three- and six-month periods ending June 30, 2009.
10
NOTE 4 – FAIR VALUE MEASUREMENT For a further discussion of JPMorgan Chase Bank, N.A.’s valuation methodologies for assets, liabilities and lending-related commitments measured at fair value and the SFAS 157 valuation hierarchy, see Note 5 on pages 13–24 of JPMorgan Chase Bank, N.A.’s 2008 Annual Financial Statements. During the first half of 2009, there were no material changes made to JPMorgan Chase Bank, N.A.’s valuation models. For a further discussion of the accounting for trading assets and liabilities, see Note 7 on pages 27–28 of JPMorgan Chase Bank, N.A.’s 2008 Annual Financial Statements.
The following table presents the financial instruments carried at fair value as of June 30, 2009, and December 31, 2008, by major product category and by the SFAS 157 valuation hierarchy. Assets and liabilities measured at fair value on a recurring basis Fair value hierarchy
June 30, 2009 (in millions) Level 1 Level 2 Level 3 FIN 39
netting(d) Total
fair value Federal funds sold and securities purchased under resale
agreements $ — $ 18,315 $ — $ — $ 18,315 Securities borrowed — 3,360 — — 3,360 Trading assets:
Debt instruments: Mortgage-backed securities:
U.S. government agencies(a) 2,009 — — — 2,009 Residential-nonagency — 545 208 — 753 Commercial-nonagency — 47 168 — 215
Total mortgage-backed securities 2,009 592 376 — 2,977 U.S. Treasury and government agencies(a) 5,049 12 — — 5,061 Obligations of U.S. states and municipalities — 1,022 300 — 1,322 Certificates of deposit, bankers’ acceptances and
commercial paper — 878 — — 878 Non-U.S. government debt securities 30,324 27,446 62 — 57,832 Corporate debt securities — 33,511 4,934 — 38,445 Loans — 15,732 13,158 — 28,890 Asset-backed securities — 1,085 6,462 — 7,547
Total debt instruments 37,382 80,278 25,292 — 142,952 Equity securities 44,401 1,161 224 — 45,786 Physical commodities(b) 984 2,121 — — 3,105 Other — 1,150 149 — 1,299
Total debt and equity instruments 82,767 84,710 25,665 — 193,142 Derivative receivables(c) 1,719 1,725,134 56,888 (1,700,046) 83,695
Total trading assets 84,486 1,809,844 82,553 (1,700,046) 276,837 Available-for-sale securities:
Mortgage-backed securities: U.S. government agencies(a) 176,701 3,738 — — 180,439 Residential-nonagency — 11,255 1,053 — 12,308 Commercial-nonagency — 4,235 — — 4,235
Total mortgage-backed securities 176,701 19,228 1,053 — 196,982 U.S. Treasury and government agencies(a) 606 33,982 — — 34,588 Obligations of U.S. states and municipalities — 3,136 — — 3,136 Certificates of deposit — 5,603 — — 5,603 Non-U.S. government debt securities 5,034 11,317 — — 16,351 Corporate debt securities 3,714 44,046 52 — 47,812 Asset-backed securities: —
Credit card receivables — 16,401 — — 16,401 Collateralized debt and loan obligations — 10 11,489 — 11,499 Other — 1,428 — — 1,428
Equity securities 689 48 52 — 789 Total available-for-sale securities 186,744 135,199 12,646 — 334,589
Loans — 1,285 705 — 1,990 Mortgage servicing rights — — 14,430 — 14,430 Other assets — — 1,450 — 1,450 Total assets measured at fair value on a recurring basis $ 271,230 $ 1,968,003 $ 111,784 $ (1,700,046) $ 650,971
11
Fair value hierarchy
June 30, 2009 (in millions) Level 1 Level 2 Level 3 FIN 39
netting(d) Total
fair value Deposits $ — $ 3,160 $ 627 $ — $ 3,787 Federal funds purchased and securities loaned or sold
under repurchase agreements — 2,957 — — 2,957 Other borrowed funds — 1,006 92 — 1,098
Trading liabilities: Debt and equity instruments 29,310 9,542 44 — 38,896 Derivative payables(c) 1,363 1,705,012 39,103 (1,682,107) 63,371
Total trading liabilities 30,673 1,714,554 39,147 (1,682,107) 102,267 Accounts payable and other liabilities — 4 4 — 8 Beneficial interests issued by consolidated VIEs — 157 1,028 — 1,185 Long-term debt — 17,094 14,396 — 31,490 Total liabilities measured at fair value on a
recurring basis $ 30,673 $ 1,738,932 $ 55,294 $ (1,682,107) $ 142,792
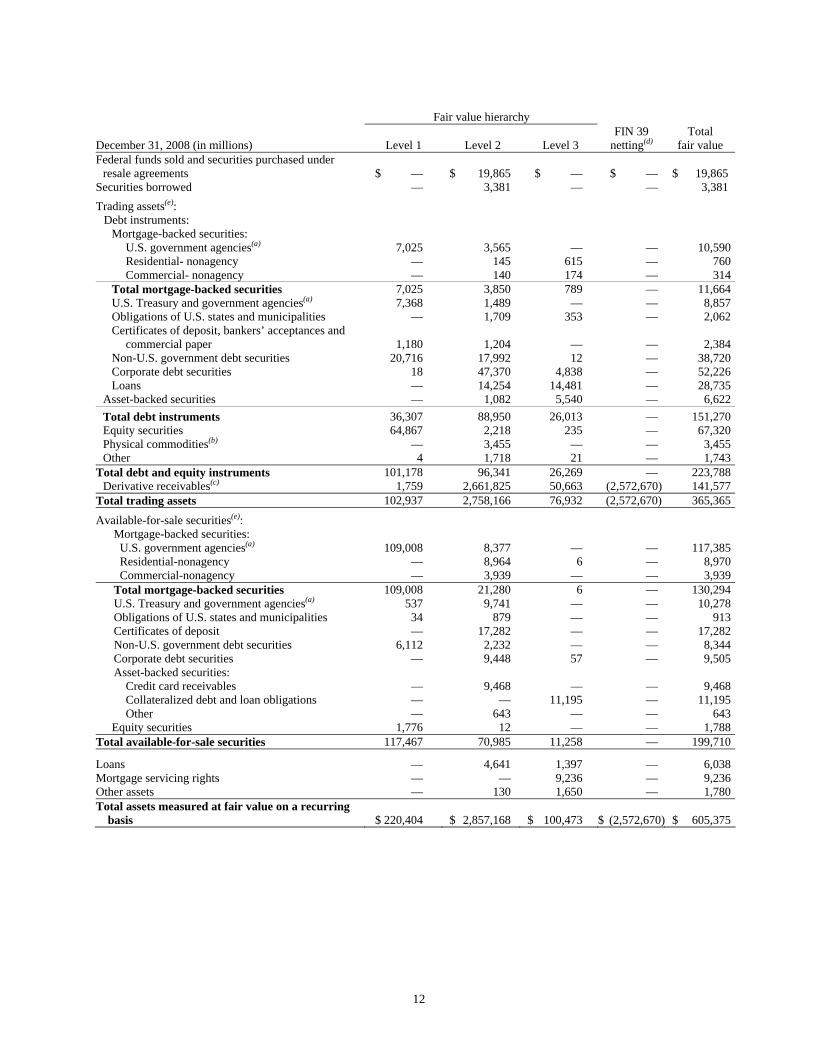
12
Fair value hierarchy
December 31, 2008 (in millions) Level 1 Level 2 Level 3 FIN 39
netting(d) Total
fair value Federal funds sold and securities purchased under
resale agreements $ — $ 19,865 $ — $ — $ 19,865 Securities borrowed — 3,381 — — 3,381 Trading assets(e):
Debt instruments: Mortgage-backed securities:
U.S. government agencies(a) 7,025 3,565 — — 10,590Residential- nonagency — 145 615 — 760Commercial- nonagency — 140 174 — 314
Total mortgage-backed securities 7,025 3,850 789 — 11,664U.S. Treasury and government agencies(a) 7,368 1,489 — — 8,857Obligations of U.S. states and municipalities — 1,709 353 — 2,062Certificates of deposit, bankers’ acceptances and
commercial paper 1,180 1,204 — — 2,384Non-U.S. government debt securities 20,716 17,992 12 — 38,720Corporate debt securities 18 47,370 4,838 — 52,226Loans — 14,254 14,481 — 28,735
Asset-backed securities — 1,082 5,540 — 6,622Total debt instruments 36,307 88,950 26,013 — 151,270Equity securities 64,867 2,218 235 — 67,320Physical commodities(b) — 3,455 — — 3,455Other 4 1,718 21 — 1,743
Total debt and equity instruments 101,178 96,341 26,269 — 223,788Derivative receivables(c) 1,759 2,661,825 50,663 (2,572,670) 141,577
Total trading assets 102,937 2,758,166 76,932 (2,572,670) 365,365
Available-for-sale securities(e): Mortgage-backed securities: U.S. government agencies(a) 109,008 8,377 — — 117,385 Residential-nonagency — 8,964 6 — 8,970 Commercial-nonagency — 3,939 — — 3,939Total mortgage-backed securities 109,008 21,280 6 — 130,294U.S. Treasury and government agencies(a) 537 9,741 — — 10,278Obligations of U.S. states and municipalities 34 879 — — 913Certificates of deposit — 17,282 — — 17,282Non-U.S. government debt securities 6,112 2,232 — — 8,344Corporate debt securities — 9,448 57 — 9,505Asset-backed securities:
Credit card receivables — 9,468 — — 9,468Collateralized debt and loan obligations — — 11,195 — 11,195Other — 643 — — 643
Equity securities 1,776 12 — — 1,788Total available-for-sale securities 117,467 70,985 11,258 — 199,710
Loans — 4,641 1,397 — 6,038Mortgage servicing rights — — 9,236 — 9,236Other assets — 130 1,650 — 1,780Total assets measured at fair value on a recurring
basis $ 220,404 $ 2,857,168 $ 100,473 $ (2,572,670) $ 605,375

13
Fair value hierarchy
December 31, 2008 (in millions) Level 1 Level 2 Level 3 FIN 39
netting(d) Total
fair value Deposits $ — $ 4,370 $ 1,235 $ — $ 5,605 Federal funds purchased and securities loaned
or sold under repurchase agreements — 2,968 — — 2,968 Other borrowed funds — 2,658 56 — 2,714
Trading liabilities: Debt and equity instruments 21,595 9,030 287 — 30,912 Derivative payables(c) 1,211 2,610,277 41,731 (2,541,722) 111,497
Total trading liabilities 22,806 2,619,307 42,018 (2,541,722) 142,409 Accounts payable and other liabilities — — — — — Beneficial interests issued by consolidated VIEs — 1,364 — — 1,364 Long-term debt — 20,399 14,525 — 34,924 Total liabilities measured at fair value on a
recurring basis $ 22,806 $ 2,651,066 $ 57,834 $(2,541,722) $ 189,984 (a) Includes total U.S. government-sponsored enterprise obligations of $174.9 billion and $130.6 billion at June 30, 2009, and December
31, 2008, respectively, which were predominantly mortgage-related. (b) Physical commodities inventories are accounted for at the lower of cost or fair value. (c) Derivative receivables and derivative payables balances are presented net on the Consolidated Balance Sheets where there is a legally
enforceable master netting agreement in place with counterparties. For purposes of the table above, JPMorgan Chase Bank, N.A. does not reduce the derivative receivables and derivative payables balances for this netting adjustment, either within or across the levels of the fair value hierarchy, as such netting is not relevant to a presentation that is based on the transparency of inputs to the valuation of an asset or liability. Therefore, the balances reported in the fair value hierarchy table are gross of any counterparty netting adjustments. However, if JPMorgan Chase Bank, N.A. were to net such balances, the reduction in the level 3 derivative receivables and derivative payables balances would be $20.2 billion at June 30, 2009
(d) As permitted under FIN 39, JPMorgan Chase Bank, N.A. has elected to net derivative receivables and derivative payables and the related cash collateral received and paid when a legally enforceable master netting agreement exists.
(e) Prior periods have been revised to conform to the current presentation. Changes in level 3 recurring fair value measurements The following tables include a rollforward of the balance sheet amounts for the three and six months ended June 30, 2009 and 2008 (including changes in fair value), for financial instruments classified by JPMorgan Chase Bank, N.A. within level 3 of the valuation hierarchy. When a determination is made to classify a financial instrument within level 3, the determination is based on the significance of the unobservable parameters to the overall fair value measurement. However, level 3 financial instruments typically include, in addition to the unobservable or level 3 components, observable components (that is, components that are actively quoted and can be validated to external sources); accordingly, the gains and losses in the table below include changes in fair value due in part to observable factors that are part of the valuation methodology. Also, JPMorgan Chase Bank, N.A. risk manages the observable components of level 3 financial instruments using securities and derivative positions that are classified within level 1 or 2 of the valuation hierarchy; as these level 1 and level 2 risk management instruments are not included below, the gains or losses in the following tables do not reflect the effect of JPMorgan Chase Bank, N.A.’s risk management activities related to such level 3 instruments.

14
Fair value measurements using significant unobservable inputs
Three months ended June 30, 2009 (in millions)
Fair value, March 31,
2009
Total realized/
unrealized gains/(losses)
Purchases, issuances,
settlements, net
Transfers into and/or
out of level 3
Fair value, June 30,
2009
Change in unrealizedgains and (losses) related to financial instruments held at June 30, 2009
Assets: Trading assets:
Debt instruments: Mortgage-backed securities:
U.S. government agencies $ — $ — $ — $ — $ — $ — Residential-nonagency 221 20 (17) (16) 208 6 Commercial-nonagency 172 51 (56) 1 168 15
Total mortgage-backed securities 393 71 (73) (15) 376 21
Obligations of U.S. states and municipalities 293 10 (3) — 300 10
Non-U.S. government debt securities 77 9 (23) (1) 62 4
Corporate debt securities 5,468 72 (697) 91 4,934 49 Loans 13,059 383 (76) (208) 13,158 336
Asset-backed securities 5,278 827 421 (64) 6,462 721 Total debt instruments 24,568 1,372 (451) (197) 25,292 1,141 Equity securities 52 14 69 89 224 12 Other 53 9 51 36 149 10
Total debt and equity instruments 24,673 1,395(b)(c) (331) (72) 25,665 1,163(b)(c) Net derivative receivables 19,419 (6,472)(b) 932 3,906 17,785 (4,962)(b) Available-for-sale securities:
Asset-backed securities 10,632 765 92 — 11,489 766 Other 779 33 340 5 1,157 32
Total available-for-sale securities 11,411 798(d) 432 5 12,646 798(d)
Loans 1,882 (31)(b) (1,128) (18) 705 (67)(b) Mortgage servicing rights 10,486 3,798(c) 146 — 14,430 3,798(c) Other assets 1,685 (97)(e) (133) (5) 1,450 (99)(e) Liabilities(a): Deposits $ (928) $ (9)(b) $ 310 $ — $ (627) $ (9)(b) Other borrowed funds (5) (10)(b) (40) (37) (92) (7)(b) Trading liabilities: Debt and equity instruments (259) 16(b) 199 — (44) 20(b) Accounts payable and other liabilities (6) 2(b) — — (4) 4(b) Beneficial interests issued by consolidated VIEs — (160)(b) 122 (990) (1,028) (160)(b) Long-term debt (14,153) (864)(b) 619 2 (14,396) (1,016)(b)

15
Fair value measurements using significant unobservable inputs
Three months ended June 30, 2008 (in millions)
Fair value, March 31,
2008
Total realized/
unrealized gains/(losses)
Purchases, issuances,
settlements, net
Transfers into and/or
out of level 3
Fair value, June 30,
2008
Change in unrealizedgains and (losses) related to financial instruments held at June 30, 2008
Assets: Trading assets:
Debt and equity instruments $ 28,044 $ (431)(b)(c) $ 719 $ 2,792 $ 31,124 $ (806)(b)(c) Net derivative receivables 2,445 693(b) 2,482 211 5,831 (138)(b)
Available-for-sale securities 9 1(d) — — 10 2(d)
Loans 7,848 (86)(b) 29 (704) 7,087 (156)(b) Mortgage servicing rights 8,419 1,519(c) 992 — 10,930 1,519(c)
Other assets 790 (17)(e) 19 (25) 767 (38)(e) Liabilities: Deposits $ (1,279) $ (44)(b) $ (7) $ (50) $ (1,380) $ (45)(b) Other borrowed funds (101) (110)(b) 1 (39) (249) (23)(b) Trading liabilities:
Debt and equity instruments (727) 22(b) 3 — (702) (164)(b) Accounts payable and other
liabilities — — — — — — Beneficial interests issued by
consolidated VIEs (51) 22(b) — — (29) 22(b) Long-term debt (20,306) (404)(b) 661 (140) (20,189) (407)(b)

16
Fair value measurements using significant unobservable inputs
Six months ended June 30, 2009 (in millions)
Fair value, January 1,
2009
Total realized/
unrealized gains/(losses)
Purchases, issuances,
settlements, net
Transfers into and/or
out of level 3
Fair value, June 30,
2009
Change in unrealizedgains and (losses) related to financial instruments held at June 30, 2009
Assets: Trading assets:
Debt instruments: Mortgage-backed securities:
U.S. government agencies $ — $ — $ — $ — $ — $ — Residential-nonagency 615 12 (32) (387) 208 (23) Commercial-nonagency 174 53 (60) 1 168 31
Total mortgage-backed securities 789 65 (92) (386) 376 8 Obligations of U.S. states and
municipalities 353 (8) (45) — 300 (8) Non-U.S. government debt securities 12 34 (18) 34 62 2 Corporate debt securities 4,838 37 (3,225) 3,284 4,934 32 Loans 14,481 (771) (573) 21 13,158 (782) Asset-backed securities 5,540 732 292 (102) 6,462 634
Total debt instruments 26,013 89 (3,661) 2,851 25,292 (114) Equity securities 235 (74) (76) 139 224 11 Other 21 (3) 81 50 149 (2)
Total debt and equity instruments 26,269 12(b)(c) (3,656) 3,040 25,665 (105)(b)(c) Net derivative receivables 8,932 (6,205)(b) (685) 15,743 17,785 (5,998)(b) Available-for-sale securities:
Asset-backed securities 11,195 (133) 427 — 11,489 (320) Other 63 33 340 721 1,157 33
Total available-for-sale securities 11,258 (100)(d) 767 721 12,646 (287)(d)
Loans 1,397 (303)(b) (1,319) 930 705 (270)(b) Mortgage servicing rights 9,236 5,103(c) 91 — 14,430 5,103(c) Other assets 1,650 (262)(e) 45 17 1,450 (261)(e) Liabilities(a): Deposits $ (1,235) $ (23)(b) $ 693 $ (62) $ (627) $ (36)(b) Other borrowed funds (56) 74(b) (78) (32) (92) (5)(b) Trading liabilities: Debt and equity instruments (287) (46)(b) 286 3 (44) 13(b) Accounts payable and other liabilities — 4(b) (8) — (4) 4(b) Beneficial interests issued by consolidated VIEs — (160)(b) 122 (990) (1,028) (160)(b) Long-term debt (14,525) 9(b) 1,782 (1,662) (14,396) (303)(b)
17
Fair value measurements using significant unobservable inputs
Six months ended June 30, 2008 (in millions)
Fair value, January 1,
2008
Total realized/
unrealized gains/(losses)
Purchases, issuances,
settlements, net
Transfers into and/or
out of level 3
Fair value, June 30,
2008
Change in unrealizedgains and (losses) related to financial instruments held at June 30, 2008
Assets: Trading assets:
Debt and equity instruments $ 18,815 $ (372)(b)(c) $ 4,041 $ 8,640 $ 31,124 $ (439)(b)(c) Net derivative receivables 206 2,293(b) 2,801 531 5,831 416(b)
Available-for-sale securities 10 2(d) (2) — 10 2(d) Loans 7,797 (280)(b) 274 (704) 7,087 (221)(b) Mortgage servicing rights 8,632 887(c) 1,411 — 10,930 887(c) Other assets 797 3(e) (8) (25) 767 25(e) Liabilities(a): Deposits $ (1,228) $ (62)(b) $ (38) $ (52) $ (1,380) $ (69)(b) Other borrowed funds (101) (75)(b) (137) 64 (249) —(b) Trading liabilities:
Debt and equity instruments (480) (71)(b) (9) (142) (702) (253)(b) Accounts payable and other
liabilities (25) 25 — — — — Beneficial interests issued by
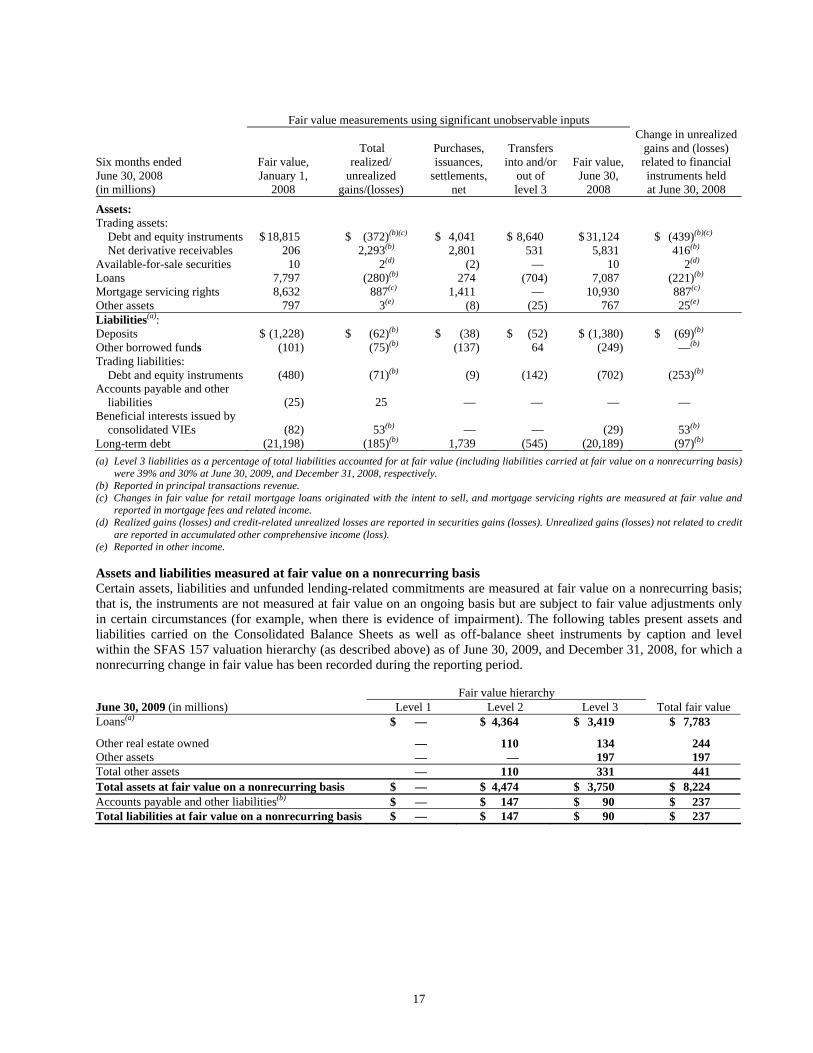
consolidated VIEs (82) 53(b) — — (29) 53(b) Long-term debt (21,198) (185)(b) 1,739 (545) (20,189) (97)(b) (a) Level 3 liabilities as a percentage of total liabilities accounted for at fair value (including liabilities carried at fair value on a nonrecurring basis)
were 39% and 30% at June 30, 2009, and December 31, 2008, respectively. (b) Reported in principal transactions revenue. (c) Changes in fair value for retail mortgage loans originated with the intent to sell, and mortgage servicing rights are measured at fair value and
reported in mortgage fees and related income. (d) Realized gains (losses) and credit-related unrealized losses are reported in securities gains (losses). Unrealized gains (losses) not related to credit
are reported in accumulated other comprehensive income (loss). (e) Reported in other income. Assets and liabilities measured at fair value on a nonrecurring basis Certain assets, liabilities and unfunded lending-related commitments are measured at fair value on a nonrecurring basis; that is, the instruments are not measured at fair value on an ongoing basis but are subject to fair value adjustments only in certain circumstances (for example, when there is evidence of impairment). The following tables present assets and liabilities carried on the Consolidated Balance Sheets as well as off-balance sheet instruments by caption and level within the SFAS 157 valuation hierarchy (as described above) as of June 30, 2009, and December 31, 2008, for which a nonrecurring change in fair value has been recorded during the reporting period. Fair value hierarchy June 30, 2009 (in millions) Level 1 Level 2 Level 3 Total fair value Loans(a) $ — $ 4,364 $ 3,419 $ 7,783
Other real estate owned — 110 134 244 Other assets — — 197 197 Total other assets — 110 331 441 Total assets at fair value on a nonrecurring basis $ — $ 4,474 $ 3,750 $ 8,224 Accounts payable and other liabilities(b) $ — $ 147 $ 90 $ 237 Total liabilities at fair value on a nonrecurring basis $ — $ 147 $ 90 $ 237
18
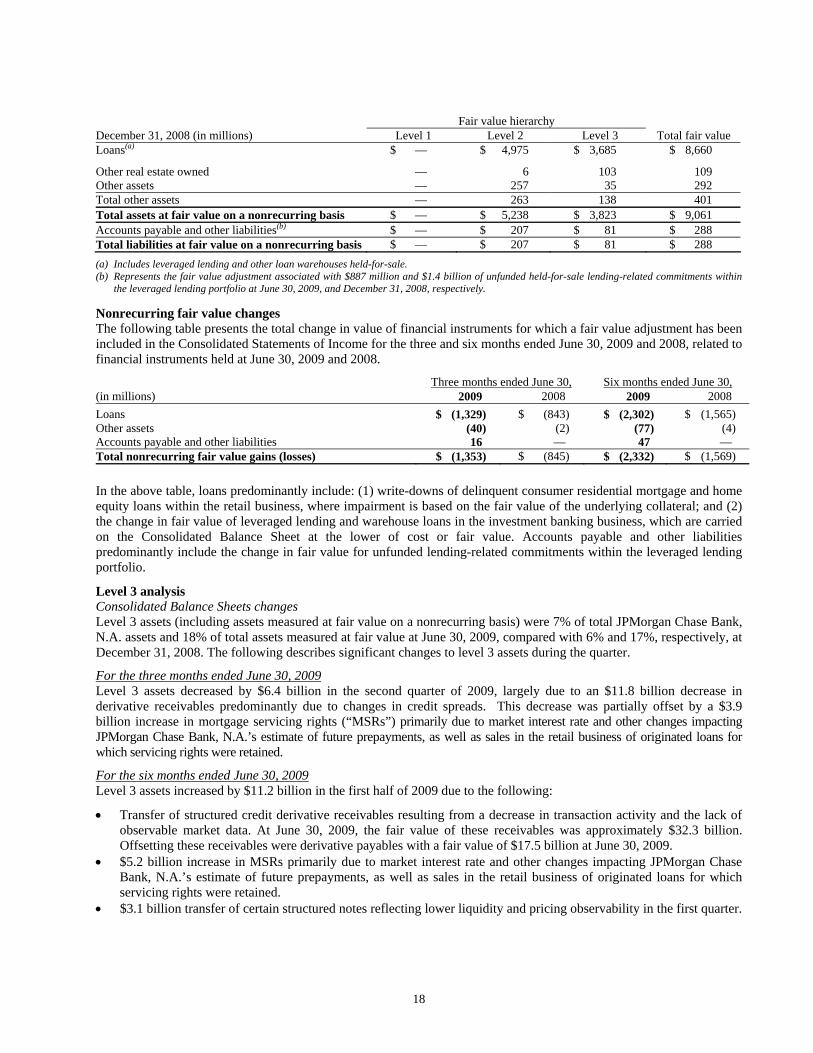
Fair value hierarchy December 31, 2008 (in millions) Level 1 Level 2 Level 3 Total fair value Loans(a) $ — $ 4,975 $ 3,685 $ 8,660
Other real estate owned — 6 103 109 Other assets — 257 35 292 Total other assets — 263 138 401 Total assets at fair value on a nonrecurring basis $ — $ 5,238 $ 3,823 $ 9,061 Accounts payable and other liabilities(b) $ — $ 207 $ 81 $ 288 Total liabilities at fair value on a nonrecurring basis $ — $ 207 $ 81 $ 288 (a) Includes leveraged lending and other loan warehouses held-for-sale. (b) Represents the fair value adjustment associated with $887 million and $1.4 billion of unfunded held-for-sale lending-related commitments within
the leveraged lending portfolio at June 30, 2009, and December 31, 2008, respectively. Nonrecurring fair value changes The following table presents the total change in value of financial instruments for which a fair value adjustment has been included in the Consolidated Statements of Income for the three and six months ended June 30, 2009 and 2008, related to financial instruments held at June 30, 2009 and 2008.
Three months ended June 30, Six months ended June 30, (in millions) 2009 2008 2009 2008 Loans $ (1,329) $ (843) $ (2,302) $ (1,565) Other assets (40) (2) (77) (4) Accounts payable and other liabilities 16 — 47 — Total nonrecurring fair value gains (losses) $ (1,353) $ (845) $ (2,332) $ (1,569) In the above table, loans predominantly include: (1) write-downs of delinquent consumer residential mortgage and home equity loans within the retail business, where impairment is based on the fair value of the underlying collateral; and (2) the change in fair value of leveraged lending and warehouse loans in the investment banking business, which are carried on the Consolidated Balance Sheet at the lower of cost or fair value. Accounts payable and other liabilities predominantly include the change in fair value for unfunded lending-related commitments within the leveraged lending portfolio.
Level 3 analysis Consolidated Balance Sheets changes Level 3 assets (including assets measured at fair value on a nonrecurring basis) were 7% of total JPMorgan Chase Bank, N.A. assets and 18% of total assets measured at fair value at June 30, 2009, compared with 6% and 17%, respectively, at December 31, 2008. The following describes significant changes to level 3 assets during the quarter.
For the three months ended June 30, 2009 Level 3 assets decreased by $6.4 billion in the second quarter of 2009, largely due to an $11.8 billion decrease in derivative receivables predominantly due to changes in credit spreads. This decrease was partially offset by a $3.9 billion increase in mortgage servicing rights (“MSRs”) primarily due to market interest rate and other changes impacting JPMorgan Chase Bank, N.A.’s estimate of future prepayments, as well as sales in the retail business of originated loans for which servicing rights were retained.
For the six months ended June 30, 2009 Level 3 assets increased by $11.2 billion in the first half of 2009 due to the following:
• Transfer of structured credit derivative receivables resulting from a decrease in transaction activity and the lack of observable market data. At June 30, 2009, the fair value of these receivables was approximately $32.3 billion. Offsetting these receivables were derivative payables with a fair value of $17.5 billion at June 30, 2009.
• $5.2 billion increase in MSRs primarily due to market interest rate and other changes impacting JPMorgan Chase Bank, N.A.’s estimate of future prepayments, as well as sales in the retail business of originated loans for which servicing rights were retained.
• $3.1 billion transfer of certain structured notes reflecting lower liquidity and pricing observability in the first quarter.

19
The increase in level 3 assets described above was partially offset by:
• $17.7 billion transfer of single-name CDS on ABS from level 3 to level 2, resulting from a decline in pricing uncertainty. The fair value of these assets is generally based on observable market data from third-party transactions, benchmarking to relevant indices such as the Asset-Backed Securities Index (“ABX”), and calibration to other available market information such as broker quotes.
• $11.2 billion of derivative receivables principally due to changes in credit spreads. • $3.6 billion related to sales of CDS positions on CMBS and RMBS. • $3.1 billion related to sales and unwinds of structured transactions with hedge funds. • $1.5 billion decrease in trading assets debt and equity, primarily in residential and commercial mortgage-backed
securities and loans, principally driven by markdowns and sales, partially offset by increases of $922 million in certain asset-backed securities.
Gains and Losses JPMorgan Chase Bank, N.A. risk manages level 3 financial instruments using securities and derivative positions classified within level 1 or 2 of the valuation hierarchy; the effect of these risk management activities is not reflected in the level 3 gains and losses included in the tables above.
Three months ended June 30, 2009 Included in the tables for the three months ended June 30, 2009 were gains and losses resulting from:
• $6.5 billion of net losses on derivatives primarily related to changes in credit spreads; • $864 million of losses related to structured note liabilities, primarily due to volatility in the equity markets; • $3.8 billion in gains on MSRs; • $1.4 billion in gains on trading debt and equity instruments, primarily from certain asset-backed securities.
Three months ended June 30, 2008 Included in the tables for the three months ended June 30, 2008 were gains and losses resulting from:
• $1.5 billion of gains on MSRs; • Net gains of approximately $690 million, principally related to fixed income and equity derivatives transactions; • $700 million of losses on leveraged loans. Leveraged loans are typically classified as held-for-sale and measured at
the lower of cost or fair value and therefore included in the nonrecurring fair value assets; • Losses of approximately $430 million on trading debt and equity instruments, principally from mortgage-related
transactions; • Net losses of approximately $400 million on equity-related structured notes.
Six months ended June 30, 2009 Included in the tables for the first six months of 2009 were gains and losses resulting from:
• $6.2 billion of net losses on derivatives primarily related to changes in credit spreads and changes in interest rates; • $808 million of losses on leveraged loans. Leveraged loans are primarily classified as held-for-sale and measured at
the lower of cost or fair value and therefore included in nonrecurring fair value assets; • $5.1 billion of gains on MSRs.

20
Six months ended June 30, 2008 Included in the tables for the first six months of 2008 were gains and losses resulting from:
• Net gains of approximately $2.3 billion related to fixed income and equity derivatives; • Gains of $887 million on MSRs; • Losses of approximately $1.6 billion on leveraged loans. Leveraged loans are typically classified as held-for-sale
and measured at the lower of cost or fair value and therefore included in the nonrecurring fair value assets; • Losses on trading debt and equity instruments of approximately $370 million, principally from mortgage-related
transactions.
For further information on changes in the fair value of the MSRs see Note 18 on pages 63–64 of these Consolidated Financial Statements.
Financial disclosures required by SFAS 107 Many, but not all, of the financial instruments held by JPMorgan Chase Bank, N.A. are recorded at fair value on the Consolidated Balance Sheets. SFAS 107 requires disclosure of the estimated fair value of certain financial instruments and the methods and significant assumptions used to estimate their fair value. Financial instruments within the scope of SFAS 107 are included in the following table. Additionally, certain financial instruments and all nonfinancial instruments are excluded from the scope of SFAS 107. Accordingly, the fair value disclosures required by SFAS 107 provide only a partial estimate of the fair value of JPMorgan Chase Bank, N.A. For example, JPMorgan Chase Bank, N.A. has developed long-term relationships with its customers through its deposit base and credit card accounts, commonly referred to as core deposit intangibles and credit card relationships. In the opinion of management, these items, in the aggregate, add significant value to JPMorgan Chase Bank, N.A., but their fair value is not disclosed in this Note.
Financial instruments for which carrying value approximates fair value Certain financial instruments that are not carried at fair value on the Consolidated Balance Sheets are carried at amounts that approximate fair value, due to their short-term nature and generally negligible credit risk. These instruments include cash and due from banks; deposits with banks, federal funds sold and securities purchased under resale agreements; and securities borrowed with short-dated maturities; short-term receivables and accrued interest receivable; commercial paper; federal funds purchased, and securities loaned or sold, under repurchase agreements with short-dated maturities; other borrowed funds (excluding advances from Federal Home Loan Banks); accounts payable; and accrued liabilities. In addition, SFAS 107 requires that the fair value for deposit liabilities with no stated maturity (i.e., demand, savings and certain money market deposits) be equal to their carrying value. SFAS 107 does not allow for the recognition of the inherent funding value of these instruments.

21
The following table presents the carrying value and estimated fair value of financial assets and liabilities as required by SFAS 107. June 30, 2009 December 31, 2008
(in billions) Carrying
value Estimatedfair value
Appreciation/(depreciation)
Carrying value
Estimated fair value
Appreciation/ (depreciation)
Financial assets Assets for which fair value approximates
carrying value $ 130.2 $ 130.2 $ — $ 197.4 $ 197.4 $ — Federal funds sold and securities purchased
under resale agreements (included $18.3 and $19.9 at fair value at June 30, 2009, and December 31, 2008, respectively) 193.4 193.4 — 199.7 199.7 —
Securities borrowed (included $3.4 at fair value at both June 30, 2009, and December 31, 2008) 48.3 48.3 — 42.7 42.7 —
Trading assets 276.8 276.8 — 365.4 365.4 — Securities 334.6 334.6 — 199.7 199.7 — Loans (included $2.0 and $6.0 at fair value at
June 30, 2009, and December 31, 2008, respectively) 574.6 554.8 (19.8) 645.2 620.4 (24.8)
Mortgage servicing rights at fair value 14.4 14.4 — 9.2 9.2 — Other (included $1.5 and $1.8 at fair value at
June 30, 2009, and December 31, 2008, respectively)(a) 34.3 34.1 (0.2) 33.5 33.7 0.2 Total financial assets $ 1,606.6 $ 1,586.6 $ (20.0) $ 1,692.8 $ 1,668.2 $ (24.6)
Financial liabilities Deposits (included $3.8 and $5.6 at fair value at
June 30, 2009, and December 31, 2008, respectively) $ 974.5 $ 975.3 $ (0.8) $ 1,055.8 $ 1,056.7 $ (0.9)
Federal funds purchased and securities loaned or sold under repurchase agreements (included $3.0 at fair value at both June 30, 2009, and December 31, 2008) 258.4 258.4 — 180.7 180.7 —
Other borrowed funds (included $1.1 and $2.7 at fair value at June 30, 2009, and December 31, 2008, respectively) 52.7 53.3 (0.6) 95.0 96.7 (1.7)
Trading liabilities 102.3 102.3 — 142.4 142.4 — Accounts payable and other liabilities(a) 52.1 52.1 — 54.5 54.5 — Beneficial interests issued by consolidated VIEs
(included $1.2 and $1.4 at fair value at June 30, 2009, and December 31, 2008, respectively) 10.7 10.7 — 4.2 4.1 0.1
Long-term debt and junior subordinated deferrable interest debentures (included $31.5 and $34.9 at fair value at June 30, 2009, and December 31, 2008, respectively) 68.3 63.5 4.8 72.5 66.4 6.1 Total financial liabilities $ 1,519.0 $ 1,515.6 $ 3.4 $ 1,605.1 $ 1,601.5 $ 3.6
Net (depreciation) appreciation $ (16.6) $ (21.0)
(a) Prior periods have been revised to conform to the current presentation.
The majority of JPMorgan Chase Bank, N.A.’s unfunded lending-related commitments is not carried at fair value on a recurring basis on the Consolidated Balance Sheets nor are they actively traded. The estimated fair values of JPMorgan Chase Bank, N.A.’s wholesale lending-related commitments at June 30, 2009, and December 31, 2008, were liabilities of $3.3 billion and $7.5 billion, respectively. JPMorgan Chase Bank, N.A. does not estimate the fair value of consumer lending-related commitments. In many cases, JPMorgan Chase Bank, N.A. can reduce or cancel these commitments by providing the borrower prior notice, or, in some cases, without notice as permitted by law.

22
Trading assets and liabilities average balances Average trading assets and liabilities were as follows for the periods indicated. Three months ended June 30, Six months ended June 30, (in millions) 2009 2008 2009 2008 Trading assets – debt and equity instruments $ 203,500 $ 281,431 $ 203,242 $ 293,097 Trading assets – derivative receivables 97,572 85,309 109,614 88,254
Trading liabilities – debt and equity instruments(a) $ 37,248 $ 57,150 $ 36,017 $ 64,654 Trading liabilities – derivative payables 71,945 71,857 78,401 76,512 (a) Primarily represent securities sold, not yet purchased.
NOTE 5 – FAIR VALUE OPTION For a discussion of the primary financial instruments for which fair value elections have been made, including the determination of instrument-specific credit risk for these items, and the basis for those elections, see Note 6 on pages 25–27 of JPMorgan Chase Bank, N.A.’s 2008 Annual Financial Statements. Changes in fair value under the fair value option election The following table presents the changes in fair value included in the Consolidated Statements of Income for the three and six months ended June 30, 2009 and 2008, for items for which the fair value election was made. The profit and loss information presented below only includes the financial instruments that were elected to be measured at fair value; related risk management instruments, which are required to be measured at fair value, are not included in the table.
Three months ended June 30, 2009 2008
(in millions) Principal
transactions(b) Other
income(b)
Total changes in fair value
recorded Principal
transactions(b) Other
income(b)
Total changes in fair value
recorded Federal funds sold and securities purchased
under resale agreements $ (254) $ — $ (254) $ (389) $ — $ (389) Securities borrowed (12) — (12) 79 — 79
Trading assets: Debt and equity instruments, excluding loans 151 20(c) 171 (157) 18(c) (139) Loans reported as trading assets:
Changes in instrument-specific credit risk 67 (115)(c) (48) (669) 2(c) (667) Other changes in fair value 919 495(c) 1,414 109 16(c) 125
Loans: Changes in instrument-specific credit risk (46) — (46) (51) — (51) Other changes in fair value 30 — 30 (5) — (5)
Other assets — (98)(d) (98) — (21)(d) (21)
Deposits(a) (21) — (21) 50 — 50 Federal funds purchased and securities loaned
or sold under repurchase agreements 60 — 60 70 — 70 Other borrowed funds(a) (66) — (66) 180 — 180 Trading liabilities (10) — (10) 3 — 3 Beneficial interests issued by consolidated VIEs (179) — (179) 205 — 205 Other liabilities 1 — 1 — — — Long-term debt:
Changes in instrument-specific credit risk(a) (894) — (894) 163 — 163 Other changes in fair value (2,032) — (2,032) 499 — 499

23
Six months ended June 30,
2009 2008
(in millions) Principal
transactions(b) Other
income(b)
Total changes in fair value
recorded Principal
transactions(b) Other
income(b)
Total changes in fair value
recorded Federal funds sold and securities purchased
under resale agreements $ (475) $ — $ (475) $ 149 $ — $ 149 Securities borrowed (19) — (19) 79 — 79
Trading assets: Debt and equity instruments, excluding loans 284 27(c) 311 1 13(c) 14 Loans reported as trading assets:
Changes in instrument-specific credit risk (209) (165)(c) (374) (1,452) (50)(c) (1,502) Other changes in fair value 659 1,432(c) 2,091 (20) 409(c) 389
Loans: Changes in instrument-specific credit risk (309) — (309) (294) — (294) Other changes in fair value 24 — 24 20 — 20
Other assets — (249)(d) (249) — (8)(d) (8)
Deposits(a) (186) — (186) (355) — (355) Federal funds purchased and securities loaned
or sold under repurchase agreements 92 — 92 3 — 3 Other borrowed funds(a) 200 — 200 135 — 135 Trading liabilities (13) — (13) 2 — 2 Beneficial interests issued by consolidated VIEs 36 — 36 65 — 65 Other liabilities — — — — — — Long-term debt:
Changes in instrument-specific credit risk(a) (248) — (248) 961 — 961 Other changes in fair value (1,369) — (1,369) 497 — 497
(a) Total changes in instrument-specific credit risk related to structured notes were $(956) million and $167 million for the three months ended June 30, 2009 and 2008, respectively, and $(316) million and $988 million for the six months ended June 30, 2009 and 2008, respectively. These totals include adjustments for structured notes classified within deposits and other borrowed funds, as well as long-term debt.
(b) Included in the amounts are gains and losses related to certain financial instruments previously carried at fair value by JPMorgan Chase Bank, N.A., such as structured liabilities elected pursuant to SFAS 155 and loans purchased as part of the trading activities of the investment banking business.
(c) Reported in mortgage fees and related income. (d) Reported in other income.

24
Difference between aggregate fair value and aggregate remaining contractual principal balance outstanding The following table reflects the difference between the aggregate fair value and the aggregate remaining contractual principal balance outstanding as of June 30, 2009, and December 31, 2008, for loans and long-term debt for which the SFAS 159 fair value option has been elected. The loans were classified in trading assets – debt and equity instruments or in loans. June 30, 2009 December 31, 2008
(in millions)
Contractual principal
outstanding Fair value
Fair value over (under) contractual principal
outstanding
Contractual principal
outstanding Fair value
Fair value over (under) contractual principal
outstanding Loans Performing loans 90 days or more past due
Loans reported as trading assets $ — $ — $ — $ — $ — $ — Loans — — — — — —
Nonaccrual loans Loans reported as trading assets 3,395 1,127 (2,268) 2,653 894 (1,759) Loans 332 142 (190) 22 10 (12)
Subtotal 3,727 1,269 (2,458) 2,675 904 (1,771) All other performing loans
Loans reported as trading assets 33,554 27,763 (5,791) 34,240 27,841 (6,399) Loans 2,631 1,848 (783) 7,189 6,028 (1,161)
Total loans $ 39,912 $ 30,880 $ (9,032) $ 44,104 $ 34,773 $ (9,331) Long-term debt Principal protected debt $ (11,807)(c) $ (11,443) $ (364) $ (10,411)(c) $ (10,377) $ (34) Nonprincipal protected debt(a) NA (20,047) NA NA (24,547) NA Total long-term debt NA $ (31,490) NA NA $ (34,924) NA Total FIN 46R long-term beneficial
interests(a)(b) NA $ (1,185) NA NA $ (1,364) NA (a) Remaining contractual principal is not applicable to nonprincipal-protected notes. Unlike principal-protected notes, for which JPMorgan Chase
Bank, N.A. is obligated to return a stated amount of principal at the maturity of the note, nonprincipal-protected notes do not obligate JPMorgan Chase Bank, N.A. to return a stated amount of principal at maturity, but to return an amount based on the performance of an underlying variable or derivative feature embedded in the note.
(b) Includes only nonprincipal protected debt at June 30, 2009, and December 31, 2008. (c) Where JPMorgan Chase Bank, N.A. issues principal-protected zero-coupon or discount notes, the balance reflected as the remaining contractual
principal is the final principal payment at maturity.
25
NOTE 6 – DERIVATIVE INSTRUMENTS Derivative instruments enable end-users to transform or mitigate exposure to credit or market risks. Counterparties to a derivative contract seek to obtain risks and rewards similar to those that could be obtained from purchasing or selling a related cash instrument without having to exchange the full purchase or sales price upfront. JPMorgan Chase Bank, N.A. makes markets in derivatives for customers and also uses derivatives to hedge or manage risks of market exposures. The majority of JPMorgan Chase Bank, N.A.’s derivatives are entered into for market-making purposes.
Trading Derivatives JPMorgan Chase Bank, N.A. transacts in a variety of derivatives in its trading portfolios to meet the needs of customers (both dealers and clients) and to generate revenue through this trading activity. JPMorgan Chase Bank, N.A. makes markets in derivatives for its customers (collectively, “client derivatives”) seeking to mitigate or transform interest rate, credit, foreign exchange, equity and commodity risks. JPMorgan Chase Bank, N.A. actively manages the risks from its exposure to these derivatives by entering into other derivative transactions or by purchasing or selling other financial instruments that partially or fully offset the exposure from client derivatives. JPMorgan Chase Bank, N.A. also seeks to earn a spread between the client derivatives and offsetting positions, and from the remaining open risk positions. For more information about trading derivatives, see the trading derivatives gains and losses table on page 31 of this Note.
Risk Management Derivatives JPMorgan Chase Bank, N.A. manages its market exposures using various derivative instruments.
Interest rate contracts are used to minimize fluctuations in earnings that are caused by changes in interest rates. Fixed-rate assets and liabilities appreciate or depreciate in market value as interest rates change. Similarly, interest income and interest expense increase or decrease as a result of variable-rate assets and liabilities resetting to current market rates, and as a result of the repayment and subsequent origination or issuance of fixed-rate assets and liabilities at current market rates. Gains and losses on the derivative instruments that are related to such assets and liabilities are expected to substantially offset this variability in earnings. JPMorgan Chase Bank, N.A. generally uses interest rate swaps, forwards and futures to manage the impact of interest rate fluctuations on earnings.
Foreign currency forward contracts are used to manage the foreign exchange risk associated with certain foreign currency–denominated (i.e., non-U.S.) assets and liabilities and forecasted transactions denominated in a foreign currency, as well as JPMorgan Chase Bank, N.A.’s net investments in certain non-U.S. subsidiaries or branches whose functional currencies are not the U.S. dollar. As a result of fluctuations in foreign currencies, the U.S. dollar–equivalent values of the foreign currency–denominated assets and liabilities or forecasted revenue or expense increase or decrease. Gains or losses on the derivative instruments that are related to the foreign currency–denominated assets or liabilities, or forecasted transactions, are expected to substantially offset this variability.
Gold forward contracts are used to manage the price risk of gold inventory in JPMorgan Chase Bank, N.A.’s commodities portfolio. Gains or losses on the gold forwards are expected to substantially offset the depreciation or appreciation of the gold inventory as a result of gold price changes. Also in the commodities portfolio, electricity and natural gas futures and forwards contracts are used to manage the price risk associated with energy-related tolling and load-serving contracts and energy-related investments.
JPMorgan Chase Bank, N.A. uses credit derivatives to manage the counterparty credit risk associated with loans and lending-related commitments. Credit derivatives compensate the purchaser when the entity referenced in the contract experiences a credit event, such as bankruptcy or a failure to pay an obligation when due. For a further discussion of credit derivatives, see the discussion in the Credit derivatives section on pages 32–34 of this Note.
For more information about risk management derivatives, see the risk management derivatives gains and losses table on page 31 of this Note.

26
Notional amount of derivative contracts The following table summarizes the notional amount of derivative contracts outstanding as of June 30, 2009.
Notional amounts(b) (in billions) June 30, 2009 Interest rate contracts
Swaps $ 48,996 Futures and forwards 6,050 Written options 4,776 Purchased options 4,742
Total interest rate contracts 64,564 Credit derivatives(a) 6,818 Foreign exchange contracts
Cross-currency swaps 1,848 Spot, futures and forwards 3,677 Written options 727 Purchased options 752
Total foreign exchange contracts 7,004 Equity contracts
Swaps 83 Futures and forwards 45 Written options 831 Purchased options 614
Total equity contracts 1,573 Commodity contracts
Swaps 229 Spot, futures and forwards 84 Written options 204 Purchased options 198
Total commodity contracts 715 Total derivative notional amounts $ 80,674 (a) For more information on volumes and types of credit derivative contracts, see the credit derivative discussion on pages 32–34 of this Note. (b) Represents the sum of gross long and gross short third-party notional derivative contracts.

27
While the notional amounts disclosed above indicate the volume of JPMorgan Chase Bank, N.A.’s derivative activity, the notional amounts significantly exceed, in JPMorgan Chase Bank, N.A.’s view, the possible losses that could arise from such transactions. For most derivative transactions, the notional amount does not change hands; it is used simply as a reference to calculate payments.
Accounting for Derivatives All free-standing derivatives are required to be recorded on the Consolidated Balance Sheets at fair value. The accounting for changes in value of a derivative depends on whether or not the contract has been designated and qualifies for hedge accounting. Derivatives that are not designated as hedges are marked to market through earnings. The tabular disclosures on pages 28–34 of this Note provide additional information on the amount of and reporting for derivative assets, liabilities, gains and losses. For further discussion of derivatives embedded in structured notes, see Notes 5 and 6 on pages 13–24 and 25–27, respectively, of JPMorgan Chase Bank, N.A.’s 2008 Annual Financial Statements.
Derivatives designated as hedges JPMorgan Chase Bank, N.A. applies hedge accounting to certain derivatives executed for risk management purposes – typically interest rate, foreign exchange and gold derivatives, as described above. JPMorgan Chase Bank, N.A. does not seek to apply hedge accounting to all of JPMorgan Chase Bank, N.A.’s risk management activities involving derivatives. For example, JPMorgan Chase Bank, N.A. does not apply hedge accounting to purchased credit default swaps used to manage the credit risk of loans and commitments, because of the difficulties in qualifying such contracts as hedges. For the same reason, JPMorgan Chase Bank, N.A. does not apply hedge accounting to certain interest rate derivatives used for risk management purposes, or to commodity derivatives used to manage the price risk of tolling and load-serving contracts.
To qualify for hedge accounting, a derivative must be highly effective at reducing the risk associated with the exposure being hedged. In addition, for a derivative to be designated as a hedge, the risk management objective and strategy must be documented. Hedge documentation must identify the derivative hedging instrument, the asset or liability and type of risk to be hedged, and how the effectiveness of the derivative will be assessed prospectively and retrospectively. To assess effectiveness, JPMorgan Chase Bank, N.A. uses statistical methods such as regression analysis, as well as nonstatistical methods including dollar-value comparisons of the change in the fair value of the derivative to the change in the fair value or cash flows of the hedged item. The extent to which a derivative has been, and is expected to continue to be, effective at offsetting changes in the fair value or cash flows of the hedged item must be assessed and documented at least quarterly. Any hedge ineffectiveness (i.e., the amount by which the gain or loss on the designated derivative instrument does not exactly offset the gain or loss on the hedged item attributable to the hedged risk) must be reported in current-period earnings. If it is determined that a derivative is not highly effective at hedging the designated exposure, hedge accounting is discontinued.
There are three types of hedge accounting designations: fair value hedges, cash flow hedges and net investment hedges. JPMorgan Chase Bank, N.A. uses fair value hedges primarily to hedge fixed-rate long-term debt, available-for-sale (“AFS”) securities and gold inventory. For qualifying fair value hedges, the changes in the fair value of the derivative, and in the value of the hedged item for the risk being hedged, are recognized in earnings. If the hedge relationship is terminated, then the fair value adjustment to the hedged item continues to be reported as part of the basis of the hedged item and is amortized to earnings as a yield adjustment.
JPMorgan Chase Bank, N.A. uses cash flow hedges to hedge the exposure to variability in cash flows from floating-rate financial instruments and forecasted transactions, primarily the rollover of short-term assets and liabilities, and foreign currency–denominated revenue and expense. For qualifying cash flow hedges, the effective portion of the change in the fair value of the derivative is recorded in other comprehensive income (loss) (“OCI”) and recognized in the Consolidated Statements of Income when the hedged cash flows affect earnings. Derivative amounts affecting earnings are recognized consistent with the classification of the hedged item – primarily interest income, interest expense, noninterest revenue and compensation expense. The ineffective portions of cash flow hedges are immediately recognized in earnings. If the hedge relationship is terminated, then the value of the derivative recorded in accumulated other comprehensive income (loss) (“AOCI”) is recognized in earnings when the cash flows that were hedged affect earnings. For hedge relationships that are discontinued because a forecasted transaction is not expected to occur according to the original hedge forecast, any related derivative values recorded in AOCI are immediately recognized in earnings.
JPMorgan Chase Bank, N.A. uses foreign currency hedges to protect the value of its net investments in certain non-U.S. subsidiaries or branches whose functional currencies are not the U.S. dollar. For qualifying net investment hedges, changes in the fair value of the derivatives are recorded in the translation adjustments account within AOCI.

28
Impact of derivatives on the Consolidated Balance Sheets The following table summarizes information on derivative fair values that are reflected on JPMorgan Chase Bank, N.A.’s Consolidated Balance Sheets as of June 30, 2009, by accounting designation (e.g., whether the derivatives were designated as hedges or not) and contract type.
Free-standing derivatives(a) Derivative receivables Derivative payables June 30, 2009 (in millions)
Not designated as hedges
Designated as hedges
Total derivative receivables
Not designated as hedges
Designated as hedges(c)
Total derivative payables
Trading assets and liabilities Interest rate $ 1,242,171 $ 1,693 $ 1,243,864 $ 1,209,697 $ 70 $ 1,209,767 Credit 295,935 — 295,935 285,018 — 285,018 Foreign exchange 151,775 1,018 152,793 157,839 1,170 159,009 Equity 54,601 — 54,601 55,237 — 55,237 Commodity 36,548 — 36,548 36,447 — 36,447
Gross fair value of trading assets and liabilities $ 1,781,030 $ 2,711 $ 1,783,741 $ 1,744,238 $ 1,240 $ 1,745,478
FIN 39 netting(b) (1,700,046) (1,682,107) Carrying value of
derivative trading assets and trading liabilities on the Consolidated Balance Sheet $ 83,695 $ 63,371
(a) Excludes structured notes for which the fair value option has been elected. See Note 5 on pages 22–24 of these Consolidated Financial Statements for further information.
(b) FIN 39 permits the netting of derivative receivables and derivative payables and the related cash collateral received and paid when a legally enforceable master netting agreement exists between JPMorgan Chase Bank, N.A. and a derivative counterparty.
(c) Excludes $1.0 billion related to separated commodity derivatives used as fair value hedging instruments that are recorded in the line item of the host contract (i.e., other borrowed funds).
Derivative receivables and payables mark-to-market The following table summarizes the fair values of derivative receivables and payables by contract type after application of FIN 39 netting as of June 30, 2009, and December 31, 2008.
(in millions) June 30, 2009 December 31, 2008 Derivative receivables:
Interest rate(a) $ 34,788 $ 48,991 Credit 19,710 34,172 Foreign exchange(a) 17,944 38,889 Equity 6,331 11,939 Commodity 4,922 7,586
Total derivative receivables $ 83,695 $ 141,577
Trading liabilities Derivative payables:
Interest rate(a) $ 14,976 $ 32,002 Credit 8,793 14,217 Foreign exchange(a) 24,206 44,639 Equity 12,692 15,770 Commodity 2,704 4,869
Total derivative payables $ 63,371 $ 111,497 (a) During the first quarter of 2009, cross-currency interest rate swaps previously reported in interest rate contracts were reclassified to foreign
exchange contracts to be more consistent with industry practice. The effect of this change resulted in reclassifications of $14.1 billion and $20.6 billion of derivative receivables and derivative payables, respectively, between cross-currency interest rate swaps and foreign exchange contracts, as of December 31, 2008.
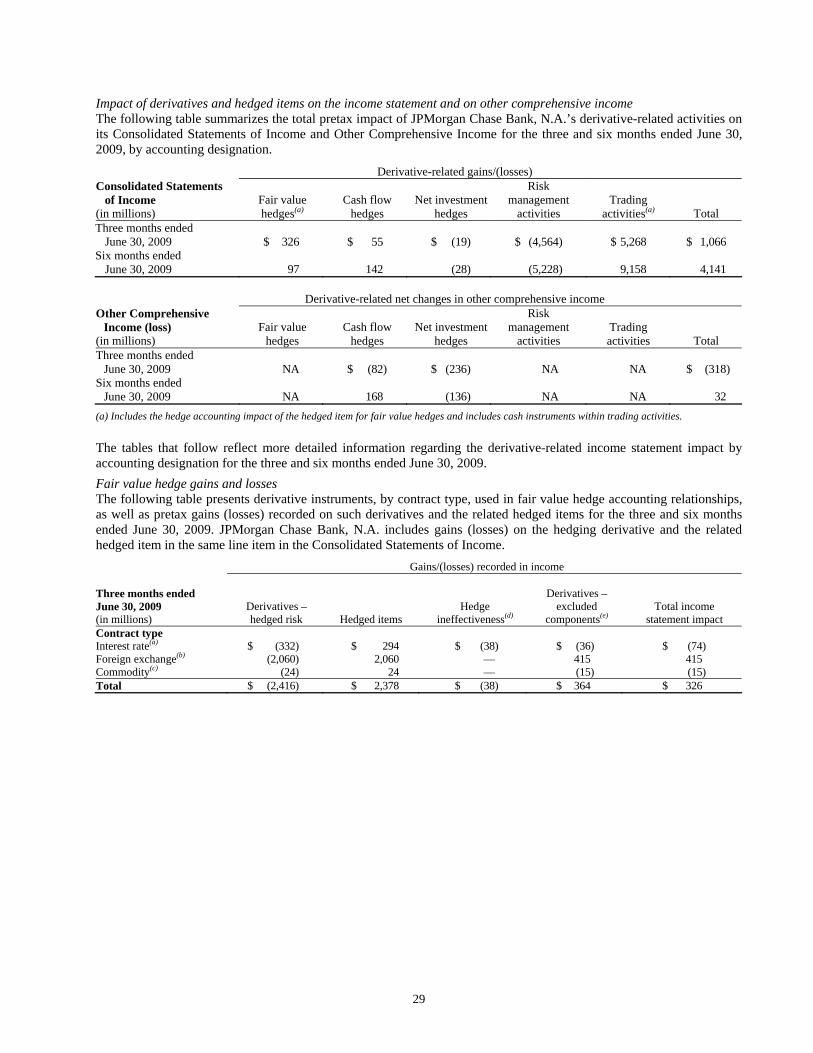
29
Impact of derivatives and hedged items on the income statement and on other comprehensive income The following table summarizes the total pretax impact of JPMorgan Chase Bank, N.A.’s derivative-related activities on its Consolidated Statements of Income and Other Comprehensive Income for the three and six months ended June 30, 2009, by accounting designation.
Derivative-related gains/(losses) Consolidated Statements of Income (in millions)
Fair value hedges(a)
Cash flow hedges
Net investment hedges
Risk management
activities Trading
activities(a) Total Three months ended
June 30, 2009 $ 326 $ 55 $ (19) $ (4,564) $ 5,268 $ 1,066 Six months ended
June 30, 2009 97 142 (28) (5,228) 9,158 4,141 Derivative-related net changes in other comprehensive income Other Comprehensive
Income (loss) (in millions)
Fair value hedges
Cash flow hedges
Net investment hedges
Risk management
activities Trading activities Total
Three months ended June 30, 2009 NA $ (82) $ (236) NA NA $ (318)
Six months ended June 30, 2009 NA 168 (136) NA NA 32
(a) Includes the hedge accounting impact of the hedged item for fair value hedges and includes cash instruments within trading activities.
The tables that follow reflect more detailed information regarding the derivative-related income statement impact by accounting designation for the three and six months ended June 30, 2009. Fair value hedge gains and losses The following table presents derivative instruments, by contract type, used in fair value hedge accounting relationships, as well as pretax gains (losses) recorded on such derivatives and the related hedged items for the three and six months ended June 30, 2009. JPMorgan Chase Bank, N.A. includes gains (losses) on the hedging derivative and the related hedged item in the same line item in the Consolidated Statements of Income. Gains/(losses) recorded in income
Three months ended June 30, 2009 (in millions)
Derivatives – hedged risk Hedged items
Hedge ineffectiveness(d)
Derivatives –
excluded components(e)
Total income statement impact
Contract type Interest rate(a) $ (332) $ 294 $ (38) $ (36) $ (74) Foreign exchange(b) (2,060) 2,060 — 415 415 Commodity(c) (24) 24 — (15) (15) Total $ (2,416) $ 2,378 $ (38) $ 364 $ 326

30
Gains/(losses) recorded in income
Six months ended June 30, 2009 (in millions)
Derivatives – hedged risk Hedged items
Hedge ineffectiveness(d)
Derivatives –
excluded components(e)
Total income statement impact
Contract type Interest rate(a) $ (297) $ 234 $ (63) $ 37 $ (26) Foreign exchange(b) (1,723) 1,723 — 136 136 Commodity(c) (182) 182 — (13) (13) Total $ (2,202) $ 2,139 $ (63) $ 160 $ 97
(a) Primarily consists of hedges of the benchmark (e.g., LIBOR) interest rate risk of fixed-rate long-term debt. Gains and losses were recorded in net interest income.
(b) Primarily consists of hedges of the foreign currency risk of long-term debt and AFS securities for changes in spot foreign currency rates. Gains and losses related to the derivatives and the hedged items due to changes in spot foreign currency rates were recorded in principal transactions revenue and net interest income. The excluded components were recorded in net interest income.
(c) Consists of overall fair value hedges of physical gold inventory. Gains and losses were recorded in principal transactions revenue. (d) Hedge ineffectiveness is the amount by which the gain or loss on the designated derivative instrument does not exactly offset the gain or
loss on the hedged item attributable to the hedged risk. (e) Certain components of hedging derivatives are permitted to be excluded from the assessment of hedge effectiveness, such as forward
points on a futures or forwards contract. Amounts related to excluded components are recorded in current-period income. Cash flow hedge gains and losses The following table presents derivative instruments, by contract type, used in cash flow hedge accounting relationships, and the pretax gains (losses) recorded on such derivatives, for the three and six months ended June 30, 2009. JPMorgan Chase Bank, N.A. includes the gain (loss) on the hedging derivative in the same line item as the offsetting change in cash flows on the hedged item in the Consolidated Statements of Income. Gains/(losses) recorded in income and other comprehensive income (loss)
Three months ended June 30, 2009 (in millions)
Derivatives – effective portion reclassified from
AOCI into income
Hedge ineffectiveness
recorded directly in income(c)
Total income
statement impact
Derivatives – effective portion recorded in OCI
Total change in OCI
for period Contract type Interest rate(a) $ (26) $ 1 $ (25) $ (343) $ (317) Foreign exchange(b) 80 — 80 315 235 Total $ 54 $ 1 $ 55 $ (28) $ (82) Gains/(losses) recorded in income and other comprehensive income (loss)
Six months ended June 30, 2009 (in millions)
Derivatives – effective portion reclassified from
AOCI into income
Hedge ineffectiveness
recorded directly in income(c)
Total income
statement impact
Derivatives – effective portion recorded in OCI
Total change in OCI
for period Contract type Interest rate(a) $ (69) $ 2 $ (67) $ (299) $ (230) Foreign exchange(b) 209 — 209 607 398 Total $ 140 $ 2 $ 142 $ 308 $ 168
(a) Primarily consists of benchmark interest rate hedges of LIBOR-indexed floating-rate assets and floating-rate liabilities. Gains and losses were recorded in net interest income.
(b) Primarily consists of hedges of the foreign currency risk of non-U.S. dollar–denominated revenue and expense. The income statement classification of gains and losses follows the hedged item – primarily net interest income, compensation expense and other expense.
(c) Hedge ineffectiveness is the amount by which the cumulative gain or loss on the designated derivative instrument exceeds the present value of the cumulative expected change in cash flows on the hedged item attributable to the hedged risk.
Over the next 12 months, it is expected that $61 million (after tax) of net losses recorded in AOCI at June 30, 2009, related to cash flow hedges will be recognized in income. The maximum length of time over which forecasted transactions are hedged is 10 years, and such transactions primarily relate to core lending and borrowing activities.
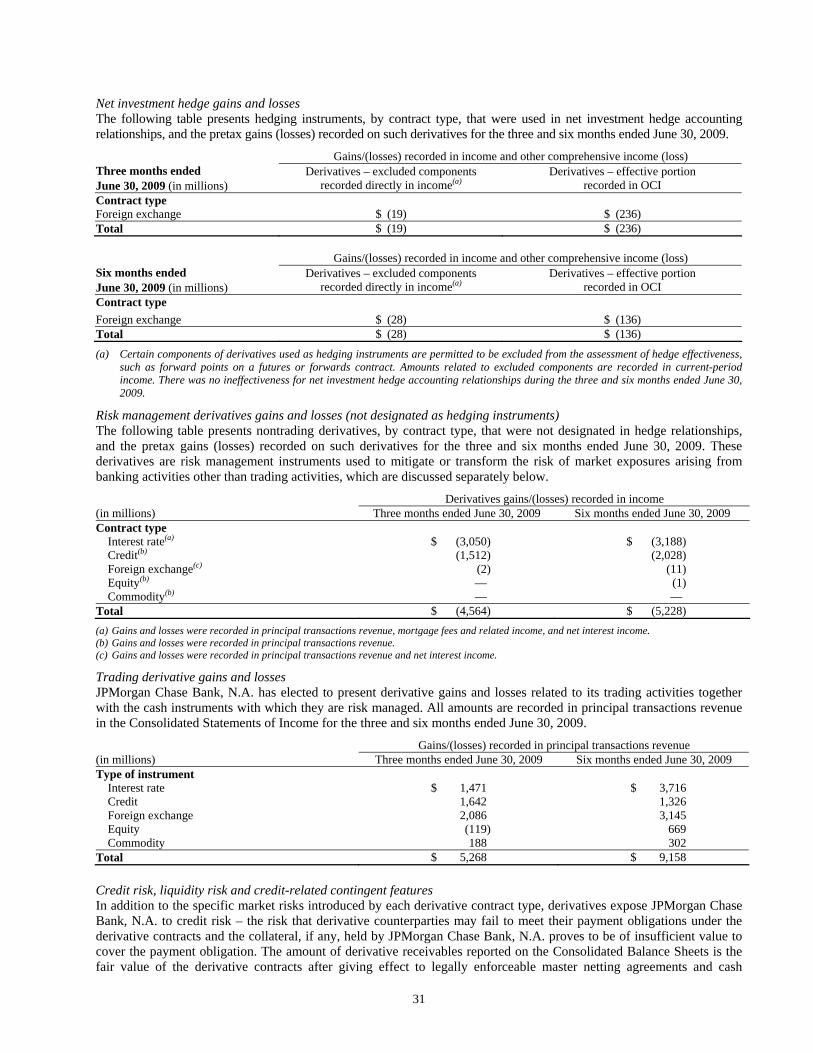
31
Net investment hedge gains and losses The following table presents hedging instruments, by contract type, that were used in net investment hedge accounting relationships, and the pretax gains (losses) recorded on such derivatives for the three and six months ended June 30, 2009.
Gains/(losses) recorded in income and other comprehensive income (loss) Three months ended June 30, 2009 (in millions)
Derivatives – excluded components recorded directly in income(a)
Derivatives – effective portion recorded in OCI
Contract type Foreign exchange $ (19) $ (236) Total $ (19) $ (236) Gains/(losses) recorded in income and other comprehensive income (loss) Six months ended June 30, 2009 (in millions)
Derivatives – excluded components recorded directly in income(a)
Derivatives – effective portion recorded in OCI
Contract type Foreign exchange $ (28) $ (136) Total $ (28) $ (136)
(a) Certain components of derivatives used as hedging instruments are permitted to be excluded from the assessment of hedge effectiveness, such as forward points on a futures or forwards contract. Amounts related to excluded components are recorded in current-period income. There was no ineffectiveness for net investment hedge accounting relationships during the three and six months ended June 30, 2009.
Risk management derivatives gains and losses (not designated as hedging instruments) The following table presents nontrading derivatives, by contract type, that were not designated in hedge relationships, and the pretax gains (losses) recorded on such derivatives for the three and six months ended June 30, 2009. These derivatives are risk management instruments used to mitigate or transform the risk of market exposures arising from banking activities other than trading activities, which are discussed separately below.
Derivatives gains/(losses) recorded in income (in millions) Three months ended June 30, 2009 Six months ended June 30, 2009 Contract type
Interest rate(a) $ (3,050) $ (3,188) Credit(b) (1,512) (2,028) Foreign exchange(c) (2) (11) Equity(b) — (1) Commodity(b) — —
Total $ (4,564) $ (5,228) (a) Gains and losses were recorded in principal transactions revenue, mortgage fees and related income, and net interest income. (b) Gains and losses were recorded in principal transactions revenue. (c) Gains and losses were recorded in principal transactions revenue and net interest income.
Trading derivative gains and losses JPMorgan Chase Bank, N.A. has elected to present derivative gains and losses related to its trading activities together with the cash instruments with which they are risk managed. All amounts are recorded in principal transactions revenue in the Consolidated Statements of Income for the three and six months ended June 30, 2009.
Gains/(losses) recorded in principal transactions revenue (in millions) Three months ended June 30, 2009 Six months ended June 30, 2009 Type of instrument
Interest rate $ 1,471 $ 3,716 Credit 1,642 1,326 Foreign exchange 2,086 3,145 Equity (119) 669 Commodity 188 302
Total $ 5,268 $ 9,158 Credit risk, liquidity risk and credit-related contingent features In addition to the specific market risks introduced by each derivative contract type, derivatives expose JPMorgan Chase Bank, N.A. to credit risk – the risk that derivative counterparties may fail to meet their payment obligations under the derivative contracts and the collateral, if any, held by JPMorgan Chase Bank, N.A. proves to be of insufficient value to cover the payment obligation. The amount of derivative receivables reported on the Consolidated Balance Sheets is the fair value of the derivative contracts after giving effect to legally enforceable master netting agreements and cash

32
collateral held by JPMorgan Chase Bank, N.A. These amounts represent the cost to JPMorgan Chase Bank, N.A. to replace the contracts at then-current market rates should the counterparty default. However, in management’s view, the appropriate measure of current credit risk should take into consideration other additional liquid securities held as collateral by JPMorgan Chase Bank, N.A., which is disclosed in the table below.
While derivative receivables expose JPMorgan Chase Bank, N.A. to credit risk, derivative payables expose JPMorgan Chase Bank, N.A. to liquidity risk, as the derivative contracts typically require JPMorgan Chase Bank, N.A. to post cash or securities collateral with counterparties as the MTM moves in the counterparties’ favor, or upon specified downgrades in JPMorgan Chase Bank, N.A.’s and its subsidiaries’ respective credit ratings. At June 30, 2009, the impact of a single-notch and six-notch ratings downgrade to JPMorgan Chase Bank, N.A., and its subsidiaries would have required $1.1 billion and $3.5 billion, respectively, of additional collateral to be posted by JPMorgan Chase Bank, N.A. Certain derivative contracts also provide for termination of the contract, generally upon a downgrade of either JPMorgan Chase Bank, N.A. or the counterparty, at the fair value of the derivative contracts. At June 30, 2009, the impact of a single-notch and six-notch ratings downgrade to JPMorgan Chase Bank, N.A., and its subsidiaries related to contracts with termination triggers would have required JPMorgan Chase Bank, N.A. to settle trades with a fair value of $0.3 million and $4.6 billion, respectively. The aggregate fair value of net derivative payables that contain contingent collateral or termination features triggered upon a downgrade was $26.4 billion at June 30, 2009, for which JPMorgan Chase Bank, N.A. has posted collateral of $18.9 billion in the normal course of business.
The following table shows the current credit risk of derivative receivables after FIN 39 netting and collateral received, and current liquidity risk of derivative payables after FIN 39 netting and collateral posted, as of June 30, 2009.
June 30, 2009 (in millions) Derivative receivables Derivative payables Gross derivative fair value $ 1,783,741 $ 1,745,478 Fin 39 netting – offsetting receivables/payables (1,628,843) (1,628,843) Fin 39 netting – cash collateral received/paid (71,203) (53,264) Carrying value on Consolidated Balance Sheets 83,695 63,371 Securities collateral received/paid (13,580) (8,622) Derivative fair value, net of all collateral $ 70,115 $ 54,749
In addition to the collateral amounts reflected in the table above, JPMorgan Chase Bank, N.A. receives and delivers collateral at the initiation of derivative transactions, which is available as security against potential exposure that could arise should the fair value of the transactions move in JPMorgan Chase Bank, N.A.’s or client’s favor, respectively. JPMorgan Chase Bank, N.A. and its counterparties also hold collateral related to contracts that have a non-daily call frequency for collateral to be posted, and collateral that JPMorgan Chase Bank, N.A. or a counterparty has agreed to return but has not yet settled, as of the reporting date. At June 30, 2009, JPMorgan Chase Bank, N.A. received $18.7 billion and delivered $1.4 billion of such additional collateral. These amounts were not netted against the derivative receivables and payables in the table above, because, at an individual counterparty level, the collateral exceeded the fair value exposure at June 30, 2009.
Credit derivatives Credit derivatives are financial instruments whose value is derived from the credit risk associated with the debt of a third-party issuer (the reference entity) and which allow one party (the protection purchaser) to transfer that risk to another party (the protection seller). Credit derivatives expose the protection purchaser to the creditworthiness of the protection seller, as the protection seller is required to make payments under the contract when the reference entity experiences a credit event, such as a bankruptcy, a failure to pay its obligation or a restructuring. The seller of credit protection receives a premium for providing protection but has the risk that the underlying instrument referenced in the contract will be subject to a credit event. JPMorgan Chase Bank, N.A. is both a purchaser and seller of credit protection in the credit derivatives market and uses credit derivatives for two primary purposes. First, in its capacity as a market-maker in the dealer/client business, JPMorgan Chase Bank, N.A. actively risk manages a portfolio of credit derivatives by purchasing and selling credit protection, predominantly on corporate debt obligations, to meet the needs of customers. As a seller of protection, JPMorgan Chase Bank, N.A.’s exposure to a given reference entity may be offset partially, or entirely, with a contract to purchase protection from another counterparty on the same or similar reference entity. Second, JPMorgan Chase Bank, N.A. uses credit derivatives to mitigate credit risk associated with its overall derivative receivables and traditional commercial credit lending exposures (loans and unfunded commitments) as well as to manage its exposure to residential and commercial mortgages.

33
For a further discussion of credit derivatives, including a description of the different types used by JPMorgan Chase Bank, N.A., see Note 30 on pages 80–83 of JPMorgan Chase Bank, N.A.’s 2008 Annual Financial Statements. The following table presents a summary of the notional amounts of credit derivatives and credit-related notes JPMorgan Chase Bank, N.A. sold and purchased as of June 30, 2009, and December 31, 2008. Upon a credit event, JPMorgan Chase Bank, N.A. as seller of protection would typically pay out only a percentage of the full notional amount of net protection sold, as the amount actually required to be paid on the contracts takes into account the recovery value of the reference obligation at the time of settlement. JPMorgan Chase Bank, N.A. manages the credit risk on contracts to sell protection by purchasing protection with identical or similar underlying reference entities. As such, other purchased protection referenced in the following table includes credit derivatives bought on related, but not identical, reference positions; these include indices, portfolio coverage and other reference points. JPMorgan Chase Bank, N.A. does not use notional as the primary measure of risk management for credit derivatives because notional does not take into account the probability of occurrence of a credit event, recovery value of the reference obligation, or related cash instruments and economic hedges.
Total credit derivatives and credit-related notes Maximum payout/Notional amount June 30, 2009 (in millions)
Protection sold
Protection purchased with identical underlyings(c)
Net protection (sold)/purchased(d)
Other protection purchased(e)
Credit derivatives Credit default swaps $ (3,317,959) $ 3,400,665 $ 82,706 $ 41,539 Other credit derivatives(a) (11,206) 13,707 2,501 32,712
Total credit derivatives (3,329,165) 3,414,372 85,207 74,251 Credit-related notes (3,247) — (3,247) 985 Total $ (3,332,412) $ 3,414,372 $ 81,960 $ 75,236
Maximum payout/Notional amount December 31, 2008 (in millions)
Protection sold
Protection purchased with identical underlyings(c)
Net protection (sold)/purchased(d)
Other protection purchased(e)
Credit derivatives Credit default swaps(b) $ (4,103,539) $ 3,984,139 $ (119,400) $ 278,181 Other credit derivatives(a) (3,726) — (3,726) 22,044(b)
Total credit derivatives (4,107,265) 3,984,139 (123,126) 300,225 Credit-related notes(b) (4,080) — (4,080) 2,373 Total $ (4,111,345) $ 3,984,139 $ (127,206) $ 302,598 (a) Primarily consists of total return swaps and credit default swap options. (b) Total credit derivatives and credit-related notes amounts of protection purchased and protection sold have been revised for the prior period. (c) Represents the notional amount of purchased credit derivatives where the underlying reference instrument is identical to the reference
instrument on which JPMorgan Chase Bank, N.A. has sold credit protection. (d) Does not take into account the fair value of the reference obligation at the time of settlement, which would generally reduce the amount
the seller of protection pays to the buyer of protection in determining settlement value. (e) Represents single-name and index CDS protection JPMorgan Chase Bank, N.A. purchased.

34
The following table summarizes the notional and fair value amounts of credit derivatives and credit-related notes as of June 30, 2009, and December 31, 2008, where JPMorgan Chase Bank, N.A. is the seller of protection. The maturity profile is based on the remaining contractual maturity of the credit derivative contracts. The ratings profile is based on the rating of the reference entity on which the credit derivative contract is based. The ratings and maturity profile of protection purchased are comparable to the profile reflected below.
Protection sold – credit derivatives and credit-related notes ratings/maturity profile
June 30, 2009 (in millions) <1 year 1–5 years >5 years Total
notional amount Fair value(c) Risk rating of reference entity
Investment grade (AAA to BBB-)(a) $ (254,784) $ (1,387,766) $ (553,906) $ (2,196,456) $ (89,350) Noninvestment grade (BB+ and below)(a) (144,297) (761,089) (230,570) (1,135,956) (160,407)
Total $ (399,081) $ (2,148,855) $ (784,476) $ (3,332,412) $ (249,757)
December 31, 2008 (in millions) <1 year 1–5 years >5 years Total
notional amount Fair value(c) Risk rating of reference entity
Investment grade (AAA to BBB-)(a)(b) $ (178,569) $ (1,741,467) $ (700,984) $ (2,621,020) $ (229,877) Noninvestment grade (BB+ and below)(a)(b) (120,531) (955,601) (414,193) (1,490,325) (261,668)
Total $ (299,100) $ (2,697,068) $ (1,115,177) $ (4,111,345) $ (491,545) (a) Ratings scale is based on JPMorgan Chase Bank, N.A.’s internal ratings, which generally correspond to ratings defined by S&P and Moody’s. (b) The amounts of protection sold for total credit derivatives and credit-related notes have been revised for the prior period. (c) Amounts are shown on a gross basis, before the benefit of legally enforceable master netting agreements and cash collateral held by JPMorgan
Chase Bank, N.A.
NOTE 7 – OTHER NONINTEREST REVENUE For a discussion of the components of and accounting policies for JPMorgan Chase Bank, N.A.’s other noninterest revenue, see Note 8 on pages 28–29 of JPMorgan Chase Bank, N.A.’s 2008 Annual Financial Statements. The following table presents the components of investment banking fees.
Three months ended June 30, Six months ended June 30, (in millions) 2009 2008 2009 2008 Underwriting:
Equity $ 488 $ 235 $ 666 $ 418 Debt 399 399 753 577 Total underwriting 887 634 1,419 995
Advisory 170 184 377 399 Total investment banking fees $ 1,057 $ 818 $ 1,796 $ 1,394
The following table presents components of asset management, administration and commissions.
Three months ended June 30, Six months ended June 30, (in millions) 2009 2008 2009 2008 Total asset management fees $ 350 $ 393 $ 679 $ 783 Total administration fees(a) 455 634 874 1,255 Commission and other fees:
Brokerage commissions 331 451 633 968 All other commissions and fees 1,134 1,025 2,219 2,028 Total commissions and fees 1,465 1,476 2,852 2,996
Total asset management, administration and commissions $ 2,270 $ 2,503 $ 4,405 $ 5,034 (a) Includes fees for custody, securities lending, funds services and securities clearance.

35
NOTE 8 – INTEREST INCOME AND INTEREST EXPENSE Details of interest income and interest expense were as follows.
Three months ended June 30, Six months ended June 30, (in millions) 2009 2008 2009 2008 Interest income(a) Loans $ 7,213 $ 6,951 $ 15,225 $ 14,591 Securities 3,071 1,369 5,872 2,538 Trading assets 1,674 2,675 3,439 5,809 Federal funds sold, securities purchased under resale
agreements and securities borrowed 374 1,862 1,011 3,929 Deposits with banks 232 363 638 687 Other assets(b) (67) 33 (50) 33 Total interest income 12,497 13,253 26,135 27,587
Interest expense(a) Interest-bearing deposits 1,283 3,940 3,086 8,807 Short-term and other liabilities(c) 1,011 1,902 2,060 4,253 Long-term debt 332 390 622 840 Beneficial interests issued by consolidated VIEs 27 56 60 139 Total interest expense 2,653 6,288 5,828 14,039 Net interest income 9,844 6,965 20,307 13,548 Provision for credit losses 5,799 2,533 11,877 6,271 Net interest income after provision for credit losses $ 4,045 $ 4,432 $ 8,430 $ 7,277 (a) Interest income and interest expense include the current-period interest accruals for financial instruments measured at fair value, except for
financial instruments containing embedded derivatives that would be separately accounted for in accordance with SFAS 133 absent the SFAS 159 fair value election; for those instruments, all changes in fair value, including any interest elements, are reported in principal transactions revenue.
(b) Predominantly margin loans. (c) Includes brokerage customer payables.
NOTE 9 – PENSION AND OTHER POSTRETIREMENT EMPLOYEE BENEFIT PLANS For a discussion of JPMorgan Chase Bank, N.A.’s pension plans and United Kingdom (“U.K.”) other postretirement employee benefit (“OPEB”) plan, see Note 10 on pages 30–34 of JPMorgan Chase Bank, N.A.’s 2008 Annual Financial Statements.
The following table presents the components of net periodic benefit cost reported in the Consolidated Statements of Income for JPMorgan Chase Bank, N.A.’s U.S. nonqualified defined benefit pension plans, non-U.S. defined benefit pension plans and U.K. OPEB plan.
Defined benefit pension plans U.S. Non-U.S. U.K. OPEB plan Three months ended June 30, (in millions) 2009 2008 2009 2008 2009 2008 Components of net periodic benefit cost Benefits earned during the period $ 1 $ 1 $ 6 $ 7 $ — $ — Interest cost on benefit obligations 4 4 30 38 1 1 Expected return on plan assets — — (28) (41) — — Amortization of net loss 1 — 11 7 — — Net periodic benefit cost 6 5 19 11 1 1 Other defined benefit pension plans(a) 4 3 2 3 NA NA Total defined benefit pension and OPEB plans 10 8 21 14 1 1 Total defined contribution plans 67 57 55 73 NA NA Total pension and OPEB cost included in compensation expense $ 77 $ 65 $ 76 $ 87 $ 1 $ 1

36
Defined benefit pension plans U.S. Non-U.S. U.K. OPEB plan Six months ended June 30, (in millions) 2009 2008 2009 2008 2009 2008 Components of net periodic benefit cost Benefits earned during the period $ 2 $ 2 $ 12 $ 14 $ — $ — Interest cost on benefit obligations 11 9 56 76 1 2 Expected return on plan assets — — (52) (82) — — Amortization of net loss 1 — 21 14 — — Net periodic benefit cost 14 11 37 22 1 2 Other defined benefit pension plans(a) 7 6 5 6 NA NA Total defined benefit pension and OPEB plans 21 17 42 28 1 2 Total defined contribution plans 131 108 107 145 NA NA Total pension and OPEB cost included in compensation expense $ 152 $ 125 $ 149 $ 173 $ 1 $ 2 (a) Includes various defined benefit pension plans, which are individually immaterial.
The fair value of plan assets for the material non-U.S. defined benefit pension plans were $2.2 billion as of June 30, 2009, and $2.0 billion as of December 31, 2008. See Note 22 on page 67 of these Consolidated Financial Statements for further information on unrecognized amounts (i.e., net loss and prior service costs/(credit)) reflected in accumulated other comprehensive income for the six months ended June 30, 2009 and 2008. The 2009 potential contributions for JPMorgan Chase Bank, N.A.’s U.S. non-qualified defined benefit pension plans are $39 million. The 2009 potential contributions for JPMorgan Chase Bank, N.A.’s non-U.S. defined benefit pension plans (excluding the main U.K. plan) are $44 million and for the U.K. OPEB plan is $2 million. The amount of potential 2009 contributions to JPMorgan Chase Bank, N.A.’s main U.K. defined benefit pension plan is not reasonably estimable at this time. JPMorgan Chase charged JPMorgan Chase Bank, N.A. $63 million and $51 million, for the three months ended June 30, 2009 and 2008, respectively, and $124 million and $101 million in the first six months of 2009 and 2008, respectively, for its share of the U.S. qualified defined benefit pension plan expense. For its share of the U.S. OPEB plan expense, JPMorgan Chase charged JPMorgan Chase Bank, N.A. $1 million for the three months ended June 30, 2009 and 2008, and $3 million and $2 million in the first six months of 2009 and 2008, respectively. On May 1, 2009, JPMorgan Chase amended the employer matching contribution feature of the 401(k) Savings Plan (the “Plan”) to provide that: (i) for employees earning less than $50,000, matching contributions will be based on their contributions to the Plan, but not to exceed 5% of their eligible compensation (e.g., base pay); and (ii) for employees earning $50,000 or more per year, matching contributions will be made at the discretion of JPMorgan Chase’s management, depending on JPMorgan Chase's earnings for the year. Any such matching contributions will be made on an annual basis, following the end of the calendar year, to employees who are employed by JPMorgan Chase Bank, N.A. or an affiliate at the end of such year. Pursuant to a compromise and settlement agreement between JPMorgan Chase Bank, N.A. and Washington Mutual Inc., JPMorgan Chase Bank, N.A. became a contributing employer under the WaMu Savings Plan effective as of September 25, 2008, and the sponsor of the WaMu Savings Plan as of August 10, 2009. As of July 28, 2009, the United States Bankruptcy Court for the District of Delaware entered an order approving the compromise and settlement agreement, which became final and non-appealable on August 10, 2009. Consolidated disclosures of information about the pension and OPEB plans of JPMorgan Chase are included in Note 9 on pages 149–155 of JPMorgan Chase’s 2008 Annual Report on Form 10-K and in Note 8 on pages 126–127 of JPMorgan Chase’s Form 10-Q for the quarterly period ended June 30, 2009.
NOTE 10 – EMPLOYEE STOCK-BASED INCENTIVES Certain employees of JPMorgan Chase Bank, N.A. participate in JPMorgan Chase’s long-term stock-based incentive plans, which provide for grants of common stock-based awards, including stock options, stock-settled stock appreciation rights, and restricted stock units (“RSUs”). For a discussion of the accounting policies and other information relating to employee stock-based compensation, see Note 11 on pages 34–37 of JPMorgan Chase Bank, N.A.’s 2008 Annual Financial Statements and Note 10 on pages 155–157 of JPMorgan Chase’s 2008 Annual Report on Form 10-K.
JPMorgan Chase Bank, N.A. recognized stock-based incentive compensation expense of $609 million and $451 million for the quarters ended June 30, 2009 and 2008, respectively, and $1.0 billion and $879 million in the first six months of 2009 and 2008, respectively, in its Consolidated Statements of Income. These amounts included an accrual for the estimated cost of stock awards to be granted to full-career eligible employees of $120 million and $94 million for the

37
quarters ended June 30, 2009 and 2008, respectively, and $210 million and $183 million in the first six months of 2009 and 2008, respectively.
In the first quarter of 2009, JPMorgan Chase granted 88 million RSUs to employees of JPMorgan Chase Bank, N.A. with a grant date fair value of $19.49 per RSU in connection with its annual incentive grant.
NOTE 11 – NONINTEREST EXPENSE Merger costs Costs associated with the Bear Stearns merger and the Washington Mutual transactions are reflected in the merger costs caption of the Consolidated Statements of Income. For a further discussion of the Bear Stearns merger and the Washington Mutual transaction, see Note 3 on page 9 of these Consolidated Financial Statements. A summary of merger-related costs is shown in the following table.
Three months ended June 30, 2009 (in millions) Bear Stearns Washington Mutual Total 2008 Expense category Compensation(a) $ (1) $ 77 $ 76 $ 6 Occupancy(a) (4) 18 14 — Technology and communications and other(a) (2) 53 51 13 Total(b)(c) $ (7) $ 148 $ 141 $ 19 Six months ended June 30, 2009 (in millions) Bear Stearns Washington Mutual Total 2008 Expense category Compensation(a) $ (1) $ 213 $ 212 $ 6 Occupancy(a) (4) 23 19 — Technology and communications and other(a) (2) 88 86 13 Total(b)(c) $ (7) $ 324 $ 317 $ 19 (a) Represents partial reversals of merger costs accrued in prior periods. (b) With the exception of occupancy- and technology-related write-offs, all of the costs in the table required the expenditure of cash. (c) 2008 Merger Activity is related to Bear Stearns only.
The table below shows the change in the merger reserve balance related to the costs associated with the transactions.
Six months ended June 30, 2009 (in millions) Bear Stearns Washington Mutual Total 2008 Merger reserve balance, beginning of period $ 64 $ 441 $ 505 $ — Recorded as merger costs (7) 324 317 19 Utilization of merger reserve (55) (564) (619) (19) Merger reserve balance, end of period(a) $ 2 $ 201 $ 203 $ — (a) 2008 Merger Activity is related to Bear Stearns only.
The following table presents the components of noninterest expense. Three months ended June 30, Six months ended June 30, (in millions) 2009 2008 2009 2008 Compensation expense $ 5,188 $ 5,277 $ 11,134 $ 8,725 Noncompensation expense:
Occupancy expense 814 594 1,598 1,179 Technology, communications and equipment
expense 1,003 873 1,999 1,737 Professional & outside services 1,049 987 2,107 1,983 Marketing 152 135 295 285 Other expense(a) 2,880 2,039 5,018 3,638 Amortization of intangibles 152 153 302 304
Total noncompensation expense 6,050 4,781 11,319 9,126 Merger costs 141 19 317 19 Total noninterest expense $ 11,379 $ 10,077 $ 22,770 $ 17,870 (a) On May 22, 2009, the Federal Deposit Insurance Corporation (“FDIC”) announced a five basis point special assessment on each insured
depository institution’s assets minus Tier 1 capital as of June 30, 2009. The maximum amount of the special assessment for any institution is 10 basis points times such institution’s average U.S. deposits for the second quarter. The FDIC announced that the special assessment will be collected on September 30, 2009. As of June 30, 2009, JPMorgan Chase Bank, N.A. had accrued $650 million for the special assessment.

38
NOTE 12 – SECURITIES Securities are classified as AFS, held-to-maturity (“HTM”) or trading. For additional information regarding AFS and HTM securities, see Note 13 on pages 38–41 of JPMorgan Chase Bank, N.A.’s 2008 Annual Financial Statements. Trading securities are discussed in Note 6 on pages 25–34 of these Consolidated Financial Statements.
Securities gains and losses The following table presents realized gains and realized and unrealized losses that were recognized in income from AFS securities.
Three months ended June 30, Six months ended June 30, (in millions) 2009 2008 2009 2008 Realized gains $ 619 $ 358 $ 1,017 $ 492 Realized losses (191) (25) (387) (104) Net realized gains 428 333 630 388 Unrealized credit losses included in securities gains (66)(b) — (66)(b) — Net securities gains(a) $ 362 $ 333 $ 564 $ 388 (a) Proceeds from securities sold were within approximately 2% of amortized cost. (b) Includes impairment losses recognized in income for the three and six months ended June 30, 2009, on certain prime mortgage-backed securities.
The amortized cost and estimated fair value of AFS and HTM securities were as follows for the dates indicated.
June 30, 2009 December 31, 2008
(in millions) Amortized
cost
Gross unrealized
gains
Gross unrealized
losses Fair
value Amortized
cost
Gross unrealized
gains
Gross unrealized
losses Fair
value Available-for-sale debt securities Mortgage-backed securities(a):
U.S. government agencies(b) $ 179,086 $ 2,219 $ 866 $ 180,439 $ 115,198 $ 2,414 $ 227 $ 117,385Residential: Prime and Alt-A 7,540 45 1,711 5,874 8,826 4 1,935 6,895 Non-U.S. 6,555 123 244 6,434 2,233 24 182 2,075Commercial 4,738 7 510 4,235 4,623 — 684 3,939
Total mortgage-backed securities $ 197,919 $ 2,394 $ 3,331 $ 196,982 $ 130,880 $ 2,442 $ 3,028 $ 130,294
U.S. Treasury and government agencies(b) 34,850 108 370 34,588 10,323 52 97 10,278
Obligations of U.S. states and municipalities 3,174 32 70 3,136 931 13 31 913
Certificates of deposit 5,587 16 — 5,603 17,226 64 8 17,282Non-U.S. government debt
securities 16,221 162 32 16,351 8,173 173 2 8,344Corporate debt securities 47,363 518 69 47,812 9,310 256 61 9,505Asset-backed securities(a):
Credit card receivables 16,507 269 375 16,401 11,446 8 1,986 9,468Collateralized debt and loan obligations 11,637 409 547 11,499 11,847 168 820 11,195Other 1,428 25 25 1,428 748 2 107 643
Total available-for-sale debt securities $ 334,686 $ 3,933 $ 4,819 $ 333,800 $ 200,884 $ 3,178 $ 6,140 $ 197,922
Available-for-sale equity securities 735 57 3 789 1,794 1 7 1,788
Total available-for-sale securities $ 335,421 $ 3,990 $ 4,822 $ 334,589 $ 202,678 $ 3,179 $ 6,147 $ 199,710
Total held-to-maturity securities(c) $ 29 $ 2 $ — $ 31 $ 34 $ 1 $ — $ 35
(a) Prior periods have been revised to conform to the current presentation. (b) Includes total U.S. government-sponsored enterprise obligations with fair values of $171.6 billion and $120.1 billion at June 30, 2009, and
December 31, 2008, respectively, which were predominantly mortgage-related. (c) Consists primarily of mortgage-backed securities issued by U.S. government-sponsored enterprises.

39
Securities impairment The following tables present the fair value and gross unrealized losses for AFS securities by aging category at June 30, 2009, and December 31, 2008.
Securities with gross unrealized losses Less than 12 months 12 months or more Total Gross Gross Total gross Fair unrealized Fair unrealized fair unrealized June 30, 2009 (in millions) value losses value losses value losses Available-for-sale debt securities Mortgage-backed securities:
U.S. government agencies $ 90,016 $ 848 $ 1,243 $ 18 $ 91,259 $ 866 Residential: Prime and Alt-A 2,626 375 2,757 1,336 5,383 1,711 Non-U.S. 1,964 244 — — 1,964 244
Commercial 3,880 510 — — 3,880 510 Total mortgage-backed securities 98,486 1,977 4,000 1,354 102,486 3,331 U.S. Treasury and government agencies 16,359 370 — — 16,359 370 Obligations of U.S. states and municipalities 1,601 67 25 3 1,626 70 Certificates of deposit — — — — — — Non-U.S. government debt securities 2,013 32 — — 2,013 32 Corporate debt securities 6,741 55 1,108 14 7,849 69 Asset-backed securities:
Credit card receivables 592 29 4,668 346 5,260 375 Collateralized debt and loan obligations 6,755 239 3,993 308 10,748 547 Other — — 576 25 576 25
Total available-for-sale debt securities 132,547 2,769 14,370 2,050 146,917 4,819 Available-for-sale equity securities 3 3 — — 3 3 Total securities with gross unrealized losses $ 132,550 $ 2,772 $ 14,370 $ 2,050 $ 146,920 $ 4,822 Securities with gross unrealized losses Less than 12 months 12 months or more Total Gross Gross Total gross Fair unrealized Fair unrealized fair unrealized December 31, 2008 (in millions) value losses value losses value losses Available-for-sale debt securities Mortgage-backed securities(a):
U.S. government agencies $ 6,016 $ 224 $ 469 $ 3 $ 6,485 $ 227 Residential Prime and Alt-A 6,254 1,838 333 97 6,587 1,935 Non-U.S. 1,908 182 — — 1,908 182 Commercial 3,939 684 — — 3,939 684
Total mortgage-backed securities 18,117 2,928 802 100 18,919 3,028 U.S. Treasury and government agencies(a) 7,659 97 — — 7,659 97 Obligations of U.S. states and municipalities 312 25 16 6 328 31 Certificates of deposit 382 8 — — 382 8 Non-U.S. government debt securities 308 1 74 1 382 2 Corporate debt securities 532 54 30 7 562 61 Asset-backed securities(a):
Credit card receivables 8,191 1,792 282 194 8,473 1,986 Collateralized debt and loan obligations 9,059 820 — — 9,059 820 Other 558 106 17 1 575 107
Total available-for-sale debt securities 45,118 5,831 1,221 309 46,339 6,140 Available-for-sale equity securities 19 7 — — 19 7 Total securities with gross unrealized losses $ 45,137 $ 5,838 $ 1,221 $ 309 $ 46,358 $ 6,147 (a) Prior periods have been revised to conform to the current presentation.

40
Other-than-temporary impairment In April 2009, the FASB amended the other-than-temporary impairment (“OTTI”) model for debt securities. The impairment model for equity securities was not affected. Under the new guidance, OTTI loss must be recognized in earnings if an investor has the intent to sell the debt security, or if it is more likely than not, will be required to sell the debt security before recovery of its amortized cost basis. However, even if an investor does not expect to sell a debt security, it must evaluate expected cash flows to be received and determine if a credit loss exists. In the event of a credit loss, only the amount of impairment associated with the credit loss is recognized in income. Amounts relating to factors other than credit losses are recorded in OCI. The guidance also requires additional disclosures regarding the calculation of credit losses, as well as factors considered in reaching a conclusion that an investment is not other-than-temporarily impaired. JPMorgan Chase Bank, N.A. early adopted the new guidance effective for the period ending March 31, 2009. AFS securities in unrealized loss positions are analyzed as part of JPMorgan Chase Bank, N.A.’s ongoing assessment of OTTI. When JPMorgan Chase Bank, N.A. intends to sell AFS securities, it recognizes an impairment loss equal to the full difference between the amortized cost basis and the fair value of those securities. When JPMorgan Chase Bank, N.A. does not intend to sell AFS equity or debt securities in an unrealized loss position, potential OTTI is considered using a variety of factors, including the length of time and extent to which the market value has been less than cost; adverse conditions specifically related to the industry, geographic area or financial condition of the issuer or underlying collateral of a security; payment structure of the security; changes to the rating of the security by a rating agency; the volatility of the fair value changes, and changes in fair value of the security after the balance sheet date. For debt securities, JPMorgan Chase Bank, N.A. estimates cash flows over the remaining lives of the underlying collateral to assess whether credit losses exist, and, where applicable under EITF Issue 99-20, to determine if any adverse changes in cash flows have occurred. JPMorgan Chase Bank, N.A.’s cash flow estimates take into account expectations of relevant market and economic data as of the end of the reporting period – including, for example, for securities issued in a securitization, underlying loan-level data, and structural features of the securitization, such as subordination, excess spread, overcollateralization or other forms of credit enhancement. JPMorgan Chase Bank, N.A. compares the losses projected for the underlying collateral (“pool losses”) against the level of credit enhancement in the securitization structure to determine whether these features are sufficient to absorb the pool losses, or whether a credit loss on the AFS debt security exists. JPMorgan Chase Bank, N.A. also performs other analyses to support its cash flow projections, such as first-loss analyses or stress scenarios. For debt securities, JPMorgan Chase Bank, N.A. considers a decline in fair value to be other-than-temporary when JPMorgan Chase Bank, N.A. does not expect to recover the entire amortized cost basis of the security, including, as applicable under EITF Issue 99-20, when an adverse change in cash flows has occurred. JPMorgan Chase Bank, N.A. applies EITF Issue 99-20 to beneficial interests in securitizations that are rated below “AA” at acquisition, or that can be contractually prepaid or otherwise settled in such a way that JPMorgan Chase Bank, N.A. would not recover substantially all of its recorded investment. For equity securities, JPMorgan Chase Bank, N.A. considers the above factors, as well as JPMorgan Chase Bank, N.A.’s intent and ability to retain its investment for a period of time sufficient to allow for any anticipated recovery in market value, and whether evidence exists to support a realizable value equal to or greater than the carrying value. JPMorgan Chase Bank, N.A. considers a decline in fair value of AFS equity securities to be other-than-temporary if it is probable that JPMorgan Chase Bank, N.A. will not recover its amortized cost basis. The following table presents unrealized losses that are included in securities gains and losses above.
June 30, 2009 (in millions) Three months ended Six months ended Debt securities JPMorgan Chase Bank, N.A. does not intend to sell with credit losses Total unrealized losses $ (676) $ (676) Unrealized losses not related to credit 610 610 Unrealized credit losses recognized in income(a) (66) (66) Unrealized losses recognized in income on debt securities JPMorgan Chase Bank, N.A. intends to sell — — Total unrealized losses recognized in income $ (66) $ (66) (a) Represents the credit loss component of certain prime mortgage-backed securities that JPMorgan Chase Bank, N.A. does not intend to sell.

41
Since the first quarter of 2008, JPMorgan Chase Bank, N.A. has increased its investment securities positions. Many of these securities were purchased at discounts to par, given the significant liquidity constraints in the market. The timing and prices at which JPMorgan Chase Bank, N.A. acquired its investments have resulted in the majority of unrealized losses existing for less than 12 months. Based on the analyses described above, which have been applied to these securities, JPMorgan Chase Bank, N.A. believes that the unrealized losses that it does not consider to be other-than-temporary result from liquidity conditions in the current market environment. As of June 30, 2009, JPMorgan Chase Bank, N.A. does not intend to sell the securities with a loss position in AOCI, and it is not likely that JPMorgan Chase Bank, N.A. will be required to sell these securities before recovery of their amortized cost basis. As a result, except for the securities reported in the table above for which credit losses have been recognized in income, JPMorgan Chase Bank, N.A. believes that the securities with an unrealized loss in AOCI are not other-than-temporarily impaired as of June 30, 2009.
Following is a description of JPMorgan Chase Bank, N.A.’s main security investments and the key assumptions used in its estimate of the present value of the cash flows most likely to be collected from those investments.
Mortgage-backed securities – U.S. government agencies As of June 30, 2009, gross unrealized losses on mortgage-backed securities related to U.S. agencies were $866 million, of which $18 million related to securities that have been in an unrealized loss position for longer than 12 months. These mortgage-backed securities do not have any credit losses, given the explicit and implicit guarantees provided by the U.S. federal government.
Mortgage-backed securities – Prime and Alt-A non-agency As of June 30, 2009, gross unrealized losses related to prime and Alt-A mortgage-backed securities issued by private issuers were $1.7 billion, of which $1.3 billion related to securities that have been in an unrealized loss position for longer than 12 months. Approximately one-third of these positions are currently rated “AAA.” Approximately half of the amortized cost of the investments in prime and Alt-A mortgage-backed securities have experienced downgrades and approximately one-third of the amortized cost of investments in prime and Alt-A mortgage-backed securities are currently rated below investment grade. Despite the downgrades experienced, the portfolio generally continues to possess credit enhancement levels sufficient to support JPMorgan Chase Bank, N.A.’s investment. However, JPMorgan Chase Bank, N.A. has recognized $66 million of OTTIs in earnings for securities that have experienced increased delinquency rates associated with specific collateral types and origination dates. In analyzing prime and Alt-A residential mortgage-backed securities for potential credit losses, the key inputs to JPMorgan Chase Bank, N.A.’s cash flow projections were estimated peak-to-trough home price declines of up to 44% and an unemployment rate of 10.3%. JPMorgan Chase Bank, N.A.’s cash flow projections assumed liquidation rates of 75% to 100% and loss severities of 45% to 55%, depending on the underlying collateral type and seasoning.
Mortgage-backed securities – Commercial As of June 30, 2009, gross unrealized losses related to commercial mortgage-backed securities were $510 million; none of the losses related to securities that were in an unrealized loss position for longer than 12 months. Substantially all of JPMorgan Chase Bank, N.A.’s commercial mortgage-backed securities are rated “AAA” and possess, on average, 27% subordination (a form of credit enhancement for the benefit of senior securities, expressed here as the percentage of pool losses that can occur before an asset-backed security will incur its first dollar of principal loss). In considering whether potential credit-related losses exist, JPMorgan Chase Bank, N.A. conducted a scenario analysis, using high levels of delinquencies and losses over the near term, followed by lower levels over the long term. Specific assumptions included: (i) all loans more than 60 days delinquent will default; (ii) additional default rates for the remaining portfolio forecasted to be up to 8% in the near term and 2% in the long term; and (iii) loss severity assumptions ranging from 45% in the near term to 40% in later years.

42
Asset-backed securities – Credit card receivables As of June 30, 2009, gross unrealized losses related to credit card receivables asset-backed securities were $375 million, of which $346 million of the losses related to securities that were in an unrealized loss position for longer than 12 months. The $375 million of unrealized losses related to credit card–related asset-backed securities was due to purchased credit card–related asset-backed securities. The credit card–related asset-backed securities include “AAA,” “AA,” “A” and “BBB” ratings. One of the key metrics JPMorgan Chase Bank, N.A. reviews for credit card-related asset-backed securities is each trust’s excess spread – which is the credit enhancement resulting from cash that remains each month after payments are made to investors for principal and interest, and to servicers for servicing fees, and after credit losses are allocated. The average excess spread for the issuing trusts in which JPMorgan Chase Bank, N.A. holds interests ranges from 1% to 6%. JPMorgan Chase Bank, N.A. uses internal models to project the cash flows that impact excess spread. For retained interests, JPMorgan Chase Bank, N.A. uses its own underlying loan data as well as available market benchmarks. For purchased investments, JPMorgan Chase Bank, N.A. uses available market benchmarks and trends to support the assumptions used in the projections. In analyzing potential credit losses, the primary assumptions are underlying charge-off rates, which range from 9% to 16% (charge-off rates consider underlying assumptions such as unemployment rates and roll rates), payment rates of 11% to 22%, and portfolio yields of 14% to 24%.
Asset-backed securities – Collateralized debt and loan obligations As of June 30, 2009, gross unrealized losses related to collateralized debt and loan obligations were $547 million, of which $308 million related to securities that were in an unrealized loss position for longer than 12 months. Substantially all of these securities are rated “AAA” and have an average of 28% credit enhancement. Credit enhancement in collateralized loan obligations (“CLOs”) is mainly composed of overcollateralization – the excess of the par amount of collateral over the par amount of securities. The key assumptions considered in analyzing potential credit losses were underlying loan and debt security defaults and loss severity. Based on current default trends, JPMorgan Chase Bank, N.A. assumed collateral default rates of 15% in 2009, 12% in 2010 and 5% thereafter. Further, loss severities were assumed to be 50% for loans and 80% for debt securities. Losses on collateral were estimated to occur approximately 18 months after default.

43
Contractual maturities and yields The following table presents the amortized cost and estimated fair value at June 30, 2009, of JPMorgan Chase Bank, N.A.’s AFS and HTM securities by contractual maturity. June 30, 2009
By remaining maturity (in millions)
Due in one year or less
Due after one year through
five years
Due after five years through
ten years Due after
ten years(c) Total Available-for-sale debt securities Mortgage-backed securities(b)
Amortized cost $ 19 $ 1,281 $ 8,467 $ 188,152 $ 197,919 Fair value 20 1,306 7,998 187,658 196,982 Average yield(a) 4.28% 3.06% 4.33% 4.76% 4.73%
U.S. Treasury and government agencies(b) Amortized cost $ 452 $ 26,141 $ 8,028 $ 229 $ 34,850 Fair value 452 26,176 7,734 226 34,588 Average yield(a) 0.06% 2.42% 3.48% 5.95% 2.66%
Obligations of U.S. states and municipalities Amortized cost $ — $ 15 $ 292 $ 2,867 $ 3,174 Fair value — 15 290 2,831 3,136 Average yield(a) —% 0.44% 5.30% 4.64% 4.68%
Certificates of deposit Amortized cost $ 5,587 $ — $ — $ — $ 5,587 Fair value 5,603 — — — 5,603 Average yield(a) 2.92% —% —% —% 2.92%
Non-U.S. government debt securities Amortized cost $ 5,015 $ 8,160 $ 897 $ 2,149 $ 16,221 Fair value 5,024 8,286 890 2,151 16,351 Average yield(a) 1.53% 2.57% 3.73% 2.29% 2.28%
Corporate debt securities Amortized cost $ 3,470 $ 43,078 $ 603 $ 212 $ 47,363 Fair value 3,532 43,446 618 216 47,812 Average yield(a) 2.42% 2.47% 6.28% 6.94% 2.53%
Asset-backed securities Amortized cost $ 7,113 $ 8,907 $ 8,432 $ 5,120 $ 29,572 Fair value 7,163 8,765 8,277 5,123 29,328 Average yield(a) 2.14% 1.92% 1.87% 2.19% 2.01%
Total available-for-sale debt securities Amortized cost $ 21,656 $ 87,582 $ 26,719 $ 198,729 $ 334,686 Fair value 21,794 87,994 25,807 198,205 333,800 Average yield(a) 2.20% 2.42% 3.33% 4.67% 3.81%
Available-for-sale equity securities Amortized cost $ — $ — $ — $ 735 $ 735 Fair value — — — 789 789 Average yield(a) —% —% —% 0.61% 0.61%
Total available-for-sale securities Amortized cost $ 21,656 $ 87,582 $ 26,719 $ 199,464 $ 335,421 Fair value 21,794 87,994 25,807 198,994 334,589 Average yield(a) 2.20% 2.42% 3.33% 4.66% 3.81%
Total held-to-maturity securities
Amortized cost $ — $ — $ 27 $ 2 $ 29 Fair value — — 29 2 31 Average yield(a) —% —% 6.88% 6.47% 6.85%
(a) The average yield was based on amortized cost balances at the end of the period and does not give effect to changes in fair value that are reflected in accumulated other comprehensive income (loss). Yields are derived by dividing interest/dividend/income (including the effect of related derivatives on available-for-sale securities and the amortization of premiums and accretion of discounts) by total amortized cost. Taxable-equivalent yields are used where applicable.
(b) U.S. government agencies and U.S. government-sponsored enterprises were the only issuers whose securities exceeded 10% of JPMorgan Chase Bank, N.A.’s total stockholder’s equity at June 30, 2009.
(c) Includes securities with no stated maturity. Substantially all of JPMorgan Chase Bank, N.A.’s mortgage-backed securities and collateralized mortgage obligations are due in 10 years or more, based on contractual maturity. The estimated duration, which reflects anticipated future prepayments based on a consensus of dealers in the market, is approximately five years for nonagency mortgage-backed securities and three years for collateralized mortgage obligations.
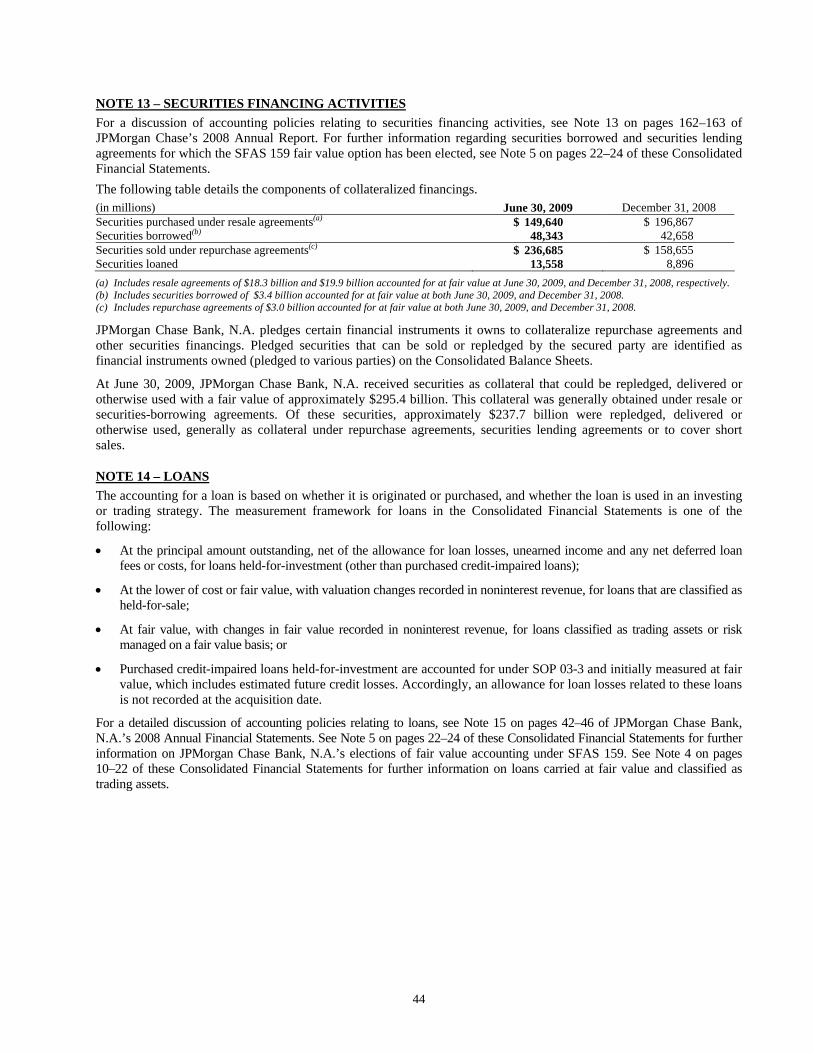
44
NOTE 13 – SECURITIES FINANCING ACTIVITIES For a discussion of accounting policies relating to securities financing activities, see Note 13 on pages 162–163 of JPMorgan Chase’s 2008 Annual Report. For further information regarding securities borrowed and securities lending agreements for which the SFAS 159 fair value option has been elected, see Note 5 on pages 22–24 of these Consolidated Financial Statements. The following table details the components of collateralized financings. (in millions) June 30, 2009 December 31, 2008 Securities purchased under resale agreements(a) $ 149,640 $ 196,867 Securities borrowed(b) 48,343 42,658 Securities sold under repurchase agreements(c) $ 236,685 $ 158,655 Securities loaned 13,558 8,896 (a) Includes resale agreements of $18.3 billion and $19.9 billion accounted for at fair value at June 30, 2009, and December 31, 2008, respectively. (b) Includes securities borrowed of $3.4 billion accounted for at fair value at both June 30, 2009, and December 31, 2008. (c) Includes repurchase agreements of $3.0 billion accounted for at fair value at both June 30, 2009, and December 31, 2008.
JPMorgan Chase Bank, N.A. pledges certain financial instruments it owns to collateralize repurchase agreements and other securities financings. Pledged securities that can be sold or repledged by the secured party are identified as financial instruments owned (pledged to various parties) on the Consolidated Balance Sheets.
At June 30, 2009, JPMorgan Chase Bank, N.A. received securities as collateral that could be repledged, delivered or otherwise used with a fair value of approximately $295.4 billion. This collateral was generally obtained under resale or securities-borrowing agreements. Of these securities, approximately $237.7 billion were repledged, delivered or otherwise used, generally as collateral under repurchase agreements, securities lending agreements or to cover short sales.
NOTE 14 – LOANS The accounting for a loan is based on whether it is originated or purchased, and whether the loan is used in an investing or trading strategy. The measurement framework for loans in the Consolidated Financial Statements is one of the following:
• At the principal amount outstanding, net of the allowance for loan losses, unearned income and any net deferred loan fees or costs, for loans held-for-investment (other than purchased credit-impaired loans);
• At the lower of cost or fair value, with valuation changes recorded in noninterest revenue, for loans that are classified as held-for-sale;
• At fair value, with changes in fair value recorded in noninterest revenue, for loans classified as trading assets or risk managed on a fair value basis; or
• Purchased credit-impaired loans held-for-investment are accounted for under SOP 03-3 and initially measured at fair value, which includes estimated future credit losses. Accordingly, an allowance for loan losses related to these loans is not recorded at the acquisition date.
For a detailed discussion of accounting policies relating to loans, see Note 15 on pages 42–46 of JPMorgan Chase Bank, N.A.’s 2008 Annual Financial Statements. See Note 5 on pages 22–24 of these Consolidated Financial Statements for further information on JPMorgan Chase Bank, N.A.’s elections of fair value accounting under SFAS 159. See Note 4 on pages 10–22 of these Consolidated Financial Statements for further information on loans carried at fair value and classified as trading assets.

45
The composition of JPMorgan Chase Bank, N.A.’s aggregate loan portfolio at each of the dates indicated was as follows.
(in millions) June 30, 2009 December 31, 2008 U.S. wholesale loans: Commercial and industrial $ 57,232 $ 66,592 Real estate 61,295 63,944 Financial institutions 17,648 19,902 Government agencies 4,680 4,725 Other 23,353 20,883 Loans held-for-sale and at fair value 1,745 3,225
Total U.S. wholesale loans 165,953 179,271 Non-U.S. wholesale loans: Commercial and industrial 23,516 27,168 Real estate 2,875 2,673 Financial institutions 10,190 16,413 Government agencies 488 403 Other 16,806 18,516 Loans held-for-sale and at fair value 4,391 8,743
Total non-U.S. wholesale loans 58,266 73,916 Total wholesale loans: Commercial and industrial 80,748 93,760 Real estate(a) 64,170 66,617 Financial institutions 27,838 36,315 Government agencies 5,168 5,128 Other 40,159 39,399 Loans held-for-sale and at fair value(b) 6,136 11,968
Total wholesale loans 224,219 253,187 Total consumer loans: Home equity 108,229 114,335 Prime mortgage 62,173 72,168 Subprime mortgage 13,821 15,326 Option ARMs 5,095 9,018 Auto loans 42,887 42,603 Credit card(c) 19,814 31,141 Other 33,021 33,693 Loans held-for-sale(d) 1,940 2,028
Total consumer loans – excluding purchased credit-impaired loans 286,980 320,312 Consumer loans – purchased credit-impaired loans 85,406 88,813
Total consumer loans 372,386 409,125 Total loans(e) $ 596,605 $ 662,312 (a) Represents credits extended for real estate–related purposes to borrowers who are primarily in the real estate development or investment
businesses, and for which repayment is predominantly from the sale, lease, management, operations or refinancing of the property. (b) Includes loans for commercial & industrial, real estate, financial institutions and other of $4.7 billion, $334 million, $631 million and $458
billion, respectively, at June 30, 2009, and $9.2 billion, $423 million, $1.4 billion and $995 million, respectively, at December 31, 2008, (c) Includes billed finance charges and fees net of an allowance for uncollectible amounts. (d) Includes loans for prime mortgage and other (largely student loans) of $589 million and $1.4 billion, respectively, at June 30, 2009, and $206
million and $1.8 billion, respectively, at December 31, 2008. (e) Loans (other than purchased loans and those for which the SFAS 159 fair value option has been elected) are presented net of $147 million and
$152 million of net deferred loan costs and unearned income at June 30, 2009, and December 31, 2008, respectively.
The following table reflects information about JPMorgan Chase Bank, N.A.’s loan sales. Three months ended June 30, Six months ended June 30, (in millions) 2009 2008 2009 2008 Net gains/(losses) on sales of loans (including lower of cost
or fair value adjustments)(a) $ 278 $ (428) $ 4 $(1,067) (a) Excludes sales related to loans accounted for at fair value.

46
Purchased credit-impaired loans In connection with the Washington Mutual transaction, JPMorgan Chase Bank, N.A. acquired certain loans that it deemed to be credit-impaired under SOP 03-3. For a detailed discussion of purchased credit-impaired loans, including accounting policies, see Note 15 on pages 42–46 of JPMorgan Chase Bank, N.A.’s 2008 Annual Financial Statements. Purchased credit-impaired loans are reported in loans on JPMorgan Chase Bank, N.A.’s Consolidated Balance Sheets. The allowance for loan losses, if required, would be reported as a reduction of the carrying amount of the loans. No allowance for loan losses has been recorded for these loans as of June 30, 2009. The outstanding balance and the carrying amount of the purchased credit-impaired consumer loans were as follows. (in millions) June 30, 2009 December 31, 2008 Outstanding balance(a) $ 110,793 $ 118,180 Carrying amount 85,406 88,813 (a) Represents the sum of contractual principal, interest and fees earned at the reporting date.
The accretable yield represents the excess of cash flows expected to be collected over the fair value of the purchased credit-impaired loans. This amount is not reported on JPMorgan Chase Bank, N.A.’s Consolidated Balance Sheets, but is accreted into interest income at a level rate of return over the expected lives of the underlying loans. For variable rate loans, expected future cash flows were initially based on the rate in effect at acquisition; expected future cash flows are recalculated as rates change over the lives of the loans.
The table below sets forth the accretable yield activity for purchased credit-impaired consumer loans for the three and six months ended June 30, 2009.
Accretable yield activity (in millions) Three months ended June 30, 2009 Six months ended June 30, 2009(a) Balance at the beginning of the period $ 29,114 $ 32,619
Accretion into interest income (1,106) (2,365) Changes in interest rates on variable-rate loans (1,045) (3,291)
Balance, June 30, 2009 $ 26,963 $ 26,963 (a) During the first quarter of 2009, JPMorgan Chase Bank, N.A. continued to refine its model to estimate future cash flows for its purchased credit-
impaired consumer loans, which resulted in an adjustment of the initial estimate of cash flows expected to be collected. These refinements, which primarily affected the amount of undiscounted-interest cash flows expected to be received over the life of the loans, resulted in a $6.1 billion increase in cash flows expected to be collected. However, on a discounted basis, these refinements did not have a material impact on the fair value of the purchased credit-impaired loans as of the September 25, 2008, acquisition date; nor did they have a material impact on the amount of interest income recognized in JPMorgan Chase Bank, N.A.’s Consolidated Statements of Income since that date.
Other impaired loans For a detailed discussion of impaired loans, including types of impaired loans, certain troubled debt restructurings and accounting policies relating to the interest income on these loans, see Note 15 on pages 42–46 of JPMorgan Chase Bank, N.A.’s 2008 Annual Financial Statements.
The tables below set forth information about JPMorgan Chase Bank, N.A.’s impaired loans, excluding credit card loans, which are discussed below. JPMorgan Chase Bank, N.A. primarily uses the discounted cash flow method for valuing impaired loans.
(in millions) June 30, 2009 December 31, 2008 Impaired loans with an allowance:
Wholesale $ 5,246 $ 1,999 Consumer(a) 3,751 2,252
Total impaired loans with an allowance 8,997 4,251 Impaired loans without an allowance:(b)
Wholesale 262 62 Consumer(a) — —
Total impaired loans without an allowance 262 62 Total impaired loans $ 9,259 $ 4,313 Allowance for impaired loans under SFAS 114:
Wholesale $ 2,108 $ 712 Consumer(a) 801 379
Total allowance for impaired loans under SFAS 114(c) $ 2,909 $ 1,091

47
Three months ended June 30, Six months ended June 30, (in millions) 2009 2008 2009 2008 Average balance of impaired loans during the period:
Wholesale $ 4,344 $ 747 $ 3,609 $ 683 Consumer(a) 3,479 962 3,042 837 Total impaired loans $ 7,823 $ 1,709 $ 6,651 $ 1,520
Interest income recognized on impaired loans during the period:
Wholesale $ — $ — $ — $ — Consumer(a) 37 13 67 21 Total interest income recognized on impaired loans during the period $ 37 $ 13 $ 67 $ 21
(a) Excludes credit card loans. (b) When the discounted cash flows, collateral value or market price equals or exceeds the carrying value of the loan, then the loan does not require
an allowance under SFAS 114. (c) The allowance for impaired loans under SFAS 114 is included in JPMorgan Chase Bank, N.A.’s allowance for loan losses. The allowance for
certain consumer-impaired loans has been categorized in the allowance for loan losses as formula-based.
Included in the table above are consumer loans, excluding credit card loans, that have been modified in a troubled debt restructuring, with balances of approximately $3.1 billion and $1.8 billion as of June 30, 2009, and December 31, 2008, respectively. For detailed discussion of modification of the terms of credit card loan agreements, see Note 15 on pages 42–46 of JPMorgan Chase Bank, N.A.’s 2008 Annual Financial Statements. At June 30, 2009, and December 31, 2008, JPMorgan Chase Bank, N.A. modified $946 million and $842 million, respectively, of on–balance sheet credit card loans outstanding.
During the first quarter of 2009, the U.S. Treasury introduced the Making Home Affordable Plan (“MHA”), which includes programs designed to assist eligible homeowners by modifying the terms of their mortgages. JPMorgan Chase Bank, N.A. is participating in MHA while continuing to expand its other loss-mitigation efforts for financially stressed borrowers who do not qualify for the MHA programs. MHA and JPMorgan Chase Bank, N.A.’s other loss mitigation programs generally represent various forms of term extensions, rate reductions and forbearances provided to financially troubled borrowers. Under these programs, borrowers must make three payments during a 90-day trial modification period and be successfully re-underwritten with income verification, before their loan is officially deemed to be modified. Upon formal modification, the loan is generally accounted for as a troubled debt restructuring. For purchased credit-impaired loans, the impact of the modification is incorporated into JPMorgan Chase Bank, N.A.’s quarterly assessment of whether a probable and/or significant change in estimated future cash flows has occurred and the loans continue to be reported as purchased credit-impaired loans. As of June 30, 2009, approximately 26,000 approved trial mortgage modifications with an unpaid principal balance of $8.3 billion were included on JPMorgan Chase Bank, N.A.’s balance sheet. Approximately $4.6 billion of these loans were included in JPMorgan Chase Bank, N.A.’s purchased credit-impaired loan portfolio.
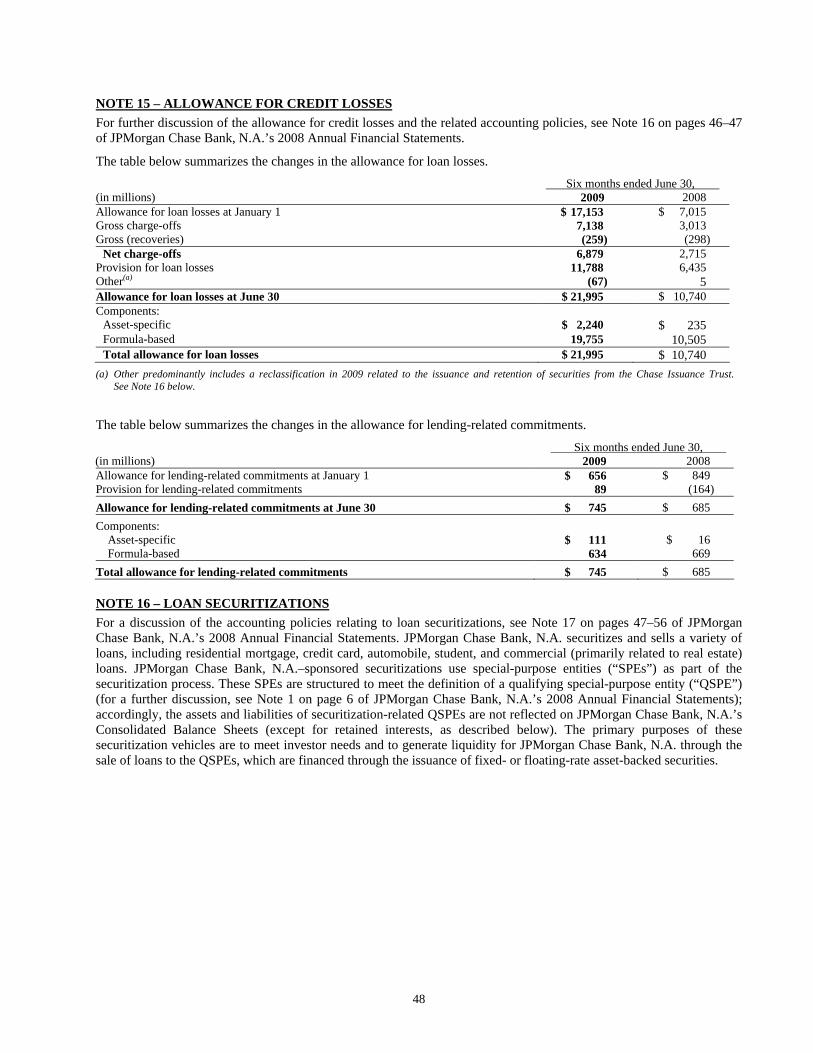
48
NOTE 15 – ALLOWANCE FOR CREDIT LOSSES For further discussion of the allowance for credit losses and the related accounting policies, see Note 16 on pages 46–47 of JPMorgan Chase Bank, N.A.’s 2008 Annual Financial Statements.
The table below summarizes the changes in the allowance for loan losses.
Six months ended June 30, (in millions) 2009 2008 Allowance for loan losses at January 1 $ 17,153 $ 7,015 Gross charge-offs 7,138 3,013 Gross (recoveries) (259) (298)
Net charge-offs 6,879 2,715 Provision for loan losses 11,788 6,435 Other(a) (67) 5 Allowance for loan losses at June 30 $ 21,995 $ 10,740 Components:
Asset-specific $ 2,240 $ 235 Formula-based 19,755 10,505 Total allowance for loan losses $ 21,995 $ 10,740
(a) Other predominantly includes a reclassification in 2009 related to the issuance and retention of securities from the Chase Issuance Trust. See Note 16 below.
The table below summarizes the changes in the allowance for lending-related commitments.
Six months ended June 30, (in millions) 2009 2008 Allowance for lending-related commitments at January 1 $ 656 $ 849 Provision for lending-related commitments 89 (164) Allowance for lending-related commitments at June 30 $ 745 $ 685 Components:
Asset-specific $ 111 $ 16 Formula-based 634 669
Total allowance for lending-related commitments $ 745 $ 685
NOTE 16 – LOAN SECURITIZATIONS For a discussion of the accounting policies relating to loan securitizations, see Note 17 on pages 47–56 of JPMorgan Chase Bank, N.A.’s 2008 Annual Financial Statements. JPMorgan Chase Bank, N.A. securitizes and sells a variety of loans, including residential mortgage, credit card, automobile, student, and commercial (primarily related to real estate) loans. JPMorgan Chase Bank, N.A.–sponsored securitizations use special-purpose entities (“SPEs”) as part of the securitization process. These SPEs are structured to meet the definition of a qualifying special-purpose entity (“QSPE”) (for a further discussion, see Note 1 on page 6 of JPMorgan Chase Bank, N.A.’s 2008 Annual Financial Statements); accordingly, the assets and liabilities of securitization-related QSPEs are not reflected on JPMorgan Chase Bank, N.A.’s Consolidated Balance Sheets (except for retained interests, as described below). The primary purposes of these securitization vehicles are to meet investor needs and to generate liquidity for JPMorgan Chase Bank, N.A. through the sale of loans to the QSPEs, which are financed through the issuance of fixed- or floating-rate asset-backed securities.

49
The following table presents the total unpaid principal amount of assets held in JPMorgan Chase Bank, N.A.–sponsored securitization entities, for which sale accounting was achieved and to which JPMorgan Chase Bank, N.A. has continuing involvement, at June 30, 2009, and December 31, 2008. Continuing involvement includes servicing the loans, holding senior or subordinated interests, recourse or guarantee arrangements and derivative transactions. In certain instances, JPMorgan Chase Bank, N.A.’s only continuing involvement is servicing the loans.
Principal amount outstanding JPMorgan Chase Bank, N.A. interest in securitized assets(e)(f)(g)(h)
June 30, 2009 (in billions)
Total assets held by JPMorgan Chase Bank, N.A.-sponsored QSPEs
Assets held in QSPEs
with continuing involvement
Trading assets(i)
AFS securities(i) Loans
Other assets(i)
Total interests held by
JPMorgan Chase Bank, N.A.
Securitization related: Credit card $ 44.6 $ 44.6(d) $ 0.2 $ 8.4 $ 3.5 $ 3.7 $ 15.8 Residential mortgage:
Prime(a) 112.8 112.7 0.1 0.6 — — 0.7 Subprime 38.4 37.0 — — — — — Option ARMs 45.3 45.3 — 0.1 — — 0.1
Commercial and other(b) 102.3 27.0 — 0.6 — — 0.6 Student loans 1.0 1.0 — — — 0.1 0.1 Auto 0.4 0.4 — — — — —
Total(c) $ 344.8 $ 268.0 $ 0.3 $ 9.7 $ 3.5 $ 3.8 $ 17.3 Principal amount outstanding JPMorgan Chase Bank, N.A. interest in securitized assets(e)(f)(g)(h)
December 31, 2008 (in billions)
Total assets held by JPMorgan Chase Bank, N.A.-sponsored QSPEs
Assets held in QSPEs
with continuing involvement
Trading assets(i)
AFS securities(i) Loans
Other assets(i)
Total interests held by
JPMorgan Chase Bank, N.A.
Securitization related: Credit card $ 41.2 $ 41.2(d) $ 0.1 $ 3.6 $ 8.4 $ 1.4 $ 13.5 Residential mortgage:
Prime(a) 122.6 122.4 0.4 0.7 — — 1.1 Subprime 43.7 42.1 — — — — — Option ARMs 48.3 48.3 0.1 0.3 — — 0.4
Commercial and other(b) 113.5 39.8 0.1 0.5 — — 0.6 Student loans 1.1 1.1 — — — 0.1 0.1 Auto 0.7 0.7 — — — — —
Total(c) $ 371.1 $ 295.6 $ 0.7 $ 5.1 $ 8.4 $ 1.5 $ 15.7
(a) Includes Alt-A loans. (b) Consists of securities backed by commercial loans (predominantly real estate) and non-mortgage-related consumer receivables purchased from
third parties. JPMorgan Chase Bank, N.A. generally does not retain a residual interest in its sponsored commercial mortgage securitization transactions. Includes co-sponsored commercial securitizations and, therefore, includes non–JPMorgan Chase Bank, N.A.-originated commercial mortgage loans.
(c) Includes securitized loans where JPMorgan Chase Bank, N.A. owns less than a majority of the subordinated or residual interests in the securitizations.
(d) Includes credit card loans, accrued interest and fees, and cash amounts on deposit. (e) Excludes retained servicing (for a discussion of MSRs, see Note 18 on pages 63–64 of these Consolidated Financial Statements). (f) Excludes senior and subordinated securities of $13 million and zero at June 30, 2009, and December 31, 2008, respectively, that JPMorgan Chase
Bank, N.A. purchased in connection with the investment banking business’ secondary market-making activities. (g) Includes investments acquired in the secondary market, but predominantly held-for-investment purposes, of $1.5 billion and $1.8 billion as of June
30, 2009, and December 31, 2008, respectively. This is comprised of $1.3 billion and $1.4 billion of investments classified as available-for-sale, including $1.2 billion and $172 million in credit cards, $19 million and $693 million of residential mortgages, and zero and $495 million of commercial and other; and $241 million and $452 million of investments classified as trading, including $156 million and $112 million of credit cards, $83 million and $303 million of residential mortgages, and $2 million and $37 million of commercial and other at June 30, 2009, and December 31, 2008, respectively.
(h) Excludes interest rate and foreign exchange derivatives primarily used to manage the interest rate and foreign exchange risks of the securitization entities. See Note 6 on pages 25–34 of these Consolidated Financial Statements for further information on derivatives.
(i) Certain of JPMorgan Chase Bank, N.A.’s retained interests are reflected at their fair values.

50
Securitization activity by major product type The following discussion describes the nature of JPMorgan Chase Bank, N.A.’s securitization activities by major product type. Credit card securitizations Overview JPMorgan Chase Bank, N.A. securitizes originated and purchased credit card loans. JPMorgan Chase Bank, N.A.’s primary continuing involvement after securitization includes servicing the receivables, retaining an undivided seller’s interest in the receivables, retaining certain senior securities and maintaining escrow accounts. JPMorgan Chase Bank, N.A. also retains a participation interest in the undivided seller’s interest in receivables and certain senior securities resulting from securitizations sponsored by an affiliate (“participating securitization”). JPMorgan Chase Bank, N.A. maintains servicing responsibilities for all credit card securitizations that it sponsors and also receives servicing fees from participating securitizations. As servicer and transferor, JPMorgan Chase Bank, N.A. receives excess servicing fees, which are recorded in credit card income as discussed in Note 7 on page 34 of these Consolidated Financial Statements. For further discussion of credit card securitizations, see Note 17 on pages 49–50 of JPMorgan Chase Bank, N.A.’s 2008 Annual Financial Statements. Actions taken in the second quarter of 2009 JPMorgan Chase Bank N.A. retains a participation interest in the undivided seller’s interest in receivables of the Chase Issuance Trust (the “Trust”), which is sponsored by an affiliate. During the quarter ended June 30, 2009, the overall performance of the Trust declined primarily due to the increase in credit losses incurred on the underlying credit card receivables. The Trust, which holds prime quality credit card receivables, maintained positive excess spread, a key metric for evaluating the performance of a credit card trust, through the first six months of 2009. However, given market uncertainty concerning projected credit costs in the credit card industry, and to mitigate any further deterioration in the performance of the Trust, certain actions were taken by the Trust’s sponsor, as permitted by the Trust agreements, to enhance the performance of the Trust. On May 12, 2009, the required credit enhancement level for each tranche of outstanding notes issued by the Trust was increased by increasing the minimum required amount of subordinated notes and the funding requirements for the Trust’s cash escrow accounts. On June 1, 2009, the Trust’s sponsor began designating as “discount receivables” a percentage of new credit card receivables for inclusion in the Trust, thereby requiring collections of such discounted receivables to be applied as finance charge collections in the Trust, which is expected to increase the excess spread for the Trust. The Trust’s sponsor expects to discontinue designating a percentage of new receivables as discount receivables on July 1, 2010. Also, during the second quarter of 2009, the sponsor of the Trust exchanged its $3.5 billion undivided seller’s interest in the Trust for $3.5 billion of zero-coupon subordinated securities issued by the Trust and retained by the sponsor of the Trust. The issuance of the zero-coupon securities by the Trust is also expected to increase the excess spread for the Trust. These actions resulted in the addition of approximately $20.0 billion of risk-weighted assets for regulatory capital purposes, which decreased JPMorgan Chase Bank, N.A.’s Tier 1 capital ratio by approximately 20 basis points, but did not have a material impact on JPMorgan Chase Bank, N.A.’s Consolidated Balance Sheets or results of operations. Retained interests in nonconsolidated credit card securitizations Following is a description of JPMorgan Chase Bank, N.A.’s retained interests in credit card securitizations at the dates presented. JPMorgan Chase Bank, N.A.’s agreement with a credit card securitization trust that it sponsors requires JPMorgan Chase Bank, N.A. to maintain a minimum undivided interest of 12%. At June 30, 2009 and December 31, 2008, JPMorgan Chase Bank, N.A. had $3.5 billion and $8.4 billion, respectively, related to its undivided interest in the trust (and participating securitizations). The undivided interest in the trust represents JPMorgan Chase Bank, N.A.’s interest in the receivables transferred to the trust that have not been securitized; the undivided interest is not represented by a security certificate, is carried at historical cost and classified within loans. JPMorgan Chase Bank, N.A. retained senior securities issued from the Trust. The senior securities totaled $7.2 billion and $3.5 billion at June 30, 2009 and December 31, 2008, respectively, and were classified as AFS securities at June 30, 2009 and December 31, 2008, respectively. The senior AFS securities were used by JPMorgan Chase Bank, N.A. as collateral for a secured financing transaction. Credit card securitizations include escrow accounts up to predetermined limits to cover deficiencies in cash flows owed to investors. Amounts in such escrow accounts were $437 million and $17 million as of June 30, 2009 and December 31, 2008, respectively. The increase in the balance of these escrow accounts primarily relates to the Trust actions described above that were taken by the Trust’s sponsor on May 12, 2009. Additionally, JPMorgan Chase Bank, N.A. has retained subordinated interests in accrued interest and fees on the securitized receivables totaling $1.5 billion and $1.2 billion as of June 30, 2009 and December 31, 2008, respectively. JPMorgan Chase Bank, N.A. has also recorded $109 million representing receivables that have been transferred by its affiliate to the Trust and designated as “discount receivables.” All of these residual interests are reported in other assets.

51
Mortgage securitizations JPMorgan Chase Bank, N.A. securitizes originated and purchased residential mortgages and originated commercial mortgages.
The retail business securitizes residential mortgage loans that it originates and purchases, and it typically retains servicing for all of its originated and purchased residential mortgage loans. Additionally, the retail business may retain servicing for certain mortgage loans purchased by the investment banking business. As servicer, JPMorgan Chase Bank, N.A. receives servicing fees based on the securitized loan balance plus ancillary fees. JPMorgan Chase Bank, N.A. also retains the right to service the residential mortgage loans it sells to Government National Mortgage Association (“GNMA”), Federal National Mortgage Association (“FNMA”) and Federal Home Loan Mortgage Corporation (“FHLMC”) in accordance with their servicing guidelines and standards. For a discussion of MSRs, see Note 18 on pages 63–64 of these Consolidated Financial Statements. In a limited number of securitizations, the retail business may retain an interest in addition to servicing rights. The amount of interest retained related to these securitizations totaled $154 million and $588 million at June 30, 2009, and December 31, 2008, respectively. These retained interests are accounted for as trading or AFS securities; the classification depends on whether the retained interest is represented by a security certificate or has an embedded derivative, and when it was retained (i.e., prior to the adoption of SFAS 155).
The investment banking business securitizes residential mortgage loans (including those that it purchased and certain mortgage loans originated by the retail business) and commercial mortgage loans that it originated. These loans are often serviced by the retail business. Upon securitization, the investment banking business may engage in underwriting and trading activities of the securities issued by the securitization trust. The investment banking business may retain unsold senior and/or subordinated interests (including residual interests) in both residential and commercial mortgage securitizations at the time of securitization. These retained interests are accounted for at fair value and classified as trading assets. Additionally, the investment banking business retained $3 million and $4 million of senior and subordinated interests as of June 30, 2009, and December 31, 2008, respectively; these securities were retained in connection with JPMorgan Chase Bank, N.A.’s underwriting activities.
In addition to the amounts reported in the securitization activity tables below, JPMorgan Chase Bank, N.A. sold residential mortgage loans totaling $40.2 billion and $39.4 billion during the three months ended June 30, 2009 and 2008, respectively, and $78.4 billion and $69.1 billion during the six months ended June 30, 2009 and 2008, respectively. The majority of these loan sales were for securitization by the GNMA, FNMA and FHLMC. These sales resulted in pretax gains (losses) of $34 million and $36 million during the three months ended June 30, 2009 and 2008, respectively, and $51 million and $26 million during the six months ended June 30, 2009 and 2008, respectively.
JPMorgan Chase Bank, N.A.’s mortgage loan sales are primarily nonrecourse, thereby effectively transferring the risk of future credit losses to the purchaser of the loans. However, for a limited number of loan sales, JPMorgan Chase Bank, N.A. is obligated to share up to 100% of the credit risk associated with the sold loans with the purchaser. See Note 25 on page 73 of these Consolidated Financial Statements for additional information on loans sold with recourse.
Other securitizations JPMorgan Chase Bank, N.A. also securitizes automobile and student loans originated by the retail business and purchased consumer loans (including automobile and student loans). JPMorgan Chase Bank, N.A. retains servicing responsibilities for all originated and certain purchased student and automobile loans. It may also hold a retained interest in these securitizations; such residual interests are classified as other assets. At June 30, 2009, and December 31, 2008, JPMorgan Chase Bank, N.A. held $17 million and $30 million, respectively, of retained interests in securitized automobile loan securitizations, and $52 million at both June 30, 2009, and December 31, 2008, respectively, of residual interests in securitized student loans.

52
Securitization activity The following tables provide information related to JPMorgan Chase Bank, N.A.’s securitization activities for the three and six months ended June 30, 2009, and 2008. For the periods presented, there were no cash flows from JPMorgan Chase Bank, N.A. to the QSPEs related to recourse or guarantee arrangements. Three months ended June 30, 2009 Residential mortgage (in millions, except for ratios and where otherwise noted) Credit card Prime(f) Subprime
Option ARMs
Commercial and other
Student loans Auto
Principal securitized $ 5,631 $ — $ — $ — $ — $ — $ — Pretax gains 8 — — — — — — All cash flows during the period: Proceeds from new securitizations $ 5,631(e)(g) $ — $ — $ — $ — $ — $ — Servicing fees collected 134 74 30 118 1 1 2 Other cash flows received(a) 11 — — — — — — Proceeds from collections reinvested in revolving
securitizations 16,511 — — — — — — Purchases of previously transferred financial
assets (or the underlying collateral)(b) — 35 — 10 — — — Cash flows received on the interests that continue
to be held by JPMorgan Chase Bank, N.A.(c) 48 184 1 16 22 3 3 Key assumptions used to measure retained
interests originated during the year (rates per annum):
Prepayment rate(d) 16.7% PPR Weighted-average life (in years) 0.5 Expected credit losses 8.7% Discount rate 18.0% Three months ended June 30, 2008 Residential mortgage (in millions, except for ratios and where otherwise noted) Credit card Prime(f) Subprime
Option ARMs
Commercial and other
Student loans Auto
Principal securitized $ 4,304 $ — $ — $ — $ 662 $ — $ — Pretax gains 38 — — — — — — All cash flows during the period: Proceeds from new securitizations $ 4,304(e) $ — $ — $ — $ 632 $ — $ — Servicing fees collected 112 23 25 — 2 2 3 Other cash flows received(a) 516 — — — — — — Proceeds from collections reinvested in revolving
securitizations 15,877 — — — — — — Purchases of previously transferred financial
assets (or the underlying collateral)(b) — 100 2 — — — — Cash flows received on the interests that continue
to be held by JPMorgan Chase Bank, N.A.(c) — 83 2 — 21 — 8 Key assumptions used to measure retained
interests originated during the year (rates per annum):
Prepayment rate(d) 19.7% PPR Weighted-average life (in years) 0.4 Expected credit losses 4.5% Discount rate 13.0%

53
Six months ended June 30, 2009 Residential mortgage (in millions, except for ratios and where otherwise noted) Credit card Prime(f) Subprime
Option ARMs
Commercial and other
Student loans Auto
Principal securitized $ 9,324 $ — $ — $ — $ — $ — $ — Pretax gains 8 — — — — — — All cash flows during the period: Proceeds from new securitizations $ 9,324(e)(g) $ — $ — $ — $ — $ — $ — Servicing fees collected 262 153 62 246 8 2 3 Other cash flows received(a) 423 — — — — — — Proceeds from collections reinvested in revolving
securitizations 33,818 — — — — — — Purchases of previously transferred financial
assets (or the underlying collateral)(b) — 76 — 13 — — 89 Cash flows received on the interests that continue
to be held by JPMorgan Chase Bank, N.A.(c) 92 309 2 64 130 3 10 Key assumptions used to measure retained
interests originated during the year (rates per annum):
Prepayment rate(d) 16.7% PPR Weighted-average life (in years) 0.5 Expected credit losses 8.7% Discount rate 18.0%
Six months ended June 30, 2008 Residential mortgage (in millions, except for ratios and where otherwise noted) Credit card Prime(f) Subprime
Option ARMs
Commercial and other
Student loans Auto
Principal securitized $ 6,122 $ — $ — $ — $ 662 $ — $ — Pretax gains 54 — — — — — — All cash flows during the period: Proceeds from new securitizations $ 6,122(e) $ — $ — $ — $ 632 $ — $ — Servicing fees collected 220 46 51 — 3 2 7 Other cash flows received(a) 1,086 — — — — — — Proceeds from collections reinvested in revolving
securitizations 30,960 — — — — — — Purchases of previously transferred financial
assets (or the underlying collateral)(b) — 149 13 — — — 97 Cash flows received on the interests that continue
to be held by JPMorgan Chase Bank, N.A.(c) — 126 3 — 80 — 18 Key assumptions used to measure retained
interests originated during the year (rates per annum):
Prepayment rate(d) 19.7% PPR Weighted-average life (in years) 0.4 Expected credit losses 4.4% Discount rate 12.7%
(a) Includes excess servicing fees and other ancillary fees received. (b) Includes cash paid by JPMorgan Chase Bank, N.A. to reacquire assets from the QSPEs – for example, servicer clean-up calls. (c) Includes cash flows received on retained interests including, for example, principal repayments and interest payments. (d) PPR: principal payment rate. (e) Includes zero and $3.5 billion of securities retained by JPMorgan Chase Bank, N.A. for the three and six months ended June 30, 2009,
respectively. No securities were retained by JPMorgan Chase Bank, N.A. for both the three and six months ended June 30, 2008. (f) Includes Alt-A loans. (g) As required under the terms of the transaction documents, $231 million of proceeds from new securitizations were deposited to cash escrow
accounts during the three and six months ended June 30, 2009.
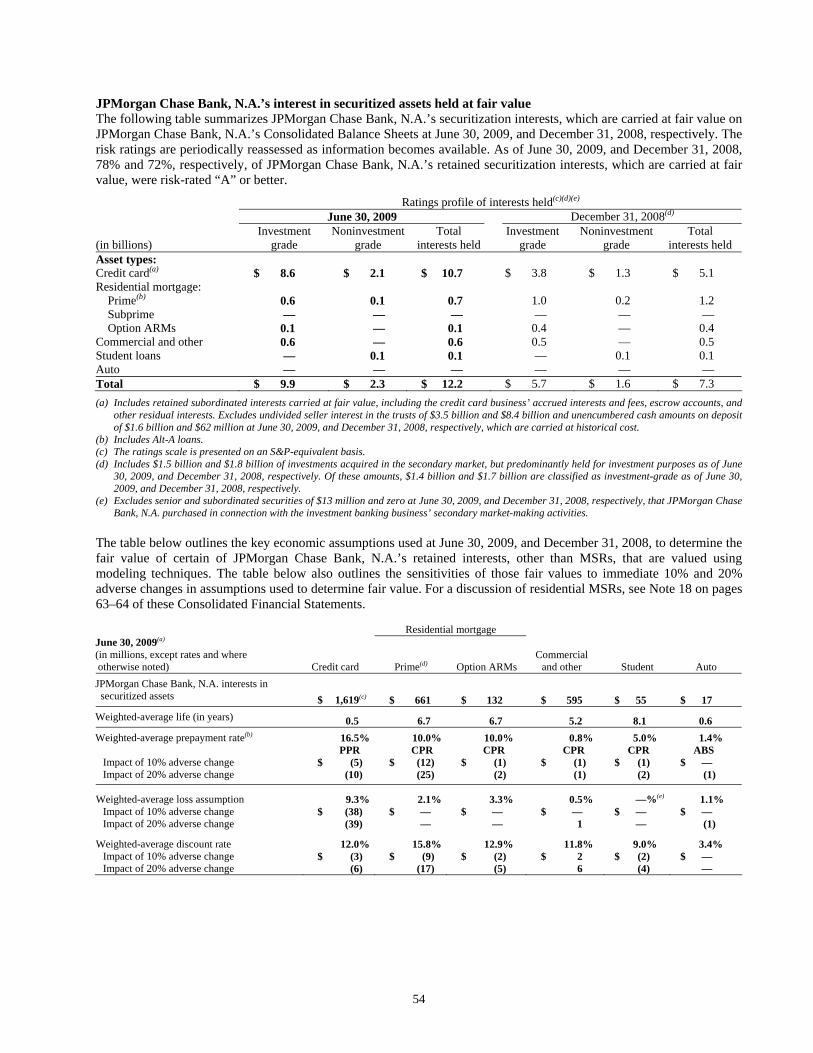
54
JPMorgan Chase Bank, N.A.’s interest in securitized assets held at fair value The following table summarizes JPMorgan Chase Bank, N.A.’s securitization interests, which are carried at fair value on JPMorgan Chase Bank, N.A.’s Consolidated Balance Sheets at June 30, 2009, and December 31, 2008, respectively. The risk ratings are periodically reassessed as information becomes available. As of June 30, 2009, and December 31, 2008, 78% and 72%, respectively, of JPMorgan Chase Bank, N.A.’s retained securitization interests, which are carried at fair value, were risk-rated “A” or better.
Ratings profile of interests held(c)(d)(e) June 30, 2009 December 31, 2008(d) (in billions)
Investment grade
Noninvestmentgrade
Total interests held
Investment grade
Noninvestment grade
Total interests held
Asset types: Credit card(a) $ 8.6 $ 2.1 $ 10.7 $ 3.8 $ 1.3 $ 5.1 Residential mortgage:
Prime(b) 0.6 0.1 0.7 1.0 0.2 1.2 Subprime — — — — — — Option ARMs 0.1 — 0.1 0.4 — 0.4
Commercial and other 0.6 — 0.6 0.5 — 0.5 Student loans — 0.1 0.1 — 0.1 0.1 Auto — — — — — — Total $ 9.9 $ 2.3 $ 12.2 $ 5.7 $ 1.6 $ 7.3 (a) Includes retained subordinated interests carried at fair value, including the credit card business’ accrued interests and fees, escrow accounts, and
other residual interests. Excludes undivided seller interest in the trusts of $3.5 billion and $8.4 billion and unencumbered cash amounts on deposit of $1.6 billion and $62 million at June 30, 2009, and December 31, 2008, respectively, which are carried at historical cost.
(b) Includes Alt-A loans. (c) The ratings scale is presented on an S&P-equivalent basis. (d) Includes $1.5 billion and $1.8 billion of investments acquired in the secondary market, but predominantly held for investment purposes as of June
30, 2009, and December 31, 2008, respectively. Of these amounts, $1.4 billion and $1.7 billion are classified as investment-grade as of June 30, 2009, and December 31, 2008, respectively.
(e) Excludes senior and subordinated securities of $13 million and zero at June 30, 2009, and December 31, 2008, respectively, that JPMorgan Chase Bank, N.A. purchased in connection with the investment banking business’ secondary market-making activities.
The table below outlines the key economic assumptions used at June 30, 2009, and December 31, 2008, to determine the fair value of certain of JPMorgan Chase Bank, N.A.’s retained interests, other than MSRs, that are valued using modeling techniques. The table below also outlines the sensitivities of those fair values to immediate 10% and 20% adverse changes in assumptions used to determine fair value. For a discussion of residential MSRs, see Note 18 on pages 63–64 of these Consolidated Financial Statements.
Residential mortgage June 30, 2009(a) (in millions, except rates and where otherwise noted) Credit card Prime(d) Option ARMs
Commercial and other Student Auto
JPMorgan Chase Bank, N.A. interests in securitized assets $ 1,619(c) $ 661 $ 132 $ 595 $ 55 $ 17 Weighted-average life (in years) 0.5 6.7 6.7 5.2 8.1 0.6 Weighted-average prepayment rate(b) 16.5% 10.0% 10.0% 0.8% 5.0% 1.4% PPR CPR CPR CPR CPR ABS
Impact of 10% adverse change $ (5) $ (12) $ (1) $ (1) $ (1) $ — Impact of 20% adverse change (10) (25) (2) (1) (2) (1)
Weighted-average loss assumption 9.3% 2.1% 3.3% 0.5% —%(e) 1.1% Impact of 10% adverse change $ (38) $ — $ — $ — $ — $ — Impact of 20% adverse change (39) — — 1 — (1)
Weighted-average discount rate 12.0% 15.8% 12.9% 11.8% 9.0% 3.4% Impact of 10% adverse change $ (3) $ (9) $ (2) $ 2 $ (2) $ — Impact of 20% adverse change (6) (17) (5) 6 (4) —
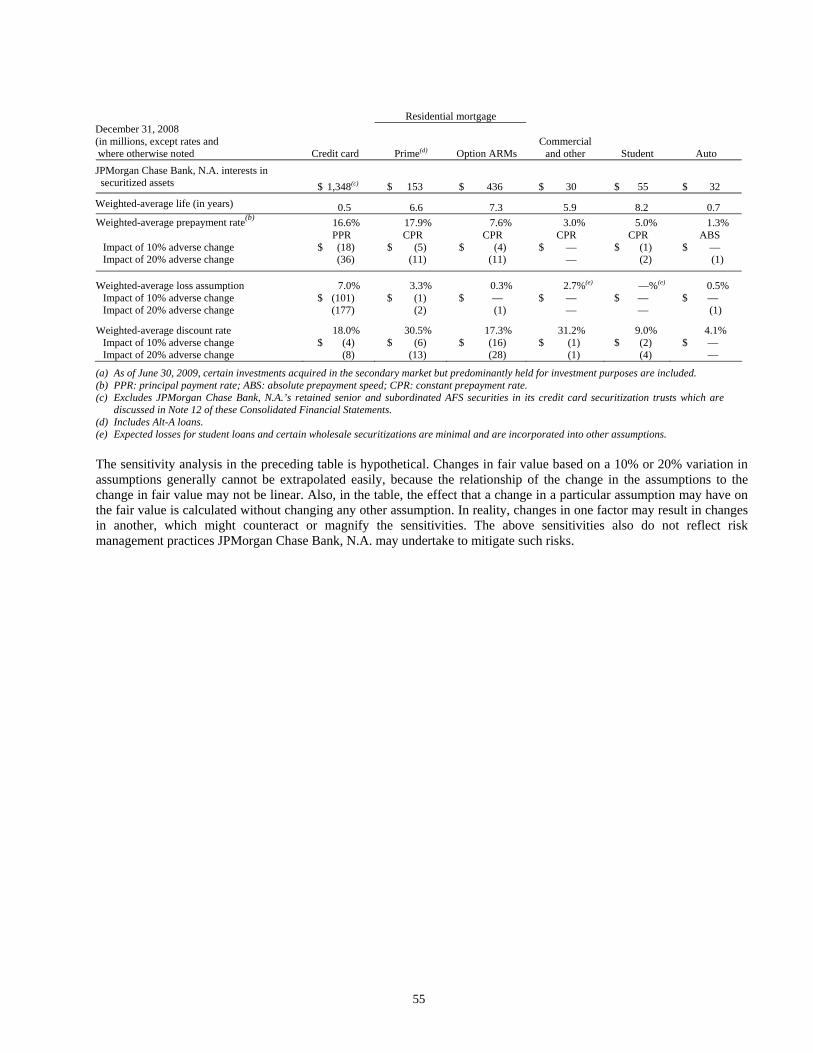
55
Residential mortgage December 31, 2008 (in millions, except rates and where otherwise noted Credit card Prime(d) Option ARMs
Commercial and other Student Auto
JPMorgan Chase Bank, N.A. interests in securitized assets $ 1,348(c) $ 153 $ 436 $ 30 $ 55 $ 32 Weighted-average life (in years) 0.5 6.6 7.3 5.9 8.2 0.7 Weighted-average prepayment rate(b) 16.6% 17.9% 7.6% 3.0% 5.0% 1.3% PPR CPR CPR CPR CPR ABS
Impact of 10% adverse change $ (18) $ (5) $ (4) $ — $ (1) $ — Impact of 20% adverse change (36) (11) (11) — (2) (1)
Weighted-average loss assumption 7.0% 3.3% 0.3% 2.7%(e) —%(e) 0.5% Impact of 10% adverse change $ (101) $ (1) $ — $ — $ — $ — Impact of 20% adverse change (177) (2) (1) — — (1)
Weighted-average discount rate 18.0% 30.5% 17.3% 31.2% 9.0% 4.1% Impact of 10% adverse change $ (4) $ (6) $ (16) $ (1) $ (2) $ — Impact of 20% adverse change (8) (13) (28) (1) (4) —
(a) As of June 30, 2009, certain investments acquired in the secondary market but predominantly held for investment purposes are included. (b) PPR: principal payment rate; ABS: absolute prepayment speed; CPR: constant prepayment rate. (c) Excludes JPMorgan Chase Bank, N.A.’s retained senior and subordinated AFS securities in its credit card securitization trusts which are
discussed in Note 12 of these Consolidated Financial Statements. (d) Includes Alt-A loans. (e) Expected losses for student loans and certain wholesale securitizations are minimal and are incorporated into other assumptions.
The sensitivity analysis in the preceding table is hypothetical. Changes in fair value based on a 10% or 20% variation in assumptions generally cannot be extrapolated easily, because the relationship of the change in the assumptions to the change in fair value may not be linear. Also, in the table, the effect that a change in a particular assumption may have on the fair value is calculated without changing any other assumption. In reality, changes in one factor may result in changes in another, which might counteract or magnify the sensitivities. The above sensitivities also do not reflect risk management practices JPMorgan Chase Bank, N.A. may undertake to mitigate such risks.

56
Loan delinquencies and net charge-offs The table below includes information about delinquencies, net charge-offs/(recoveries) and components of reported and securitized financial assets at June 30, 2009, and December 31, 2008.
Total loans
90 days past due
and still accruing
Nonaccrual assets(g)
Net loan charge-offs (recoveries)
June 30, Dec. 31, June 30, Dec. 31, June 30, Dec. 31, Three months ended
June 30, Six months ended
June 30, (in millions) 2009 2008 2009 2008 2009 2008 2009 2008 2009 2008 Home equity $ 108,229 $ 114,335 $ — $ — $ 1,487 $ 1,394 $ 1,265 $ 511 $ 2,363 $ 958 Prime mortgage(a) 62,173 72,168 — — 3,448 1,888 481 104 793 154 Subprime mortgage 13,821 15,326 — — 2,772 2,689 410 192 774 341 Option ARM 5,095 9,018 — — 162 — 15 — 19 — Auto 42,887 42,603 — — 154 148 146 119 320 237 Credit card 19,814 31,141 740 703 — — 673 385 1,209 745 All other 33,021 33,693 473 463 722 430 332 99 556 160 Loans held-for-sale(b) 1,940 2,028 — — — — NA NA NA NA
Total consumer loans – excluding purchased credit-impaired loans 286,980 320,312 1,213 1,166 8,745 6,549 3,322 1,410 6,034 2,595
Consumer loans – purchased credit-impaired loans(c) 85,406 88,813 — — — — — — —
—
Total consumer loans 372,386 409,125 1,213 1,166 8,745 6,549 3,322 1,410 6,034 2,595 Total wholesale loans 224,219 253,187 233 162 5,892(h) 2,354(h) 661 41 845 120 Total loans reported 596,605 662,312 1,446 1,328 14,637 8,903 3,983 1,451 6,879 2,715 Securitized loans: Residential mortgage:
Prime mortgage(a) 112,664 122,419 — — 10,451 6,081 506 38 823 47 Subprime mortgage 36,982 42,142 — — 11,484 9,230 1,698 384 3,390 626 Option ARMs 45,341 48,328 — — 9,692 6,440 474 — 854 —
Auto 395 668 — — 1 1 1 2 3 4 Credit card 38,635 32,470 932 609 — — 635 335 1,122 609 Student 1,042 1,074 61 66 — — — 1 — 1 Commercial and other 26,988 39,812 — 28 903 156 5 3 10 5 Total loans securitized(d) 262,047 286,913 993 703 32,531 21,908 3,319 763 6,202 1,292 Total loans reported
and securitized(e) $ 858,652(f) $ 949,225(f) $ 2,439 $ 2,031 $ 47,168 $ 30,811 $ 7,302 $ 2,214 $ 13,081 $ 4,007
(a) Includes Alt-A loans. (b) Includes loans for prime mortgage and other (largely student loans) of $589 million and $1.4 billion at June 30, 2009, respectively, and
$206 million and $1.8 billion at December 31, 2008, respectively. (c) Purchased credit-impaired loans represent loans acquired in the Washington Mutual transaction for which a deterioration in credit
quality occurred between the origination date and JPMorgan Chase Bank, N.A.’s acquisition date. Under SOP 03-3, these loans were initially recorded at fair value and accrete interest income over the estimated life of the loan when cash flows are reasonably estimable, even if the underlying loans are contractually past due. For additional information, see Note 14 on pages 44–47 of these Consolidated Financial Statements.
(d) Total assets held in securitization-related SPEs were $344.8 billion and $371.1 billion at June 30, 2009, and December 31, 2008, respectively. The $262.0 billion and $286.9 billion of loans securitized at June 30, 2009, and December 31, 2008, respectively, excludes: $76.8 billion and $75.5 billion of securitized loans, in which JPMorgan Chase Bank, N.A. has no continuing involvement; $3.5 billion and $8.4 billion, of seller’s interests in credit card master trusts; and $2.5 billion and $262 million, of cash amounts on deposit and escrow accounts, all respectively.
(e) Represents both loans on the Consolidated Balance Sheets and loans that have been securitized. (f) Includes securitized loans that were previously recorded at fair value and classified as trading assets. (g) Excludes nonperforming loans and assets related to: (i) loans eligible for repurchase, as well as loans repurchased from GNMA pools
that are insured by U.S. government agencies, of $4.7 billion and $3.3 billion at June 30, 2009, and December 31, 2008, respectively; and (ii) student loans that are 90 days past due and still accruing, which are insured by U.S. government agencies under the Federal Family Education Loan Program, of $473 million and $437 million at June 30, 2009, and December 31, 2008, respectively. These amounts for GNMA and student loans are excluded, as reimbursement is proceeding normally.
(h) Includes nonperforming loans held-for-sale and loans at fair value of $93 million and $32 million at June 30, 2009, and December 31, 2008, respectively.

57
NOTE 17 – VARIABLE INTEREST ENTITIES Refer to Note 1 on page 6 and Note 18 on page 56 of JPMorgan Chase Bank, N.A.’s 2008 Annual Financial Statements for a further description of JPMorgan Chase Bank, N.A.’s policies regarding consolidation of variable interest entities (“VIEs”) and JPMorgan Chase Bank, N.A.’s principal involvement with VIEs.
Multi-seller conduits The following table summarizes JPMorgan Chase Bank, N.A.’s involvement with JPMorgan Chase Bank, N.A.-administered multi-seller conduits. On May 31, 2009, JPMorgan Chase Bank, N.A. consolidated one of JPMorgan Chase Bank, N.A.’s administered multi-seller conduits due to the redemption of the expected loss note (“ELN”). There was no consolidated JPMorgan Chase Bank, N.A.-administered multi-seller conduits as of December 31, 2008.
June 30, 2009 (in billions) Consolidated Nonconsolidated December 31, 2008 Total assets held by conduits $ 6.9 $ 23.0 $ 42.9
Total commercial paper issued by conduits 6.9 23.0 43.1
Liquidity and credit enhancements Deal-specific liquidity facilities (primarily asset purchase agreements)
9.8
31.6(b)
55.4(b)
Program-wide liquidity facilities 4.0 13.0 17.0 Program-wide credit enhancements 0.4 2.0 3.0 Maximum exposure to loss(a) 9.8 32.3 56.9 (a) JPMorgan Chase Bank, N.A.’s maximum exposure to loss, calculated separately for each multi-seller conduit, includes JPMorgan Chase Bank,
N.A.’s exposure to both deal-specific liquidity facilities and program-wide credit enhancements. For purposes of calculating JPMorgan Chase Bank, N.A.’s maximum exposure to loss, JPMorgan Chase Bank, N.A.-provided, program-wide credit enhancement is limited to deal-specific liquidity facilities provided by third parties.
(b) The accounting for these agreements is further discussed in Note 31 on pages 83–87 of JPMorgan Chase Bank, N.A.’s 2008 Annual Financial Statements. The carrying value related to asset purchase agreements was $112 million and $147 million at June 30, 2009, and December 31, 2008, respectively, of which $110 million and $138 million, respectively, represented the remaining fair value of the guarantee under FIN 45. JPMorgan Chase Bank, N.A. has recorded this guarantee in other liabilities, with an offsetting entry recognized in other assets for the net present value of the future premium receivable under the contracts.
Assets funded by nonconsolidated multi-seller conduits The following table presents information on the commitments and assets held by JPMorgan Chase Bank, N.A.’s nonconsolidated JPMorgan Chase Bank, N.A.-administered multi-seller conduits as of June 30, 2009, and December 31, 2008. June 30, 2009 December 31, 2008
(in billions)
Unfunded commitments to JPMorgan Chase Bank, N.A.’s clients
Commercial paper–funded
assets
Liquidity provided by third parties
Liquidity provided
by JPMorgan Chase Bank,
N.A.
Unfunded commitments to JPMorgan Chase Bank, N.A.’s clients
Commercial paper–funded
assets
Liquidity provided by third parties
Liquidity provided
by JPMorgan Chase Bank,
N.A. Asset types: Credit card $ 1.8 $ 4.5 $ — $ 6.3 $ 3.0 $ 8.9 $ 0.1 $ 11.8 Vehicle loans and leases 1.4 7.4 — 8.8 1.4 10.0 — 11.4 Trade receivables 3.2 2.3 — 5.5 3.8 5.5 — 9.3 Student loans 0.6 2.1 — 2.7 0.7 4.6 — 5.3 Commercial 0.7 2.1 — 2.8 1.5 4.0 0.4 5.1 Residential mortgage — 0.6 — 0.6 — 0.7 — 0.7 Capital commitments 0.5 1.7 0.6 1.6 1.3 3.9 0.6 4.6 Rental car finance 0.2 0.3 — 0.5 0.2 0.4 — 0.6 Equipment loans and
leases 0.3 0.6 — 0.9 0.7 1.6 — 2.3 Floorplan – vehicle — 0.4 — 0.4 0.7 1.8 — 2.5 Consumer 0.2 0.4 — 0.6 0.1 0.7 0.1 0.7 Other 0.6 0.6 0.3 0.9 0.6 0.8 0.3 1.1 Total $ 9.5 $ 23.0 $ 0.9 $ 31.6 $ 14.0 $ 42.9 $ 1.5 $ 55.4

58
Ratings profile of VIE assets of the nonconsolidated multi-seller conduits(a)
June 30, 2009 Investment-grade Noninvestment-
grade Commercialpaper funded
Wt. avg. expected
(in billions) AAA to AAA- AA+ to AA- A+ to A- BBB to BBB- BB+ and below assets life (years)(b) Asset types: Credit card $ 2.9 $ 1.5 $ 0.1 $ — $ — $ 4.5 1.6 Vehicle loans and leases 2.7 3.8 0.8 0.1 — 7.4 2.3 Trade receivables — 1.9 0.4 — — 2.3 0.7 Student loans 2.1 — — — — 2.1 1.3 Commercial 0.7 0.9 0.2 — 0.3 2.1 2.5 Residential mortgage — 0.5 — — 0.1 0.6 3.5 Capital commitments — 0.1 1.6 — — 1.7 2.3 Rental car finance — — 0.3 — — 0.3 1.0 Equipment loans and leases 0.4 0.2 — — — 0.6 2.5 Floorplan – vehicle — — — 0.4 — 0.4 0.6 Consumer 0.3 0.1 — — — 0.4 2.0 Other — 0.6 — — — 0.6 3.9 Total $ 9.1 $ 9.6 $ 3.4 $ 0.5 $ 0.4 $ 23.0 2.0
Ratings profile of VIE assets of the nonconsolidated multi-seller conduits (a)
December 31, 2008 Investment-grade Noninvestment-
grade Commercialpaper funded
Wt. avg. Expected
(in billions) AAA to AAA- AA+ to AA- A+ to A- BBB to BBB- BB+ and below assets life (years)(b) Asset types: Credit card $ 4.8 $ 3.9 $ 0.1 $ 0.1 $ — $ 8.9 1.5 Vehicle loans and leases 4.1 4.1 1.8 — — 10.0 2.5 Trade receivables — 4.0 1.5 — — 5.5 1.0 Student loans 3.6 0.9 — 0.1 — 4.6 1.8 Commercial 1.1 2.0 0.6 0.3 — 4.0 2.7 Residential mortgage — 0.6 — 0.1 — 0.7 4.0 Capital commitments — 3.6 0.3 — — 3.9 2.4 Rental car finance — — 0.4 — — 0.4 1.5 Equipment loans and leases 0.4 1.2 — — — 1.6 2.2 Floorplan – vehicle 0.1 1.0 0.7 — — 1.8 1.1 Consumer 0.1 0.4 0.2 — — 0.7 1.6 Other 0.5 0.3 — — — 0.8 3.7 Total $ 14.7 $ 22.0 $ 5.6 $ 0.6 $ — $ 42.9 2.0
(a) The ratings scale is presented on an S&P-equivalent basis. (b) Weighted-average expected life for each asset type is based on the remaining term of each conduit transaction’s committed liquidity, plus either
the expected weighted-average life of the assets should the committed liquidity expire without renewal, or the expected time to sell the underlying assets in the securitization market.
The assets held by the multi-seller conduits are structured so that if they were rated, JPMorgan Chase Bank, N.A. believes the majority of them would receive an “A” rating or better by external rating agencies. However, it is unusual for the assets held by the conduits to be explicitly rated by an external rating agency. Instead, JPMorgan Chase Bank, N.A.’s Credit Risk group assigns each asset purchase liquidity facility an internal risk-rating based on its assessment of the probability of default for the transaction. The ratings provided in the above table reflect the S&P-equivalent ratings of the internal rating grades assigned by JPMorgan Chase Bank, N.A.
The risk ratings are periodically reassessed as information becomes available. As of June 30, 2009, and December 31, 2008, 93% and 90%, respectively, of the assets in the nonconsolidated conduits were risk-rated “A” or better.
Commercial paper issued by nonconsolidated multi-seller conduits The weighted-average life of commercial paper issued by nonconsolidated multi-seller conduits at June 30, 2009, and December 31, 2008, was 20 days and 27 days, respectively, and the average yield on the commercial paper at June 30, 2009, and December 31, 2008, was 0.3% and 0.6%, respectively. In the normal course of business, JPMorgan Chase trades and invests in commercial paper, including paper issued by JPMorgan Chase Bank, N.A.-administered conduits. JPMorgan Chase Bank, N.A. did not purchase commercial paper from any JPMorgan Chase Bank, N.A.-administered conduits during the six month period ended June 30, 2009. JPMorgan Chase Bank, N.A. is not obligated under any agreement (contractual or noncontractual) to purchase the commercial paper issued by nonconsolidated JPMorgan Chase Bank, N.A.–administered conduits.

59
Consolidation analysis Each nonconsolidated multi-seller conduit administered by JPMorgan Chase Bank, N.A. at June 30, 2009, and December 31, 2008, had issued ELNs, the holders of which are committed to absorbing the majority of the expected loss of each respective conduit. The total amounts of ELNs outstanding for nonconsolidated conduits at June 30, 2009, and December 31, 2008, were $96 million and $136 million, respectively.
JPMorgan Chase Bank, N.A. could fund purchases of assets from nonconsolidated, JPMorgan Chase Bank, N.A.-administered multi-seller conduits should it become necessary.
Investor intermediation Municipal bond vehicles Exposure to nonconsolidated municipal bond VIEs at June 30, 2009, and December 31, 2008, including the ratings profile of the VIEs’ assets, were as follows. June 30, 2009 December 31, 2008
(in billions)
Fair value of assets held
by VIEs Liquidity facilities(c)
Excess/ (deficit)(d)
Maximum exposure
Fair value of assets held
by VIEs Liquidity facilities(c)
Excess/ (deficit)(d)
Maximum exposure
Nonconsolidated municipal bond vehicles(a)(b) $ 12.0 $ 7.9 $ 4.1 $ 7.9 $ 10.0 $ 6.9 $ 3.1 $ 6.9
Ratings profile of VIE assets(e)
Investment-grade
Noninvestment-
grade Fair value of assets held
Wt. avg. expected
life of assets(in billions) AAA to AAA- AA+ to AA- A+ to A- BBB to BBB- BB+ and below by VIEs (years)
Nonconsolidated municipal bond vehicles(a)
June 30, 2009 $ 1.4 $ 10.5 $ 0.1 $ — $ — $ 12.0 16.6 December 31, 2008 3.8 5.9 0.2 0.1 — 10.0 22.3
(a) Excluded $228 million and $340 million at June 30, 2009, and December 31, 2008, respectively, which were consolidated due to JPMorgan Chase Bank, N.A. owning the residual interests.
(b) Certain of the municipal bond vehicles are structured to meet the definition of a QSPE (as discussed in Note 1 on page 6 of JPMorgan Chase Bank, N.A.’s 2008 Annual Financial Statements); accordingly, the assets and liabilities of QSPEs are not reflected in JPMorgan Chase Bank, N.A.’s Consolidated Balance Sheets (except for retained interests that are reported at fair value). Excluded nonconsolidated amount of $603 million at December 31, 2008, related to QSPE municipal bond vehicles in which JPMorgan Chase Bank, N.A. owned the residual interests. JPMorgan Chase Bank, N.A. did not own residual interests in QSPE municipal bond vehicles at June 30, 2009.
(c) JPMorgan Chase Bank, N.A. may serve as credit enhancement provider in municipal bond vehicles in which it serves as liquidity provider. JPMorgan Chase Bank, N.A. provided insurance on underlying municipal bonds, in the form of letters of credit, of $10 million at both June 30, 2009, and December 31, 2008.
(d) Represents the excess/(deficit) of municipal bond asset fair value available to repay the liquidity facilities, if drawn. (e) The ratings scale is based on JPMorgan Chase Bank, N.A.’s internal risk ratings and presented on an S&P-equivalent basis.
In the first half of 2009, JPMorgan Chase Bank, N.A. did not experience a drawdown on its liquidity facilities. In addition, the municipal bond vehicles did not experience any bankruptcy or downgrade termination events during the first half of 2009.
At June 30, 2009, and December 31, 2008, 99% and 97%, respectively, of the municipal bonds held by vehicles to which JPMorgan Chase Bank, N.A. served as liquidity provider were rated “AA-” or better, based upon either the rating of the underlying municipal bond itself, or the rating including any credit enhancement. At June 30, 2009, and December 31, 2008, $2.4 billion and $2.6 billion, respectively, of the bonds were insured by monoline bond insurers.

60
Credit-linked note vehicles Exposure to nonconsolidated credit-linked note VIEs at June 30, 2009, and December 31, 2008, was as follows. June 30, 2009 December 31, 2008
Derivative Trading Total Par value of
collateral held Derivative Trading Total Par value of
collateral held(in billions) receivables assets(c) exposure(d) by VIEs(e) receivables assets(c) exposure(d) by VIEs(e) Credit-linked notes(a)
Static structure $ 2.8 $ 0.8 $ 3.6 $ 12.1 $ 3.5 $ 0.7 $ 4.2 $ 13.6 Managed structure(b) 6.1 0.6 6.7 15.1 6.4 0.3 6.7 12.4
Total $ 8.9 $ 1.4 $ 10.3 $ 27.2 $ 9.9 $ 1.0 $ 10.9 $ 26.0
(a) Excluded collateral with a fair value of $2.2 billion and $2.0 billion at June 30, 2009, and December 31, 2008, respectively, which was consolidated as JPMorgan Chase Bank, N.A., in its role as secondary market maker, held a majority of the issued credit-linked notes of certain vehicles.
(b) Included synthetic collateralized debt obligation vehicles, which have similar risk characteristics to managed credit-linked note vehicles. At December 31, 2008, trading assets included $7 million of transactions with subprime collateral; there were no such transactions in trading assets at June 30, 2009.
(c) Trading assets principally comprise notes issued by VIEs, which from time to time are held as part of the termination of a deal or to support limited market-making.
(d) On–balance sheet exposure that includes derivative receivables and trading assets. (e) JPMorgan Chase Bank, N.A.,’s maximum exposure arises through the derivatives executed with the VIEs; the exposure varies over time with
changes in the fair value of the derivatives. JPMorgan Chase Bank, N.A. relies upon the collateral held by the VIEs to pay any amounts due under the derivatives; the vehicles are structured at inception so that the par value of the collateral is expected to be sufficient to pay amounts due under the derivative contracts.
Asset swap vehicles Exposure to nonconsolidated asset swap VIEs at June 30, 2009, and December 31, 2008, was as follows. June 30, 2009 December 31, 2008
Derivative receivables Trading Total
Par value of collateral held
Derivative receivables Trading Total
Par value of collateral held
(in billions) (payables) assets(a) exposure(b) by VIEs(c) (payables) assets(a) exposure(b) by VIEs(c) Nonconsolidated asset swap
vehicles(d) $ 0.2 $ — $ 0.2 $ 6.0 $ (0.2) $ — $ (0.2) $ 7.0
(a) Trading assets principally comprise notes issued by VIEs, which from time to time are held as part of the termination of a deal or to support limited market-making.
(b) On–balance sheet exposure that includes derivative receivables and trading assets. (c) JPMorgan Chase Bank, N.A.,’s maximum exposure arises through the derivatives executed with the VIEs; the exposure varies over time with
changes in the fair value of the derivatives. JPMorgan Chase Bank, N.A., relies upon the collateral held by the VIEs to pay any amounts due under the derivatives; the vehicles are structured at inception so that the par value of the collateral is expected to be sufficient to pay amounts due under the derivative contracts.
(d) Excluded collateral with a fair value of $1.1 billion and $1.0 billion at June 30, 2009, and December 31, 2008, respectively, which was consolidated as JPMorgan Chase Bank, N.A., in its role as secondary market maker, held a majority of the issued notes of certain vehicles.
Collateralized debt obligation vehicles For further information on JPMorgan Chase Bank, N.A.’s involvement with collateralized debt obligations (“CDOs”), see Note 18 on pages 64–65 of JPMorgan Chase Bank, N.A.’s 2008 Annual Financial Statements.
As of June 30, 2009, and December 31, 2008, JPMorgan Chase Bank, N.A. had noninvestment-grade funded loans of $308 million and $401 million, respectively, to nonconsolidated CDO warehouse VIEs. Additionally, JPMorgan Chase Bank, N.A. had unfunded commitments of $43 million and $747 million as of June 30, 2009, and December 31, 2008, respectively, to these nonconsolidated CDO warehouse VIEs. These unfunded commitments are typically contingent on certain asset-quality conditions being met. JPMorgan Chase Bank, N.A.’s maximum exposure to loss related to the nonconsolidated CDO warehouse VIEs was $351 million and $1.1 billion as of June 30, 2009, and December 31, 2008, respectively.
Once the CDO vehicle closes and issues securities, JPMorgan Chase Bank, N.A. has no obligation to provide further support to the vehicle. At the time of closing, JPMorgan Chase Bank, N.A. may hold unsold securities that it was not able to place with third-party investors. In addition, JPMorgan Chase Bank, N.A. may on occasion hold some of the CDO vehicles’ securities as a secondary market-maker or as a principal investor, or it may be a derivative counterparty to the vehicles. At June 30, 2009, and December 31, 2008, these amounts were not significant.

61
VIEs sponsored by third parties Investment in a third-party credit card securitization trust JPMorgan Chase Bank, N.A. holds a note in a third-party-sponsored VIE, which is a credit card securitization trust that owns credit card receivables issued by a national retailer. The note is structured so that the principal amount can float up to 47% of the principal amount of the receivables held by the trust, not to exceed $4.2 billion. JPMorgan Chase Bank, N.A. is not the primary beneficiary of the trust and accounts for its investment at fair value within AFS investment securities. The amortized cost of the note was $3.6 billion at both June 30, 2009 and December 31, 2008, respectively, and the fair value was $3.4 billion and $2.6 billion at June 30, 2009 and December 31, 2008, respectively. For more information on AFS securities, see Note 12 on pages 38–43 of these Consolidated Financial Statements. Other VIEs sponsored by third parties JPMorgan Chase Bank, N.A. enters into transactions with VIEs structured by other parties. These include, for example, acting as a derivative counterparty, liquidity provider, investor, underwriter, placement agent, trustee or custodian. These transactions are conducted at arm’s length, and individual credit decisions are based on the analysis of the specific VIE, taking into consideration the quality of the underlying assets. Where these activities do not cause JPMorgan Chase Bank, N.A. to absorb a majority of the expected losses, or to receive a majority of the residual returns, JPMorgan Chase Bank, N.A. records and reports these positions on its Consolidated Balance Sheets similarly to the way it would record and report positions from any other third-party transaction. These transactions are not considered significant for disclosure purposes under FIN 46. Consolidated VIE assets and liabilities The following table presents information on assets, liabilities and commitments related to VIEs that are consolidated by JPMorgan Chase Bank, N.A.
Consolidated VIEs Assets June 30, 2009 (in billions)
Trading assets – debt and equity instruments Loans Other(a) Total assets(b)
VIE program type Multi-seller conduits $ — $ 3.9 $ 3.0 $ 6.9 Municipal bond vehicles 0.2 — — 0.2 Credit-linked notes 1.6 — 0.6 2.2 CDO warehouses 0.1 — — 0.1 Student loans — 3.9 — 3.9 Other 1.0 0.6 0.5 2.1 Total $ 2.9 $ 8.4 $ 4.1 $ 15.4
Liabilities June 30, 2009 (in billions)
Beneficial interests in VIE assets(c) Other(d) Total liabilities
VIE program type Multi-seller conduits $ 6.9 $ — $ 6.9 Municipal bond vehicles — 0.2 0.2 Credit-linked notes 0.8 — 0.8 CDO warehouses — — — Student loans 2.7 1.1 3.8 Other 0.3 0.1 0.4 Total $ 10.7 $ 1.4 $ 12.1

62
Consolidated VIEs Assets December 31, 2008 (in billions)
Trading assets – debt and equity instruments Loans Other(a) Total assets(b)
VIE program type Multi-seller conduits $ — $ — $ — $ — Municipal bond vehicles 0.3 — — 0.3 Credit-linked notes 1.9 — 0.1 2.0 CDO warehouses — — — — Student loans — 4.0 0.1 4.1 Other 1.5 0.7 0.1 2.3 Total $ 3.7 $ 4.7 $ 0.3 $ 8.7 Liabilities December 31, 2008 (in billions)
Beneficial interests in VIE assets(c) Other(d) Total liabilities
VIE program type Multi-seller conduits $ — $ — $ — Municipal bond vehicles — 0.3 0.3 Credit-linked notes 1.0 2.0 3.0 CDO warehouses — — — Student loans 2.8 1.1 3.9 Other 0.4 1.1 1.5 Total $ 4.2 $ 4.5 $ 8.7 (a) Included assets classified as resale agreements and other assets within the Consolidated Balance Sheets. (b) Assets of each consolidated VIE included in the program types above are generally used to satisfy the liabilities to third parties. The difference
between total assets and total liabilities recognized for consolidated VIEs represents JPMorgan Chase Bank, N.A.’s interest in the consolidated VIEs for each program type.
(c) The interest-bearing beneficial interest liabilities issued by consolidated VIEs are classified in the line item on the Consolidated Balance Sheets titled, “Beneficial interests issued by consolidated variable interest entities.” The holders of these beneficial interests do not have recourse to the general credit of JPMorgan Chase Bank, N.A. Included in beneficial interests in VIE assets are long-term beneficial interests of $3.8 billion and $4.2 billion at June 30, 2009, and December 31, 2008, respectively.
(d) Included liabilities classified as other borrowed funds, long-term debt, and accounts payable and other liabilities in the Consolidated Balance Sheets.
NOTE 18 – GOODWILL AND ALL OTHER INTANGIBLE ASSETS For a discussion of accounting policies related to goodwill and other intangible assets, see Note 19 on pages 66–69 of JPMorgan Chase Bank, N.A.’s 2008 Annual Financial Statements.
Goodwill and all other intangible assets consist of the following.
(in millions) June 30, 2009 December 31, 2008 Goodwill $ 27,438 $ 27,371 Mortgage servicing rights 14,430 9,236
Purchased credit card relationships 122 128
All other intangible assets:
Other credit card–related intangibles $ 670 $ 698 Core deposit intangibles 1,399 1,597 Other intangibles 1,020 1,051
Total all other intangible assets $ 3,089 $ 3,346

63
Goodwill The $67 million increase in goodwill from December 31, 2008, was partially a result of currency translation adjustments related to the Canadian credit card operations.
Goodwill was not impaired at June 30, 2009, or December 31, 2008, nor was any goodwill written off due to impairment during either of the six month periods ended June 30, 2009 or 2008.
Mortgage servicing rights For a further description of the MSR asset, interest rate risk management, and the valuation methodology of MSRs, see Notes 5 and 19 on pages 16–17 and 66–69, respectively, of JPMorgan Chase Bank, N.A.’s 2008 Annual Financial Statements.
The fair value of MSRs is sensitive to changes in interest rates, including their effect on prepayment speeds. JPMorgan Chase Bank, N.A. uses, or has used, combinations of derivatives and trading instruments to manage changes in the fair value of MSRs. The intent is to offset any changes in the fair value of MSRs with changes in the fair value of the related risk management instruments. MSRs decrease in value when interest rates decline. Conversely, securities (such as mortgage-backed securities), principal-only certificates and certain derivatives (when JPMorgan Chase Bank, N.A. receives fixed-rate interest payments) increase in value when interest rates decline.
The following table summarizes MSR activity for the three and six months ended June 30, 2009 and 2008.
Three months ended June 30, Six months ended June 30, (in millions, except where otherwise noted) 2009 2008 2009 2008 Fair value at the beginning of the period $ 10,486 $ 8,419 $ 9,236 $ 8,632 MSR activity
Originations of MSRs 984 1,074 1,978 1,811 Purchase of MSRs — 312 2 419 Disposition of MSRs (10) — (10) —
Total net additions 974 1,386 1,970 2,230
Change in valuation due to inputs and assumptions(a) 3,798 1,519 5,103 887 Other changes in fair value(b) (828) (394) (1,879) (819)
Total change in fair value of MSRs(c) 2,970 1,125 3,224 68 Fair value at June 30 $ 14,430(d) $ 10,930 $ 14,430(d) $ 10,930 Change in unrealized gains/(losses) included in income
related to MSRs held at June 30 $ 3,798 $ 1,519 $ 5,103 $ 887 Contractual service fees, late fees and other ancillary
fees included in income $ 1,127 $ 651 $ 2,246 $ 1,279 Third-party mortgage loans serviced at June 30 (in billions) $ 1,060.0 $ 659.1 $ 1,060.0 $ 659.1 (a) Represents MSR asset fair value adjustments due to changes in inputs, such as interest rates and volatility, as well as updates to
assumptions used in the valuation model. Also represents total realized and unrealized gains/(losses) included in net income per the SFAS 157 disclosure for fair value measurement using significant unobservable inputs (level 3).
(b) Includes changes in the MSR value due to modeled servicing portfolio runoff (or time decay). Represents the impact of cash settlements per the SFAS 157 disclosure for fair value measurement using significant unobservable inputs (level 3).
(c) Includes $(2) million and $(4) million related to commercial real estate for the three and six month periods ended June 30, 2009. (d) Includes $41 million related to commercial real estate.
The table below outlines the key economic assumptions used to determine the fair value of JPMorgan Chase Bank, N.A.’s MSRs at June 30, 2009, and December 31, 2008; and it outlines the sensitivities of those fair values to immediate 10% and 20% adverse changes in those assumptions.
(in millions, except rates and where otherwise noted) June 30, 2009 December 31, 2008 Weighted-average prepayment speed assumption (CPR) 11.92% 35.10%
Impact on fair value of 10% adverse change $ (933) $ (1,021) Impact on fair value of 20% adverse change (1,792) (1,936)
Weighted-average option adjusted spread 3.97% 3.80% Impact on fair value of 100 basis points adverse change $ (589) $ (308) Impact on fair value of 200 basis points adverse change (1,131) (601)
CPR: Constant prepayment rate.

64
The sensitivity analysis in the preceding table is hypothetical and should be used with caution. Changes in fair value based on a 10% and 20% variation in assumptions generally cannot be easily extrapolated, because the relationship of the change in the assumptions to the change in fair value may not be linear. Also, in this table, the effect that a change in a particular assumption may have on the fair value is calculated without changing any other assumption. In reality, changes in one factor may result in changes in another, which might magnify or counteract the sensitivities.
Purchased credit card relationships and all other intangible assets For the six months ended June 30, 2009, purchased credit card relationships, other credit card-related intangibles, core deposit intangibles and other intangible assets decreased by $263 million, primarily reflecting amortization expense.
Except for $315 million of indefinitely-lived intangibles related to asset management advisory contracts, which are not amortized but are tested for impairment at least annually, the remainder of JPMorgan Chase Bank, N.A.’s other acquired intangible assets are subject to amortization.
Purchased credit card relationships and all other intangible assets Other intangible assets were as follows.
June 30, 2009 December 31, 2008
Gross Accumulated Net
carrying Gross Accumulated Net
carrying (in millions) amount amortization value amount amortization value Purchased credit card relationships $ 229 $ 107 $ 122 $ 224 $ 96 $ 128 All other intangibles:
Other credit card–related intangibles $ 786 $ 116 $ 670 $ 773 $ 75 $ 698 Core deposit intangibles 4,280 2,881 1,399 4,280 2,683 1,597 Other intangibles 1,487 467(a)(b) 1,020 1,539 488(a) 1,051
(a) Includes amortization expense related to servicing assets on securitized automobile loans, which is recorded in lending & deposit–related fees, of $1 million and $2 million for the six months ended June 30, 2009 and 2008, respectively.
(b) The decrease in other intangibles gross amount and accumulated amortization from December 2008 was primarily attributable to the removal of fully amortized assets.
Amortization expense The following table presents amortization expense related to credit card relationships, core deposits and all other intangible assets.
Three months ended June 30, Six months ended June 30, (in millions) 2009 2008 2009 2008 Purchased credit card relationships $ 6 $ 8 $ 11 $ 16 All other intangibles:
Other credit card–related intangibles 21 2 41 4 Core deposit intangibles 99 119 198 238 Other intangibles 26 24 52 46
Total amortization expense $ 152 $ 153 $ 302 $ 304
Future amortization expense The following table presents estimated future amortization expense related to credit card relationships, core deposits and all other intangible assets.
For the year: (in millions) Purchased credit card relationships
Other credit card–related intangibles
Core deposit intangibles
All other intangible
assets Total 2009(a) $ 24 $ 83 $ 387 $ 129 $ 623 2010 22 90 329 110 551 2011 20 91 284 96 491 2012 20 93 240 87 440 2013 18 93 195 78 384 (a) Includes $11 million, $41 million, $198 million and $52 million of amortization expense related to purchased credit card relationships,
other credit card–related intangibles, core deposit intangibles and all other intangibles, respectively, recognized during the first six months of 2009.

65
NOTE 19 – DEPOSITS For further discussion of deposits, see Note 21 on page 70 in JPMorgan Chase Bank, N.A.’s 2008 Annual Financial Statements.
At June 30, 2009, and December 31, 2008, noninterest-bearing and interest-bearing deposits were as follows.
(in millions) June 30, 2009 December 31, 2008 U.S. offices:
Noninterest-bearing $ 199,094 $ 213,115 Interest-bearing (included $1,002 and $1,849 at fair value at June 30, 2009, and
December 31, 2008, respectively) 419,030 482,382 Non-U.S. offices:
Noninterest-bearing 8,671 8,026 Interest-bearing (included $2,785 and $3,756 at fair value at June 30, 2009, and
December 31, 2008, respectively) 347,685 352,242 Total $ 974,480 $ 1,055,765
On May 20, 2009, the Helping Families Save Their Homes Act of 2009 was signed into law. The Act extends through December 31, 2013, the FDIC’s temporary standard maximum deposit insurance amount, which was increased on October 3, 2008, from $100,000 to $250,000 per depositor per institution.
NOTE 20 – OTHER BORROWED FUNDS The following table details the components of other borrowed funds.
(in millions) June 30, 2009 December 31, 2008 Advances from Federal Home Loan Banks(a) $ 46,338 $ 70,187 Nonrecourse advances – FRBB(b) — 130 Other(c) 6,335 24,636 Total other borrowed funds(d) $ 52,673 $ 94,953 (a) Maturities of advances from the FHLBs were $37.1 billion, $7.6 billion, and $719 million in each of the 12-month periods ending June 30, 2010,
2011, and 2013, respectively, and $939 million maturing after June 30, 2014. Maturities for the 12 month period ending June 30, 2012 and 2014 were not material.
(b) On September 19, 2008, the Federal Reserve Board established a special lending facility, the Asset-Backed Commercial Paper Money Market Mutual Fund Liquidity Facility (AMLF), to provide liquidity to eligible U.S. money market mutual funds (“MMMFs”). Under the AMLF, banking organizations must use the loan proceeds to finance their purchases of eligible high-quality asset-backed commercial paper (“ABCP”) investments from MMMFs, which are pledged to secure nonrecourse advances from the Federal Reserve Bank of Boston (“FRBB”). Participating banking organizations do not bear any credit or market risk related to the ABCP investments they hold under this facility; therefore, the ABCP investments held are not assessed any regulatory capital. The AMLF will be in effect until October 30, 2009. The nonrecourse advances from the FRBB were elected under the fair value option and recorded in other borrowed funds; the corresponding ABCP investments were also elected under the fair value option and recorded in other assets.
(c) Includes zero and $15.0 billion of advances from the Federal Reserve under the Federal Reserve’s Term Auction Facility (“TAF”) at June 30, 2009, and December 31, 2008, respectively, pursuant to which the Federal Reserve auctions term funds to depository institutions that are eligible to borrow under the primary credit program. The TAF allows all eligible depository institutions to place a bid for an advance from its local Federal Reserve Bank at an interest rate set by an auction. All advances are required to be fully collateralized. The TAF is designed to improve liquidity by making it easier for sound institutions to borrow when the markets are not operating efficiently.
(d) Includes other borrowed funds of $1.1 billion and $2.7 billion accounted for at fair value at June 30, 2009 and December 31, 2008, respectively.

66
NOTE 21 – RELATED PARTY TRANSACTIONS JPMorgan Chase Bank, N.A. regularly enters into transactions with JPMorgan Chase and its various subsidiaries. Significant revenue- and expense-related transactions with related parties are listed below. Three months ended June 30, Six months ended June 30, (in millions) 2009 2008 2009 2008 Interest income from affiliates Deposits with affiliated banks $ 4 $ 4 $ 6 $ 11 Federal funds sold and securities purchased under resale agreements, and securities borrowed with affiliates
14
448
29
1,121
Loans to affiliates 9 16 17 30 Interest expense to affiliates Interest-bearing deposits of affiliates 129 565 278 1,212 Federal funds purchased and securities loaned or sold under repurchase agreements, and Other borrowed funds due to affiliates
81
576
222
1,300
Long-term debt payable to JPMorgan Chase & Co. and affiliates
143
160
334
385
Guaranteed capital debt securities issued to nonblank affiliates
11
11
23
23
Servicing agreements with affiliates Noninterest revenue 934 807 1,841 1,628 Noninterest expense 1,170 1,193 2,212 2,237 Significant balances with related parties are listed below.
(in millions) June 30, 2009 December 31, 2008 Assets Deposits with affiliated banks $ 747 $ 661 Federal funds sold and securities purchased under resale agreements, and securities borrowed with affiliates 102,363
65,948
Loans to affiliates 77 87 Accrued interest and accounts receivable, and other assets due from affiliates 12,801 13,623
Liabilities Noninterest-bearing deposits of affiliates 7,381 3,151 Interest-bearing deposits of affiliates 123,604 86,481 Federal funds purchased and securities loaned or sold with affiliates under repurchase agreements, and other borrowed funds due to affiliates 110,967
121,049
Accounts payable, accrued expense and other liabilities payable to affiliates 8,201 6,365 Long-term debt payable to JPMorgan Chase & Co. and affiliates 18,527 18,526 Junior subordinated deferred interest debentures held by trusts that issued guaranteed capital debt securities 600
600
At June 30, 2009, and December 31, 2008, net derivative payables to affiliates were $6.1 billion and $2.8 billion, respectively.

67
NOTE 22 – ACCUMULATED OTHER COMPREHENSIVE INCOME (LOSS) Accumulated other comprehensive income (loss) includes the after-tax change in unrealized gains and losses on AFS securities, SFAS 52 foreign currency translation adjustments (including the impact of related derivatives), SFAS 133 cash flow hedging activities and SFAS 158 net loss and prior service cost (credit) related to JPMorgan Chase Bank, N.A.’s defined benefit pension and OPEB plans.
Six months ended June 30, 2009 (in millions)
Unrealized gains (losses) on AFS
securities(a)
Translation adjustments, net of hedges Cash flow hedges
Net loss and prior service costs (credit) of defined
benefit pension and OPEB plans
Accumulated other
comprehensiveincome (loss)
Balance at January 1, 2009 $ (1,815) $ (220) $ (239) $ (307) $ (2,581) Net change 1,303(b) 260(d) 97(e) (32)(f) 1,628
Balance at June 30, 2009 $ (512)(c) $ 40 $ (142) $ (339) $ (953)
Six months ended June 30, 2008 (in millions)
Unrealized gains (losses) on AFS
securities(a)
Translation adjustments, net of hedges Cash flow hedges
Net loss and prior service costs (credit) of defined
benefit pension and OPEB plans
Accumulated other
comprehensiveincome (loss)
Balance at January 1, 2008 $ 376 $ 17 $ (816) $ (263) $ (686) Net change (853)(b) 108(d) 13(e) 16(f) (716)
Balance at June 30, 2008 $ (477) $ 125 $ (803) $ (247) $ (1,402)
(a) Represents the after-tax difference between the fair value and amortized cost of the AFS securities portfolio and retained interests in securitizations recorded in other assets.
(b) The net change for the six months ended June 30, 2009, was due primarily to the narrowing of spreads on U.S. government agency mortgage-backed securities and credit card ABS positions as a result of improvement in the credit environment. The net change for the six months ended June 30, 2008, was due primarily to the net increase in interest rates on agency mortgage-backed pass-through securities and market spreads.
(c) Includes after-tax unrealized losses of $(374) million not related to credit on debt securities for which credit losses have been recognized in income.
(d) Includes $343 million and $154 million at June 30, 2009 and 2008, respectively, of after-tax gains/(losses) on foreign currency translation from operations for which the functional currency is other than the U.S. dollar, partially offset by $(83) million and $(46) million, respectively, of after-tax gains/(losses) on hedges. JPMorgan Chase Bank, N.A. may not hedge its entire exposure to foreign currency translation on net investments in foreign operations.
(e) The net change for the six months ended June 30, 2009, included $183 million of after-tax gains recognized in income and $86 million of after-tax gains, representing the net change in derivative fair value that was reported in comprehensive income. The net change for the six months ended June 30, 2008, included $130 million of after-tax losses recognized in income and $117 million of after-tax losses representing the net change in derivative fair value that was reported in comprehensive income.
(f) The net change for the six months ended June 30, 2009 and 2008, was primarily due to after-tax adjustments based upon the respective 2008 and 2007 final year-end actuarial valuations for the U.S. and non-U.S. defined benefit pension plans and the amortization of net loss and prior service credit into net periodic benefit cost.

68
NOTE 23 – CAPITAL JPMorgan Chase Bank, N.A.’s banking regulator, the OCC, establishes capital requirements, including well-capitalized standards, for national banks. The “well-capitalized” and minimum capital and leverage ratios applicable to JPMorgan Chase Bank, N.A. under U.S. banking regulatory agency definitions are listed in the table below.
In connection with the U.S. Government’s recent Supervisory Capital Assessment Program, U.S. banking regulators have developed a new measure of capital called Tier 1 common, which is defined as Tier 1 capital less elements of capital not in the form of common equity, including qualifying perpetual preferred stock, qualifying minority interest in subsidiaries and qualifying trust preferred capital debt securities.
For additional information regarding JPMorgan Chase Bank, N.A.’s capital ratios and the federal regulatory capital standards to which it is subject, see Note 28 on pages 78–79 of JPMorgan Chase Bank, N.A.’s 2008 Annual Financial Statements. As of June 30, 2009, and December 31, 2008, JPMorgan Chase Bank, N.A. was well-capitalized and met all capital requirements to which it was subject.
The following table presents the capital ratios for JPMorgan Chase Bank, N.A. at June 30, 2009, and December 31, 2008. JPMorgan Chase Bank, N.A. exceeded all well-capitalized regulatory thresholds for all periods presented.
(in millions, except ratios)
Tier 1 common capital
Tier 1 capital
Total capital
Risk-weighted assets(e)
Adjusted average assets(f)
Tier 1 common
ratio
Tier 1 capital ratio
Total capital ratio
Tier 1 leverage
ratio June 30, 2009 $ 100,643 $ 101,598(b)(c)(d) $ 142,825 $ 1,091,658 $ 1,645,827 9.2% 9.3% 13.1% 6.2% December 31, 2008 $ 99,571 $ 100,594 $ 143,854 $ 1,153,039 $ 1,705,750 8.6% 8.7% 12.5% 5.9% Well-capitalized ratios(a) NA 6.0% 10.0% 5.0%(g)
Minimum capital ratios(a) NA 4.0 8.0 3.0(h)
(a) As defined by the regulations issued by the OCC, the Federal Deposit Insurance Corporation and the Federal Reserve (“FRB”). (b) The OCC granted JPMorgan Chase Bank, N.A., for a period of 18 months following the Bear Stearns merger, relief up to a certain specified
amount and subject to certain conditions from the Federal Reserve’s risk-based capital and leverage requirements with respect to Bear Stearns’ risk-weighted assets and other exposures acquired by JPMorgan Chase Bank, N.A. in connection with the Bear Stearns merger. The relief ends September 30, 2009. Commencing in the second quarter of 2009, JPMorgan Chase Bank, N.A no longer adjusts its risk-based capital ratios to take into account the relief in the calculation of its risk-based capital ratios as of June 30, 2009.
(c) On May 12, 2009, JPMorgan Chase Bank, N.A. increased the required enhancement level underlying each tranche of outstanding notes issued by the Chase Issuance Trust (the “Trust”). On June 1, 2009, JPMorgan Chase Bank, N.A. began designating as “discount receivables” a percentage of new card receivables for inclusion in the Trust, which is expected to increase the yield in the Trust. The impact of these actions added $20 billion of risk-weighted assets for regulatory purposes, which decreased the Tier 1 capital ratio by approximately 20 basis points in the second quarter of 2009; this impact is included in the table above. Therefore, the consolidation of the Trust upon the implementation of SFAS 167 on January 1, 2010, will not have an additional impact on risk-weighted assets, but it will have an incremental impact on Tier 1 capital due to the effect of consolidating the assets and liabilities for GAAP at their assumed carrying values, including the establishment of loan loss reserves, at the adoption date. This incremental impact to the Tier 1 capital ratio expected as a result of the consolidation of the Trust in accordance with SFAS 166 and SFAS 167 is still being assessed for JPMorgan Chase Bank, N.A. For further discussion of the Trust, see Note 16 on pages 48–56 of these Consolidated Financial Statements.
(d) The FASB issued SFAS 166 and SFAS 167, which amend both SFAS 140 and FIN 46R and impacts the accounting for transactions that involve QSPEs and VIEs. Both standards are effective beginning January 1, 2010. JPMorgan Chase Bank, N.A. is still assessing the potential impact of the standards.
(e) Includes off–balance sheet risk-weighted assets at June 30, 2009, and December 31, 2008, of $315.1 billion and $332.2 billion, respectively. (f) Adjusted average assets, for purposes of calculating the leverage ratio, include total average assets adjusted for unrealized gains/losses
on securities, less deductions for disallowed goodwill and other intangible assets, investments in certain subsidiaries, and the total adjusted carrying value of nonfinancial equity investments that are subject to deductions from Tier 1 capital.
(g) Represents requirements for banking subsidiaries pursuant to regulations issued under the FDIC Improvement Act. (h) The minimum Tier 1 leverage ratio for bank holding companies and banks is 3% or 4%, depending on factors specified in regulations
issued by the OCC and FRB. Note:Rating agencies allow measures of capital to be adjusted upward for deferred tax liabilities, which have resulted from both nontaxable
business combinations and from tax-deductible goodwill. JPMorgan Chase Bank, N.A. had deferred tax liabilities resulting from nontaxable business combinations totaling $791 million at June 30, 2009, and $965 million at December 31, 2008. Additionally, JPMorgan Chase Bank, N.A. had deferred tax liabilities resulting from tax-deductible goodwill of $808 million at June 30, 2009, and $838 million at December 31, 2008.

69
The following table presents the components of JPMorgan Chase Bank, N.A.’s Tier 1 common capital, Tier 1 capital and Total capital. (in millions)
June 30, 2009
December 31, 2008
Tier 1 capital Tier 1 common capital: Common stockholder’s equity $ 131,130 $ 128,767 Effect of certain items in accumulated other comprehensive income (loss) excluded from Tier 1 common equity 993 2,355 Adjusted common stockholders’ equity 132,123 131,122 Less: Goodwill(a) 26,631 26,533
SFAS 157 DVA 1,406 1,802 Investments in certain subsidiaries — 1 Other intangible assets 3,443 3,215
Tier 1 common capital 100,643 99,571 Preferred stock — — Qualifying hybrid securities and minority interest(b) 955 1,023 Total Tier 1 capital 101,598 100,594 Tier 2 capital Long-term debt and other instruments qualifying as Tier 2 27,382 28,469 Qualifying allowance for credit losses 13,821 14,791 Adjustment for investments in certain subsidiaries and other 24 — Tier 2 capital 41,227 43,260 Total qualifying capital $ 142,825 $ 143,854
(a) The goodwill balance is net of any associated deferred tax liability. The prior period has been revised to conform with the current presentation.
(b) Primarily includes trust preferred capital debt securities of certain business trusts.
NOTE 24 – COMMITMENTS AND CONTINGENCIES For a discussion of JPMorgan Chase Bank, N.A.’s commitments and contingencies, see Note 29 on page 79 of JPMorgan Chase Bank, N.A.’s 2008 Annual Financial Statements.
Litigation reserve JPMorgan Chase Bank, N.A. maintains litigation reserves for certain of its outstanding litigation. In accordance with the provisions of SFAS 5, JPMorgan Chase Bank, N.A. accrues for a litigation-related liability when it is probable that such a liability has been incurred and the amount of the loss can be reasonably estimated. When JPMorgan Chase Bank, N.A. is named a defendant in a litigation and may be subject to joint and several liability and a judgment sharing agreement is in place, JPMorgan Chase Bank, N.A. recognizes expense and obligations net of amounts expected to be paid by other signatories to the judgment-sharing agreement.
While the outcome of litigation is inherently uncertain, management believes, in light of all information known to it at June 30, 2009, JPMorgan Chase Bank, N.A.’s litigation reserves were adequate at such date. Management reviews litigation reserves at least quarterly, and the reserves may be increased or decreased in the future to reflect further relevant developments. JPMorgan Chase Bank, N.A. believes it has meritorious defenses to the claims asserted against it in its currently outstanding litigation and, with respect to such litigation, intends to continue to defend itself vigorously, litigating or settling cases according to management’s judgment as to what is in the best interests of JPMorgan Chase and its stockholders.

70
NOTE 25 – OFF–BALANCE SHEET LENDING-RELATED FINANCIAL INSTRUMENTS AND GUARANTEES JPMorgan Chase Bank, N.A. utilizes lending-related financial instruments, such as commitments and guarantees, to meet the financing needs of its customers. The contractual amount of these financial instruments represents the maximum possible credit risk should the counterparties draw down on these commitments or JPMorgan Chase Bank, N.A. fulfills its obligation under these guarantees, and the counterparties subsequently fail to perform according to the terms of these contracts. For a discussion of off-balance sheet lending-related financial instruments and guarantees, and JPMorgan Chase Bank, N.A.’s related accounting policies, see Note 31 on pages 83–87 of JPMorgan Chase Bank, N.A.’s 2008 Annual Financial Statements.
To provide for the risk of loss inherent in wholesale-related contracts, an allowance for credit losses on lending-related commitments is maintained. See Note 15 on page 48 of these Consolidated Financial Statements for further discussion regarding the allowance for credit losses on lending-related commitments. The following table summarizes the contractual amounts of off–balance sheet lending-related financial instruments and guarantees and the related allowance for credit losses on lending-related commitments at June 30, 2009, and December 31, 2008. The amounts in the table below for credit card and home equity lending-related commitments represent the total available credit for these products. JPMorgan Chase Bank, N.A. has not experienced, and does not anticipate, that all available lines of credit for these products will be utilized at the same time. JPMorgan Chase Bank, N.A. can reduce or cancel these lines of credit by providing the borrower prior notice or, in some cases, without notice as permitted by law.
Off–balance sheet lending-related financial instruments and guarantees
Contractual amount Allowance for lending-related commitments
(in millions) June 30,
2009 December 31,
2008 June 30,
2009 December 31,
2008 Lending-related Consumer:
Credit card $ 19,306 $ 25,742 $ — $ — Home equity 70,642 95,743 — — Other 20,691 22,062 27 25
Total consumer $ 110,639 $ 143,547 $ 27 $ 25 Wholesale: Other unfunded commitments to extend credit(a)(b)(d) 183,085 186,136 319 348 Asset purchase agreements 30,010 53,729 2 9 Standby letters of credit and other financial guarantees(a)(c)(e) 89,125 94,796 396 272 Unused advised lines of credit 34,704 36,100 — — Other letters of credit(a)(c) 4,391 4,927 1 2
Total wholesale 341,315 375,688 718 631 Total lending-related $ 451,954 $ 519,235 $ 745 $ 656 Other guarantees Securities lending guarantees(f) $ 174,219 $ 182,204 NA NA Derivatives qualifying as guarantees(g) 85,694 83,730 NA NA (a) Represents the contractual amount net of risk participations totaling $27.0 billion and $28.2 billion at June 30, 2009, and December 31,
2008, respectively. In regulatory filings with the FRB these commitments are shown gross of risk participations. (b) Excludes unfunded commitments for other equity investments of $649 million and $627 million at June 30, 2009, and December 31, 2008,
respectively. (c) JPMorgan Chase Bank. N.A. held collateral relating to $29.2 billion and $30.8 billion of standby letters of credit and $1.3 billion and
$1.0 billion of other letters of credit at June 30, 2009, and December 31, 2008, respectively. (d) Includes commitments to affiliates of $78 million and $84 million at June 30, 2009, and December 31,2008, respectively. (e) Includes unissued standby letters of credit commitments of $37.3 billion and $39.3 billion at June 30, 2009, and December 31, 2008,
respectively. (f) Collateral held by JPMorgan Chase Bank, N.A. in support of securities lending indemnification agreements was $173.6 billion and
$182.7 billion at June 30, 2009, and December 31, 2008, respectively. Securities lending collateral comprises primarily cash, securities issued by governments that are members of the Organisation for Economic Co-operation and Development (“OECD”) and U.S. government agencies.
(g) Represents notional amounts of derivatives qualifying as guarantees.

71
Other unfunded commitments to extend credit Other unfunded commitments to extend credit include commitments to U.S. domestic states and municipalities, hospitals and other not-for-profit entities to provide funding for periodic tenders of their variable-rate demand bond obligations or commercial paper. Performance by JPMorgan Chase Bank, N.A. is required in the event that the variable-rate demand bonds or commercial paper cannot be remarketed to new investors. The amount of commitments related to variable-rate demand bonds and commercial paper of U.S. domestic states and municipalities, hospitals and not-for-profit entities was $23.3 billion and $23.5 billion at June 30, 2009, and December 31, 2008, respectively. Similar commitments exist to extend credit in the form of liquidity facility agreements with nonconsolidated municipal bond VIEs. For further information, see Note 17 on pages 57–62 of these Consolidated Financial Statements. Also included in other unfunded commitments to extend credit are commitments to investment- and noninvestment-grade counterparties in connection with leveraged acquisitions. These commitments are dependent on whether the acquisition by the borrower is successful, tend to be short-term in nature and, in most cases, are subject to certain conditions based on the borrower’s financial condition or other factors. The amount of commitments related to leveraged acquisitions at June 30, 2009, and December 31, 2008, was $2.9 billion and $3.6 billion, respectively. For further information, see Note 4 and Note 5 on pages 10–22 and 22–24 respectively, of these Consolidated Financial Statements. FIN 45 guarantees JPMorgan Chase Bank, N.A. considers the following off–balance sheet lending-related arrangements to be guarantees under FIN 45: certain asset purchase agreements, standby letters of credit and financial guarantees, securities lending indemnifications, certain indemnification agreements included within third-party contractual arrangements and certain derivative contracts. For a further discussion of the off–balance sheet lending-related arrangements JPMorgan Chase Bank, N.A. considers to be guarantees under FIN 45, and the related accounting policies, see Note 31 on pages 83–87 of JPMorgan Chase Bank, N.A.’s 2008 Annual Financial Statements. The amount of the liability related to FIN 45 guarantees recorded at June 30, 2009, and December 31, 2008, excluding the allowance for credit losses on lending-related commitments and derivative contracts discussed below, was $475 million and $535 million, respectively.
Asset purchase agreements Assets purchase agreements are principally used as a mechanism to provide liquidity to SPEs, predominantly multi-seller conduits, as described in Note 17 on pages 57–62 of these Consolidated Financial Statements.
The carrying value of asset purchase agreements of $112 million and $147 million at June 30, 2009, and December 31, 2008, respectively, which is classified in accounts payable and other liabilities on the Consolidated Balance Sheets, includes $2 million and $9 million at June 30, 2009, and December 31, 2008, respectively, for the allowance for lending-related commitments, and $110 million and $138 million at June 30, 2009, and December 31, 2008, respectively, for the fair value of the FIN 45 guarantee liability.
Standby letters of credit Standby letters of credit (“SBLC”) and financial guarantees are conditional lending commitments issued by JPMorgan Chase Bank, N.A. to guarantee the performance of a customer to a third party under certain arrangements, such as commercial paper facilities, bond financings, acquisition financings, trade and similar transactions. The carrying value of standby and other letters of credit of $762 million and $671 million at June 30, 2009, and December 31, 2008, respectively, which is classified in accounts payable and other liabilities on the Consolidated Balance Sheets, includes $397 million and $274 million at June 30, 2009, and December 31, 2008, respectively, for the allowance for lending-related commitments, and $365 million and $397 million at June 30, 2009, and December 31, 2008, respectively, for the fair value of the FIN 45 guarantee.

72
The following table summarizes the types of facilities under which standby letters of credit and other letters of credit arrangements are outstanding by the ratings profiles of JPMorgan Chase Bank, N.A.’s customers as of June 30, 2009, and December 31, 2008. The ratings scale is representative of the payment or performance risk to JPMorgan Chase Bank, N.A.’s internal risk ratings, which generally correspond to ratings defined by S&P and Moody’s.
Standby letters of credit and other financial guarantees and other letters of credit June 30, 2009 December 31, 2008
(in millions)
Standby letters of credit and other
financial guaranteesOther letters
of credit
Standby letters of credit and other
financial guarantees Other letters of credit(c)
Investment-grade(a) $ 66,454 $ 3,212 $ 73,032 $ 3,772 Noninvestment-grade(a) 22,671 1,179 21,764 1,155 Total contractual amount $ 89,125(b) $ 4,391 $ 94,796(b) $ 4,927 Allowance for lending-related commitments $ 396 $ 1 $ 272 $ 2 Commitments with collateral 29,174 1,348 30,831 1,000 (a) Ratings scale is based on JPMorgan Chase Bank, N.A.’s internal ratings, which generally correspond to ratings defined by S&P and Moody’s. (b) Represents contractual amount net of risk participations totaling $27.0 billion and $28.2 billion at June 30, 2009, and December 31, 2008,
respectively. (c) The investment-grade and noninvestment-grade amounts have been revised from previous disclosures.
Derivatives qualifying as guarantees In addition to the contracts described above, JPMorgan Chase Bank, N.A. transacts certain derivative contracts that meet the characteristics of a guarantee under FIN 45. The total notional value of the derivatives that JPMorgan Chase Bank, N.A. deems to be guarantees was $85.7 billion and $83.7 billion at June 30, 2009, and December 31, 2008, respectively. The notional value generally represents JPMorgan Chase Bank, N.A.’s maximum exposure to derivatives qualifying as guarantees, although exposure to certain stable value derivatives is contractually limited to a substantially lower percentage of the notional value. The fair value of the contracts reflects the probability of whether JPMorgan Chase Bank, N.A. will be required to perform under the contract. At June 30, 2009, and December 31, 2008, the fair value related to derivative guarantees was a derivative receivable of $211 million and $183 million, respectively, and a derivative payable of $3.0 billion and $5.6 billion, respectively. JPMorgan Chase Bank, N.A. reduces exposures to these contracts by entering into offsetting transactions, or by entering into contracts that hedge the market risk related to the derivative guarantees. In addition to derivative contracts that meet the characteristics of a guarantee under FIN 45, JPMorgan Chase Bank, N.A. is both a purchaser and seller of credit protection in the credit derivatives market. For a further discussion of credit derivatives, see Note 6 on pages 25–34 of these Consolidated Financial Statements, and Note 30 on pages 80–83 of JPMorgan Chase Bank, N.A.’s 2008 Annual Financial Statements
Loan sale- and securitization-related indemnifications Indemnifications for breaches of representations and warranties As part of JPMorgan Chase Bank, N.A.’s loan sale and securitization activities, as described in Note 15 and Note 17 on pages 42–46 and 47–56, respectively, of J JPMorgan Chase Bank, N.A.’s 2008 Annual Financial Statements, and Note 14 and Note 16 on pages 44–47 and 48–56 respectively, of these Consolidated Financial Statements, JPMorgan Chase Bank, N.A. generally makes representations and warranties in its loan sale and securitization agreements that the loans sold meet certain requirements. These agreements may require JPMorgan Chase Bank, N.A. (including in its roles as a servicer) to repurchase the loans and/or indemnify the purchaser of the loans against losses due to any breaches of such representations or warranties. Generally, the maximum amount of future payments JPMorgan Chase Bank, N.A. would be required to make for breaches under these representations and warranties would be equal to the current amount of assets held by such securitization-related SPEs, plus, in certain circumstances, accrued and unpaid interest on such loans and certain expense. During the first quarter of 2009, JPMorgan Chase Bank, N.A. resolved certain current and future claims for certain loans originated and sold by Washington Mutual. At June 30, 2009, and December 31, 2008, JPMorgan Chase Bank, N.A. had recorded a repurchase liability of $641 million and $1.0 billion, respectively.

73
Loans sold with recourse JPMorgan Chase Bank, N.A. provides servicing for mortgages and certain commercial lending products on both a recourse and nonrecourse basis. In nonrecourse servicing, the principal credit risk to JPMorgan Chase Bank, N.A. is the cost of temporary servicing advances of funds (i.e., normal servicing advances). In recourse servicing, the servicer agrees to share credit risk with the owner of the mortgage loans, such as the FNMA, or the FHLMC or a private investor, insurer or guarantor. Losses on recourse servicing predominantly occur when foreclosure sales proceeds of the property underlying a defaulted loan are less than the sum of the outstanding principal balance, plus accrued interest on the loan and the cost of holding and disposing of the underlying property. JPMorgan Chase Bank, N.A.’s loan sale transactions have primarily been executed on a nonrecourse basis, thereby effectively transferring the risk of future credit losses to the purchaser of the mortgage-backed securities issued by the trust. At June 30, 2009, and December 31, 2008, the unpaid principal balance of loans sold with recourse totaled $13.1 billion and $13.9 billion, respectively. The carrying values of the related liability that JPMorgan Chase Bank, N.A. had recorded, which is representative of JPMorgan Chase Bank, N.A.’s view of the likelihood it will have to perform under this guarantee, were $247 million and $230 million at June 30, 2009, and December 31, 2008, respectively.
NOTE 26 – BUSINESS SEGMENTS SFAS 131 defines the criteria by which management determines the number and nature of its “operating segments” (i.e., business segments) and sets forth the financial information that is required to be disclosed about these business segments. This information is accumulated, managed and discussed at the JPMorgan Chase level and not at the subsidiary level (i.e., JPMorgan Chase Bank, N.A.). For financial reporting purposes, JPMorgan Chase Bank, N.A. is viewed by JPMorgan Chase as a legal entity only; business segment financial information is not prepared for JPMorgan Chase Bank, N.A.

74
SUPPLEMENTARY INFORMATION Selected quarterly financial data (unaudited) (in millions, except ratio data) 2009 2008(c) Six months ended June 30, As of or for the period ended 2nd 1st 4th 3rd 2nd 2009 2008 Selected income statement data Noninterest revenue $ 9,434 $ 10,756 $ 8,176 $ 8,352 $ 8,329 $ 20,190 $ 16,701 Net interest income 9,844 10,463 10,858 7,111 6,965 20,307 13,548 Total net revenue 19,278 21,219 19,034 15,463 15,294 40,497 30,249 Provision for credit losses 5,799 6,078 5,497 2,936 2,533 11,877 6,271 Provision for credit losses –
accounting conformity(a) — — (442) 1,976 — — — Total noninterest expense 11,379 11,391 10,404 9,010 10,077 22,770 17,870 Income before income tax expense
(benefit) and extraordinary gain 2,100 3,750 3,575 1,541 2,684 5,850 6,108 Income tax expense (benefit) 644 1,247 1,352 (519) 674 1,891 1,878 Income before extraordinary
gain 1,456 2,503 2,223 2,060 2,010 3,959 4,230 Extraordinary gain(b) — — 1,325 581 — — — Net income $ 1,456 $ 2,503 $ 3,548 $ 2,641 $ 2,010 $ 3,959 $ 4,230
Tier 1 common capital ratio 9.2% 8.9% 8.6% 7.8% 8.1% Tier 1 capital ratio 9.3 9.0 8.7 7.9 8.2 Total capital ratio 13.1 12.8 12.5 11.4 12.0 Tier 1 leverage ratio 6.2 6.1 5.9 7.3 6.1
Selected balance sheet data (period-end)
Trading assets $ 276,837 $ 299,428 $ 365,365 $ 376,888 $ 368,829 Securities 334,618 323,980 199,744 145,439 114,837 Loans 596,605 628,358 662,312 701,664 481,213 Allowance for credit losses (22,740) (20,977) (17,809) (17,086) (11,425) Total assets 1,663,998 1,688,164 1,746,242 1,765,128 1,378,468 Deposits 974,480 979,696 1,055,765 1,013,390 797,676 Long-term debt 67,667 65,774 71,862 79,102 81,399 Total stockholder’s equity 131,130 130,548 128,767 125,639 108,929 (a) The third and fourth quarters of 2008 included an accounting conformity loan loss reserve provision related to the acquisition of Washington
Mutual Bank’s banking operations. (b) For a discussion of the extraordinary gain, see Note 3 on pages 10–12 of JPMorgan Chase Bank, N.A.’s 2008 Annual Financial Statements. (c) On September 25, 2008, JPMorgan Chase acquired the banking operations of Washington Mutual Bank. The transaction was accounted for as a
purchase and Washington Mutual’s results of operations are included in JPMorgan Chase Bank, N.A.’s results from the transaction date. For additional information on the Washington Mutual transaction, see Note 3 on page 9 of these Consolidated Financial Statements.

75
SUPPLEMENTARY INFORMATION
Selected annual financial data (unaudited) (in millions, except ratio data) As of or for the year ended December 31, 2008(e) 2007 2006 2005 2004(f) Selected income statement data Noninterest revenue(a) $ 33,229 $ 31,630 $ 29,191 $ 23,065 $ 16,979 Net interest income 31,517 23,137 18,135 15,283 11,962 Total net revenue 64,746 54,767 47,326 38,348 28,941 Provision for credit losses 14,704 4,672 1,809 1,101 198 Provision for credit losses – accounting
conformity(b) 1,534 — — — 336 Total noninterest expense 37,284 33,998 31,909 29,799 25,488 Income from continuing operations before income tax expense (benefit)
11,224
16,097
13,608
7,448
2,919
Income tax expense 2,711 5,365 4,487 2,563 937 Income from continuing operations 8,513 10,732 9,121 4,885 1,982 Income from discontinued operations(c) — — 798 207 196 Income before extraordinary gain 8,513 10,732 9,919 5,092 2,178 Extraordinary gain(d) 1,906 — — — — Net income $ 10,419 $ 10,732 $ 9,919 $ 5,092 $ 2,178
Tier 1 common capital ratio 8.6% 8.1% 8.1% 8.0% 8.1% Tier 1 capital ratio 8.7 8.3 8.2 8.1 8.3 Total capital ratio 12.5 11.8 11.4 11.2 11.7 Tier 1 leverage ratio 5.9 6.2 5.9 6.1 6.0
Selected balance sheet data (period-end) Trading assets $ 365,365 $ 390,459 $ 284,282 $ 221,837 $ 236,768 Securities 199,744 82,511 88,487 37,113 81,033 Loans 662,312 461,662 421,833 365,991 334,323 Allowance for credit losses (17,809) (7,864) (5,693) (5,254) (5,804) Total assets 1,746,242 1,318,888 1,179,390 1,013,985 967,365 Deposits 1,055,765 772,087 640,466 552,610 517,710 Long-term debt 71,862 87,575 71,256 55,612 46,406 Total stockholder’s equity 128,767 106,346 96,010 86,350 80,640 (a) JPMorgan Chase Bank, N.A. adopted SFAS 157 in the first quarter of 2007. See Note 5 on pages 13–24 of JPMorgan Chase Bank, N.A.’s 2008
Annual Financial Statements. (b) Results for 2008 and 2004 included an accounting conformity loan loss reserve provision related to the acquisition of the Washington Mutual’s
banking operations and the merger with Bank One Corporation, respectively. (c) On October 1, 2006, JPMorgan Chase & Co. completed the exchange of selected corporate trust businesses for the consumer, business banking
and middle-market banking businesses of The Bank of New York Company Inc. The results of operations of these corporate trust businesses are reported as discontinued operations for each period prior to 2007.
(d) For a discussion of the extraordinary gain, see Note 3 on pages 10–12 of JPMorgan Chase Bank, N.A.’s 2008 Annual Financial Statements. (e) On September 25, 2008, JPMorgan Chase acquired the banking operations of Washington Mutual Bank. The transaction was accounted for as a
purchase and Washington Mutual’s results of operations are included in JPMorgan Chase Bank, N.A.’s results from the transaction date. For additional information on the Washington Mutual transaction, see Note 3 on page 9 of these Consolidated Financial Statements.
(f) On July 1, 2004, Bank One Corporation merged with and into JPMorgan Chase Bank, N.A. Accordingly, 2004 results include six months of the combined JPMorgan Chase Bank, N.A.’s results and six months of heritage JPMorgan Chase Bank, N.A. results.

76
GLOSSARY OF TERMS
Advised lines of credit: An authorization which specifies the maximum amount of a credit facility JPMorgan Chase Bank, N.A. has made available to an obligor on a revolving but non-binding basis. The borrower receives written or oral advice of this facility. JPMorgan Chase Bank, N.A. may cancel this facility at any time.
AICPA: American Institute of Certified Public Accountants.
AICPA Statement of Position (“SOP”) 03-3: “Accounting for Certain Loans or Debt Securities Acquired in a Transfer.”
Beneficial interests issued by consolidated VIEs: Represents the interests of third-party holders of debt/equity securities, or other obligations, issued by VIEs that JPMorgan Chase Bank, N.A. consolidates under FIN 46R. The underlying obligations of the VIEs consist of short-term borrowings, commercial paper and long-term debt. The related assets consist of trading assets, available-for-sale securities, loans and other assets.
Benefit obligation: Refers to the projected benefit obligation for pension plans and the accumulated postretirement benefit obligation for OPEB plans.
Commodities contracts: Exchange-traded futures and over-the-counter forwards are contracts to deliver specified commodities (e.g., gold, electricity, natural gas, other precious and base metals, oil, farm products, livestock) on an agreed-upon future settlement date in exchange for cash. Exchange-traded commodities swaps and over-the-counter commodities swap contracts are contracts to deliver fixed cash payments in exchange for cash payments that float based on changes in an underlying commodities index.
Credit derivatives: Contractual agreements that provide protection against a credit event on one or more referenced credits. The nature of a credit event is established by the protection buyer and protection seller at the inception of a transaction, and such events include bankruptcy, insolvency or failure to meet payment obligations when due. The buyer of the credit derivative pays a periodic fee in return for a payment by the protection seller upon the occurrence, if any, of a credit event.
EITF: Emerging Issues Task Force.
EITF Issue 07-5: “Determining Whether an Instrument (or Embedded Feature) is Indexed to an Entity’s Own Stock.”
EITF Issue 99-20: “Recognition of Interest Income and Impairment on Purchased and Retained Beneficial Interests in Securitized Financial Assets.”
FASB: Financial Accounting Standards Board.
FIN 39: FASB Interpretation No. 39, “Offsetting of Amounts Related to Certain Contracts – an interpretation of APB Opinion No. 10 and FASB Statement No. 105.”
FIN 45: FASB Interpretation No. 45, “Guarantor’s Accounting and Disclosure Requirements for Guarantees, including Indirect Guarantees of Indebtedness of Others – an interpretation of FASB Statements No. 5, 57 and 107 and a rescission of FASB Interpretation No. 34.”
FIN 46R: FASB Interpretation No. 46 (revised December 2003), “Consolidation of Variable Interest Entities – an interpretation of ARB No. 51.”
Foreign exchange contracts: Includes foreign exchange forward contracts and cross-currency swaps. Foreign exchange forward contracts are contracts to exchange the currency of one country for the currency of another country at an agreed-upon price on an agreed-upon future settlement date. Cross-currency swaps are contracts between two parties to exchange interest and principal payments in one currency for the same in another currency.
Forward points: Represents the interest rate differential between two currencies, which is either added to or subtracted from the current exchange rate (i.e., “spot rate”) to determine the forward exchange rate.
FSP: FASB Staff Position.
FSP FAS 107-1 and APB 28-1: “Interim Disclosures about Fair Value of Financial Instruments.”
FSP FAS 115-2 and FAS 124-2: “Recognition and Presentation of Other-Than-Temporary Impairments.”
FSP FAS 132(R)-1: “Employers’ Disclosures about Postretirement Benefit Plan Assets.”

77
FSP FAS 140-3: “Accounting for Transfers of Financial Assets and Repurchase Financing Transactions.”
FSP FAS 141(R)-1: “Accounting for Assets Acquired and Liabilities Assumed in a Business Combination That Arise from Contingencies.”
FSP FAS 157-4: “Determining Fair Value When the Volume and Level of Activity for the Asset or Liability Have Significantly Decreased and Identifying Transactions That Are Not Orderly.”
Interest rate contracts: Includes interest rate swaps, forwards and futures contracts. Interest rate swap contracts involve the exchange of fixed- and variable-rate interest payments based on a contracted notional amount. Interest rate forward contracts are primarily arrangements to exchange cash in the future based on price movements of specified financial instruments. Interest rate futures contracts are financial futures which provide for cash payments based on interest rate changes on an underlying interest-bearing instrument or index.
Investment-grade: An indication of credit quality based on JPMorgan Chase Bank, N.A.’s internal risk assessment system. “Investment grade” generally represents a risk profile similar to a rating of a “BBB-”/”Baa3” or better, as defined by independent rating agencies.
LIBOR: London Interbank Offered Rate.
Mark-to-market exposure: A measure, at a point in time, of the value of a derivative or foreign exchange contract in the open market. When the mark-to-market value is positive, it indicates the counterparty owes JPMorgan Chase Bank, N.A. and, therefore, creates a repayment risk for JPMorgan Chase Bank, N.A. When the mark-to-market value is negative, JPMorgan Chase Bank, N.A. owes the counterparty; in this situation, JPMorgan Chase Bank, N.A. does not have repayment risk.
Master netting agreement: An agreement between two counterparties that have multiple derivative contracts with each other that provides for the net settlement of all contracts through a single payment, in a single currency, in the event of default on or termination of any one contract. See FIN 39.
Mortgage product types:
Alt-A Alt-A loans are generally higher in credit quality than subprime loans but have characteristics that would disqualify the borrower from a traditional prime loan. Alt-A lending characteristics may include one or more of the following: (i) limited documentation; (ii) high combined-loan-to-value (“CLTV”) ratio; (iii) loans secured by non-owner occupied properties; or (iv) debt-to-income ratio above normal limits. Perhaps the most important characteristic is limited documentation. A substantial proportion of traditional Alt-A loans are those where a borrower does not provide complete documentation of his or her assets or the amount or source of his or her income.
Option ARMs The option ARM home loan product is an adjustable-rate mortgage loan that provides the borrower with the option each month to make a fully amortizing, interest-only, or minimum payment. The minimum payment on an option ARM loan is based on the interest rate charged during the introductory period. This introductory rate has usually been significantly below the fully indexed rate. The fully indexed rate is calculated using an index rate plus a margin. Once the introductory period ends, the contractual interest rate charged on the loan increases to the fully indexed rate and adjusts monthly to reflect movements in the index. The minimum payment is typically insufficient to cover interest accrued in the prior month, and will “negatively amortize” as any unpaid interest is deferred and added to the principal balance of the loan. Option ARMs typically become fully amortizing loans upon reaching a negative amortization cap or on dates specified in the borrowing agreement, at which time the required payment generally increases substantially.
Prime Prime mortgage loans are made to borrowers with good credit records and a monthly income that is at least three to four times greater than their monthly housing expense (mortgage payments plus taxes and other debt payments). These borrowers provide full documentation and generally have reliable payment histories.
Subprime Subprime loans are designed for customers with one or more high risk characteristics, including but not limited to: (i) unreliable or poor payment histories; (ii) high loan-to-value (“LTV”) ratio of greater than 80% (without borrower-paid mortgage insurance); (iii) high debt-to-income ratio; (iv) the occupancy type for the loan is other than the borrower’s primary residence; or (v) a history of delinquencies or late payments on the loan.
NA: Data is not applicable or available for the period presented.

78
OPEB: Other postretirement employee benefits.
Principal transactions: Realized and unrealized gains and losses from trading activities (including physical commodities inventories that are accounted for at the lower of cost or fair value) and changes in fair value associated with financial instruments held by the investment banking business for which the SFAS 159 fair value option was elected. Principal transactions revenue also includes private equity gains and losses.
Purchased credit-impaired loans: Purchased loans for which the credit quality has deteriorated since origination, but prior to purchase. These loans are accounted for at fair value as of the purchase date, which includes the impact of estimated credit losses for the loans over the life of loan.
SFAS: Statement of Financial Accounting Standards.
SFAS 5: “Accounting for Contingencies.”
SFAS 52: “Foreign Currency Translation.”
SFAS 107: “Disclosures about Fair Value of Financial Instruments.”
SFAS 114: “Accounting by Creditors for Impairment of a Loan – an amendment of FASB Statements No. 5 and 15.”
SFAS 133: “Accounting for Derivative Instruments and Hedging Activities.”
SFAS 140: “Accounting for Transfers and Servicing of Financial Assets and Extinguishments of Liabilities – a replacement of FASB Statement No. 125.”
SFAS 141 and SFAS 141R: “Business Combinations.”
SFAS 155: “Accounting for Certain Hybrid Financial Instruments – an amendment of FASB Statements No. 133 and 140.”
SFAS 157: “Fair Value Measurements.”
SFAS 158: “Employers’ Accounting for Defined Benefit Pension and Other Postretirement Plans – an amendment of FASB Statements No. 87, 88, 106, and 132(R).”
SFAS 159: “The Fair Value Option for Financial Assets and Financial Liabilities – Including an amendment of FASB Statement No. 115.”
SFAS 160: “Noncontrolling Interests in Consolidated Financial Statements – an amendment of ARB No. 51.”
SFAS 161: “Disclosures about Derivative Instruments and Hedging Activities – an amendment of FASB Statement No. 133.”
SFAS 165: “Subsequent Events.”
SFAS 166: “Accounting for Transfers of Financial Assets – an amendment of FASB Statement No. 140.”
SFAS 167: “Amendments to FASB Interpretation No. 46(R).”
Troubled debt restructuring: Occurs when JPMorgan Chase Bank, N.A. modifies the original terms of a loan agreement by granting a concession to a borrower that is experiencing financial difficulty.
Unaudited: Financial statements and information that have not been subjected to auditing procedures sufficient to permit an independent certified public accountant to express an opinion.
U.S. GAAP: Accounting principles generally accepted in the United States of America.
U.S. government and federal agency obligations: Obligations of the U.S. government or an instrumentality of the U.S. government whose obligations are fully and explicitly guaranteed as to the timely payment of principal and interest by the full faith and credit of the U.S. government.
U.S. government-sponsored enterprise obligations: Obligations of agencies originally established or chartered by the U.S. government to serve public purposes as specified by the U.S. Congress; these obligations are not explicitly guaranteed as to the timely payment of principal and interest by the full faith and credit of the U.S. government.