Embed Size (px)
Citation preview
I S S U E 2 8 D E C E M B E R 2 0 1 3
Canadian Institute of ActuariesCasualty Actuarial SocietySociety of ActuariesJOINT RISK MANAGEMENT SECTION
3 Chairperson’s Corner By Stephen Lowe
5 Letter from the Editors Robert He and Ben Neff
6 Talk with a Risk Management Guru—Interview with Ken MunganBy Jenny Jin
10 Risk Management and Crisis Management: from Integration to Resiliency By Caroline Paulhan
12 Credit Risk Management: Observations from Real-Life ExamplesBy Olivier Sarfati
22 Duration Extension: Analysis and ConsiderationsBy Huy Nguyen Trieu
27 Quantitative Modeling of Operational Risk By Leyla Korkut, Mengxue Wang, Raymond T. Perkins III, Siyi Luo, Vincent Hong Chen
Mentors: Dr. Boning Tong, Vincent Hong Chen, Dr. Avery Ching
32 U.S. Flood Insurance: A Looming DisasterBy Katie Clouser
Issue Number 28 • DECEMBER 2013 Published by the Joint Risk Management Section Council of Canadian Institute of Actuaries, Casualty Actuarial Society and Society of Actuaries.
2013 SECTION LEADERSHIPNewsletter EditorsRobert He e: [email protected] Ben Neff e: [email protected]
OfficersBarry Franklin, FCAS, ASA, CERA, MAAA, Chairperson
Council MembersSusan Cleaver, FCAS, MAAAEugene Connell, FCAS, FCIA, ASA, CERA, MAAA S. Anders Ericson, ACAS, MAAA, CERALouise Francis, FCAS, MAAAMichael C. Hayes, FSA, MAAATom McIntyre, FCAS, MAAA, CERALloyd Milani, FSA, FCIA, MAAAKevin Olberding, FSA, MAAA, CERADavid Walczak, FSA, MAAAMark Yu, FSA, MAAA, CERAFei Xie, FSA, FCIA
SOA StaffKathryn Baker, Staff Editor e: [email protected] Schraub, Staff Partnere. [email protected] Martz, Section Specialiste. [email protected] Sweeney, Graphic Designere: [email protected]
This newsletter is free to section members. Current issues are available on the SOA website (www.soa.org).
To join the section, SOA members and non-members can locate a membership form on the Joint Risk Management Section Web page at http://www.soa.org/jrm
This publication is provided for informational and educational purposes only. The Society of Actuaries makes no endorsement, representation or guarantee with regard to any content, and disclaims any liability in connection with the use or misuse of any information provided herein. This publication should not be construed as professional or financial advice. Statements of fact and opinions expressed herein are those of the individual authors and are not necessarily those of the Society of Actuaries.
© 2013 Society of Actuaries. All rights reserved.
Your help and participation is needed and welcomed. All articles will include a byline to give you full credit for your effort. If you would like to submit an article, please contact David Schraub, JRMS Staff Partner, at dschraub@ soa.org. The next issues of Risk Management will be published:
PUBLICATION SUBMISSIONDATES DEADLINESMarch 2014 December 3, 2013 August 2014 May 1, 2014December 2014 September 1, 2014
ARTICLES NEEDED FOR RISK MANAGEMENT
Canadian Institute of ActuariesCasualty Actuarial SocietySociety of ActuariesJOINT RISK MANAGEMENT SECTION
Members Speak!Love an article or strongly disagree with the opinion developed in another paper? Please share any comments or feedback on the JRMS newsletter with David Schraub at [email protected].
PREFERRED FORMATIn order to efficiently handle articles, please use the following format when submitting articles:
• Word document • Article length 500-2,000 words • Author photo (quality must be 300 DPI)• Name, title, company, city, state and email
• One pull quote (sentence/fragment) for every 500 words
• Times New Roman, 10-point • Original PowerPoint or Excel files
for complex exhibits
If you must submit articles in another manner, please call Kathryn Baker, 847.706.3501, at the Society of Actuaries for help.
2 | DECEMBER 2013 | Risk management

IN MANY WAYS, LIFE AND CASUALTY actuarial work are different. Life insurance policies are mostly about timing, as people die once and only once, and receive a pre-agreed benefit upon death (except for Elfego Baca who had nine lives, according to Walt Disney). In contrast to life insurance, auto insurance policies are about claim frequency and severity, as driv-ers can have any number of accidents with widely vary-ing costs (a famous boxer is reported to have destroyed three Ferraris in a four-month period). As a result of these differences pricing and product development work is naturally different between the two sectors. However, the one area where I believe there is much commonality is risk management. This is what drew me to the Joint Risk Management Section (JRMS), which is jointly sponsored by the CIA, CAS, and SOA to provide a forum for shared research, development, and commu-nication on risk management issues.
In the last issue, Barry Franklin described three current and proposed areas of research being supported by the JRMS:
• How to review an ORSA — The new global ORSA requirements will require insurers to test their cap-ital in relation to their business plans over a multi-year planning horizon. The ORSA requirement is not a new report that must be produced and deliv-ered to regulators (although the production of some type of report is probably inevitable); the developers of ORSA envisioned it as a process through which senior management and the Board would engage in an assessment of the risks facing the enterprise. If the original vision for ORSA is to be realized then the review of the ORSA (by regulators, auditors, etc.) must also be more engaging than reading a report. Since we expect that actuaries will be inte-grally involved in ORSA activities, we should be able to suggest ways to maximize the effectiveness of the review. The JRMS is planning to launch a call for essays on this topic.
• Model Validation — Model risk is a critically important topic for actuaries. As risk measurement models go main-stream at companies, there will be increased reliance on them as decision support
tools. As the builders of models, actuaries need to take care that we aren’t materially adding to the risk, rather than just measuring it. The JRMS is encour-aging research to provide practical guidance to actu-aries in the validation of risk measurement models.
• Incentive Compensation — To one degree or anoth-er, employee behavior is influenced by incentive compensation plans. This can be a good thing, if the incentives are aligned with the success of the enter-prise; however, misalign-ment can create potentially powerful motivation for behavior that is at odds with good risk management. The JRMS has recently completed a very successful call for essays on this topic, with three prize papers published in the pre-vious issue.
As the outgoing Chairperson of the JRMS Council, I’d like to highlight a few additional activities and accom-plishments of the JRMS.
• 2013 ERM Symposium — Under the leadership of Rebecca Scotchie, a joint committee developed and put on an excellent ERM Symposium in April. The program was strong and varied, with just about something for everyone. The JRMS sponsored Sheila Baird, former Director of the FDIC, as a lun-cheon speaker. During the financial crisis, Sheila was at the center of the storm. In addition to providing insights into the crisis, she offered her own perspec-tives on how shortcomings in risk management were a contributing factor. While the crisis wasn’t primar-ily in our sector, there are still lessons for actuaries to learn from it.
• JRMS Webcasts — The JRMS has sponsored several webcasts, and has plans for additional webcasts, focused on topics of interest to risk management practitioners. Topics include: stress and scenario testing, ORSA, risk taxonomy, and extreme risks.
Chairperson’s Corner By Stephen Lowe
Risk management | DECEMBER 2013 | 3
C H A I R S P E R S O N ’ S C O R N E RC H A I R P E R S O N ’ S C O R N E R
Stephen Lowe, FSA, CERA,
MAAA, is managing director at
Towers Watson in Weatogue,
Conn. He can be reached at
Stephen.Lowe@towerswatson.
com.
CONTINUED ON PAGE 4

4 | DECEMBER 2013 | Risk management
value-added service. We are also thinking that if we go forward with the library, we will need a panel of reviewers to identify the best materials to be added to the library.
The JRMS Council held its annual planning session in November, where we reviewed our activities and assessed our priorities for 2014. The section is very interested in your thoughts and ideas on any areas that you believe should be an area of focus.
• Digital Library — The JRMS is considering the development and implementation of a digital library that would make books on ERM available to mem-bers of the section. Books would be downloadable to a variety of e-readers, and could be borrowed at no cost. Like any other library, books could only be bor-rowed for a limited time and could not be borrowed by someone else until returned. While there are lots of details to be worked out, this seems like a good way to make materials available to members as a
Chairperson’s Corner … | from Page 3
Recent Publications in Risk Management“Asia-Pacific regulatory developments – at a glance,” From the KPMG report, “2013 Evolving Insurance Regulation: A new dawn.” http://www.kpmg.com/global/en/issuesandinsights/articlespublications/evolving-insurance-regulation/pages/evolving-insurance- regulation-2013.aspx
“Applying Fuzzy Logic to Risk Assessment and Decision-Making,” by Kailan Shang and Zakir Hossen http://www.soa.org/Files/Research/Projects/research-2013-fuzzy-logic.pdf
The Casualty Actuarial Society, Canadian Institute of Actuaries, and the Society of Actuaries’ Joint Risk Management Section is pleased to make available a research report exploring areas where fuzzy logic models may be applied to improve risk assessment and risk decision-making.
“Policyholder Behavior in the Tail Risk Management Section Working Group Variable Annuity Guaranteed Benefits 2012 Survey Results”http://www.soa.org/Files/Research/Projects/research-2013-policy-behave-2012-survey.pdf
The mission of the PBITT working group is to examine and ultimately give guidance to actuaries on how to set policyholder assumptions in extreme scenarios. As part of its work, the PBITT working group issued its seventh survey to gather the range of assumptions actuaries use in pricing, reserving, and risk management of minimum guarantees on Variable Annuity products, such as death benefits, income benefits, withdrawal benefits and maturity benefits.
“Incentive Compensation – The Critical Blind Spot in ERM Today” http://www.soa.org/Library/Essays/jrm-2013-essay-incentive-comp-toc.aspx
The Joint Risk Management Section of the Society of Actuaries (SOA), the Casualty Actuarial Society (CAS) and the Canadian Institute of Actuaries (CIA), in collaboration with the International Network of Actuaries in Risk Management (IN-ARM), are pleased to release our fourth essay e-book, this time addressing “Incentive Compensation—The Critical Blind Spot in ERM Today.”
“PBA Implementation Guide” http://www.soa.org/Research/Research-Projects/Life-Insurance/research-2013-pba-implementation-guide.aspx
The Smaller Insurance Company and Financial Reporting Sections are pleased to announce the release of a new research report to provide a better understanding of the key considerations an insurer would encounter in making a principle-based framework for determining reserves and risk-based capital (PBA) a reality.

Risk management | DECEMBER 2013 | 5
AS THE INDUSTRY AND THE PROFESSION evolve, so does this newsletter. As the flagship pub-lication of the Joint Risk Management Section, the newsletter needs to have new elements added from time to time. In this issue, the new editorial team tries to bring more risk management articles focused on cap-ital market risks. This thought has the origin in market development in recent years. As insurance companies sell more complex products, their financial results are increasingly impacted by how well companies manage their capital market related risks. Employers respond to the development by deploying more actuaries in ALM and Hedging functions. Today, a large number of actu-aries work on capital market related issues. We hope to provide thought-provoking and timely articles to this growing group of members. The initiatives we are trying in this issue are two new series. The first one is called “Talk with a risk management guru.” The article is based on an interview with a highly respected risk management expert on a broad range of risk manage-ment topics. A young FSA will conduct the interview and put the discussions on paper. This way the expert can share his/her insights with the readers and we can involve young actuaries in volunteer work for the JRMS. The second series is called “Insights from Wall Street.” We’ll work with major banks to present articles on capital market risk management. We hope this series will serve another way to bridge the capital markets and the insurance industry. Obviously, it takes time and a lot of work to make the new initiative work, but we think the efforts are worthwhile. We will continue these efforts as long as the articles are well received and we can get continued supports from our partners. If your organization is interested in participating in these two new series or if you have any comments on the new initiatives, please contact Robert He at [email protected].
For this December issue, we are very pleased to have Ken Mungan from Milliman as our first “guru” and Citi bank as the first bank to present “Insights from Wall Street.” Ken is the founder of Milliman’s Financial Risk Management practice and did a lot of pioneer work in the ALM and Hedging areas. In this issue, Ken will share his insights on multiple topics that are of great interests to many members. We want to thank Ken for his willingness to participate and Jenny Jin, an FSA at Milliman, for her hard work to put the article together
among her busy sched-ule—even while she was on vacation in Greece! Oliver Sarfati and Huy Nguyen Trieu from Citi share their insights on cred-it risk management and interest rate risk management. Citi, with approximately 200 million customer accounts in more than 160 countries, pro-vides a broad range of financial products and services to consumers and institutions. This background enables the authors to provide analysis based on real life exam-ples instead of doing a theoretical exercise.
Moreover, we should not forget the other three inter-esting articles in this issue on broader risk management topics. Caroline Paulhan’s article “Risk Management and Crisis Management: from Integration to Resiliency” provides a unique perspective on crisis management. Quantitative Modeling of Operational Risk, (written by Leyla Korkut, Mengxue Wang, Raymond T. Perkins III, Siyi Lou, and Vincent Hong Chen), provides a quanti-tative approach to model operational risk. Last but not the least, Katie Clouser, another young actuary, shares us her thoughts on U.S. flood insurance.
As usual, we provided a list of recent articles and papers that may be of interest to the members. These pieces can provide further information on a broad range of topics.
We would like to give a special thank you to David Schraub, Kathryn Baker, and Jamie Zuo for helping us pull together this December newsletter. Also we want to thank Naveed Choudri at Citi for his help to coordinate Citi articles for our initiative.
Enjoy reading!
Letter from the Editors Robert He and Ben Neff
C H A I R S P E R S O N ’ S C O R N E RL E T T E R F R O M T H E E D I T O R S
Robert He, FSA, CERA, is vice
president at Guggenheim Insurance
in Indianapolis, Ind. He can be
reached at robert.he@guggenheim-
insurance.com.
Ben Neff, FSA, is an actuary at
GGY Axis in Indianapolis, Ind.
He can be reached at Ben.Neff@
GGYAXIS.com.

6 | DECEMBER 2013 | Risk management
Talk with a Risk Management Guru—Interview with Ken MunganBy Jenny Jin
FIVE YEARS AFTER THE 2008 FINANCIAL CRISIS, the world is in a much different place than we have observed in any historical period. The life insur-ance industry has found itself changing faster than ever to keep up with customer demands while trying to man-age a sustainable business. The Joint Risk Management section newsletter sat down with Ken Mungan, founder of Milliman’s Financial Risk Management practice, to speak about the latest changes in the industry and the role that risk management will play in shaping the fu-ture of the business.
JENNY JIN: HOW DID THE FINANCIAL RISK MANAGEMENT PRACTICE GET STARTED?Ken Mungan: In the late1990s, Milliman put out a sur-vey to the largest insurers at the time asking them what changes they see emerging in the market and the areas where they needed help. One of the biggest take aways from the survey was that the life insurance industry was transitioning from selling protection oriented life insurance products which were mostly backed by fixed income assets to offering retirement savings products
which were largely invested in equities. Companies were also backed into offering guarantees on these products. Executives at these companies were aware of the risks involved but did not have the ex-pertise at the time to address them. Milliman saw the opportunity and I joined the firm to help with this ini-tiative. The inter-net bubble bursting
and technology boom of 2002 was really the trigger event that moved the practice from the back burner to the front burner and when the practice was able to grow substantially.
JENNY JIN: HOW HAS THE PRACTICE AND INDUSTRY EVOLVED SINCE THE BEGINNING?Ken Mungan: In the early 2000s, life insurance compa-nies were reluctant users of hedging but it has now become a core competency of every major life insurance company.
Risk management before the financial crisis used to be a behind-the-scenes activity. Now, because of the experi-ence during the financial crisis, consumers demand access to risk management services themselves. For example, Variable Annuity markets used to emphasize tax bene-fits and brand names of various funds that were offered in the product. Today, customers are showing up at the door looking for active risk management and insurance companies are highlighting these features front and center.
If you look at Variable Annuity products, risk manage-ment has gone directly into the funds. Hedging occurs inside the fund instead of on the company’s balance sheet. With previous generation products, customers had long-term guarantees but during the financial cri-sis, they had to watch their account value drop signifi-cantly and as a result suffer illiquidity. By providing customers direct access to the hedging program via risk managed funds, insurance companies can provide guarantees which are less costly to hedge and this will ultimately benefit the end customer. The one thing that I have learned is that the life insurance industry is a very competitive industry. Any cost savings will filter through to the end consumer. It may take some time, but ultimately the consumers will get the benefit.
JENNY JIN: WHAT ARE SOME RISKS THAT INSURANCE COMPANIES FACE IN THE POST CRISIS ERA?Ken Mungan: Insurance companies now recognize that the equity market risk they face is higher than they realized prior to the crisis. That is an area where there is a tremendous amount of focus and a lot of progress has been made. While the risk is clearly there, the life insurance industry is better equipped to handle it than they have ever been. But there are also other risks.
The interest rate environment is very challenging today. We have historical low levels of interest rate and that
Kenneth P. Mungan, FSA, MAAA,
is principal at Milliman, Inc. in
Chicago, Ill. He can be reached at
Jenny Jin, FSA, is a consulting
actuary in the Financial Risk
Management practice at Milliman
Inc. in Chicago, Ill. She can be
reached at [email protected].

Risk management | DECEMBER 2013 | 7
“The Financial Crisis has taught us that it isimportant not to let risk management decisions be
second to short-term decisions around financial reporting.”
CONTINUED ON PAGE 8
straight up guarantee consumes scarce balance sheet capital and is often not the most efficient way to ful-fill the needs of the customers. Instead of maximizing sales of particular products, Insurance companies are really trying to maximize meeting the customer needs from a financial planning point of view and in the process lowering the risk of their own balance sheet.
The truth that is the life insurance industry has a golden opportunity with the retirement of the baby boomers. I read a survey recently that asked thousands of indi-viduals “What are their primary financial concerns?” The top five answers were market risk, longevity risk, inflation, long-term care, taxes. If you think about the top five concerns, four out of five are risk management issues and they are issues that are addressed by the life insurance industry and the products that life insurance companies sell. You couldn’t possibly have a better market!
JENNY JIN: WHAT ARE INDUSTRY BEST PRACTICES WHEN IT COMES TO HEDGING?Ken Mungan: What I am seeing is that the best practice is divided into two segments: pre-crisis and post-crisis. Prior to the crisis, funds are invested in benchmark in-dices and hedging practice follows traditional option pricing theory. The broad consensus is that you have Delta and Rho hedging. When interest rates become re-ally low, we see that some companies will scale down their Rho hedging. On Vega hedging, the reality is that the customer’s option is not an option in the financial engineering sense. The customer is not an option trad-er- they don’t buy and sell their contracts. The volatility exposure that companies have is a multi-decade illiquid option. So the insurance company needs to be able to quantify what that volatility exposure is and manage it over the long term. What this means is that when implied volatility in the market is at or below pricing volatility, they should be a buyer of volatility and vice versa. The insurance company does have a fundamental advantage in that the options they underwrite are illiq-uid so it doesn’t make sense to ignore that.
The game changes completely when you adopt man-aged risk funds in the products. It means that insur-
presents many challenges for the life insurance indus-try. Companies have to be prepared to survive through this period of sustained low interest rate. And at the same time, with quantitative easing being reduced or eliminated, companies need to be aware of rapid spikes in interest rates which could be equally damaging. So companies need to be prepared for two opposite scenar-ios and attend to interest rate with an intensity that the industry hasn’t seen in a while.
One thing that the financial crisis taught us is that it is important not to let risk management decisions be sec-ond to short-term decisions around financial reporting. Sometimes, companies try to engineer their quarterly GAAP income in a certain way and they end up mak-ing certain risk management choices to hit a target or profile. The Financial Crisis has shown that if you are leaving yourself vulnerable to serious market risk, then there will be problems in the long run. Because when a financial crisis develops, all the rules of the game change; the focus shifts from short-term earnings to showing that you are protected against this bad event that is unfolding—from GAAP measures to Statutory solvency reserves and capital. Companies need to put the core risk management framework in place first and let that guide their decisions, understanding and con-veying to the market that there may be some noise in short-term earnings because we are trying to build a stable company for the long run.
JENNY JIN: HOW CAN COMPANIES ADDRESS THESE RISKS AND PRODUCE SUSTAINABLE VALUE IN THE LONG RUN?Ken Mungan: In the past, companies protected bal-ance sheets by purchasing long-term options, matching durations and so on. By changing the game so to speak, and adding protection strategies into the products, com-panies can manage the risk holistically. Rather than do-ing things in a linear fashion and being reactive to the way things are presented, you end up with a more effi-cient solution to fulfill the needs of customers.
Customers want to know that they are able to with-stand market volatility, have sufficient cash flow to re-spond to unplanned needs and not run out of money if they live to be 90 years old. Offering customers a

8 | DECEMBER 2013 | Risk management
incorporated it into their own valuations. Over the past couple years, this has become a typical industry practice that is widely accepted by auditors and positively viewed by the rating agencies.1
JENNY JIN: HOW CAN THE SKILL SET AND RISK MANAGEMENT TECHNIQUES WE HAVE LEARNED AS ACTUARIES BE APPLIED OUTSIDE OF THE INSURANCE INDUSTRY?Ken Mungan: The concept of having a hedging strat-egy inside a fund originated from the pain and suffer-ing of fund managers and financial advisors. What we have found is that the traditional measure of return over a short period of time is not suitable for people manag-ing their personal finances and planning for retirement. Over the long run, a managed risk strategy has the poten-tial to outperform the traditional buy and hold strategy in this context. The reason is two fold. First, volatility destroys value. Mathematically speaking, if you extend the time horizon, your annualized returns are going to be reduced by volatility squared over two. Secondly, there is the sequence of return problem. While a fund may recover from a market downturn in three, four or five years, this is not necessarily true for the investor in the fund. If you have an investor taking withdrawals every year for retirement, they will be depleting their account at an accelerated rate and they will not recover when the market bounces back. When you take these factors into consideration, we find that the everyday investor who is planning for retirement is fundamentally better off in-cluding risk managed funds in their portfolio.
There is a huge market for retirement products, both guaranteed and non-guaranteed. As baby boomers go into retirement, entirely new markets have opened up and actuaries are well positioned to advise in this mar-ket. In the past, the focus of investment and retirement planning has always been on relative value analysis and stock selection; and actuaries did not really participate as our skill set was less relevant here. Now that the true value of risk management is appreciated, we have got ourselves a seat at the table.
ance companies’ hedging should be residual hedging. Instead of hedging a linear combination of indices, companies have to model the embedded strategy and calculate the residual exposure. Typically that means the Vega more or less disappears. While the stock market may experience persistent high volatility, the funds will be able to adjust and rebalance in a matter of days. The strategy doesn’t stop there, most funds also have a capital protection piece which means that the Delta exposure of the company is also reduced. It has really been a whole sale reengineering of one of the in-dustry’s core products and companies are making prog-ress in terms of embracing all the changes involved.
JENNY JIN: INSURANCE COMPANIES UNDERWRITE LONG-TERM ILLIQUID OPTIONS AND THEREFORE NEED TO PERFORM VALUATION USING AN ESTIMATE OF VOLATILITY. WHAT VOLATILITY BENCHMARK SHOULD THEY USE?Ken Mungan: If you look at the exchange traded mar-ket and the OTC market, it is a short-term market and the liquidity dries up very quickly beyond five years. The participants in the options market are highly lev-eraged, such as hedge funds and propriety traders. So when financial conditions deteriorate, there is a rapid accelerated withdrawal from the market due to this leverage. When you look at implied volatility, the mea-sure contains two pieces of information: the market es-timate of the volatility and the degree of leverage of market participants. If you take those two measures and apply it to life insurance companies, you will get a dis-torted picture. To the extent that the goal is to provide life insurance companies with the best estimate of the obligations of the insurance companies, then we should focus on the first piece, which is the volatility of the market itself.
One of the things that Milliman did is create The Mil-liman Hedge Cost Index™ (MHCI) to address this. We use stochastic volatility models to calibrate to market data and come up with current best estimate of the vola-tility term structure. Companies have used this data and
Talk with a Risk Management Guru … | from Page 7

Risk management | DECEMBER 2013 | 9
“Risk management is now a corefunction. Actuaries have the opportunity to
participate in the financials of the company at a much higher level than before, in a much
more central way.”
JENNY JIN: FINALLY, WHAT ADVICE WOULD YOU GIVE TO A YOUNG ACTUARY STARTING OUT HIS CAREER?Ken Mungan: I think it is a wonderful time to be in that position. I would encourage young actuar-ies to specialize in financial risk management. There are so many fascinating problems to work on today and there has been so much progress in the past ten years that you are able to take what has been done and build on it even further. The reason it is more attrac-tive today than it used to be is that risk management is now a core function. You have the opportunity to participate in the financials of the company at a much
RATEM
AK
ING A
ND PRODUCT MAN
AG
EM
ENT
CAS Ratemaking and Product Management Seminar
March 30 - April 1, 2014 Marriott Wardman Park
Washington, DC
ENDNOTE
1 The Milliman Hedge Cost Index can be found at www.milliman.com/Solutions/Products/The-Milliman-Guarantee-Index-and-Milliman-Hedge-Cost-Index.
higher level than before, in a much more central way. There is a much greater appreciation of the skills that actuaries bring to the table. Getting through the actuari-al exams is really tough but it is well worth the pain and suffering for the benefits that come through so my advice would be to stick with it and enjoy the fruit of your hard work!
10 | DECEMBER 2013 | Risk management
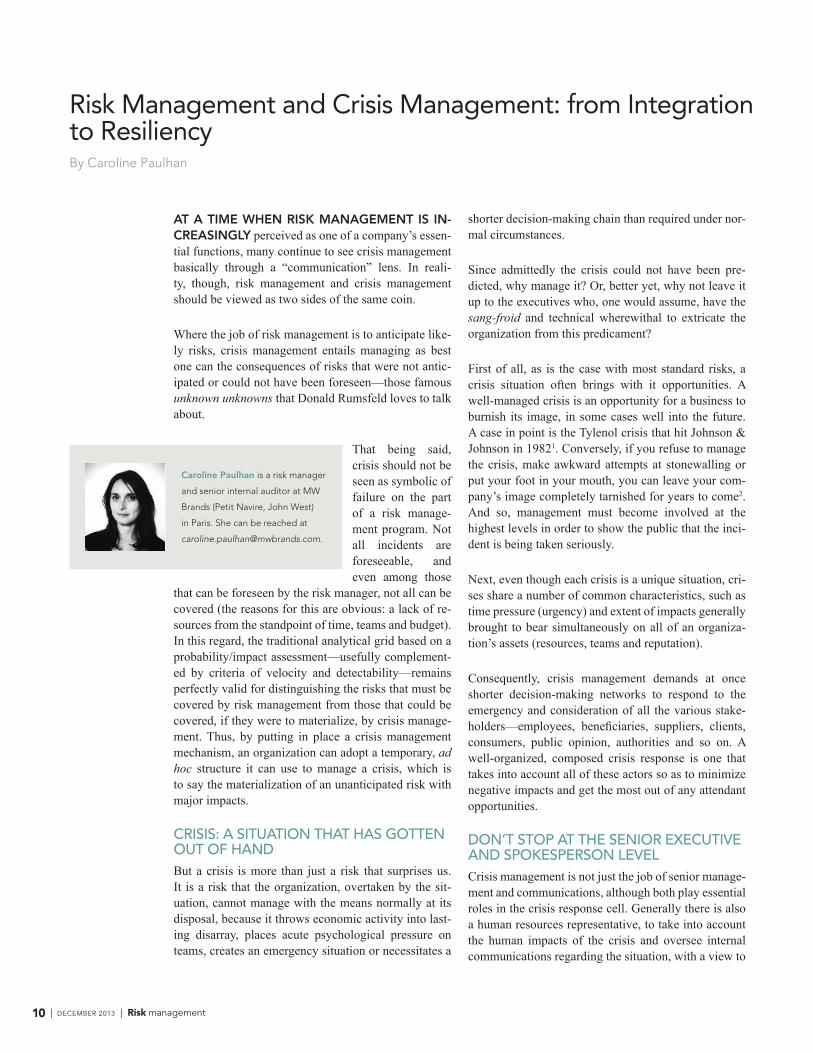
Risk Management and Crisis Management: from Integration to Resiliency By Caroline Paulhan
AT A TIME WHEN RISK MANAGEMENT IS IN-CREASINGLY perceived as one of a company’s essen-tial functions, many continue to see crisis management basically through a “communication” lens. In reali-ty, though, risk management and crisis management should be viewed as two sides of the same coin.
Where the job of risk management is to anticipate like-ly risks, crisis management entails managing as best one can the consequences of risks that were not antic-ipated or could not have been foreseen—those famous unknown unknowns that Donald Rumsfeld loves to talk about.
That being said, crisis should not be seen as symbolic of failure on the part of a risk manage-ment program. Not all incidents are foreseeable, and even among those
that can be foreseen by the risk manager, not all can be covered (the reasons for this are obvious: a lack of re-sources from the standpoint of time, teams and budget). In this regard, the traditional analytical grid based on a probability/impact assessment—usefully complement-ed by criteria of velocity and detectability—remains perfectly valid for distinguishing the risks that must be covered by risk management from those that could be covered, if they were to materialize, by crisis manage-ment. Thus, by putting in place a crisis management mechanism, an organization can adopt a temporary, ad hoc structure it can use to manage a crisis, which is to say the materialization of an unanticipated risk with major impacts.
CRISIS: A SITUATION THAT HAS GOTTEN OUT OF HANDBut a crisis is more than just a risk that surprises us. It is a risk that the organization, overtaken by the sit-uation, cannot manage with the means normally at its disposal, because it throws economic activity into last-ing disarray, places acute psychological pressure on teams, creates an emergency situation or necessitates a
shorter decision-making chain than required under nor-mal circumstances.
Since admittedly the crisis could not have been pre-dicted, why manage it? Or, better yet, why not leave it up to the executives who, one would assume, have the sang-froid and technical wherewithal to extricate the organization from this predicament?
First of all, as is the case with most standard risks, a crisis situation often brings with it opportunities. A well-managed crisis is an opportunity for a business to burnish its image, in some cases well into the future. A case in point is the Tylenol crisis that hit Johnson & Johnson in 19821. Conversely, if you refuse to manage the crisis, make awkward attempts at stonewalling or put your foot in your mouth, you can leave your com-pany’s image completely tarnished for years to come2. And so, management must become involved at the highest levels in order to show the public that the inci-dent is being taken seriously.
Next, even though each crisis is a unique situation, cri-ses share a number of common characteristics, such as time pressure (urgency) and extent of impacts generally brought to bear simultaneously on all of an organiza-tion’s assets (resources, teams and reputation).
Consequently, crisis management demands at once shorter decision-making networks to respond to the emergency and consideration of all the various stake-holders—employees, beneficiaries, suppliers, clients, consumers, public opinion, authorities and so on. A well-organized, composed crisis response is one that takes into account all of these actors so as to minimize negative impacts and get the most out of any attendant opportunities.
DON’T STOP AT THE SENIOR EXECUTIVE AND SPOKESPERSON LEVELCrisis management is not just the job of senior manage-ment and communications, although both play essential roles in the crisis response cell. Generally there is also a human resources representative, to take into account the human impacts of the crisis and oversee internal communications regarding the situation, with a view to
Caroline Paulhan is a risk manager
and senior internal auditor at MW
Brands (Petit Navire, John West)
in Paris. She can be reached at

Risk management | DECEMBER 2013 | 11
“A well-managed crisis is an opportunity for a busi-ness to burnish its image, in some cases well into the
future.”
avoiding rumours and scuttlebutt that can sometimes cause as much disarray as the incident itself. The cell should also include a crisis coordinator, whose role it is to keep a record of the key events taking place during the crisis, the flow of information and the decisions taken in order to ensure that they are properly imple-mented.
These four essential functions can of course be com-pleted, depending on the type of crisis, by as many experts as necessary. But it is important that the crisis response cell remain a lean outfit, with well-defined roles, in order to be agile and quick on its feet. This allows a maximum of time to effectively carry out the decisions that are taken.
MUTUALLY AND NATURALLY BENEFICIALHow then do we articulate risk management and crisis management? There is more common ground than one might think.
First, risk management and crisis management are both anticipatory endeavours, with most of the work being carried out in “peace time.” The structuring of infor-mation/decision flows, training of stakeholders and de-sign of response strategies can and must be prepared before the risk or crisis materializes. Second, both risk management and crisis management require an excel-lent overall understanding of the organization’s activi-ties and, in a broader sense, of the ecosystem in which the organization operates. Accordingly, they are deeply transversal. Last and most important, risk management and crisis management share the same overarching ob-jective: to enable the organization to survive a brutal and often prolonged change to its usual operating con-ditions.
As experts in their field, the risk manager and crisis manager generally bring to their respective functions an expertise gained from other industries and thus a fresh perspective on the organization. Typically operat-ing at a high level of the organization, they have access to important people within the enterprise. Integrating them better into cross-disciplinary working groups and encouraging regular exchanges during non-crisis periods concerning their respective themes would go
ENDNOTE
1 In 1982, seven people died after ingesting cyanide-laced Tylenol capsules. Johnson & Johnson immediately took the transparency route, implementing major and costly measures to inform consumers and to significantly improve product security. Eventually, the company’s image came out enhanced, and the Tylenol brand remains one of the best known in its market. To this day, the case remains unsolved.
2 Examples include the lengthy conflict between Ford and Firestone in the early 2000s, the Toyota “accelerator crisis” of 2009 and the BP/Deepwater crisis of 2010.
a long way toward ensuring a more effective brand of crisis management and, overall, a more resilient organization.

12 | DECEMBER 2013 | Risk management
Credit Risk Management: Observations from Real-Life ExamplesBy Olivier Sarfati
ONE TAKEAWAY OF THE 2008-2009 credit crisis is that correlation between normally uncorrelated assets can reach 100%. This, in turn, makes diversification a mediocre hedging strategy at best. To make matters worse, assets that should have been correlated, like a CDS and a bond on the same issuer, ended up de-cor-
relating, at least momentarily, as basis traders un-wound their posi-tions. These were exceptional times, yet, just the kind a risk manager needs to prepare for.
To start with, we have some interesting observations that came up from real-life examples of advising clients on how to hedge their portfolio. Namely:
1. Higher correlation while it can be a negative, can be used in the risk-manager’s advantage
2. Put options or volatility derivatives such as VIX calls can be efficient hedges as they provide well-needed convexity.
3. Liquidity matters: a good hedge has to protect against mark-to-market risk, and has to be monetiz-able if need arises.
The first requirement for a hedge is to be correlated, or become correlated in times of crisis, with the asset to hedge. Figure 1 shows the rolling realized correlation of a few selected underlyings vs. the S&P500.
As expected Gold demonstrated negative correlation at the onset of the crisis, but unexpectedly it became positively correlated in 2009. Such variability makes it a risky hedge. Before 2008, European equities appeared more correlated to U.S. equities than U.S. Investment Grade credit spreads. A possible explanation is that in 2006, 2007 and early 2008, flows into credit struc-tured products were so large that they compressed the IG index regardless of economic news. After 2008, supply and demand flows became more balanced and credit spreads correlated strongly to the S&P500. Consequently, credit managers looking for hedges were no longer restricted to buying protection on just the IG (investment grade) or the HY(high yield) index, via options or tranches, but they could also consider deriv-atives on the S&P500, benefitting from one of the most mature and liquid market.
Figure 2 shows that the VIX is also strongly correlated, albeit negatively this time, to U.S. equities, U.S. credit spreads and Real Estate stocks. This essentially opens the suite of VIX derivatives to risk managers. As this article details later, the VIX, or more accurately the tradable instruments on the VIX, offer more convexity than SPX options, which is a characteristic looked for by Credit PMs.
Figure 1. Increasing 6m Correlation to S&P 500
Figure 2. Negative 6m Correlation to VIX
Olivier Sarfati is Managing
Director, Head of US Equity Trading
Strategies at Citi in New York, N.Y.
He can be reached at olivier.sarfati@
citi.com.
While equity fund managers have been using equity options to manage risk for years, it occurred to us that investors exposed to credit risks (insurance com-panies for instant) were less accustomed to doing so. The purpose of this article is to share with fellow risk or asset-managers a few strategies to manage credit risksin their portfolios.

Risk management | DECEMBER 2013 | 13
CONTINUED ON PAGE 14
“The 2008-09 crisis made the case for SPX hedges and VIX calls for both Equity and credit PMs alike”
We observed the credit spread distribution of SAM’s book and found that a proxy made of 85% of the IG CDX and 15% of the HY index was a good match. The average credit spread of the proxy (214 bps) is very close to that of SAM’s portfolio (218 bps). Comparing each credit spread bucket showed very similar results. The sector distributions were similar too.
Of course, there are a number of technical challenges along the way. For example, new CDX indices are issued every six months and constituents change over time as companies default, get downgraded or upgrad-ed. Therefore, while SAM’s portfolio is similar to the current indices today, we do not know what SAM’s holdings were five years ago.
For additional caution, we compared the composition of SAM’s holdings with the S&P500, as shown in Figure 6. The reason is that while correlation may have been strong in the past, future correlation is not guaranteed. For example, a meaningful difference in sector expo-sure would introduce a tracking error risk if a given sector dispersed away from the index. It turned out that SAM was overweight Financials (18% more than S&P500) and underweight IT (15% less than S&P500). Given that neither financials nor IT firms were trading at lofty valuations at the time of our analysis, SAM felt comfortable with just an SPX hedge and did not feel the need to address the Financial/IT mismatch.
There are also a number of hedging instruments, such as variance swaps, best-of-puts, or timer puts to name a few, that have been used by savvy investors for manag-ing risk. In the interest of brevity, this article will focus on most common hedging practices.
CASE STUDY: BACKGROUND INFORMATIONTo make things more concrete, we recounted below an actual analysis we ran in 2012 for an asset manager, client of Citigroup. To respect the client’s anonymity, we changed all the relevant data. However, we described the steps of our analysis as it happened and showed results’ largely in line with the real life example.
Standard Asset Management, whom we will refer to as SAM, reached out to Citi for advice on hedging the sys-temic risk in one of their portfolios. The assets in scope totalled $10bn across hundreds of corporate bonds for which they provided the exact inventory. We asked for historical valuations of the portfolio to better assess the risk, but the data were not available. Most of these bonds had limited liquidity so finding historical daily valuations five years after the fact was not an option. One way to circumvent this problem was to create a proxy index for SAM’s portfolio, essentially finding
Figure 3. 5Yr. CDX Is Spread vs SPY Spot
Figure 4. %Yr CDX HY Price vs IWM Spot
a liquid portfolio that would match the investment pro-file of today’s inventory assuming that it would have matched it historically.
The ideal building blocks for a proxy are the IG and the HY CDX indices. There are three reasons for this:
i. Both indices are highly liquid and easy to trade
ii. Historical data are trustworthy and available—at least from 2005 onward
iii. IG and HY are respectively strongly correlated to the S&P500 and the Russell 2000 indices as seen in Fig 3 and 4. So a combination of them will be correlated to equities, which opens the door to more hedging strategies.

14 | DECEMBER 2013 | Risk management
The chart below shows how SAM’s proxy portfolio is highly correlated to the S&P500. Adding a component on the Russell 2000 barely added to the correlation results, so we only kept the S&P500 component. The average correlation is 75% over the five year period of time from 2007 to 2011, as seen in Figure 7. The correlation is even higher during the time of crisis, i.e. 85-95% in late 2011.
Figure 5. SAM’s Corporate Credit Exposure
Figure 7. SAM vs SPX Performance & Correlation since 2007
Figure 6. SAM’s Sector Distribution
Credit Risk Management … | from Page 13

Risk management | DECEMBER 2013 | 15
“Equity put options and VIX options are attractive hedges for credit portfolios.”
CONTINUED ON PAGE 16
Possible Hedging SolutionsTo see how using SPX as a hedge ranks vs. other options, we took a pragmatic approach and listed six hedging strategies:
i. Sell positions. Simple & Effective. Risk is removed and so is upside exposure. Not mention-ing the prohibitive bid-offer for doing so, the main drawback is that SAM is in the asset-management business and cannot justify charging fees on cash.
ii. Buy protection on the IG index (and the HY index). Three drawbacks: the hedge can become very costly if IG tightens, shorting IG is negative carry , and, there is a basis risk between the index and SAM’s holdings.
iii. Buy protection on a CDX tranche. Not optimal either given the limited liquidity in tranches and the correlation exposure.
iv. Buy a put on a popular FX carry trade such as AUDJPY. The premise being that at times of crisis, popular carry trades get unwound all of a sudden. Buying puts on such carry trade makes sense to hedge systemic risk.
v. Buy puts on the SPX (or the Russell) vi. Buy calls on VIX futures.
Clearly, the last two make the most sense: both use exchange-listed products with no counterparty credit risk. They are characterized by high liquidity and great transparency. They are “close” to the IG/HY risk (as opposed to a JPYAUD trade which seems more far-fetched). In addition, VIX options would enable SAM to benefit from convexity.
The risk is a breakdown of the correlation between credit and equities. This could happen should there be dramatic releveraging of companies such that credit spreads widen while stocks go up. Given the financing environment in 2012, SAM thought there were limited chances of this happening.
EQUITY OPTION STRATEGIESThere were three options strategies that SAM retained for discussions with its board: an SPX put, an SPX put spread and an SPX put strip. All had one year maturity.
SPX Put: The strike price was chosen to be 90% of current spot price and maturity was one year. It provides a long Vega exposure during the life of the trade. And at maturity, it provides a linear hedge if S&P500 were to go down more than 10%. Efficient but expensive (4.9% of the notional).
SPX Put Spread:Buy a 90% put and sell an 80% put to lower the cost to 2.9% of notional. Cheaper, but protection is now limit-ed to a max drop of 20%.
SPX Put Strip:Buy an SPX put at 90%, at 80% and at 70%; all at the same maturity, each with 1/3 of the notional of the previous two strategies. The Put Strip is cheaper (3.0% of notional) than a single put and bears long convexity features. The major concern is that the hedge does not kick in until SPX moves down meaningfully.
As SAM favored a tail risk hedge, the Put Strip got the most votes.
Figure 8. Comparison of the performances of the put option strategies
Performance at Expiry (based on $1bn Notional)
Return at Expiry (based on Premium Outlay)

16 | DECEMBER 2013 | Risk management
VIX PRODUCTS HEDGING STRATEGIESSAM was also very intrigued with VIX products. While they had heard about the VIX, they had not traded VIX derivatives yet.
The “Fear Gauge” & VIX ProductsThe VIX Index measures the market’s expectation of the 30-day rolling SPX volatility implicit in the prices of front-month and second-month SPX options strips. It is also known as the “Fear Gauge” because of its negative correlation with SPX. Indeed, the correlation between the returns of VIX Index and those of SPX is about -85% since 2010.
Meanwhile, as shown in Figure 9, regression using weekly returns shows that VIX returns are positively convex with respect with SPX returns, as a large downward move in SPX corresponds to an even larger move in VIX Index, and thus is favored by risk/portfolio managers.
However, unlike other equity indices, which are a weighted sum of tradable components, VIX is only a real-time statistic and is not a tradable instrument. This is because of the rolling feature (dynamically changing weight between front-month and near-month options) and its nonlinear calculation method.
Figure 9. VIX vs SPX Weekly Return* Figure 10. VIX Index Calculation
While the VIX is not tradable, investors can trade VIX futures, or options on futures, or ETNs based on VIX futures or even options on these ETNs. The futures reflect the market’s expectations of the level of VIX in the future, one to nine months ahead respectively. VIX futures saw a slow start when they were first introduced in 2004. But trading activity increased dramatically since 2009, with the advent of VIX ETNs making the VIX derivatives of the deepest market.
Credit Risk Management … | from Page 15

Risk management | DECEMBER 2013 | 17
“VIX futures are generally in Contango, but can be in Backwardation at the time of a crisis.”
CONTINUED ON PAGE 18
Figure 11. VIX vs CDX IG Spread1
Figure 13. Market Share of VIX STPs & VIX Futures vs SPX-linked options
Figure 12. Trading Activity on VIX Products
Now, measured by Vega, trading activities of VIX products are one-third the size of first two SPX options, as shown in Figure 13.
VIX futures are generally in Contango , where the term structure is upward sloping, but the term structure inverts at times of crisis. As shown in Figure 14 and Figure 15, VIX Spot over 1st-month VIX future ranges from -5% to 11.5%, with an average of -0.8%, and is negative 94% of the time. 1st-month over 2nd-month future range from -5.5% to 7.5%, with an average of -1.1%, and is negative 87% of the time. This is an important observation because at times of crisis, the term structure inverts and goes in Backwardation . Strategies that benefit from a shift from Contango to Backwardation allow to hedge against systemic risk.
Short Term (Aug & Sep)

18 | DECEMBER 2013 | Risk management
Hedging High Yield Portfolios with VIX futures The high average correlation of 71% between a synthetic HY portfolio and VIX futures allows us to hedge a HY credit portfolio using a portfolio of VIX futures. Further regression analysis showed that $1mm Vega of VIX futures would be enough to hedge $100mm HY portfolio. Besides high correlation, VIX futures are an appropriate hedge because of their convex relationship with HY portfolio (Figure 16).
Figure 14. VIX Index – 1st Month VIX Future Spread vs SPX
Figure 16. VIX – 1st Month Futures vs CDX HY Price
Figure 15. 1st - 2nd Month VIX Future Spread vs SPX
Credit Risk Management … | from Page 17

Risk management | DECEMBER 2013 | 19
“VIX Calendar call spread benefit from inversion of the VIX term structure during crisis.”
CONTINUED ON PAGE 20
Using VIX options to hedge systemic riskBuy a short-dated VIX call; Sell a long-dated VIX call
Most of the time, the VIX futures term structure is upward-sloping. However, VIX futures prices are more volatile at the front end than at the back end. During times of crisis, short-dated VIX futures prices tend to rise more than the increase in long-dated futures invert-ing the term structure. (Figure 14 and Figure 15) The spread between 1st-month VIX futures and 2nd-month VIX futures turned positive in times of crisis (Figure 17). During the Flash Crash, for example, front-month futures prices jumped as much as 12.4 pts, while 4th-month futures prices went up by 6.2pts from May 3 to May 7 in 2010. A similar market event is likely to knock the short-dated option in the calendar call spread strategy in the money, while the long-dated option is still out of the money.
One thing to note when trading VIX options is that it’s best to close or to roll the position a week before expi-ration, since options prices are very volatile towards the expiry.
S&P500 PUTS OR VIX CALLS?A further look into hedging S&P500 with S&P500 puts and with VIX calls shows that historically VIX calls have worked better than SPX puts.
The chart below shows the efficient frontiers for two portfolios using the X-Axis for Risk and the Y-Axis for return:
1. Long S&P500 hedged with a variable notional of 1-month 125% VIX calls.
2. Long S&P500 hedged with a variable notional of 1-month 95% SPX puts.
The conclusions from this chart are quite dramatic. The first portfolio has a traditional shape efficient frontier graph with an optimal hedge ratio of 22% VIX calls. However, the second portfolio does not have an opti-mal point. While risk is reduced as the hedge increases, returns become more negative.
Figure 17. VIX 1st-month Futures vs 2nd -month Futures
Figure 18. Efficient Frontier of 1m 125% VIX Calls vs 1m 95% SPX Puts

20 | DECEMBER 2013 | Risk management
This result indicates that for the time period con-sidered, SPX puts were too expensive compared to VIX calls in light of the benefit they would provide. While this was the case in the past, the relative cost/benefit analysis evolves over time. So it’s help-ful to get equity derivative experts’ opinions as to which one is cheaper at the time of your hedging.
The author wishes to thank Bouhari Arouna, PhD., Harsh Mundhra, and Daoyuan Zhou for their contribution to this article.
This article has been written by a member of the sales and trading department of Citigroup Global Markets Inc. This article is provided for information and discussion purposes only and does not constitute an offer or recommendation to purchase or sell any financial instruments or other products. For further information, please contact the author. This material may mention options regulated by the U.S. Securities and Exchange Commission. For more information on options please review the Options Clearing Corporation booklet, Characteristics and Risks of Standardized Options. A copy of the booklet can be obtained by using the following link, http://www.theocc.com/about/publications/character-risks.jsp.
ENDNOTE
1 Negative carry refers to a situation where the cost of holding a security exceeds the yield earned, and therefore is not desirable for investors. When an investor buys protection on IG index, he/she makes coupon payments on a quarterly basis to the protection seller, thus having negative carry.
2 In an FX carry trade, an investor sells a currency with a relatively low interest rate to finance buying another currency yielding a higher interest rate to capture the difference between the rates.
Credit Risk Management … | from Page 19

Investment strategies for challenging times
Sponsored by:
MARCH 13-14, 2014
NEW YORK MARRIOTT MARQUIS
NEW YORK, NY
The Investment Symposium is developed and produced by industry experts for investment professionals working with pensions and insurance.
Get perspective on the industry’s most pressing challenges and learn valuable strategies for navigating the future from trusted leaders and the best minds in the field.
Learn. Overcome. Grow. Register today for the Investment Symposium. Learn more information by visiting InvestmentSymposium.org

22 | DECEMBER 2013 | Risk management
Duration Extension: Analysis and ConsiderationsBy Huy Nguyen Trieu
THE PURPOSE OF THIS PAPER IS TO INTRO-DUCE STRATEGIES insurance companies could con-sider to reduce interest rate duration mismatch between Assets and Liabilities. All the analysis is based on a sample Asset and Liability portfolio of Life Insurance Company XYZ. In the first part, we analyse the residual Surplus (Assets - Liabilities) interest rate exposure and we derive its corresponding benchmark. In the second part, we compare (in terms of risks and rewards) the “swaps-only” vs “swaps + swaptions” duration exten-sion strategies and we find that companies could benefit from the additional convexity introduced by swaptions. In the third part, we introduce the traditional short con-vexity exposure of with-profit insurance and the bene-fits of non-linear instruments in this framework.
I. SAMPLE COMPANY’S INTEREST RATES EXPOSUREBased on the Asset & Liability profile (related to a particular pool of policies), we derived the net Surplus (Assets – Liabilities) inflows/outflows. We calculated then the interest rate sensitivity of the net Surplus with respect to all tenors of the swap curve and we summa-
rized this sensitivity over different swap buckets (2y, 5y, 10y, 15y, 20y, 25y, 30y and 40y). Based on this analysis, we found that Company XYZ is overall short €1.5mn DV01 between Assets and Liabilities: €600k Asset DV01 vs. €2.1mn Liability DV01. In other words, the net Surplus appreciates/ depreciates by €1.5mn for a +/-1bp parallel shift of the interest rates swap curve. The company is over-hedged on the short-end (0y-5y) and under-hedged on the long-end (10y-40y) of the curve. This means that Company XYZ would need to increase overall duration on the Asset side while enter-ing payer swaps on the short-end to be properly hedged (by buckets) with respect to interest rates. A hedge by buckets would be relevant as the interest rate curve does not move in parallel shifts.
Moreover, the mark-to-market profile of the surplus is negatively convex. This means that for large negative shifts of the interest rates swap curve, the Surplus interest rate sensitivity increases leading to further depreciation. For large positive shifts of the curve, the Surplus interest rates sensitivity decreases which reduce its appreciation.
Surplus cash inflows/outflows
Creating the Interest Rates Surplus Benchmark
Surplus benchmark

Risk management | DECEMBER 2013 | 23
“This means that for large negativeshifts of the interest rates swap curve, the Surplus
interest rate sensitivity increases leading to further depreciation”
CONTINUED ON PAGE 24
• Keeping the same balance sheet position.
• “Swap only duration strategy”: Hedging 100 per-cent of residual surplus risk with a portfolio of swaps that match key rate sensitivities (by buckets).
• “Swaptions + swaps duration strategy”: Hedging 100 percent of residual surplus risk with a combi-nation of swaps and swaptions.
While the portfolio of swaps considerably removes the risks related to parallel shifts of the curve, the swaption based strategy provides upside (compared to the “swap only” strategy) in both a decreasing and increasing rates scenario thanks to the convexity introduced in the balance sheet.
II. DURATION EXTENSION STRATEGIESWe compare two duration extension strategies to deal with the matter
1. “Swaps only strategy”The company could increase overall duration exposure while remaining consistent with its par-tial interest rates curve exposure by deriving the required swap notional to be hedged at 100 per-cent on each bucket considered. Alternatively, the company could still derive the required notional to reach a target hedge ratio by buckets. In both cases, the company would need to enter 2y and 5y payer swaps while receiving fixed on the remain-ing tenors.
2. “Swaps + swaptions strategy”The company could also increase overall duration while remaining consistent with key rate sensitivi-ties by entering receiver swaptions (5y10y, 5y15y, 5y20y, 10y20y) to match its DV01 needs on the long-end segment (15y, 20y, 25y and 30y buckets) of the curve and consider swap overlays in order to reduce the residual DV01 exposure. This strategy could also be executed to reach a target hedge ratio by buckets.
We compare the mark-to-market of the surplus (over different parallel shifts of the curve) for three different alternatives:
Mark-to-Market of the Surplus
Initial Surplus
Surplus + “Swap only” strategy
Surplus + Swaps + Swaptions” strategy
KEY CONSIDERATIONS
• All the options considered in this
analysis are struck at the money
forward
• A relative value analysis could
potentially be performed to
optimise the swaption pair
and the strike depending on
the company’s objectives and
constraints

24 | DECEMBER 2013 | Risk management
Macro & tail risk hedging considerationsExtending duration with swaptions introduces positive interest rates volatility sensitivity (positive “vega” expo-sure). This could help the insurance company in periods of stresses (when spreads widen and/or equity fall) as rates volatility tends to increase and monetize macro-economic and financial shocks. Swaptions provide offer thus diversification benefits for life insurers who hold traditionally invest in credit and equity markets.
Swaps-only” strategy
“Swaps + swaptions” strategy
III. FURTHER CONSIDERATIONS – LIFE INSURANCE CONVEXITYLife insurers are exposed to both low and high interest ratesLower interest rates would adversely impact insurance companies:
• Cash flow impact: lower interest rates would expose life insurers to reinvestment risk, as maturing fixed income securities would have to be reinvested at a low yield (potentially lower than minimum guarantees).
• Business impact: insurers’ margin could decrease if rates remain low and (potentially) insurers’ ability to maintain market share by paying high bonus rate may be impaired.
A sharp increase in rates could have a material negative impact as well:
Duration Extension … | from Page 23

Risk management | DECEMBER 2013 | 25
“Life insurers are exposed to both low and high interest rates”
CONTINUED ON PAGE 26
• Accounting impact: available for sale assets would depreciate while liabilities could depreciate less (surrender of policyholders), thereby reducing shareholders’ equity.
• Business impact: A sharp increase in interest rates would make life insurance less attractive relative to alternative savings products and lead to market share erosion and lapse of policyholders.
• Regulatory capital considerations: fast rising rates could translate into a significant solvency risk when surrender is taken implicitly or explicitly into account for regulatory purposes.
Assuming a market consistent valuation of Assets and Liabilities, the life convexity risk is translated into in-terest rates volatility squared exposure of shareholders’ equity
This could be illustrated using a Solvency II framework where the interest rates capital charge is derived as the highest (in absolute terms) negative mark-to-market change of the Surplus (Assets – Liabilities) after ap-plying both a standard upward and downward stress to the interest rate curve. The graphic below illustrates the altered SII term structures derived from the interest rates swap curve.
Assuming Assets and Liabilities are DV01 matched, the interest rate capital charge under SII should be ei-ther low or limited to the convexity mismatch between Assets and Liabilities. Indeed and for the reasons men-tioned above, life insurance Assets tend to display less convexity than Liabilities: when rates fall, insurers need to increase Asset duration as minimum guarantees are in the money and increasing the Liability duration. On the other hand, when rates spike, insurers need to reduce Asset duration as early surrenders reduce the Liability duration.
In order to emphasize the volatility squared expo-sure, we consider an Asset portfolio which consists of €130mn bunds (15y duration) backing €100mn techni-cal reserves (19.5y duration).
Interest Rate Stress Under Solvency II
Interest rates exposure
Huy Nguyen Trieu, is manag-
ing director and head of macro
structuring at Citi London. He can
be reached at Huy.nguyentrieu@
citi.com.

26 | DECEMBER 2013 | Risk management
This resulted in available surplus decreasing from €20mn to €5mn because of Liabilities increasing faster than Assets as well as an increased capital requirement. This illustrates the concept of interest rates volatility squared exposure of shareholders’ equity.
In this situation, the company clearly need to use non linear interest rates instruments (swaptions for instance) to stabilize Surplus volatility. Swaptions can not only close the gap between Assets and Liabilities when rates move, provide diversification benefits at balance sheet level, reduce capital requirements but also reduce the volatility of Solvency ratios. So this case study pro-vides another reason that swaptions need to be consid-ered when companies think of duration extension.
The initial asset DV01 (€195k) is matching liabilities DV01 (€195k). However, we assume Liabilities to dis-play a significantly higher convexity profile when com-pared to the Asset portfolio. The initial interest rates SII capital is assumed to be €10mn. Available Surplus is also assumed to be €20mn.
Following decreased rates over 3 months, Asset port-folio is assumed to have increased to €150mn in mar-ket value while reserves increased more quickly to €130mn.
Because Assets and Liabilities are no-longer matched in terms of DV01 (€221k vs. €260k DV01) and because of the convexity mismatch exposure, the SII capital re-quirement increased to €15mn.
Interest rates volatility squared Illustrated
Duration Extension … | from Page 25

Risk management | DECEMBER 2013 | 27
CONTINUED ON PAGE 28
CHAPTER 1 BACKGROUND1.1 Definition of Operational Risk (Op Risk)Operational risk can be defined in many ways. Each definition has its own nuances and characteristics however they often share some common ground. An Operational Risk (“Op Risk”) definition typically has the following attributes:
a. Op Risk has many risk types (i.e., human error, sys-tem problems, etc.)
b. Low frequency of occurrencec. Often times Op Risk is not directly measurable and
can be very volatiled. Typically, analysis is qualitative as opposed to quan-
titative which is a more subjective approache. The same type of Op Risk could be very different
from one organization to another
These attributes make any attempt to quantify Op Risks very difficult. This is especially true for companies that require a single methodology to be applied across subsidiaries existing in different countries and jurisdic-tions. This article is going to present a quantification model that conquers most Op Risk modeling issues.
1.2 Why quantify Operational Risk1.2.1 Economic Capital framework Economic Capital offers an interpretation of
risks inherent in the company in economic terms. Op Risk is simply one of the important inherent risks that a company has. Op Risk quantification is unquestionably required to complete a comprehensive Economic Capital framework.
1.2.2 Enterprise risk appetites Companies must thoroughly consider which
risks and how much of those risks the company wants to take. This is often referred to as a risk appetite. With regards to Op Risk, risk catego-ries have to be predefined based on a company’s experience, current operations, new initiatives, and business strategies. Like other types of
risk, the quantification of Op Risk provides an economic basis for informing the enterprise risk appetite.
1.2.3 Independent qualitative assessment The Op Risk quantitative model opens the
door for management to reflect their indepen-dent considerations and quantitative assessment. Especially for multi-national operations, Op Risks could be very different across countries even when they are under the same parent com-pany.
CHAPTER 2 MODELING2.1 Handling operational risk spaceThe large number of types of Op Risks poses a mod-eling issue and potentially leads to modeling error which can reduce model stability. Thus, it is important to prioritize each type of Op Risk based on its signifi-cance to the organization. Additionally, similar types of Op Risks can be grouped together in order to decrease the number of classes for modeling. For the example coming up shortly, Op Risks are grouped into four classes/categories:
Risk Category Risk Subcategories
Compliance Risk
Financial Compliance, Transaction Compliance, Transaction Risk
Human RiskFraud Risk, People Risk, Systems Risk
Acts of God Risk Extreme Weather Events
Institutional Risk
Business Risk, Interna-tional Risk, Legal and Regulatory Risk
Note that, the risk grouping is subjective and can vary widely from industry to industry, company to company, and even subsidiary to subsidiary. Any change to the classification may lead to a significant change in the resulting numerical level of Op Risk.
Quantitative Modeling of Operational Risk By Leyla Korkut, Mengxue Wang, Raymond T. Perkins III, Siyi Luo, Vincent Hong Chen
Mentors: Dr. Boning Tong, Vincent Hong Chen, Dr. Avery Ching

28 | DECEMBER 2013 | Risk management
risk rating. Severity Points are the central point of all risk data around it, or alternatively, they represent near-by risk data for modeling purposes. Transformation of Random Variables1:
Since the external and internal data sets have different scales, in order to match the maximum empirical data point in the external data of the same risk category with the maximum in the internal data, the transformation assumes X, the external loss, is a random variable and follows a Weibull2 distribution.
The transformed variable Y is defined as Y=X/S, where S represents a scalar derived from
By following the transformation process, Y also follows the Weibull distribution with new parameters defined by the original parameters as follows:
2.3 Model selection and calibration2.3.1 Model Selection Model selection is a circular process. The mod-
eler has prior knowledge of the risks being modeled and typically has a good understanding of various statistical models. Sufficient con-siderations have to be given to the types and quality of collected data. Modelers should be fully aware of data limitations and select appro-priate candidate models. Typical candidates are exponential, Gamma, log-normal, Weibull, and extreme value distribution.
The circle starts again to confirm and review the candidate models. Peer review and management discussion can effectively detect problems and produce a smaller group of candidates.
2.2 DataIn general, data used for Op Risk modeling is the incurred losses by risk type. Data collection is often challenging due to inconsistencies across industries, companies, and countries. Discussion of overcoming these challenges will be presented later in this article.
Data can be generalized into external data and internal data. The model described is going to use both external data and internal data to take advantage of the exten-sive coverage of data points in the external data and utilize the internal data to capture enterprise specific risk characteristics. External data can be acquired from outside vendors, while internal data is often collected from subsidiaries by running a risk self-assessment or historical loss inventory.
Here are several steps to overcome some of the data challenges often found in practice:• Risk self-assessments can be designed in such a
way that enables grouping into the classes defined in 2.1. Internal data can also be enhanced by study-ing the historical loss events in each subsidiary.
• Definition of the risk types in external data can be different and some data may be estimates. Data filtering is often required and the filtered data can then be grouped based on the classes defined in 2.1.
• Since the external and internal data may come in different formats, data transformation is neces-sary. The approach taken in the example below is to transform the external and internal data into appropriate and consistent data types upon which an empirical distribution can be built.
Before discussing data transformation, the concept of data Severity Points must be introduced:
Severity Points are used to form a consistent framework across different data types and different risks. In this framework data of different formats are able to coexist on the same data axis which allows for building an empirical distribution. Severity Points are determined by the frequency of occurrence, severity, and individual
Quantitative Modeling of Operational Risk … | from Page 27
Risk management | DECEMBER 2013 | 29
“The Op Risk quantitative model opens the door for management to reflect their independent consider-
ations and quantitative assessment.”
CONTINUED ON PAGE 30
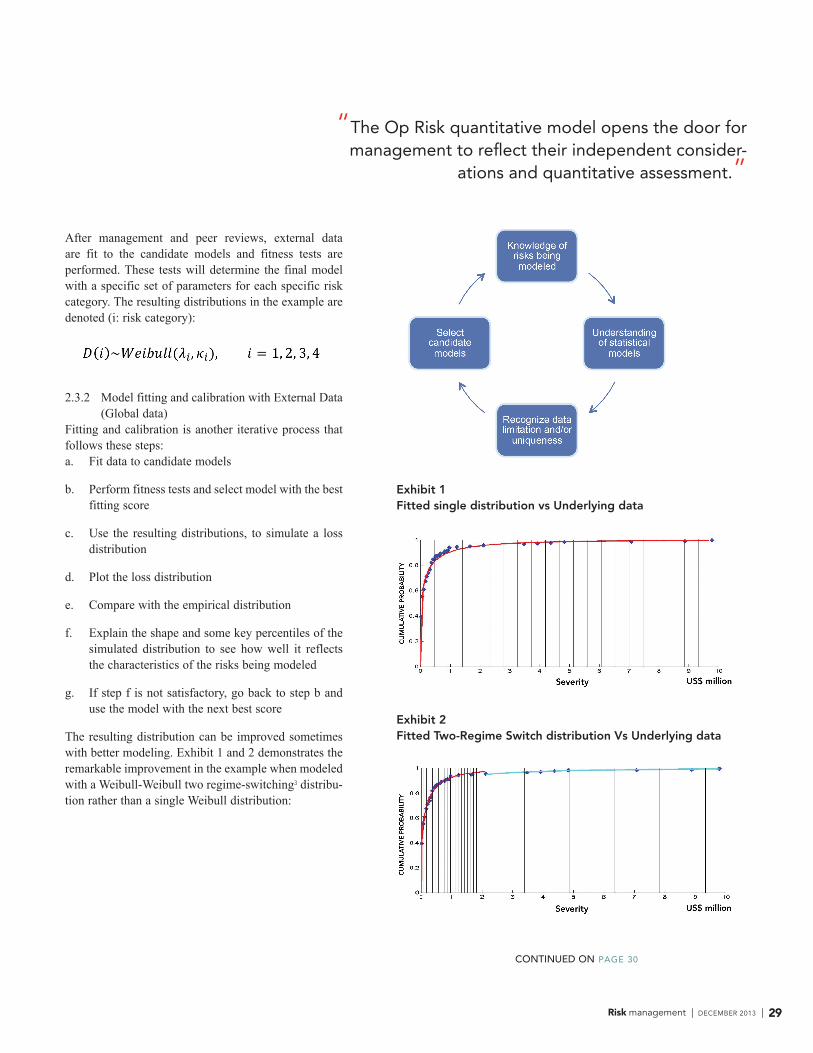
After management and peer reviews, external data are fit to the candidate models and fitness tests are performed. These tests will determine the final model with a specific set of parameters for each specific risk category. The resulting distributions in the example are denoted (i: risk category):
2.3.2 Model fitting and calibration with External Data (Global data)
Fitting and calibration is another iterative process that follows these steps:a. Fit data to candidate models
b. Perform fitness tests and select model with the best fitting score
c. Use the resulting distributions, to simulate a loss distribution
d. Plot the loss distribution
e. Compare with the empirical distribution
f. Explain the shape and some key percentiles of the simulated distribution to see how well it reflects the characteristics of the risks being modeled
g. If step f is not satisfactory, go back to step b and use the model with the next best score
The resulting distribution can be improved sometimes with better modeling. Exhibit 1 and 2 demonstrates the remarkable improvement in the example when modeled with a Weibull-Weibull two regime-switching3 distribu-tion rather than a single Weibull distribution:
Exhibit 1Fitted single distribution vs Underlying data
Exhibit 2Fitted Two-Regime Switch distribution Vs Underlying data

30 | DECEMBER 2013 | Risk management
characteristics of the risks of the country, but also the general descriptions of the risks.
2.4 Simulation and AggregationMonte-Carlo simulation is used to generate the distri-bution for each of the risk categories. Managers can reflect their perceptions of the future into the simulat-ed results by introducing a certain degree of skewness during the standard procedure. This feature allows for the inclusion of management discretion and stress/scenario testing.
Pearson correlation was employed in the example for aggregation purposes. The external data was used to calculate correlation of the different risk types. Gross Domestic Product (GDP) growth rate of different countries was used to calculate the correlation between the countries. According to Chernobai, Jorion, and Yu, (“The Determinations of Operational Losses”) GDP growth rates are inversely correlated to a firm’s oper-ational risk. The methodology shown here is to start modeling with actual/estimated loss events and then to develop the statistical distributions. Any potential inter-nal inconsistencies found when using GDP growth rates to calculate correlations between the countries must be well understood.
Along with Pearson correlation, Cholesky Decomposition4 is used for aggregation. The aggrega-tion takes the procedure as:
A plot of the aggregated non-skewed example is given in Exhibit 3. The 99th percentile is 179 million, which is reasonable given the operations in the countries being studied.
The results demonstrate the following achievements:• The model is generalized to capture industry risk
profile of each individual risk type
• Modeled specifically each of the enterprise priori-tized Op Risk categories independently
• Satisfied enterprise risk appetites
2.3.3 Model Calibration with Internal Data Once the general distributions of each risk cat-
egory are identified, internal data are used to recalibrate the general distributions to country specifics. The recalibration process is used to calculate the specific parameters for each of the general distributions using the internal data. The process is similar to 2.3.2 except that only the parameters are altered to achieve the best cali-bration. The resulting distributions are:
Or
The resulting distributions not only reflect the unique
Exhibit 3Aggregate Regional Plot
Quantitative Modeling of Operational Risk … | from Page 29

Risk management | DECEMBER 2013 | 31
“The model described is going to use both external data and internal data to take advantage of the ex-tensive coverage of data points in the external data
and utilize the internal data to capture enterprise specific risk characteristics.”
• Allowed for management’s risk view
• Distinguished country risk specifics
2.5 Pros and Cons
ADVANTAGES DISADVANTAGES
• Populates a full loss distribution due to Op Risk
• Associates loss amount with the prob-ability of occurrence
• Easily rolls-up to and is consistent with the economic capital framework
• Can quickly and easily update the model with new information (data and other analytics)
• The classification of risk categories is subjective; the results may change significantly when the classification is changed
• Assuming the joint distribution to be normally distributed may be incorrect
• Not easy to under-stand for non-techni-cal audiences
Siyi Luo, is a full-time Ph.D Student
at Boston University in Boston,
Mass. She can be reached at
Raymond T. Perkins III, is a full-time
Ph.D student at Princeton University
in Princeton, N.J. He can be
reached at raymondp@princeton.
edu.
Leyla Korkut, is at CHG &
Associates
Company in Washington, DC. She
can be reached at
Vincent Hong Chen, is risk director
at MetLife Asia Pacific Limited, in
Hong Kong. He can be reached at
Mengxue Wang, is at Hong
Kong University of Science and
Technology in Hong Kong. She can
be reached at wmengxue1234@
gmail.com.
ENDNOTES
1 Transformation of Random Variable: http://math.arizona.edu/~jwatkins/f-transform.pdf2 Weibull distribution: http://en.wikipedia.org/wiki/Weibull_distribution3 Regime Switch Model: http://dss.ucsd.edu/~jhamilto/palgrav1.pdf4 See details at: http://en.wikipedia.org/wiki/Cholesky_decomposition

32 | DECEMBER 2013 | Risk management
U.S. Flood Insurance: A Looming DisasterBy Katie Clouser
IT HAS BEEN 45 YEARS SINCE THE U.S. CON-GRESS passed the National Flood Insurance Act which created the National Flood Insurance Program. Since that time, the flood program has accumulated a deficit of roughly $24 billion, and that number is on an up-wards trajectory as storms like Katrina and Sandy de-stroy highly populated areas and leave devastation in their wake.
Aside from the fact that it is run by the federal govern-ment, a number of deficiencies in its structure cause the National Flood Insurance Program to operate in a way that is not at all like an actual insurance program. A few of note are the absence of loss reserves, intentional subsidization of rates, and adverse selection caused by selective mandatory purchase requirements.
CHANGES ON THE HORIZONIn the recent bill passed by Congress to reform the flood program in 2012, there were a number of encouraging changes put in place. However, many of these changes have associated logistical issues. For instance, one of the most significant changes is to gradually remove subsidies on properties that are below actuarially indi-cated rates (some of which are as much as 60 percent
percent below their indicated rates). Alongside this, there is a phase-in of a risk load which is intended to build up a loss reserve to account for catastrophic events.
While all of this is making the program sound more and more like an insurance program, one has to ask how long it will take to get to a financially stable place when the maximum rate increase on individual policies is 10 percent per year (25 percent for secondary homes, busi-nesses, and homes with repeated severe losses). Doing a little back-of-the-envelope math gives us an estimate of no fewer than 30 years until we reach a $0 deficit and a fully funded loss reserve. Furthermore, this is assuming no occurrences of any event that exceeds the premium income (minus debt payments) each year.
A HISTORICAL PERSPECTIVEThe situation seems dire, so let’s throw out all the numbers and reflect on why this program exists in the first place. Flood risk was historically understood by the insurance community to be an uninsurable hazard. The reason for this is because of the predictability of where flooding can occur and resulting adverse selec-tion. Lawmakers turned their attention to this gap in coverage in response to a chain of Mississippi River flooding disasters and northeastern hurricanes in the 1920’s and 1930’s.
By the time 1968 came around, the federal government had paid out enough in after-the-fact disaster relief that they decided to set up an “insurance” program to pre-fund these payouts. Not only were these funds proac-tively addressing the issue, they were also being paid by those who actually would use the funds as opposed to collecting from every American taxpayer. Happily for those of us that live on a hill, the only people who are required to purchase these policies are those who have federally –backed mortgages in a flood zone.
WHERE IS THE INSURANCE INDUSTRY?Now for the big question—why is the government better equipped than the insurance industry to provide this coverage? It’s not. It is simply a losing game

Risk management | DECEMBER 2013 | 33
“The only solution to the flood insurance crisis is well known…deregulation.”
CONTINUED ON PAGE 34
the way it was structured. The insurance industry has always known it, and the numbers are finally starting to show it.
It does not have to be a losing game. Predictability and adverse selection in flood risk are no different than predictability and adverse selection in earthquake or hurricane wind risk. The disciplines of risk man-agement and reinsurance have both come light years from where they were in 1968. Notable developments that could be applied to flood insurance are probable maximum loss models and catastrophe bonds, among many others. But since flood was never written by insurers, risk managers have not been involved in developing diversification strategies. And since there is no allowance for a profit load on top of the federal policies and the underlying subsidization still remains largely intact, reinsurers have not developed vehicles that may be uniquely suited to handle the excess layers of catastrophic events.
It is not for lack of willingness that insurers and reinsur-ers alike are out of the business of flood insurance. In fact, as the NFIP deficit grows, there is a clear push to move the program in the direction of becoming a func-tioning insurance program, and the industry has been providing insight and feedback to foster this transfor-mation. The problem is that the policies of Washington lawmakers will never be as well structured as the char-ter of an insurance company, no matter how much input they receive from industry experts.
THE RISKS OF THE STATUS QUOA number of possible risks exist if U.S. flood insurance regulation is not completely deconstructed and rebuilt. The most immediate of these are the significant rate increases that existing policyholders will experience due to patchwork reform acts such as the recent leg-islation passed in 2012. The National Flood Insurance Program was not intended to be an insurance provider held to the same stringent solvency standards as the private sector is. As a result, a shift towards strategies used by the private sector to maintain financial stability will inevitably result in large rate increases. The only
other option to achieve stability would be to mandate flood insur-ance at excessive rates for constituents who do not live in flood zones. However, even this is not currently an option as the reform act has a specific pro-vision that requires rates to be actuarially sound. As policyholders begin to experience the rate increases, members of Congress as well as governors from various coastal states such as Florida, Louisiana, Mississippi, and even New Jersey are beginning to propose ways in which the premium increases can be mitigated. Doing this will only result in the program taking even longer to become financially solvent.
A second very concerning risk is the possibility of another major catastrophic event in the near future. The national debt limit has nearly been reached. Another major event could cause payouts that would contribute to either requiring an increase on the national debt limit or a default on the national debt payments. The latter scenario is unlikely given the very strong political moti-vations to prevent it. However, it could be unavoidable depending on the size of a major catastrophe and cata-clysmic for the U.S. economy.
A third risk is continued development in dangerous coastal and other flood-prone areas. The artificial-ly suppressed premiums, lack of broader mandatory purchase requirements, and flood maps that are rarely updated all enable construction of new risks that will contribute to larger flood insurance debt in the future.
A CALL TO ACTIONThe only solution to the flood insurance crisis is well-known…deregulation. Given the spotlight that is cur-rently on the fragility of the flood program, a case can be made for a largely deregulated market similar to that of familiar non-admitted markets. The NFIP deficit cur-rently makes up 4 percent of the national deficit. How
Katie Clouser ACAS, MAAA,
is associate actuary with Allstate
Insurance Company in Northbrook,
Ill. She can be reached at Kathryn.

34 | DECEMBER 2013 | Risk management
As industry experts, we can illustrate that a macro level change is needed. Furthermore, if the federal law is dismantled, the regulation of flood insurance is then under the jurisdiction of the individual states per the McCarran-Ferguson Act. So engaging state officials now to evaluate local market concerns will also help to avoid unintended regulatory consequences. Being a proactive participant in the discussion is crucial so that an effective market structure can be developed. The reader is challenged to think critically and form their own ideas to help solve the problem. We should join forces and work together within the industry to devise a solution. With the flood deficit on the rise, now is the time for action.
many more disasters need to occur before lawmakers force the flood insurance problem onto the industry? Put in that situation, most countries around the globe leave the flood risk to go uninsured. The U.S. market would likely follow suit if the peril is handed off to the industry only to be subjected to the same stringent state regulations that are in place for standard homeowners insurance.
One of the forums most conducive to taking action would be within the various industry groups that often provide feedback as the National Flood Insurance Act continues to be reformed. Instead of reacting to individual sections of proposed law, we can instead bring proposed holistic market solutions to the table.
U.S. Flood Insurance … | from Page 33

Risk management | DECEMBER 2013 | 35
w w w . I C A 2 0 1 4 . o r g30 March to 4 April 2014
Join more than 2,000 actuaries from across the globe at the 30th International Congress of Actuaries!
• Earn up to 27 continuing education hours from sessions covering the latest global trends.
• Network with peers from around the world.
• Enjoy cultural and historical activities in and around Washington, D.C.
Register online today at www.ICA2014.org
Contact [email protected] with any questions.

475 N. Martingale Road, Suite 600Schaumburg, Illinois 60173
p: 847.706.3500 f: 847.706.3599 w: www.soa.org
Canadian Institute of ActuariesCasualty Actuarial SocietySociety of ActuariesJOINT RISK MANAGEMENT SECTION
NONPROFIT ORGANIZATIONU.S. POSTAGE
PAIDSAINT JOSEPH, MI
PERMIT NO. 263