Embed Size (px)
Citation preview
JR.S00 1
Lecture 2: Review of Performance/Cost/Power Metricsand Architectural Basics
Prof. Jan M. Rabaey
Computer Science 252
Spring 2000
“Computer Architecture in Cory Hall”
JR.S00 2
Review Lecture 1
• Class Organization– Class Projects
• Trends in the Industry and Driving Forces
JR.S00 3
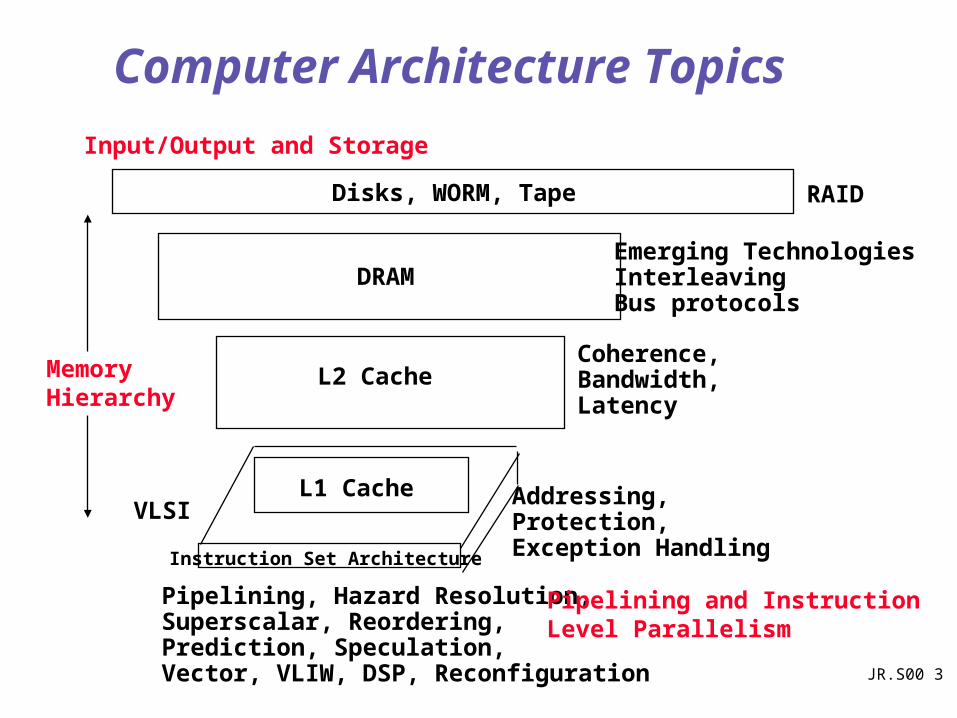
Computer Architecture Topics
Instruction Set Architecture
Pipelining, Hazard Resolution,Superscalar, Reordering, Prediction, Speculation,Vector, VLIW, DSP, Reconfiguration
Addressing,Protection,Exception Handling
L1 Cache
L2 Cache
DRAM
Disks, WORM, Tape
Coherence,Bandwidth,Latency
Emerging TechnologiesInterleavingBus protocols
RAID
VLSI
Input/Output and Storage
MemoryHierarchy
Pipelining and Instruction Level Parallelism
JR.S00 4
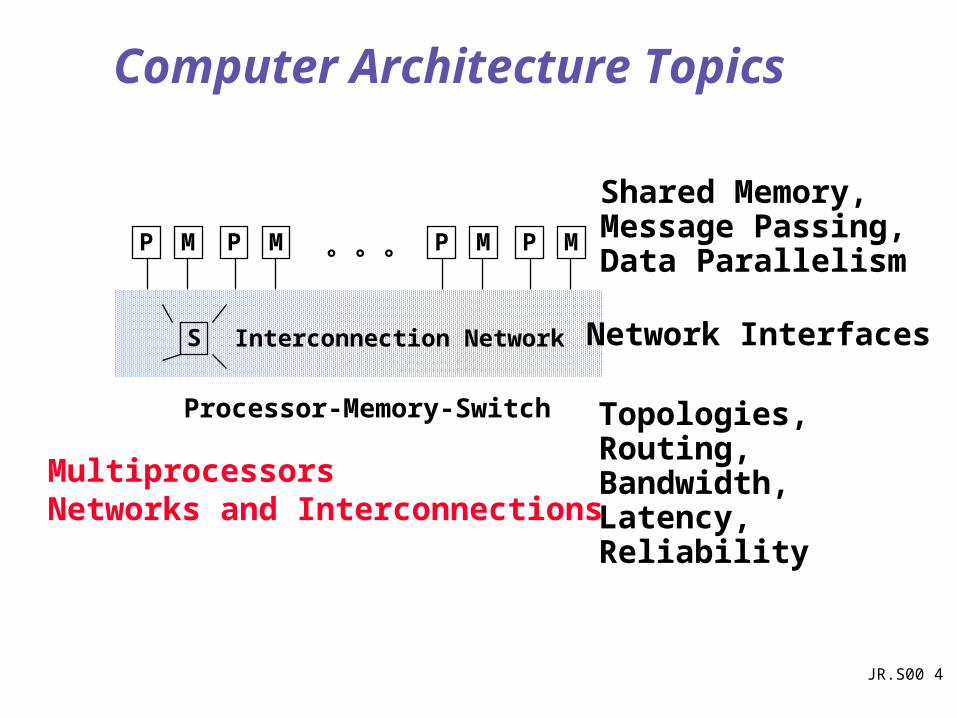
Computer Architecture Topics
M
Interconnection NetworkS
PMPMPMP° ° °
Topologies,Routing,Bandwidth,Latency,Reliability
Network Interfaces
Shared Memory,Message Passing,Data Parallelism
Processor-Memory-Switch
MultiprocessorsNetworks and Interconnections
JR.S00 5
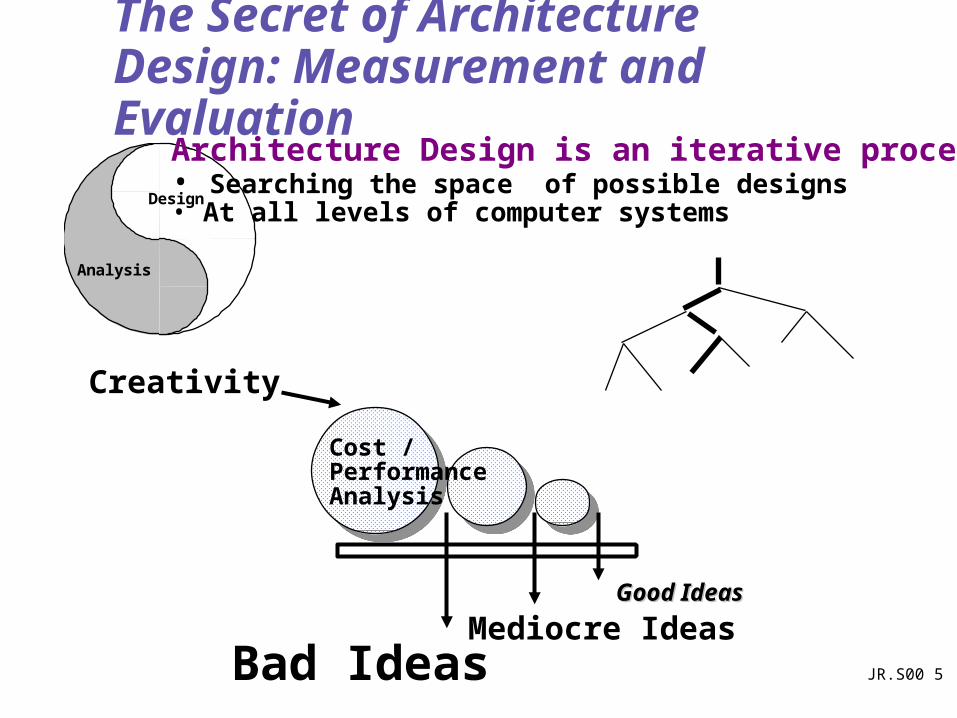
The Secret of Architecture Design: Measurement and Evaluation
Design
Analysis
Architecture Design is an iterative process:• Searching the space of possible designs• At all levels of computer systems
Creativity
Good IdeasGood Ideas
Mediocre IdeasBad Ideas
Cost /PerformanceAnalysis
JR.S00 6
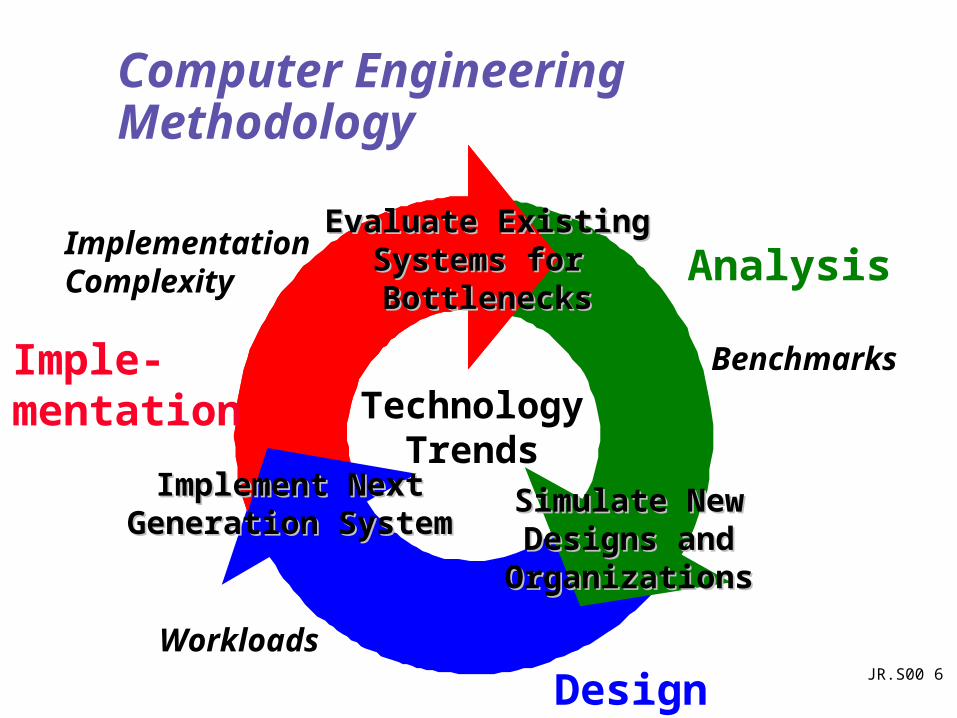
Computer Engineering Methodology
Simulate NewSimulate NewDesigns andDesigns and
OrganizationsOrganizations
TechnologyTrends
Evaluate ExistingEvaluate ExistingSystems for Systems for BottlenecksBottlenecks
Benchmarks
Workloads
Implement NextImplement NextGeneration SystemGeneration System
ImplementationComplexity Analysis
Design
Imple-mentation
JR.S00 7
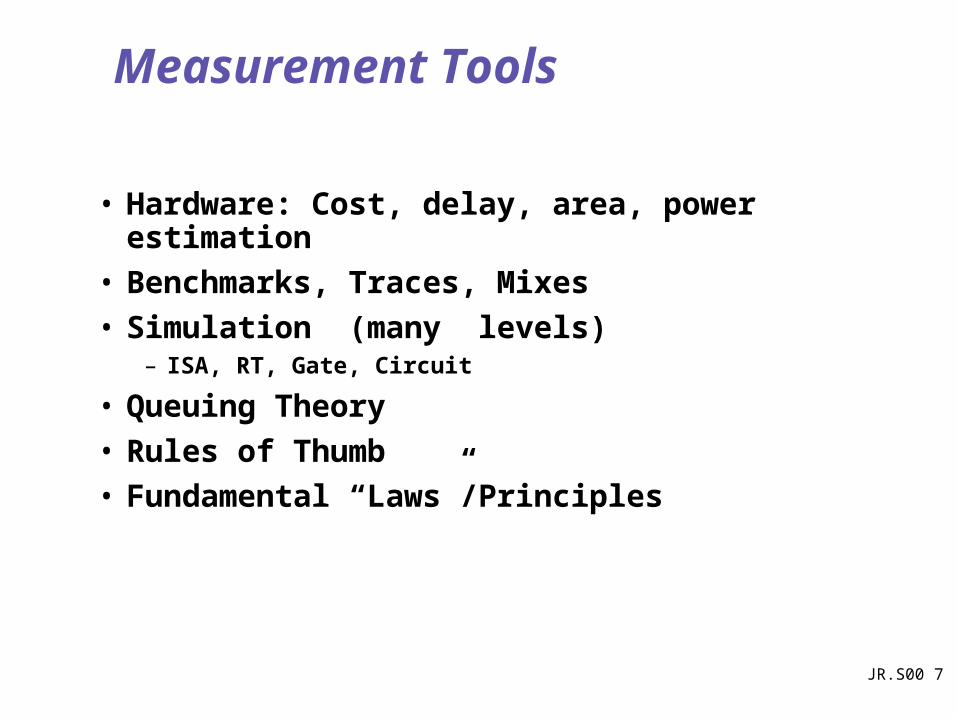
Measurement Tools
• Hardware: Cost, delay, area, power estimation
• Benchmarks, Traces, Mixes
• Simulation (many levels)– ISA, RT, Gate, Circuit
• Queuing Theory
• Rules of Thumb
• Fundamental “Laws”/Principles
JR.S00 8
Review:Performance, Cost, Power
JR.S00 9
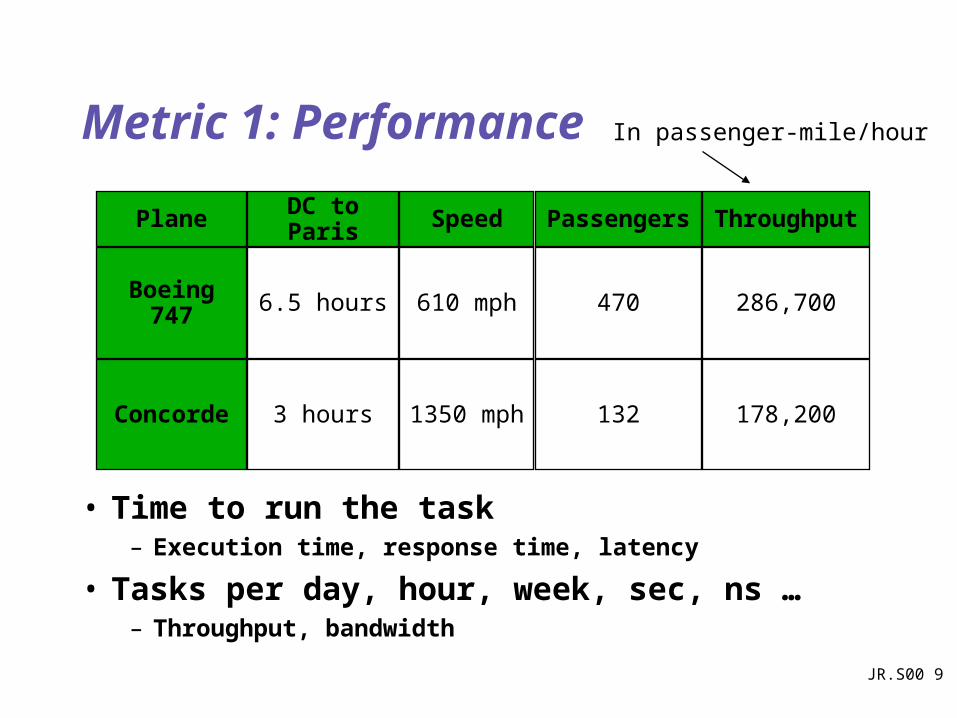
Metric 1: Performance
• Time to run the task– Execution time, response time, latency
• Tasks per day, hour, week, sec, ns …– Throughput, bandwidth
Plane
Boeing 747
Concorde
Speed
610 mph
1350 mph
DC to Paris
6.5 hours
3 hours
Passengers
470
132
Throughput
286,700
178,200
In passenger-mile/hour
JR.S00 10
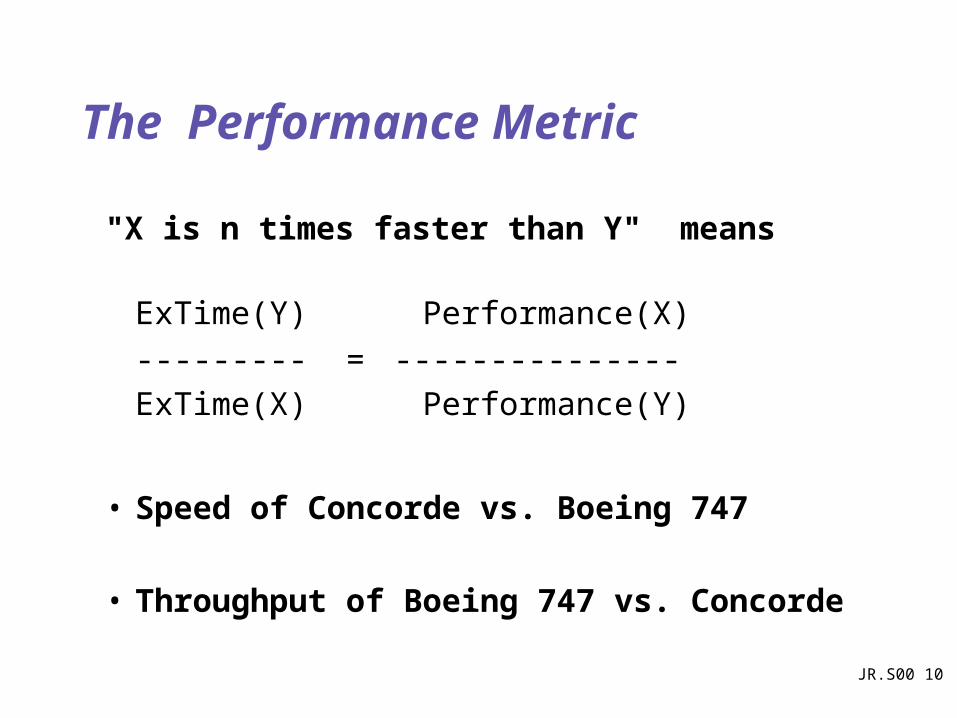
The Performance Metric
"X is n times faster than Y" means
ExTime(Y) Performance(X)
--------- = ---------------ExTime(X) Performance(Y)
• Speed of Concorde vs. Boeing 747
• Throughput of Boeing 747 vs. Concorde
JR.S00 11
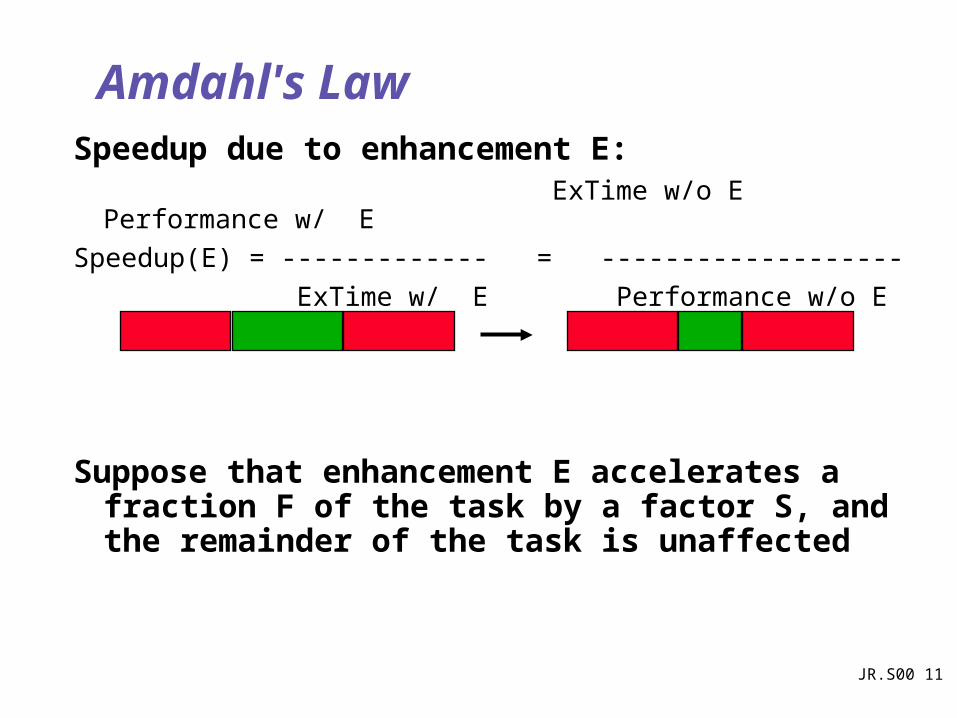
Amdahl's LawSpeedup due to enhancement E: ExTime w/o E Performance w/ E
Speedup(E) = ------------- = -------------------
ExTime w/ E Performance w/o E
Suppose that enhancement E accelerates a fraction F of the task by a factor S, and the remainder of the task is unaffected
JR.S00 12
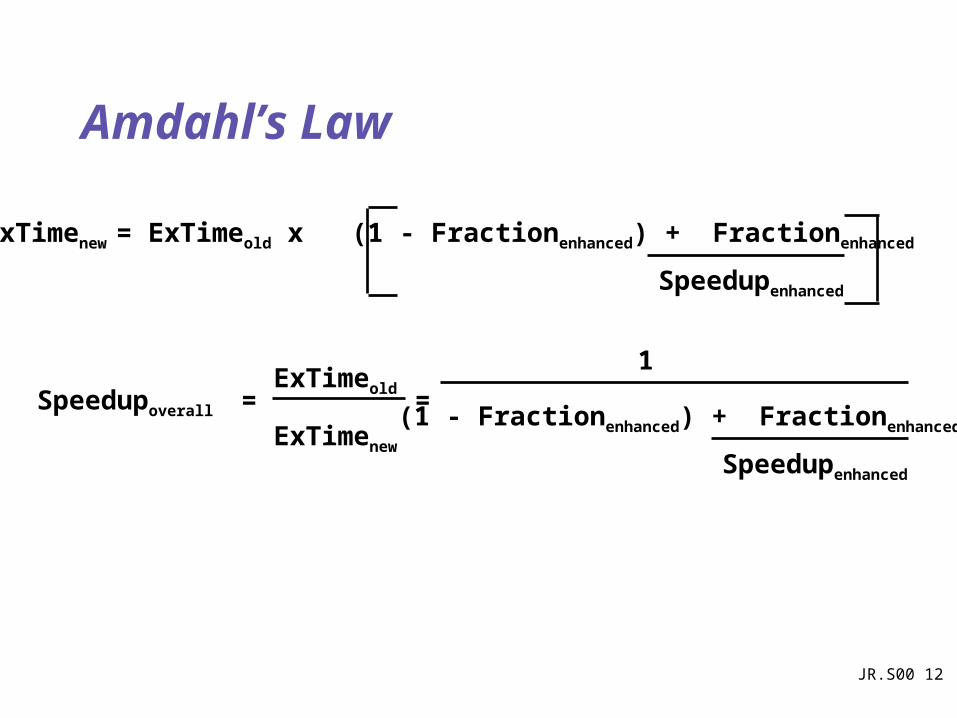
Amdahl’s Law
ExTimenew = ExTimeold x (1 - Fractionenhanced) + Fractionenhanced
Speedupoverall =ExTimeold
ExTimenew
Speedupenhanced
=
1
(1 - Fractionenhanced) + Fractionenhanced
Speedupenhanced
JR.S00 13
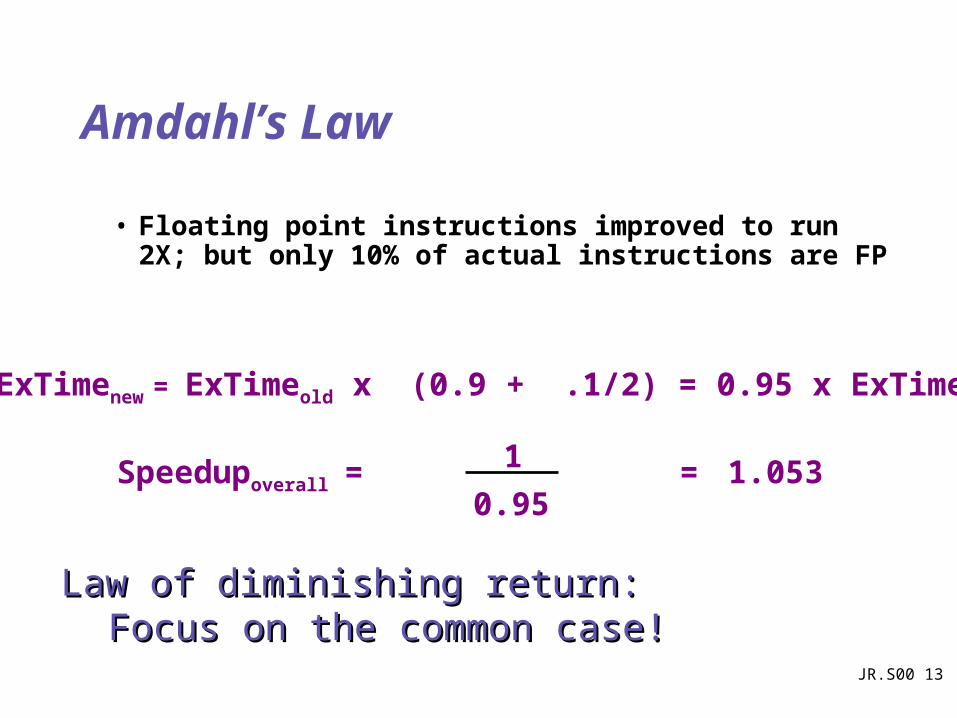
Amdahl’s Law
• Floating point instructions improved to run 2X; but only 10% of actual instructions are FP
Speedupoverall = 1
0.95= 1.053
ExTimenew = ExTimeold x (0.9 + .1/2) = 0.95 x ExTimeold
Law of diminishing return:Law of diminishing return:Focus on the common case!Focus on the common case!
JR.S00 14
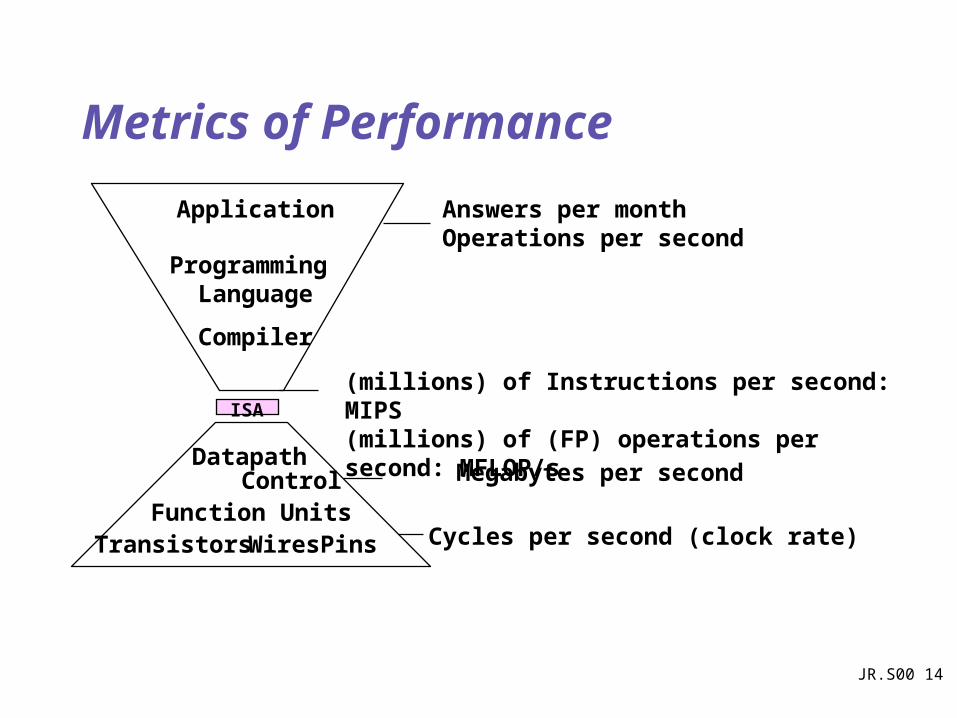
Metrics of Performance
Compiler
Programming Language
Application
DatapathControl
Transistors Wires Pins
ISA
Function Units
(millions) of Instructions per second: MIPS(millions) of (FP) operations per second: MFLOP/s
Cycles per second (clock rate)
Megabytes per second
Answers per monthOperations per second
JR.S00 15
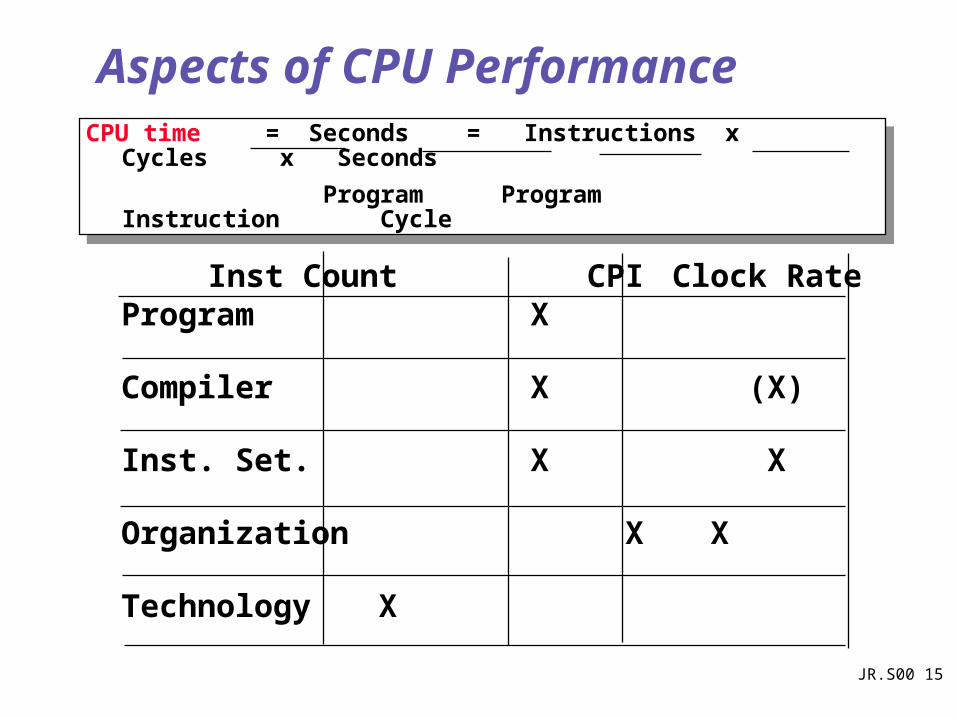
Aspects of CPU PerformanceCPU time = Seconds = Instructions x Cycles x
Seconds
Program Program Instruction Cycle
CPU time = Seconds = Instructions x Cycles x Seconds
Program Program Instruction Cycle
Inst Count CPI Clock RateProgram X
Compiler X (X)
Inst. Set. X X
Organization X X
Technology X
JR.S00 16
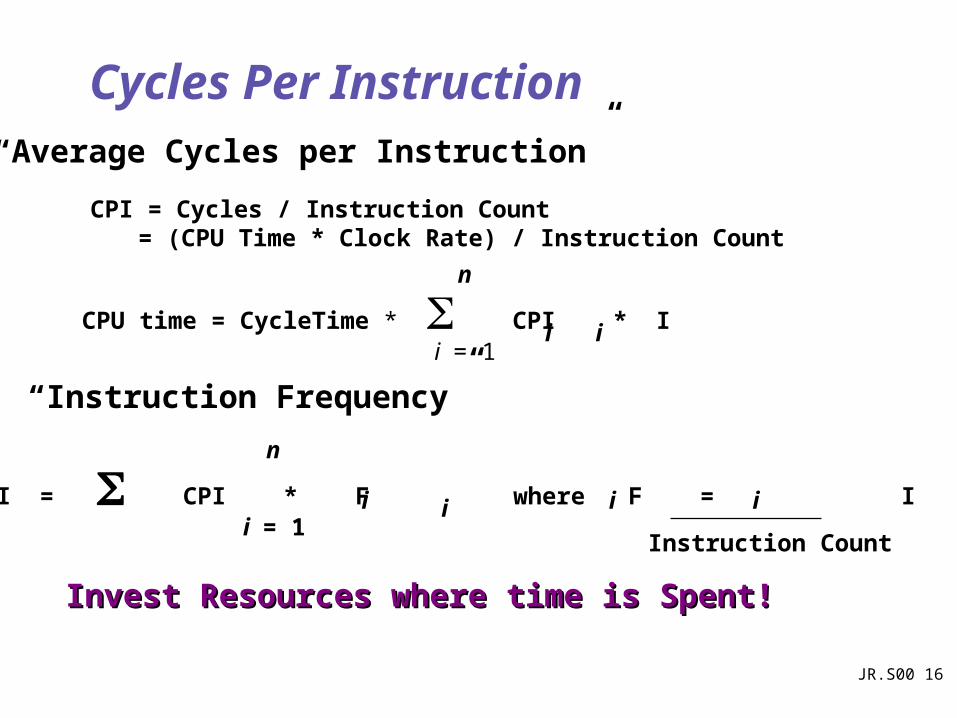
Cycles Per Instruction
CPU time = CycleTime * CPI * Ii = 1
n
i i
CPI = CPI * F where F = I i = 1
n
i i i i
Instruction Count
“Instruction Frequency”
Invest Resources where time is Spent!Invest Resources where time is Spent!
CPI = Cycles / Instruction Count = (CPU Time * Clock Rate) / Instruction Count
“Average Cycles per Instruction”
JR.S00 17
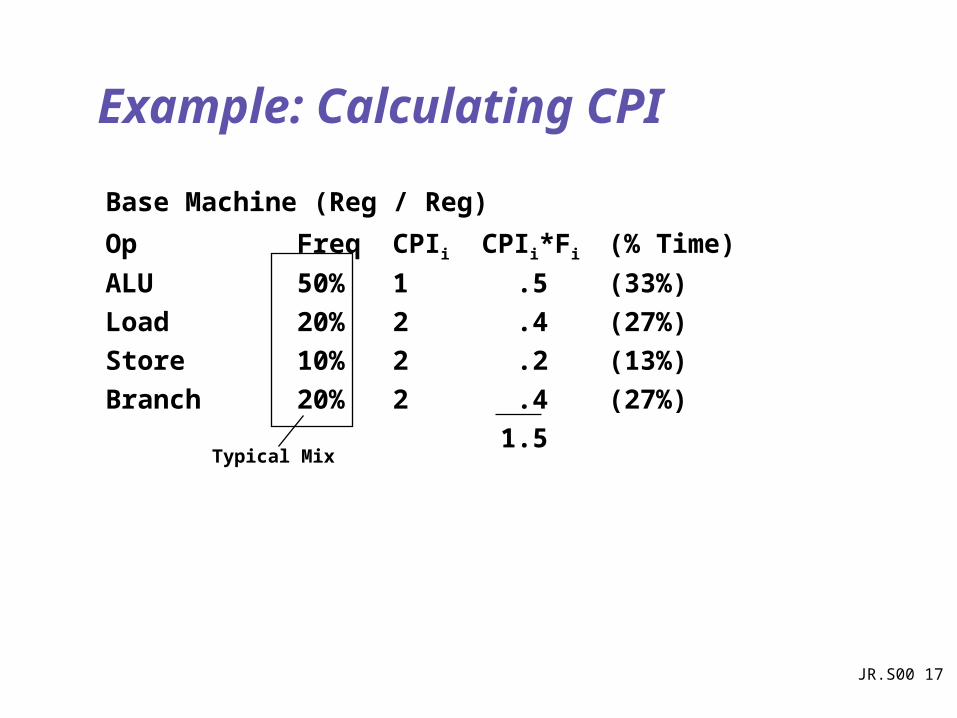
Example: Calculating CPI
Typical Mix
Base Machine (Reg / Reg)
Op Freq CPIi CPIi*Fi (% Time)
ALU 50% 1 .5 (33%)
Load 20% 2 .4 (27%)
Store 10% 2 .2 (13%)
Branch 20% 2 .4 (27%)
1.5
JR.S00 18
Creating Benchmark Sets
• Real programs
• Kernels
• Toy benchmarks
• Synthetic benchmarks– e.g. Whetstones and Dhrystones
JR.S00 19
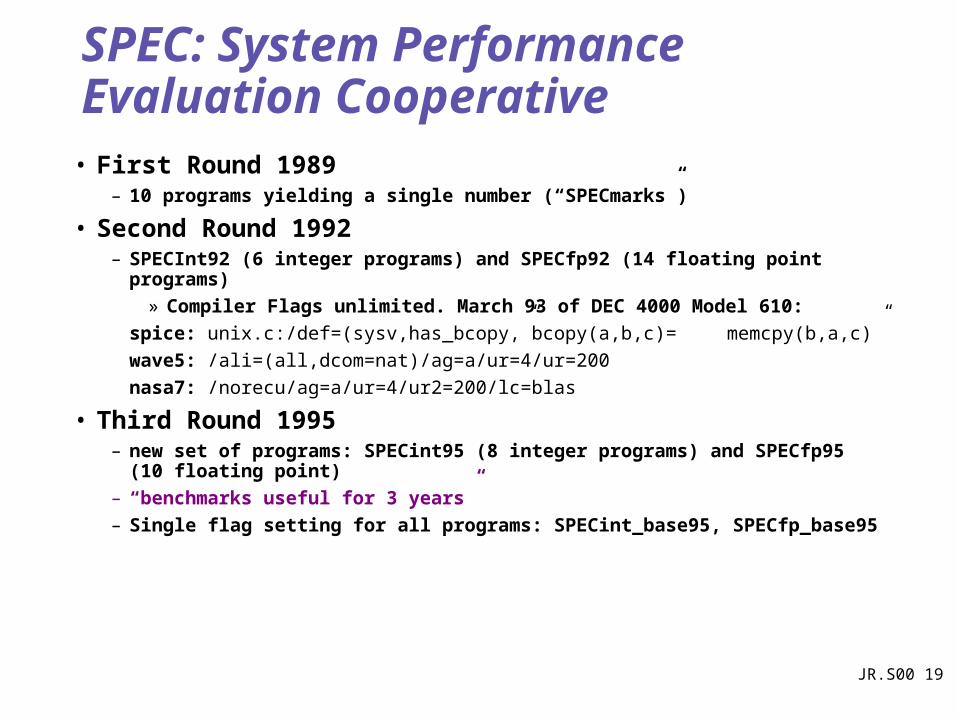
SPEC: System Performance Evaluation Cooperative
• First Round 1989– 10 programs yielding a single number (“SPECmarks”)
• Second Round 1992– SPECInt92 (6 integer programs) and SPECfp92 (14 floating point programs)
» Compiler Flags unlimited. March 93 of DEC 4000 Model 610:
spice: unix.c:/def=(sysv,has_bcopy,”bcopy(a,b,c)=memcpy(b,a,c)”
wave5: /ali=(all,dcom=nat)/ag=a/ur=4/ur=200
nasa7: /norecu/ag=a/ur=4/ur2=200/lc=blas
• Third Round 1995– new set of programs: SPECint95 (8 integer programs) and SPECfp95 (10
floating point)
– “benchmarks useful for 3 years”
– Single flag setting for all programs: SPECint_base95, SPECfp_base95
JR.S00 20
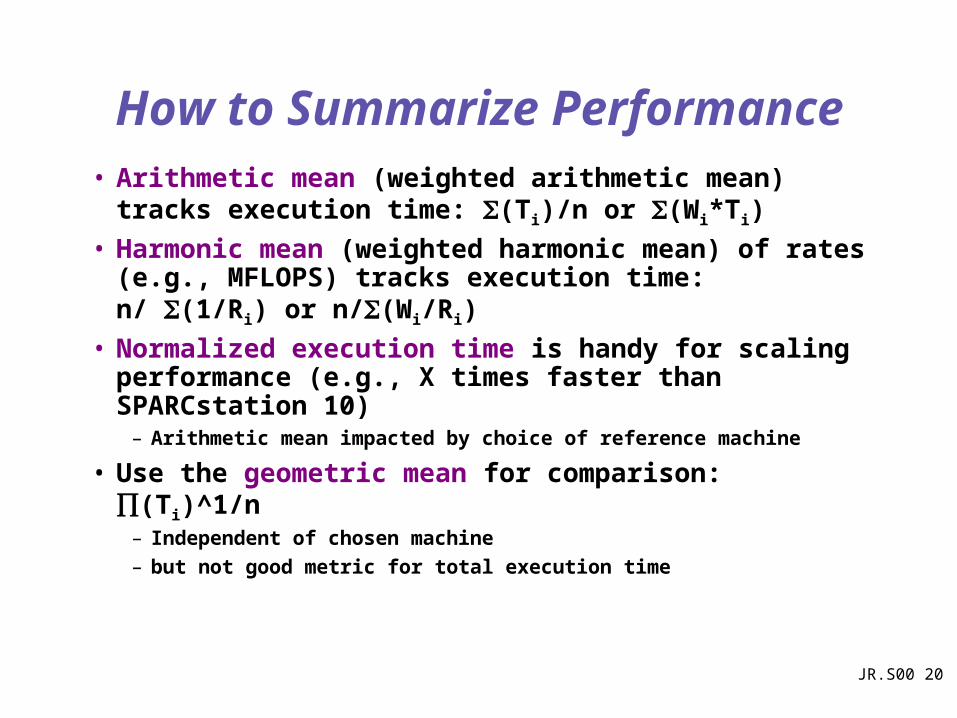
How to Summarize Performance• Arithmetic mean (weighted arithmetic mean) tracks
execution time: (Ti)/n or (Wi*Ti)
• Harmonic mean (weighted harmonic mean) of rates (e.g., MFLOPS) tracks execution time: n/ (1/Ri) or n/(Wi/Ri)
• Normalized execution time is handy for scaling performance (e.g., X times faster than SPARCstation 10)
– Arithmetic mean impacted by choice of reference machine
• Use the geometric mean for comparison:(Ti)^1/n
– Independent of chosen machine
– but not good metric for total execution time
JR.S00 21
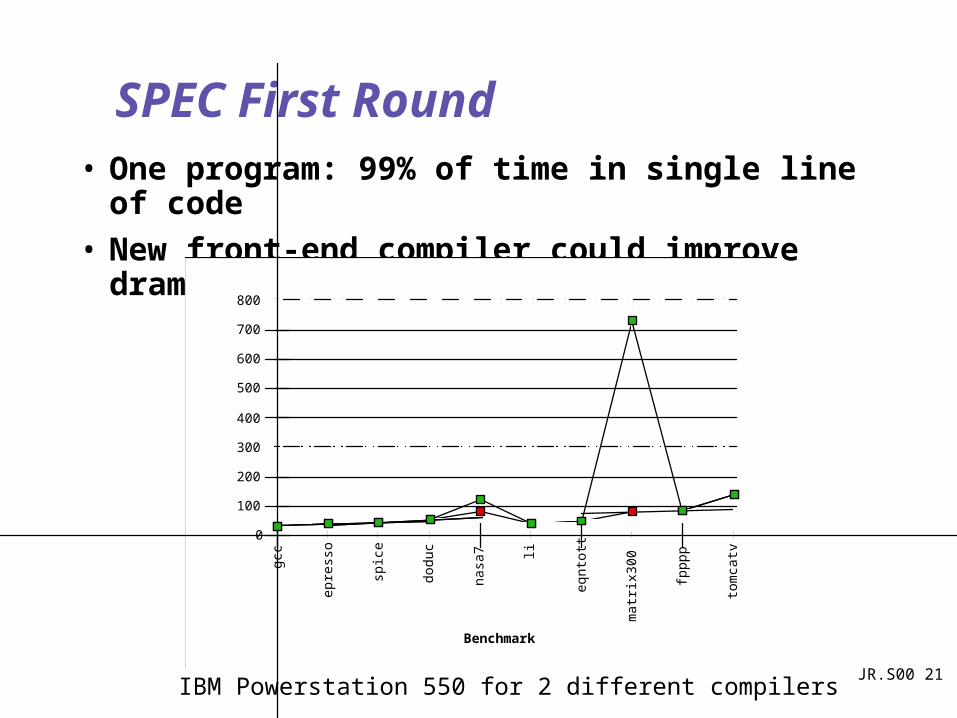
SPEC First Round• One program: 99% of time in single line of code
• New front-end compiler could improve dramatically
Benchmark
SP
EC
Pe
rf
0
100
200
300
400
500
600
700
800
gcc
epre
sso
spic
e
doduc
nasa
7 li
eqnto
tt
matr
ix300
fpppp
tom
catv
IBM Powerstation 550 for 2 different compilers
JR.S00 22
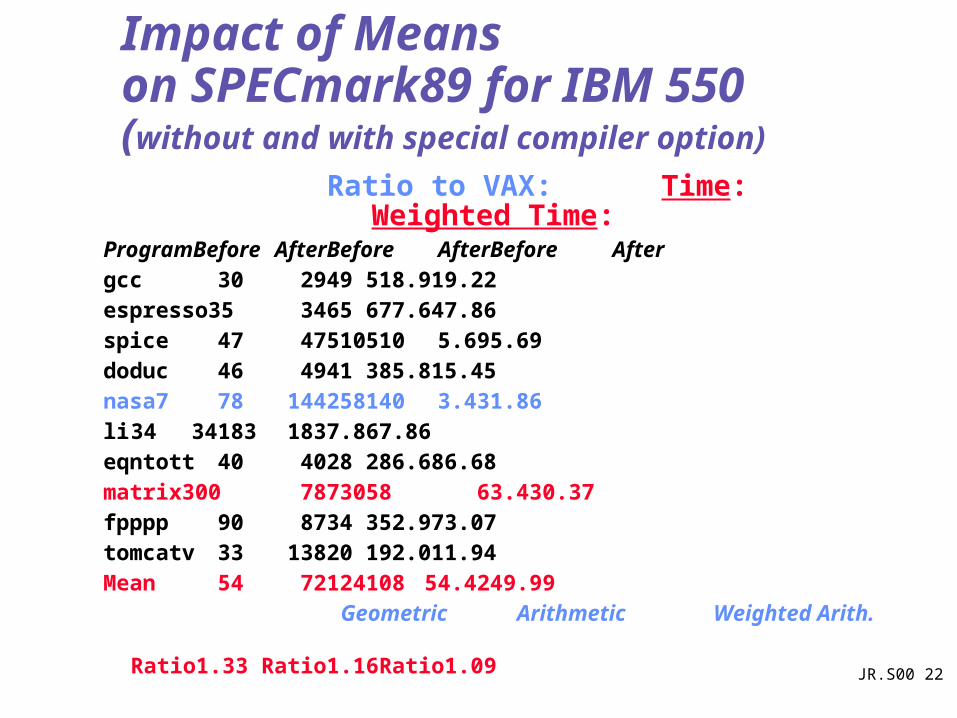
Impact of Means on SPECmark89 for IBM 550(without and with special compiler option)
Ratio to VAX: Time: Weighted Time:
ProgramBefore AfterBefore AfterBefore Aftergcc 30 29 49 51 8.91 9.22espresso35 34 65 67 7.64 7.86spice 47 47 510 510 5.69 5.69doduc 46 49 41 38 5.81 5.45nasa7 78 144 258 140 3.43 1.86li 34 34 183 183 7.86 7.86eqntott 40 40 28 28 6.68 6.68matrix30078 730 58 6 3.43 0.37fpppp 90 87 34 35 2.97 3.07tomcatv 33 138 20 19 2.01 1.94Mean 54 72 124 108 54.42 49.99
Geometric Arithmetic Weighted Arith.Ratio 1.33 Ratio 1.16 Ratio 1.09
JR.S00 23
Performance Evaluation• “For better or worse, benchmarks shape a field”
• Good products created when have:– Good benchmarks
– Good ways to summarize performance
• Given sales is a function in part of performance relative to competition, investment in improving product as reported by performance summary
• If benchmarks/summary inadequate, then choose between improving product for real programs vs. improving product to get more sales;Sales almost always wins!
• Execution time is the measure of computer performance!
JR.S00 24
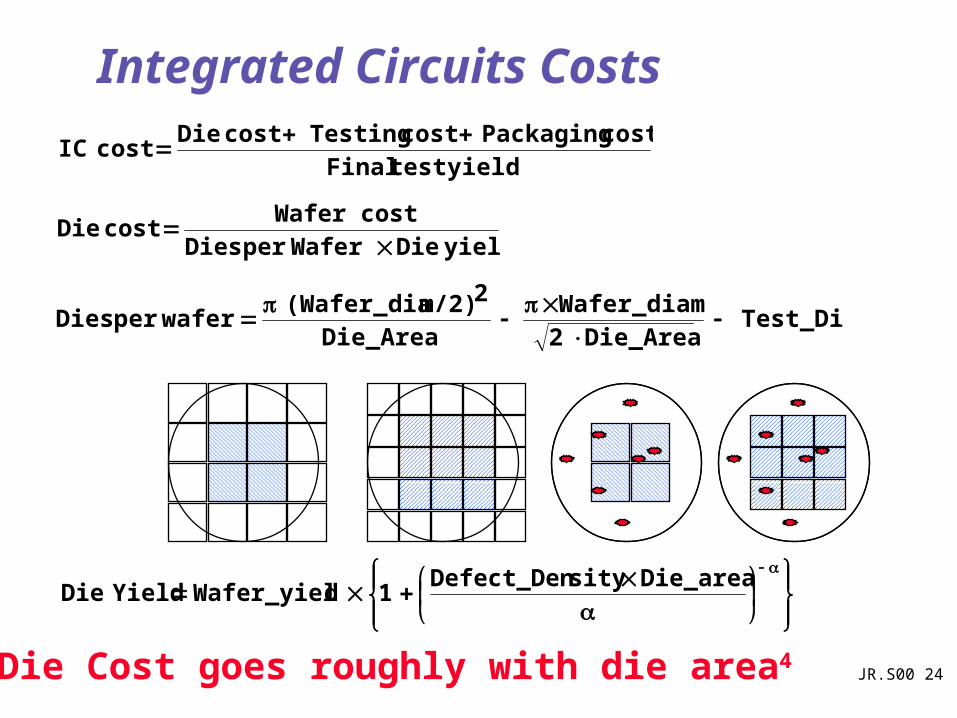
Integrated Circuits Costs
Die Cost goes roughly with die area4
Test_Die Die_Area 2
Wafer_diam
Die_Area
2m/2)(Wafer_dia wafer per Dies
Die_area sityDefect_Den
1 dWafer_yiel YieldDie
yieldtest Finalcost Packaging cost Testingcost Die
cost IC
yield Die Wafer per DiescostWafer
cost Die
JR.S00 25
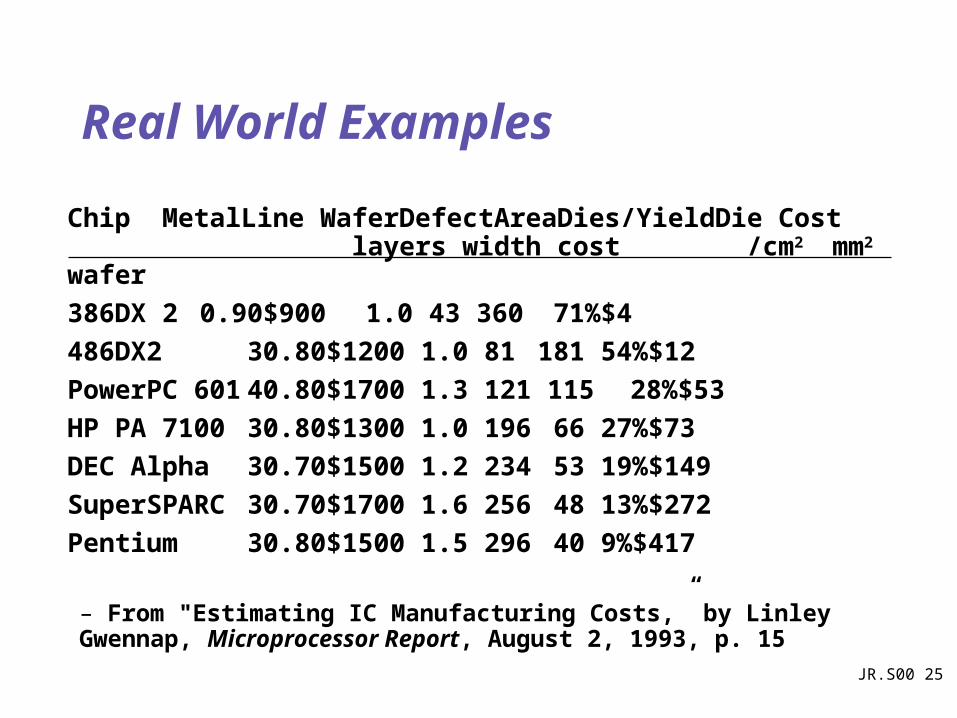
Real World Examples
Chip Metal Line Wafer Defect Area Dies/ Yield Die Cost layers width cost /cm2 mm2 wafer
386DX 2 0.90 $900 1.0 43 360 71% $4
486DX2 3 0.80 $1200 1.0 81 181 54% $12
PowerPC 601 4 0.80 $1700 1.3 121 115 28% $53
HP PA 7100 3 0.80 $1300 1.0 196 66 27% $73
DEC Alpha 3 0.70 $1500 1.2 234 53 19% $149
SuperSPARC 3 0.70 $1700 1.6 256 48 13% $272
Pentium 3 0.80 $1500 1.5 296 40 9% $417
– From "Estimating IC Manufacturing Costs,” by Linley Gwennap, Microprocessor Report, August 2, 1993, p. 15
JR.S00 26
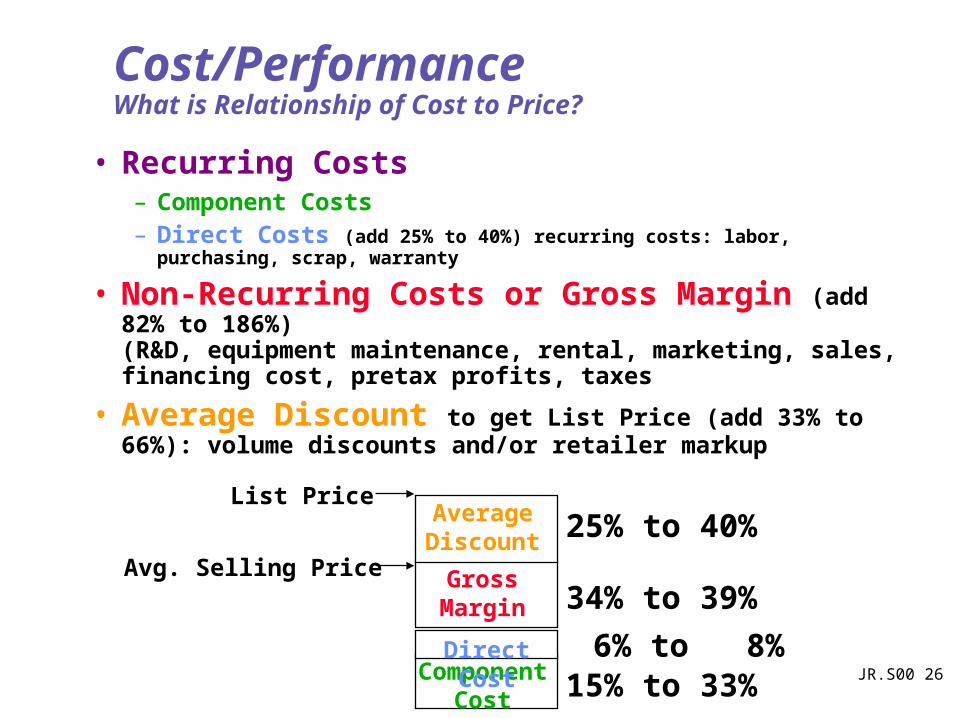
Cost/PerformanceWhat is Relationship of Cost to Price?
• Recurring Costs– Component Costs– Direct Costs (add 25% to 40%) recurring costs: labor, purchasing, scrap,
warranty
• Non-Recurring Costs or Gross Margin (add 82% to 186%) (R&D, equipment maintenance, rental, marketing, sales, financing cost, pretax profits, taxes
• Average Discount to get List Price (add 33% to 66%): volume discounts and/or retailer markup
ComponentCost
Direct Cost
GrossMargin
AverageDiscount
Avg. Selling Price
List Price
15% to 33% 6% to 8%
34% to 39%
25% to 40%
JR.S00 27
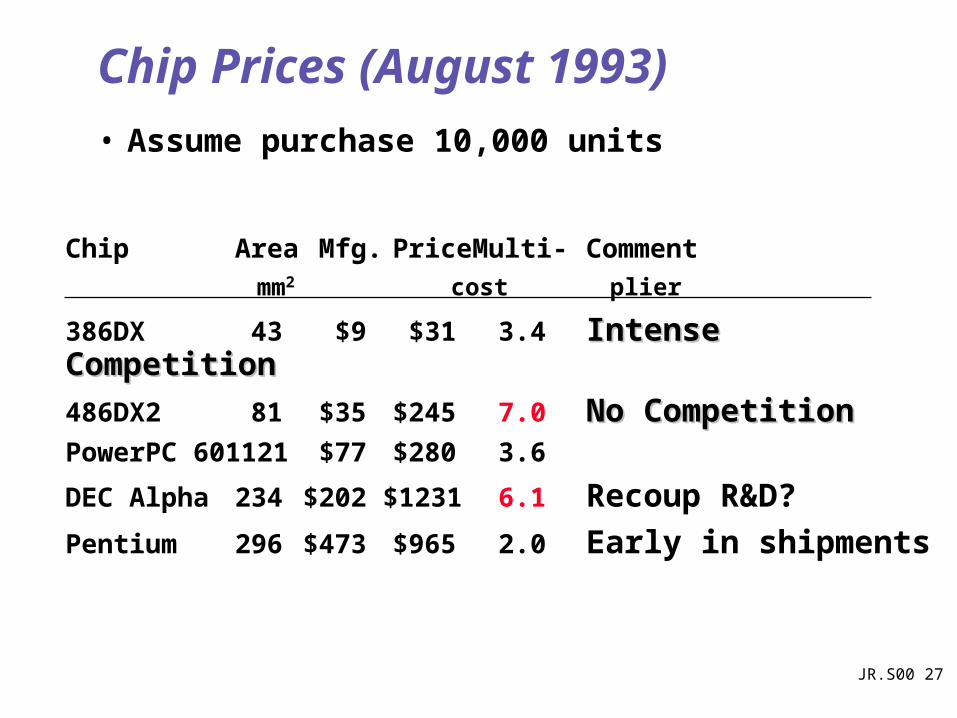
• Assume purchase 10,000 units
Chip Prices (August 1993)
Chip Area Mfg. PriceMulti- Commentmm2 cost plier
386DX 43 $9 $31 3.4 Intense Intense CompetitionCompetition
486DX2 81 $35 $245 7.0 No CompetitionNo CompetitionPowerPC 601121 $77 $280 3.6
DEC Alpha 234 $202 $1231 6.1 Recoup R&D?
Pentium 296 $473 $965 2.0 Early in shipments
JR.S00 28
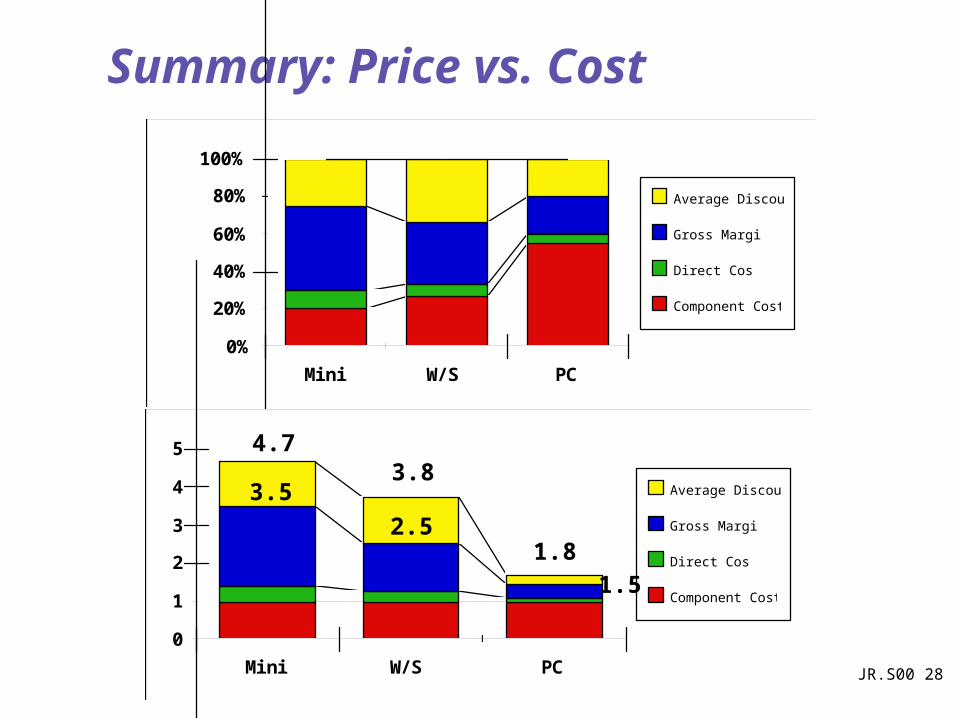
Summary: Price vs. Cost
0%
20%
40%
60%
80%
100%
Mini W/S PC
Average Discount
Gross Margin
Direct Costs
Component Costs
0
1
2
3
4
5
Mini W/S PC
Average Discount
Gross Margin
Direct Costs
Component Costs
4.73.8
1.8
3.52.5
1.5
JR.S00 29
386386
486 486
Pentium(R)Pentium(R)
MMX
Pentium Pro (R)
Pentium II (R)
1
10
100
Ma
x P
ow
er
(Wa
tts
) ?
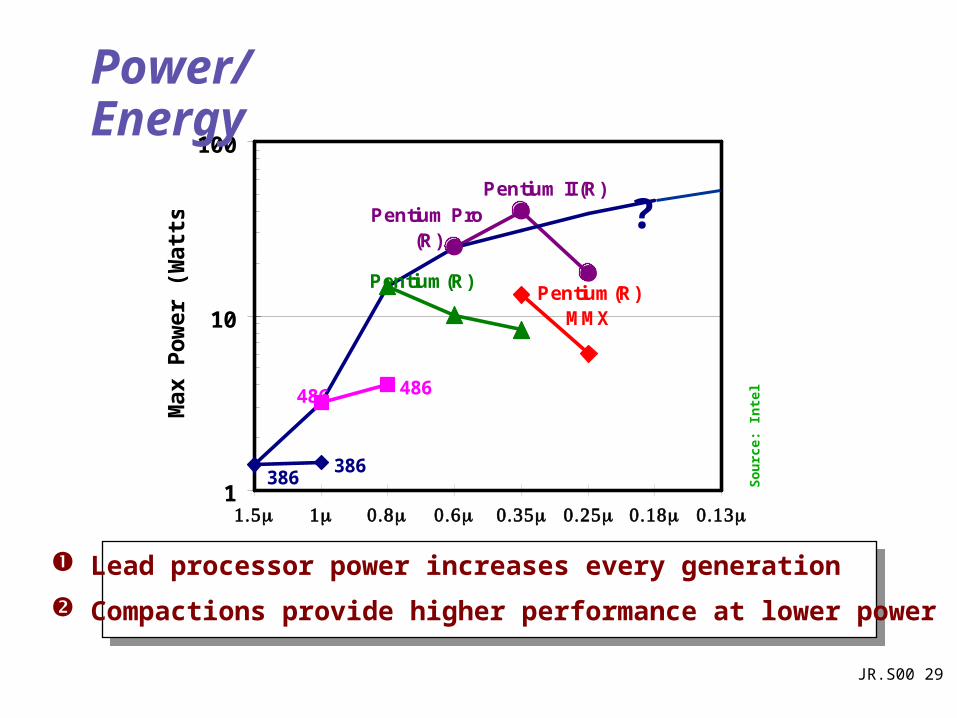
Power/Energy
Lead processor power increases every generation
Compactions provide higher performance at lower power
So
urc
e: In
tel
JR.S00 30
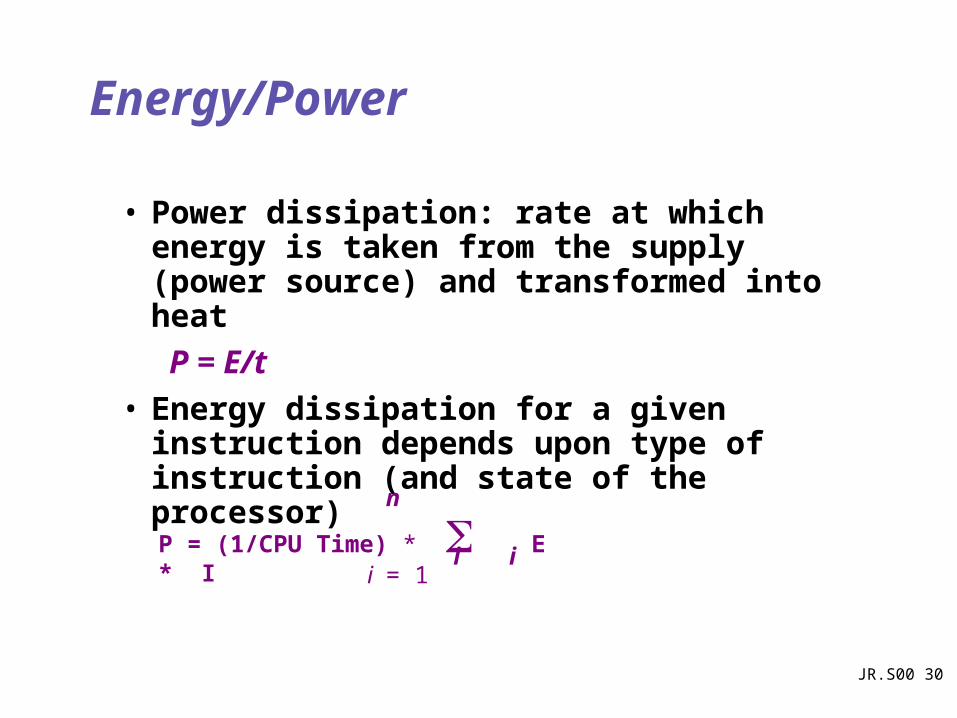
• Power dissipation: rate at which energy is taken from the supply (power source) and transformed into heat
P = E/t
• Energy dissipation for a given instruction depends upon type of instruction (and state of the processor)
Energy/Power
P = (1/CPU Time) * E * Ii = 1
n
i i
JR.S00 31
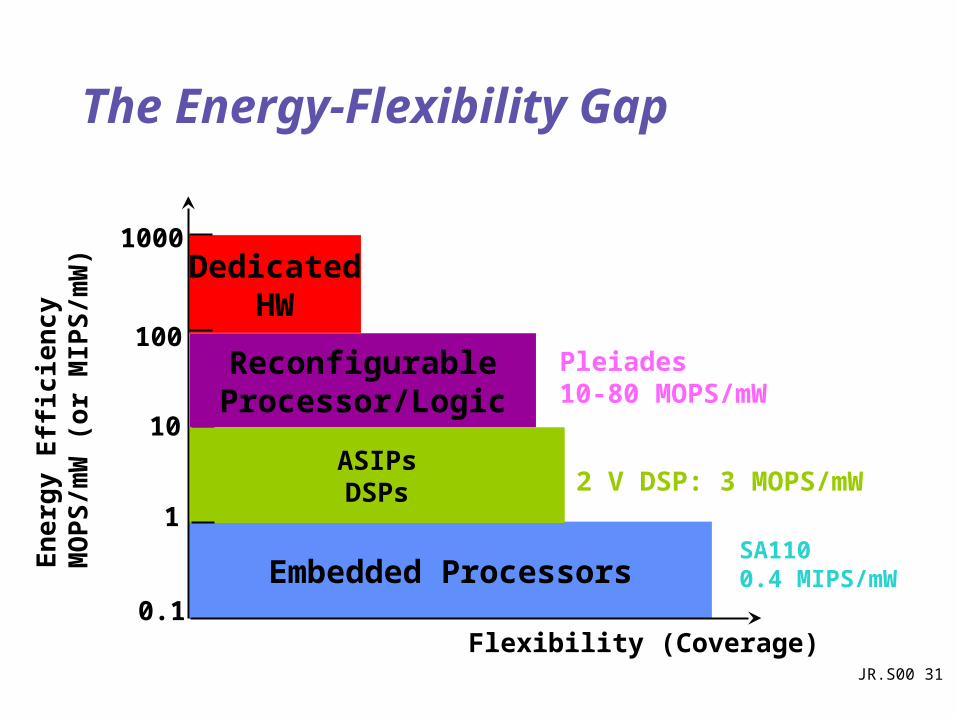
The Energy-Flexibility Gap
Embedded ProcessorsSA1100.4 MIPS/mW
ASIPsDSPs 2 V DSP: 3 MOPS/mW
DedicatedHW
Flexibility (Coverage)
En
ergy
Eff
icie
ncy
MO
PS
/mW
(or
MIP
S/m
W)
0.1
1
10
100
1000
ReconfigurableProcessor/Logic
Pleiades10-80 MOPS/mW
JR.S00 32
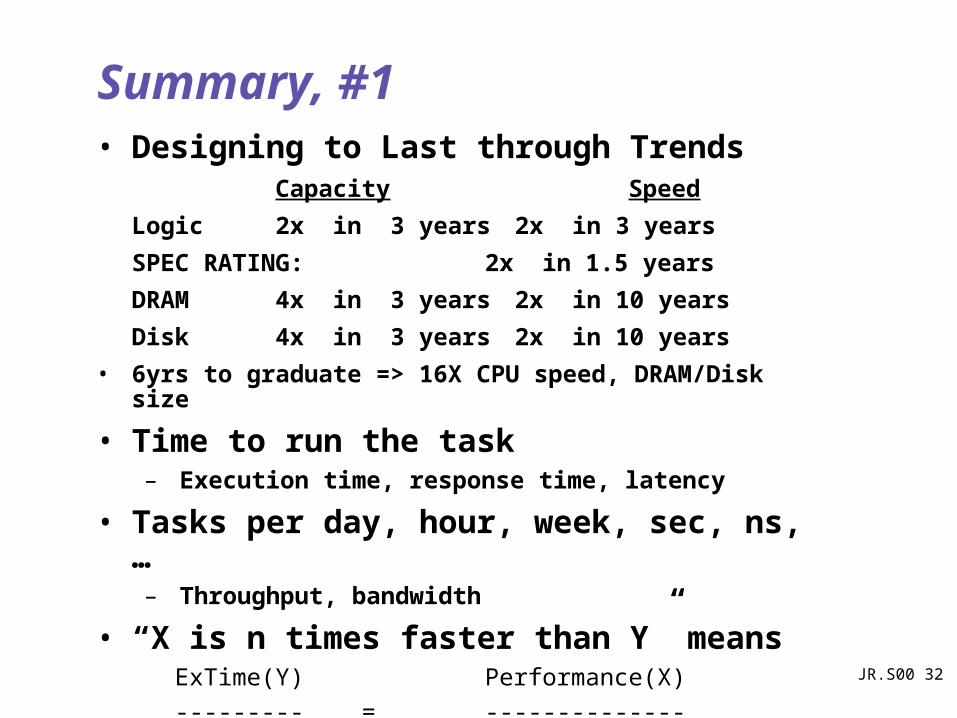
Summary, #1• Designing to Last through Trends
Capacity Speed
Logic 2x in 3 years 2x in 3 years
SPEC RATING: 2x in 1.5 years
DRAM 4x in 3 years 2x in 10 years
Disk 4x in 3 years 2x in 10 years
• 6yrs to graduate => 16X CPU speed, DRAM/Disk size
• Time to run the task– Execution time, response time, latency
• Tasks per day, hour, week, sec, ns, …– Throughput, bandwidth
• “X is n times faster than Y” means ExTime(Y) Performance(X)
--------- = --------------
ExTime(X) Performance(Y)
JR.S00 33
Summary, #2
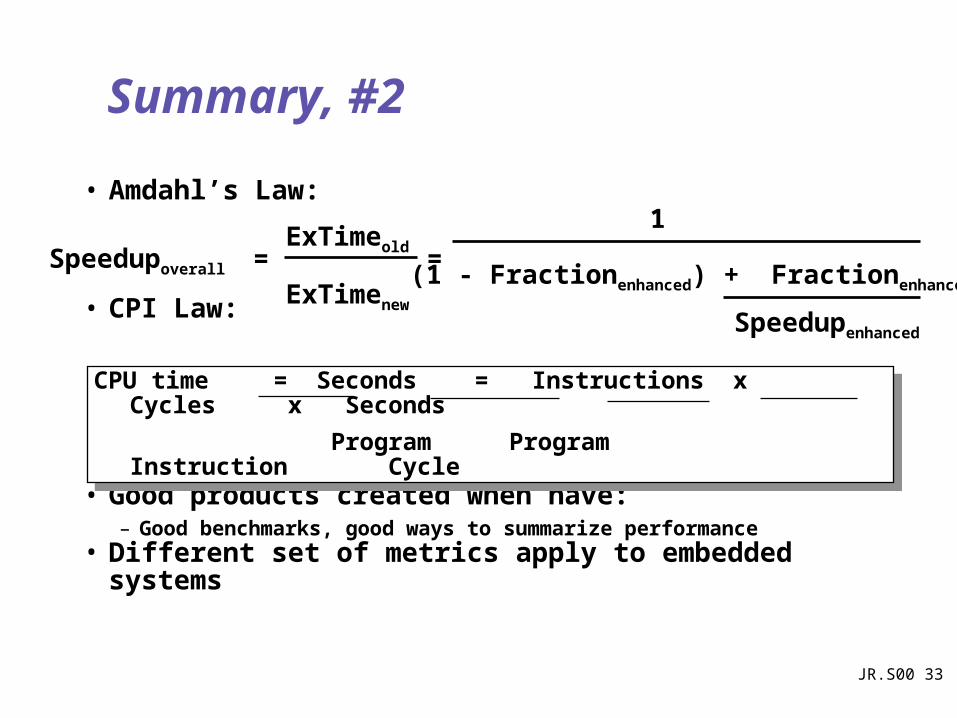
• Amdahl’s Law:
• CPI Law:
• Execution time is the REAL measure of computer performance!
• Good products created when have:– Good benchmarks, good ways to summarize performance
• Different set of metrics apply to embedded systems
Speedupoverall =ExTimeold
ExTimenew
=
1
(1 - Fractionenhanced) + Fractionenhanced
Speedupenhanced
CPU time = Seconds = Instructions x Cycles x Seconds
Program Program Instruction Cycle
CPU time = Seconds = Instructions x Cycles x Seconds
Program Program Instruction Cycle
JR.S00 34
Review:Instruction Sets, Pipelines, and Caches
JR.S00 35
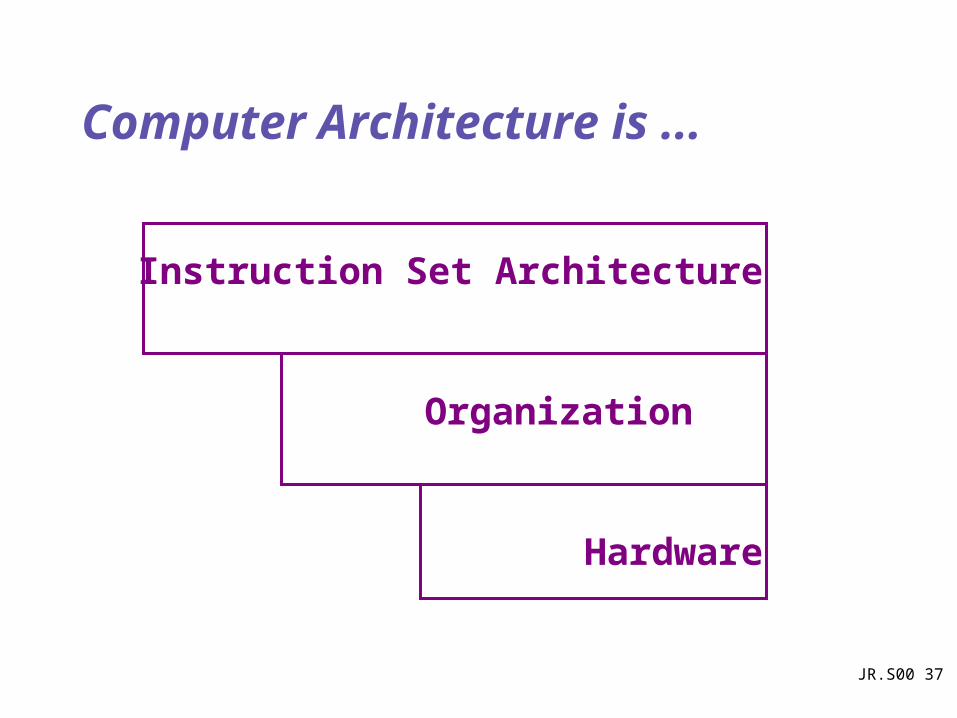
Computer Architecture Is …
the attributes of a [computing] system as seen by the programmer, i.e., the conceptual structure and functional behavior, as distinct from the organization of the data flows and controls the logic design, and the physical implementation.
Amdahl, Blaaw, and Brooks, 1964
JR.S00 36
Computer Architecture’s Changing Definition
• 1950s to 1960s: Computer Architecture Course = Computer Arithmetic
• 1970s to mid 1980s: Computer Architecture Course = Instruction Set Design, especially ISA appropriate for compilers
• 1990s: Computer Architecture Course = Design of CPU, memory system, I/O system, Multiprocessors
JR.S00 37
Computer Architecture is ...
Instruction Set Architecture
Organization
Hardware
JR.S00 38
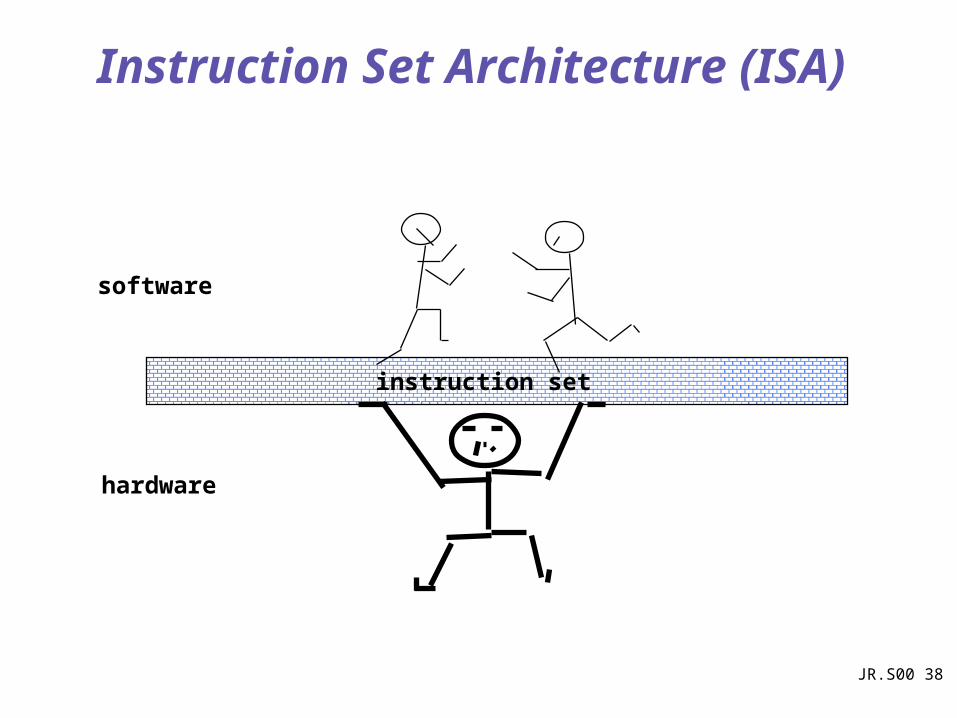
Instruction Set Architecture (ISA)
instruction set
software
hardware

JR.S00 39
Interface Design
A good interface:
• Lasts through many implementations (portability, compatability)
• Is used in many differeny ways (generality)
• Provides convenient functionality to higher levels
• Permits an efficient implementation at lower levels
Interfaceimp 1
imp 2
imp 3
use
use
use
time
JR.S00 40
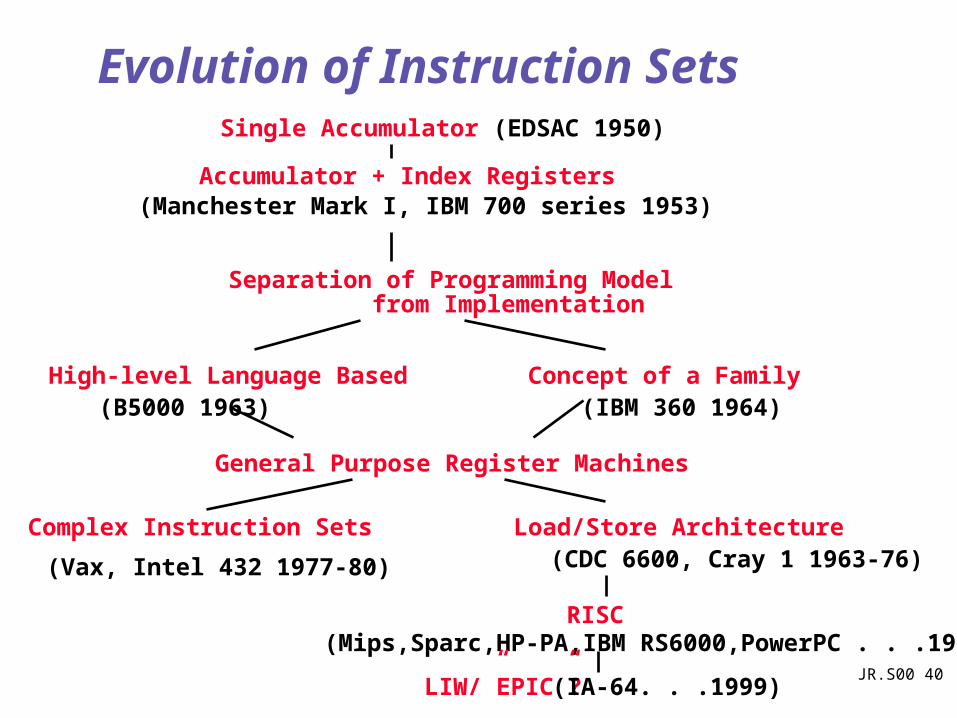
Evolution of Instruction SetsSingle Accumulator (EDSAC 1950)
Accumulator + Index Registers(Manchester Mark I, IBM 700 series 1953)
Separation of Programming Model from Implementation
High-level Language Based Concept of a Family(B5000 1963) (IBM 360 1964)
General Purpose Register Machines
Complex Instruction Sets Load/Store Architecture
RISC
(Vax, Intel 432 1977-80) (CDC 6600, Cray 1 1963-76)
(Mips,Sparc,HP-PA,IBM RS6000,PowerPC . . .1987)
LIW/”EPIC”? (IA-64. . .1999)
JR.S00 41
Evolution of Instruction Sets
• Major advances in computer architecture are typically associated with landmark instruction set designs
– Ex: Stack vs GPR (System 360)
• Design decisions must take into account:– technology
– machine organization
– programming languages
– compiler technology
– operating systems
– applications
• And they in turn influence these
JR.S00 42
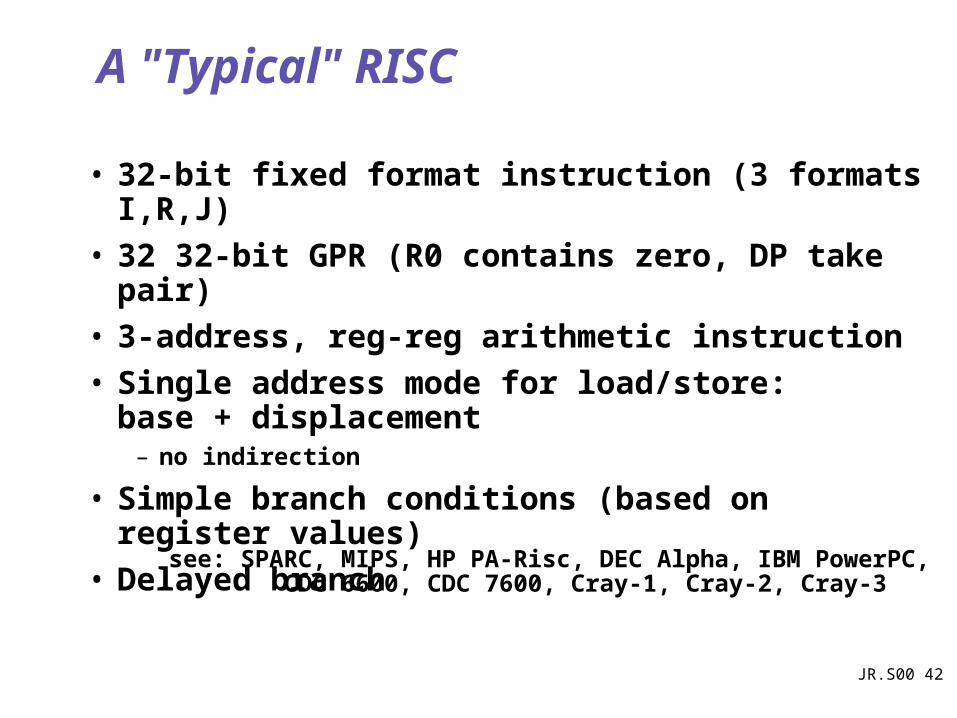
A "Typical" RISC
• 32-bit fixed format instruction (3 formats I,R,J)
• 32 32-bit GPR (R0 contains zero, DP take pair)
• 3-address, reg-reg arithmetic instruction
• Single address mode for load/store: base + displacement
– no indirection
• Simple branch conditions (based on register values)
• Delayed branch
see: SPARC, MIPS, HP PA-Risc, DEC Alpha, IBM PowerPC, CDC 6600, CDC 7600, Cray-1, Cray-2, Cray-3
JR.S00 43
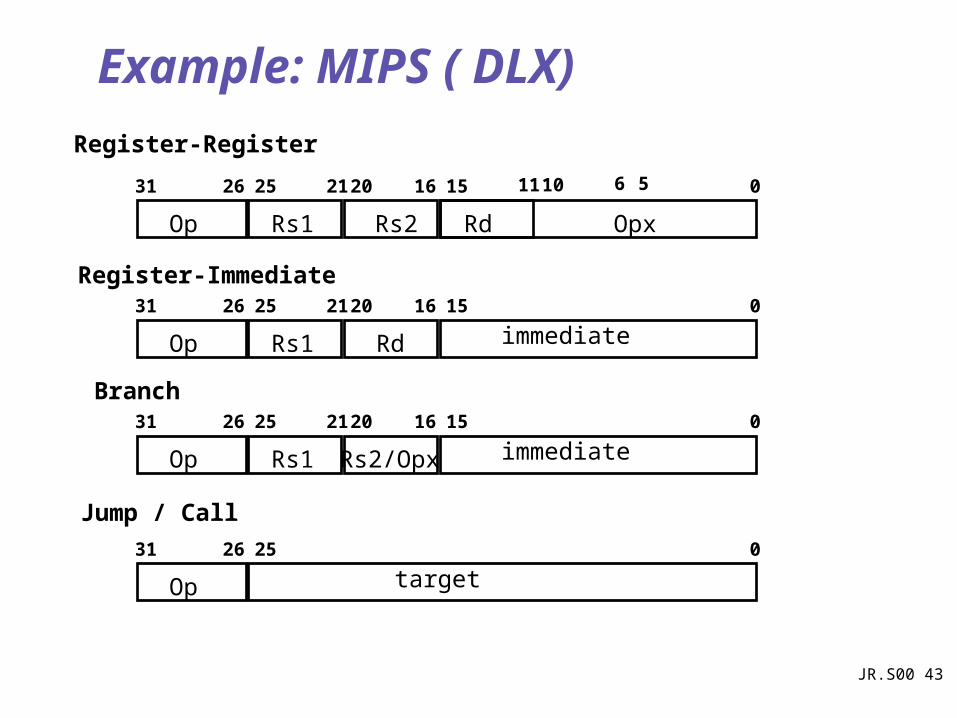
Example: MIPS ( DLX)
Op
31 26 01516202125
Rs1 Rd immediate
Op
31 26 025
Op
31 26 01516202125
Rs1 Rs2
target
Rd Opx
Register-Register
561011
Register-Immediate
Op
31 26 01516202125
Rs1 Rs2/Opx immediate
Branch
Jump / Call
JR.S00 44
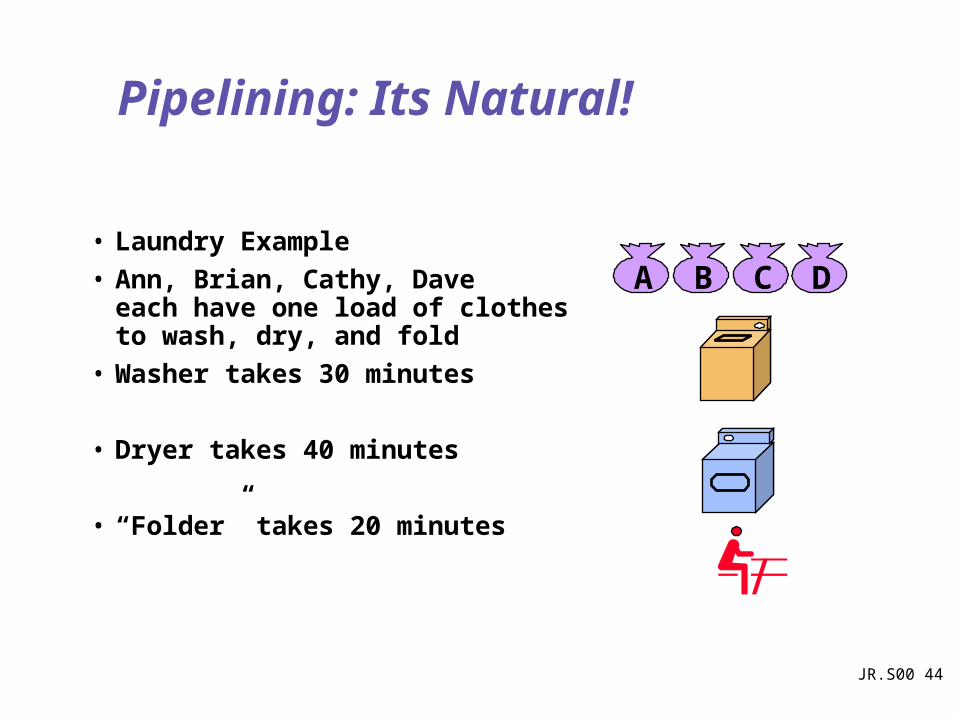
Pipelining: Its Natural!
• Laundry Example
• Ann, Brian, Cathy, Dave each have one load of clothes to wash, dry, and fold
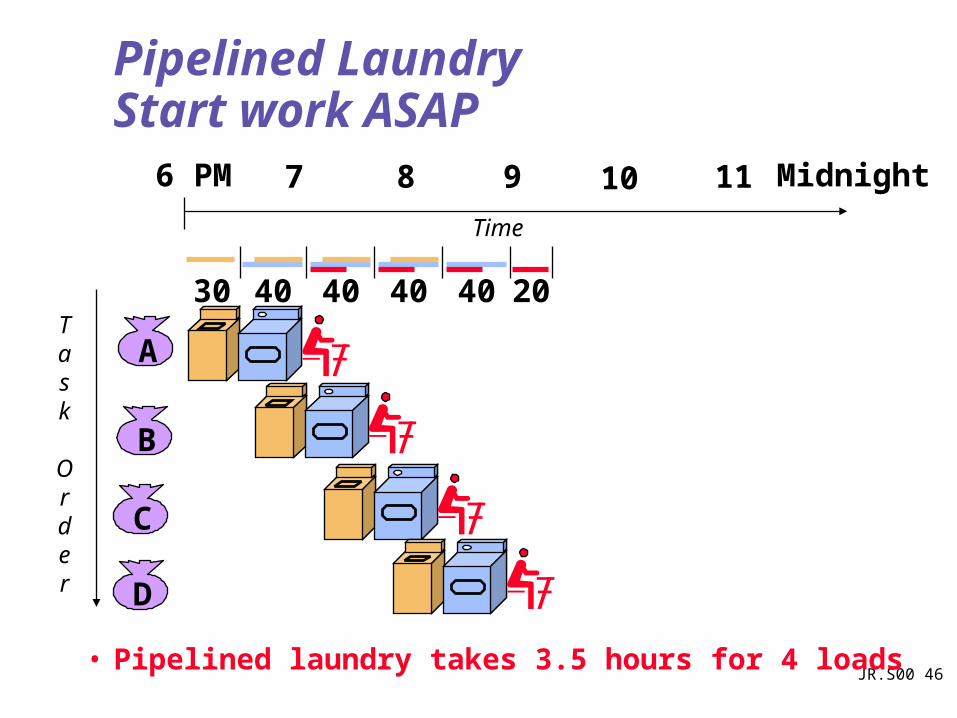
• Washer takes 30 minutes
• Dryer takes 40 minutes
• “Folder” takes 20 minutes
A B C D
JR.S00 45
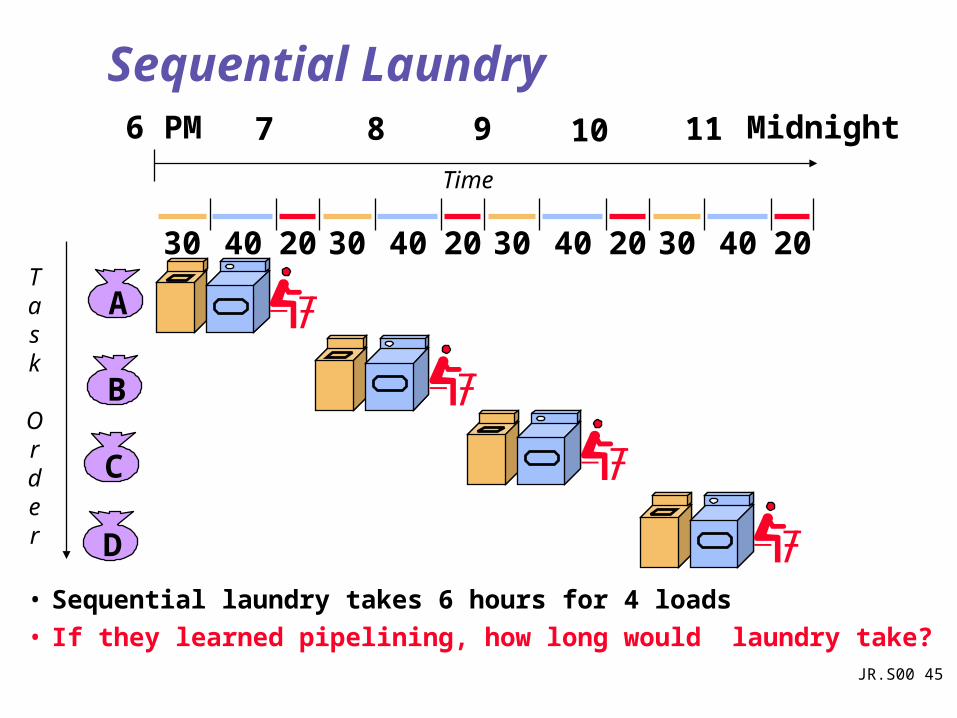
Sequential Laundry
• Sequential laundry takes 6 hours for 4 loads
• If they learned pipelining, how long would laundry take?
A
B
C
D
30 40 20 30 40 20 30 40 20 30 40 20
6 PM 7 8 9 10 11 Midnight
Task
Order
Time
JR.S00 46
Pipelined LaundryStart work ASAP
• Pipelined laundry takes 3.5 hours for 4 loads
A
B
C
D
6 PM 7 8 9 10 11 Midnight
Task
Order
Time
30 40 40 40 40 20
JR.S00 47
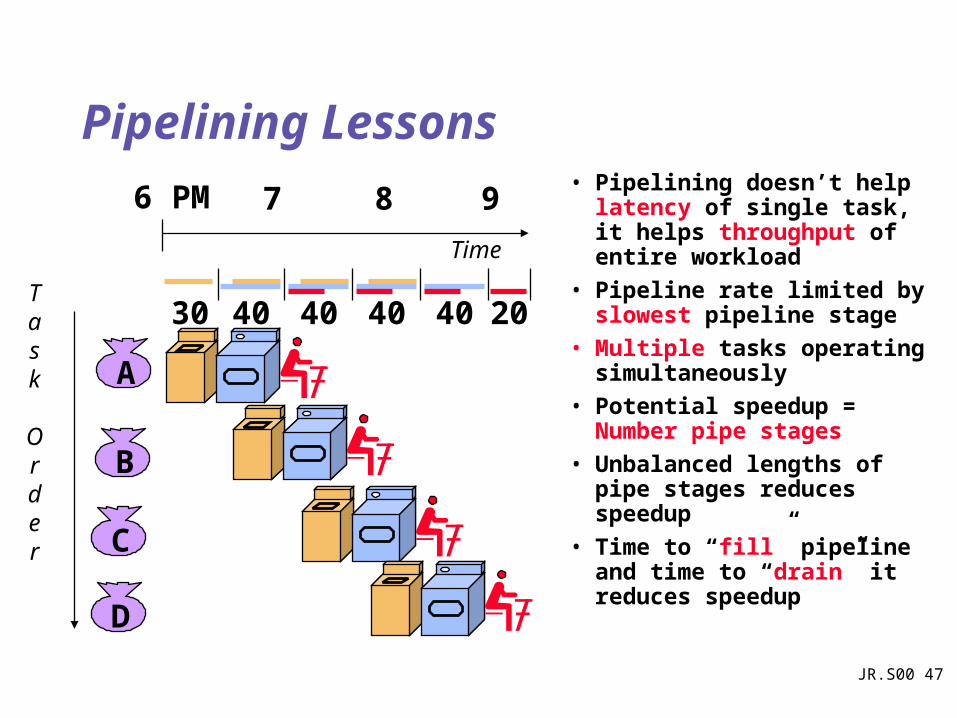
Pipelining Lessons• Pipelining doesn’t help
latency of single task, it helps throughput of entire workload
• Pipeline rate limited by slowest pipeline stage
• Multiple tasks operating simultaneously
• Potential speedup = Number pipe stages
• Unbalanced lengths of pipe stages reduces speedup
• Time to “fill” pipeline and time to “drain” it reduces speedup
A
B
C
D
6 PM 7 8 9
Task
Order
Time
30 40 40 40 40 20
JR.S00 48
Computer Pipelines
• Execute billions of instructions, so throughout is what matters
• DLX desirable features: all instructions same length, registers located in same place in instruction format, memory operands only in loads or stores
JR.S00 49
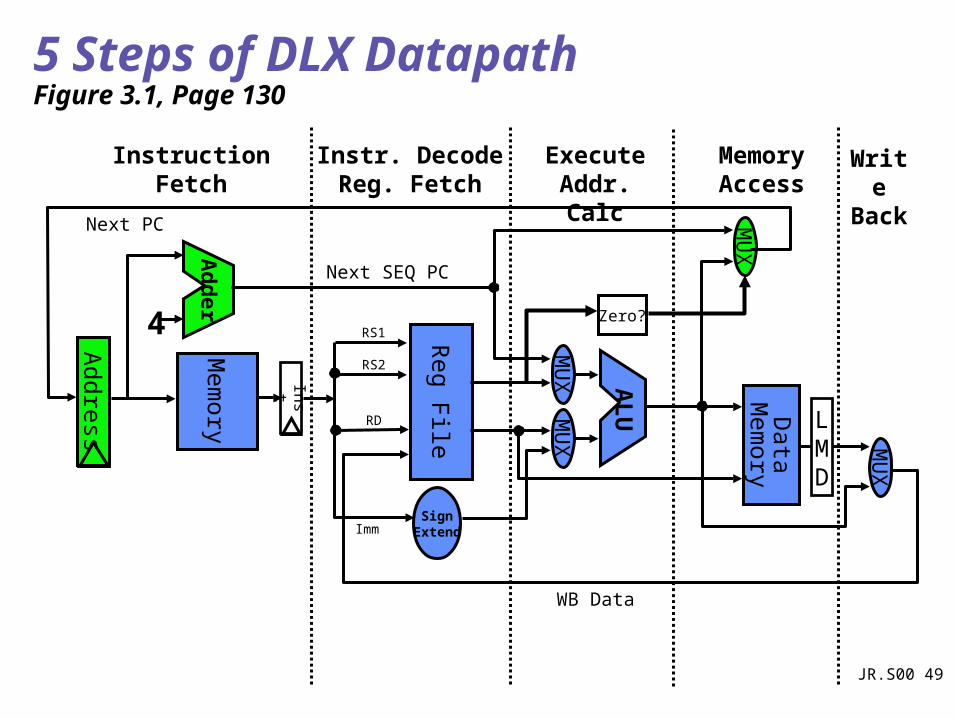
5 Steps of DLX DatapathFigure 3.1, Page 130
MemoryAccess
Write
Back
InstructionFetch
Instr. DecodeReg. Fetch
ExecuteAddr. Calc
LMD
ALU
MU
X
Mem
ory
Reg File
MU
XM
UX
Data
Mem
ory
MU
X
SignExtend
4
Ad
der Zero?
Next SEQ PC
Addre
ss
Next PC
WB Data
Inst
RD
RS1
RS2
Imm
JR.S00 50
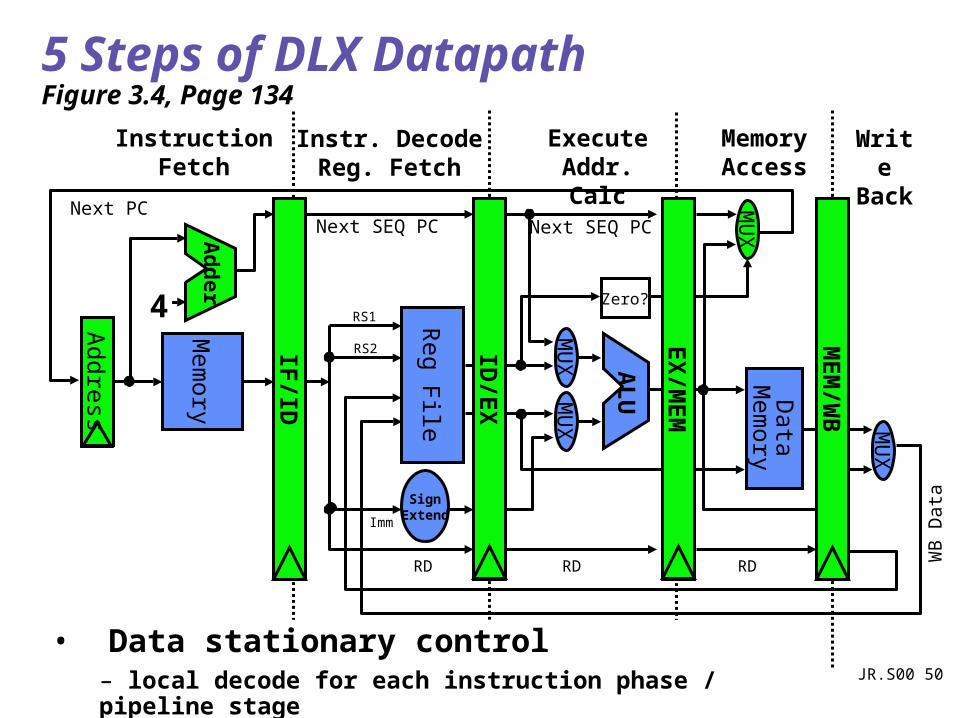
5 Steps of DLX DatapathFigure 3.4, Page 134
MemoryAccess
Write
Back
InstructionFetch
Instr. DecodeReg. Fetch
ExecuteAddr. Calc
ALU
Mem
ory
Reg File
MU
XM
UX
Data
Mem
ory
MU
X
SignExtend
Zero?
IF/ID
ID/E
X
MEM
/WB
EX
/MEM
4
Ad
der
Next SEQ PC Next SEQ PC
RD RD RD WB
Data
• Data stationary control– local decode for each instruction phase / pipeline stage
Next PC
Addre
ss
RS1
RS2
Imm
MU
X
JR.S00 51
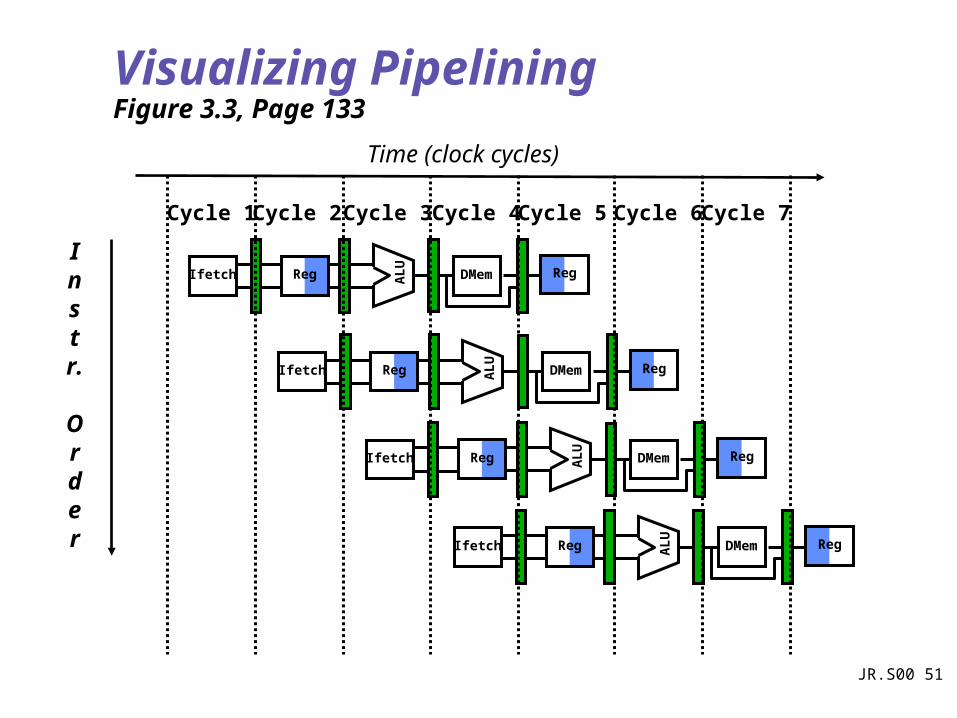
Visualizing PipeliningFigure 3.3, Page 133
Instr.
Order
Time (clock cycles)
Reg
ALU
DMemIfetch Reg
Reg
ALU
DMemIfetch Reg
Reg
ALU
DMemIfetch Reg
Reg
ALU
DMemIfetch Reg
Cycle 1Cycle 2 Cycle 3Cycle 4 Cycle 6Cycle 7Cycle 5
JR.S00 52
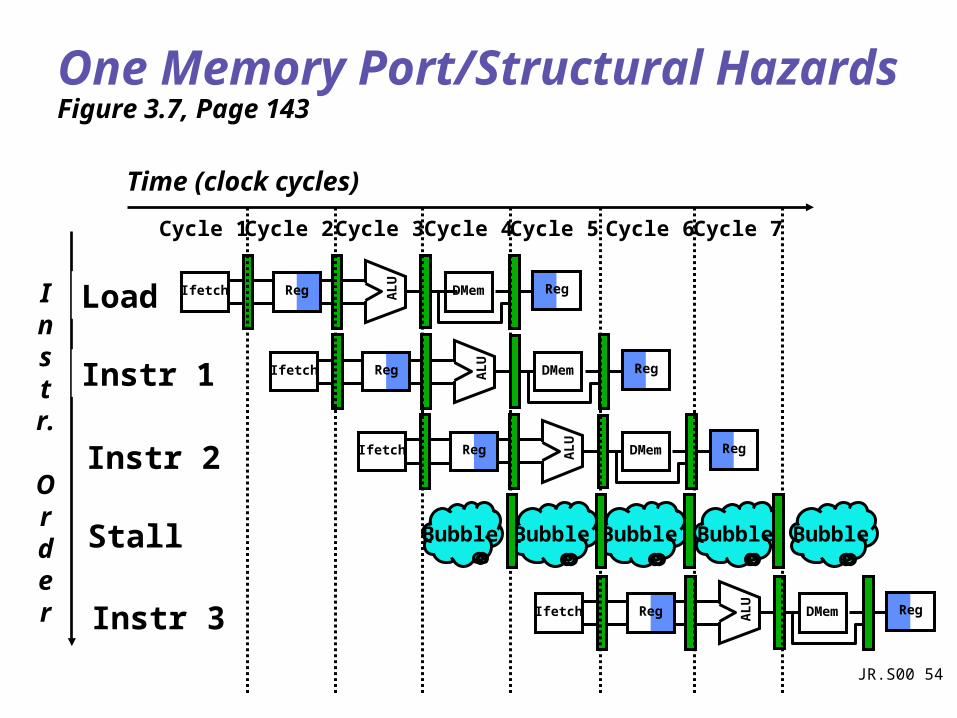
Its Not That Easy for Computers
• Limits to pipelining: Hazards prevent next instruction from executing during its designated clock cycle
– Structural hazards: HW cannot support this combination of instructions - two dogs fighting for the same bone
– Data hazards: Instruction depends on result of prior instruction still in the pipeline
– Control hazards: Caused by delay between the fetching of instructions and decisions about changes in control flow (branches and jumps).
JR.S00 53
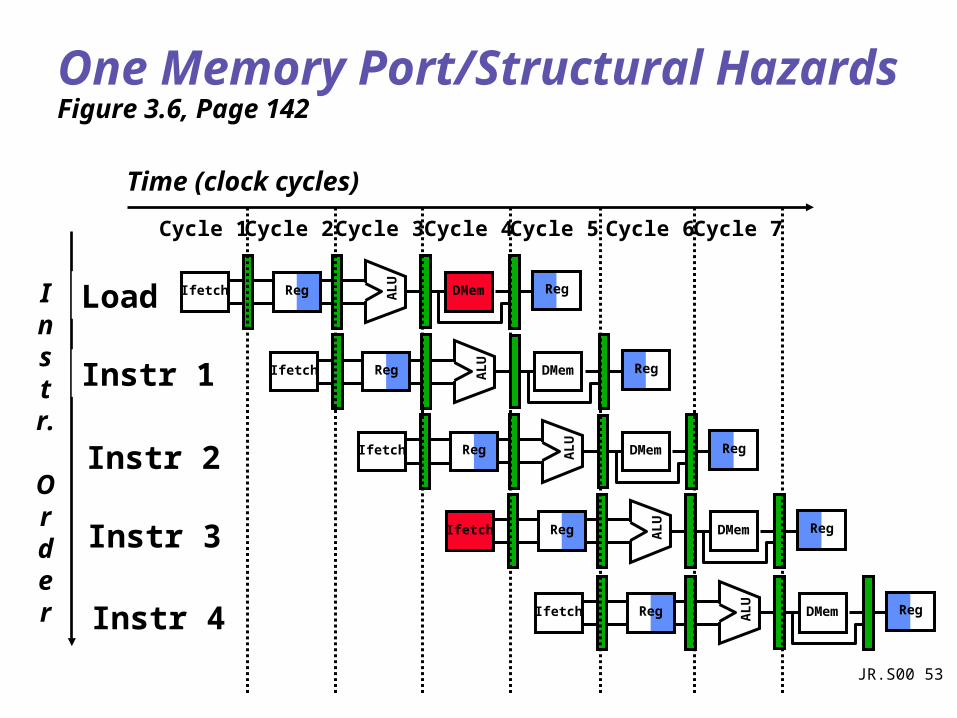
One Memory Port/Structural HazardsFigure 3.6, Page 142
Instr.
Order
Time (clock cycles)
Load
Instr 1
Instr 2
Instr 3
Instr 4
Reg
ALU
DMemIfetch Reg
Reg
ALU
DMemIfetch Reg
Reg
ALU
DMemIfetch Reg
Reg
ALU
DMemIfetch Reg
Cycle 1Cycle 2 Cycle 3Cycle 4 Cycle 6Cycle 7Cycle 5
Reg
ALU
DMemIfetch Reg
JR.S00 54
One Memory Port/Structural HazardsFigure 3.7, Page 143
Instr.
Order
Time (clock cycles)
Load
Instr 1
Instr 2
Stall
Instr 3
Reg
ALU
DMemIfetch Reg
Reg
ALU
DMemIfetch Reg
Reg
ALU
DMemIfetch Reg
Cycle 1Cycle 2 Cycle 3Cycle 4 Cycle 6Cycle 7Cycle 5
Reg
ALU
DMemIfetch Reg
Bubble Bubble Bubble BubbleBubble
JR.S00 55
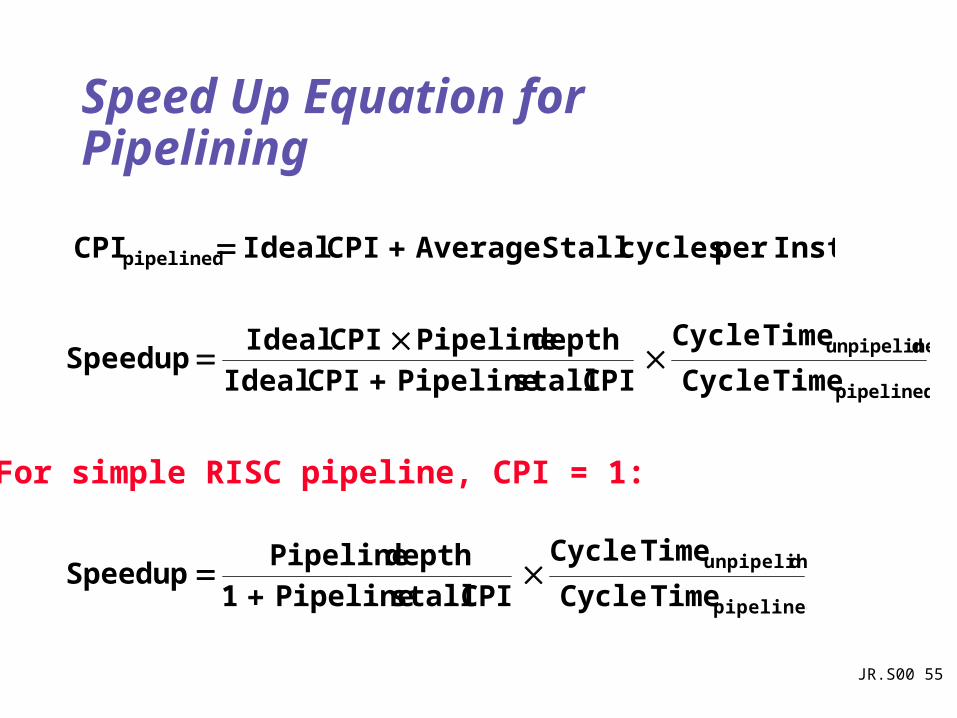
Speed Up Equation for Pipelining
pipelined
dunpipeline
TimeCycle
TimeCycle
CPI stall Pipeline CPI Idealdepth Pipeline CPI Ideal
Speedup
pipelined
dunpipeline
TimeCycle
TimeCycle
CPI stall Pipeline 1depth Pipeline
Speedup
Instper cycles Stall Average CPI Ideal CPIpipelined
For simple RISC pipeline, CPI = 1:
JR.S00 56
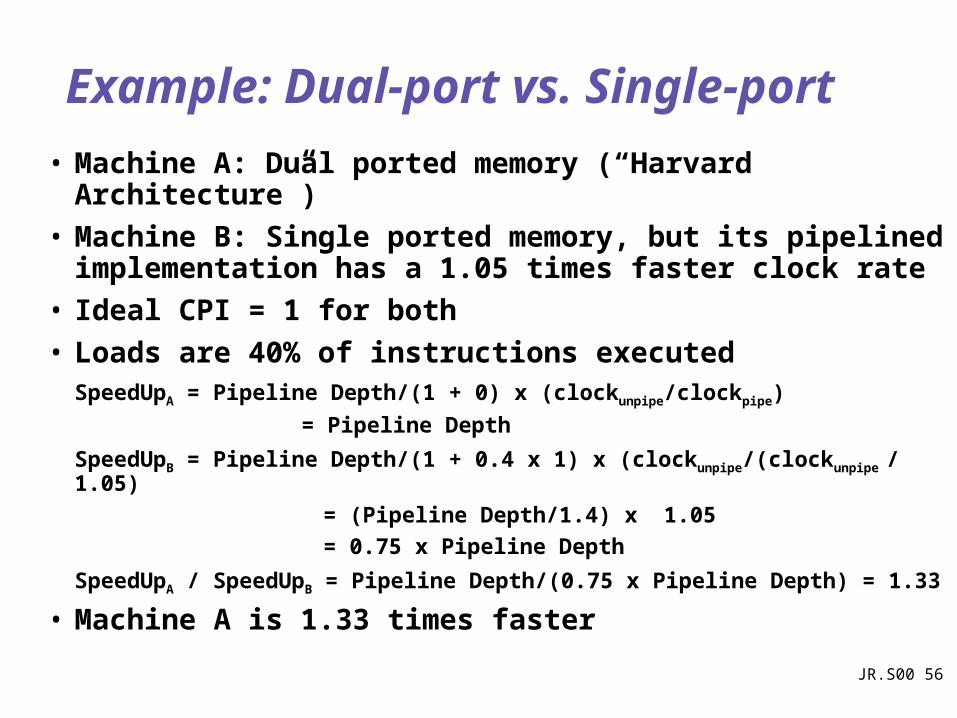
Example: Dual-port vs. Single-port
• Machine A: Dual ported memory (“Harvard Architecture”)
• Machine B: Single ported memory, but its pipelined implementation has a 1.05 times faster clock rate
• Ideal CPI = 1 for both
• Loads are 40% of instructions executedSpeedUpA = Pipeline Depth/(1 + 0) x (clockunpipe/clockpipe)
= Pipeline Depth
SpeedUpB = Pipeline Depth/(1 + 0.4 x 1) x (clockunpipe/(clockunpipe / 1.05)
= (Pipeline Depth/1.4) x 1.05
= 0.75 x Pipeline Depth
SpeedUpA / SpeedUpB = Pipeline Depth/(0.75 x Pipeline Depth) = 1.33
• Machine A is 1.33 times faster
JR.S00 57
Instr.
Order
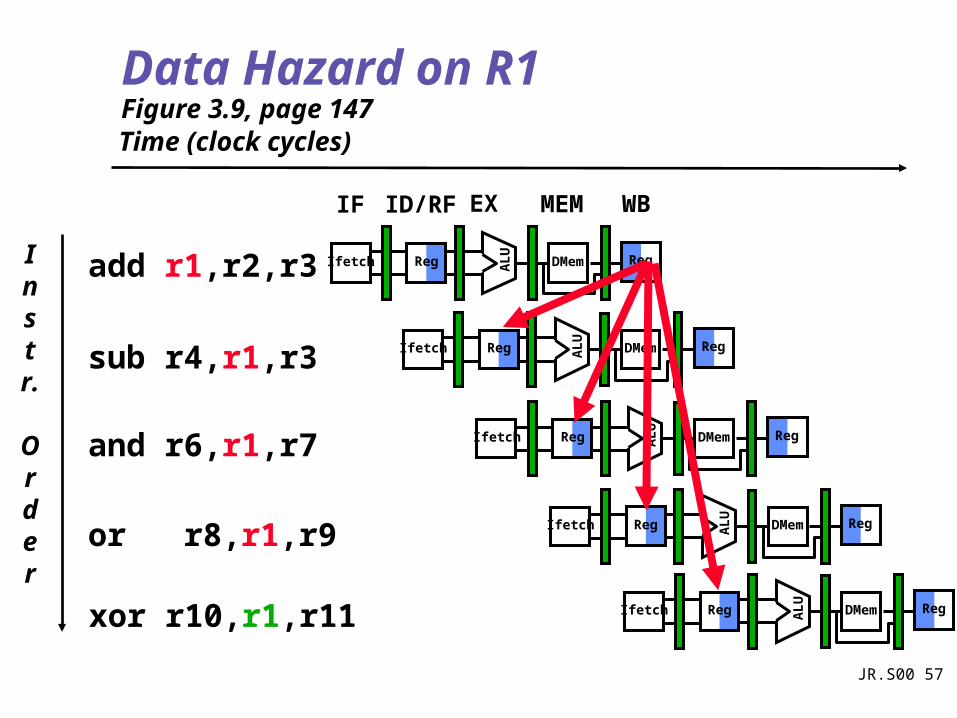
add r1,r2,r3
sub r4,r1,r3
and r6,r1,r7
or r8,r1,r9
xor r10,r1,r11
Reg
ALU
DMemIfetch Reg
Reg
ALU
DMemIfetch Reg
Reg
ALU
DMemIfetch Reg
Reg
ALU
DMemIfetch Reg
Reg
ALU
DMemIfetch Reg
Data Hazard on R1Figure 3.9, page 147
Time (clock cycles)
IF ID/RF EX MEM WB
JR.S00 58
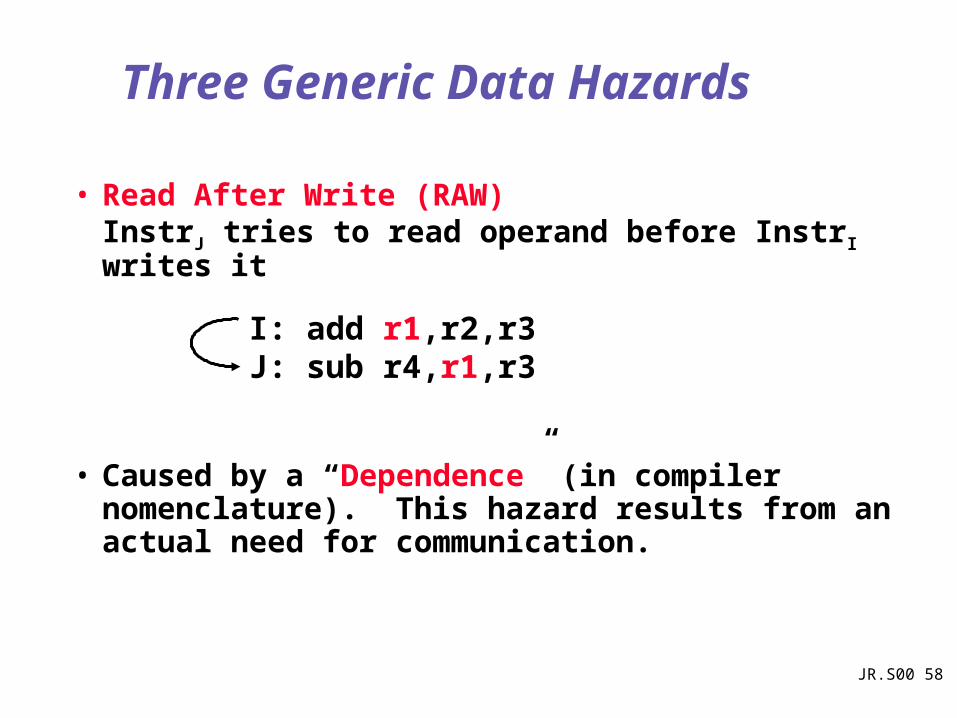
• Read After Write (RAW) InstrJ tries to read operand before InstrI writes it
• Caused by a “Dependence” (in compiler nomenclature). This hazard results from an actual need for communication.
Three Generic Data Hazards
I: add r1,r2,r3J: sub r4,r1,r3
JR.S00 59
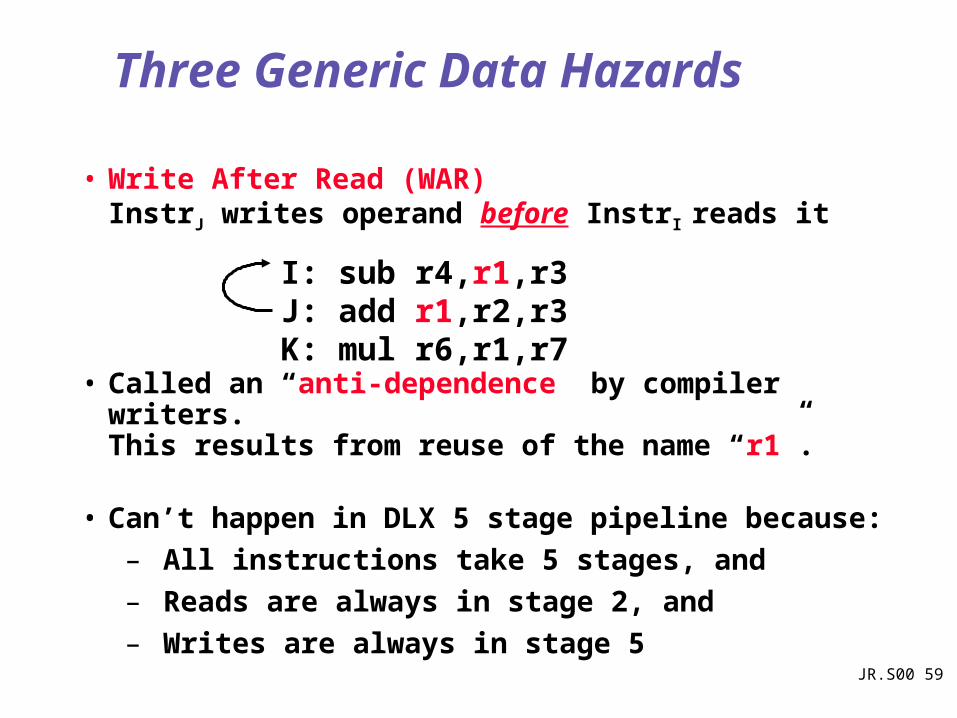
• Write After Read (WAR) InstrJ writes operand before InstrI reads it
• Called an “anti-dependence” by compiler writers.This results from reuse of the name “r1”.
• Can’t happen in DLX 5 stage pipeline because:
– All instructions take 5 stages, and
– Reads are always in stage 2, and
– Writes are always in stage 5
I: sub r4,r1,r3 J: add r1,r2,r3K: mul r6,r1,r7
Three Generic Data Hazards

JR.S00 60
Three Generic Data Hazards• Write After Write (WAW)
InstrJ writes operand before InstrI writes it.
• Called an “output dependence” by compiler writersThis also results from the reuse of name “r1”.
• Can’t happen in DLX 5 stage pipeline because:
– All instructions take 5 stages, and
– Writes are always in stage 5
• Will see WAR and WAW in later more complicated pipes
I: sub r1,r4,r3 J: add r1,r2,r3K: mul r6,r1,r7
JR.S00 61
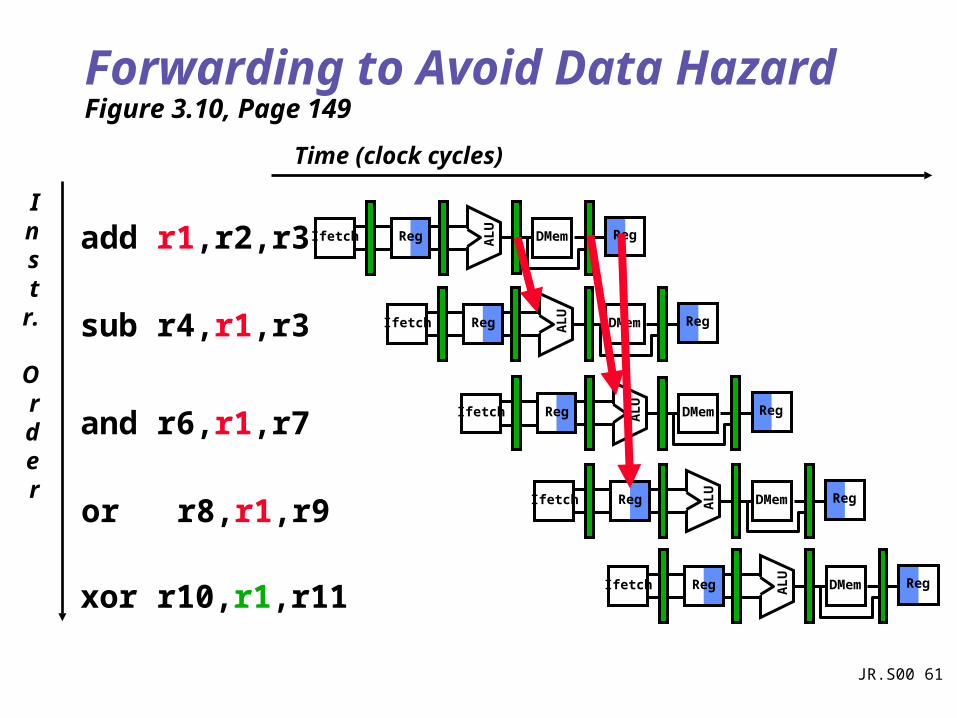
Time (clock cycles)
Forwarding to Avoid Data HazardFigure 3.10, Page 149
Inst
r.
Order
add r1,r2,r3
sub r4,r1,r3
and r6,r1,r7
or r8,r1,r9
xor r10,r1,r11
Reg
ALU
DMemIfetch Reg
Reg
ALU
DMemIfetch Reg
Reg
ALU
DMemIfetch Reg
Reg
ALU
DMemIfetch Reg
Reg
ALU
DMemIfetch Reg
JR.S00 62
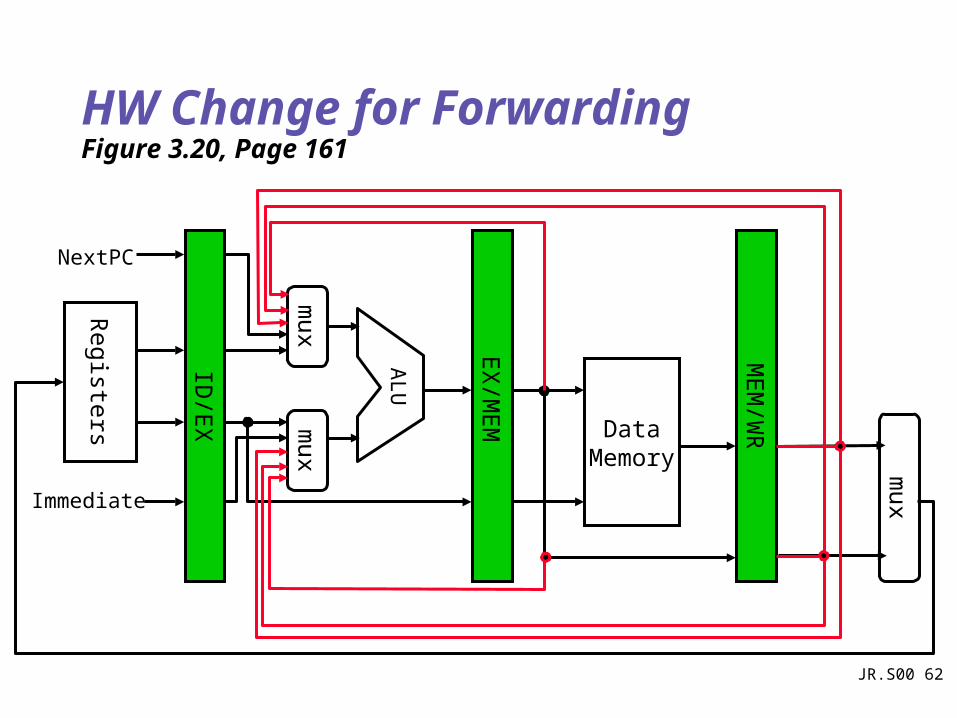
HW Change for ForwardingFigure 3.20, Page 161
MEM
/WR
ID/E
X
EX
/MEM
DataMemory
ALU
mux
mux
Registe
rs
NextPC
Immediate
mux
JR.S00 63
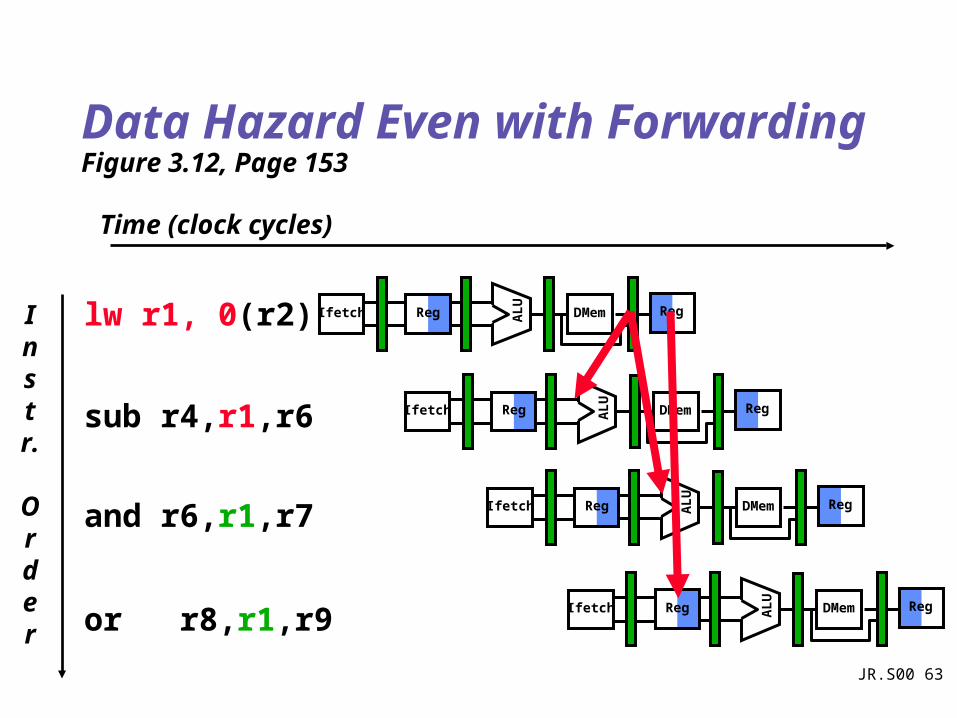
Time (clock cycles)
Instr.
Order
lw r1, 0(r2)
sub r4,r1,r6
and r6,r1,r7
or r8,r1,r9
Data Hazard Even with ForwardingFigure 3.12, Page 153
Reg
ALU
DMemIfetch Reg
Reg
ALU
DMemIfetch Reg
Reg ALU
DMemIfetch Reg
Reg
ALU
DMemIfetch Reg
JR.S00 64
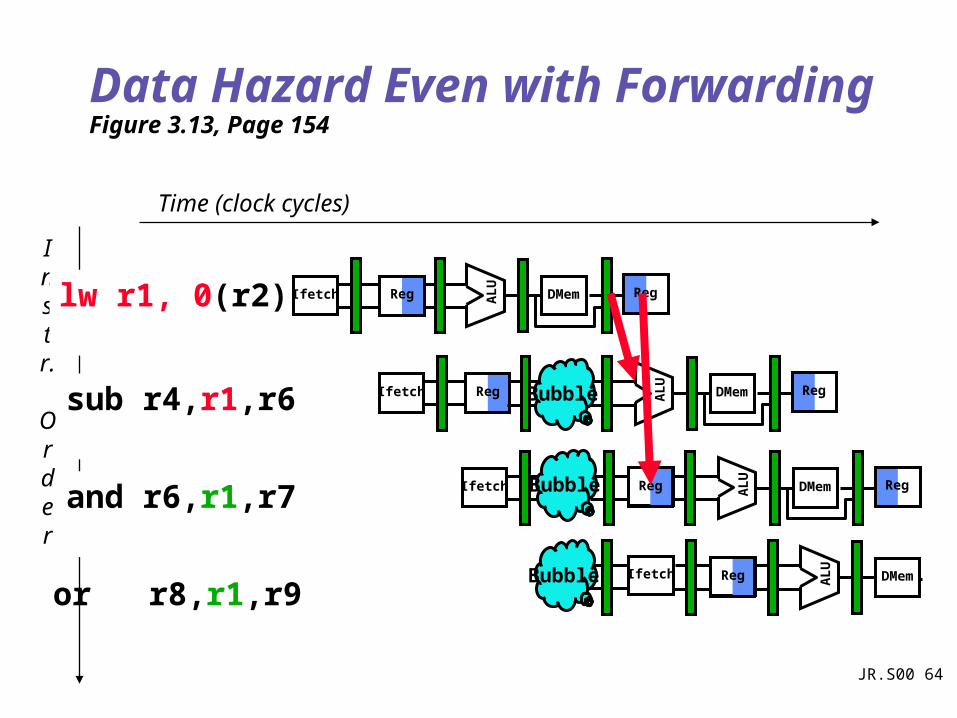
Data Hazard Even with ForwardingFigure 3.13, Page 154
Time (clock cycles)
or r8,r1,r9
Instr.
Order
lw r1, 0(r2)
sub r4,r1,r6
and r6,r1,r7
Reg
ALU
DMemIfetch Reg
RegIfetch
ALU
DMem RegBubble
Ifetch
ALU
DMem RegBubble Reg
Ifetch
ALU
DMemBubble Reg
JR.S00 65
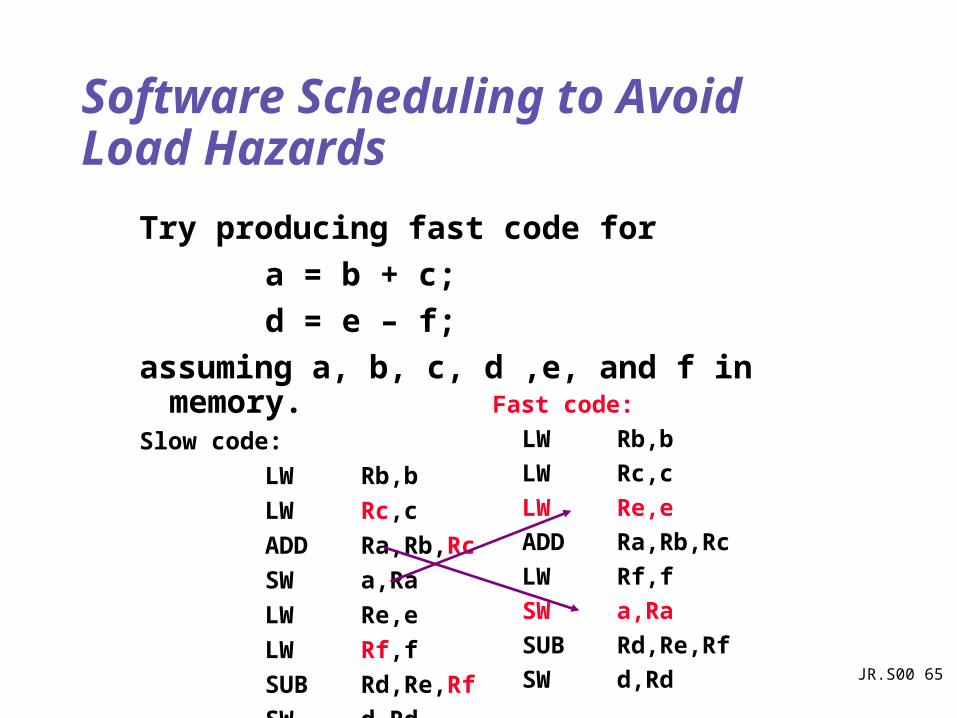
Try producing fast code for
a = b + c;
d = e – f;
assuming a, b, c, d ,e, and f in memory. Slow code:
LW Rb,b
LW Rc,c
ADD Ra,Rb,Rc
SW a,Ra
LW Re,e
LW Rf,f
SUB Rd,Re,Rf
SW d,Rd
Software Scheduling to Avoid Load Hazards
Fast code:
LW Rb,b
LW Rc,c
LW Re,e
ADD Ra,Rb,Rc
LW Rf,f
SW a,Ra
SUB Rd,Re,Rf
SW d,Rd

JR.S00 66
Control Hazard on BranchesThree Stage Stall
10: beq r1,r3,36
14: and r2,r3,r5
18: or r6,r1,r7
22: add r8,r1,r9
36: xor r10,r1,r11
Reg ALU
DMemIfetch Reg
Reg
ALU
DMemIfetch Reg
Reg
ALU
DMemIfetch Reg
Reg
ALU
DMemIfetch Reg
Reg
ALU
DMemIfetch Reg
JR.S00 67
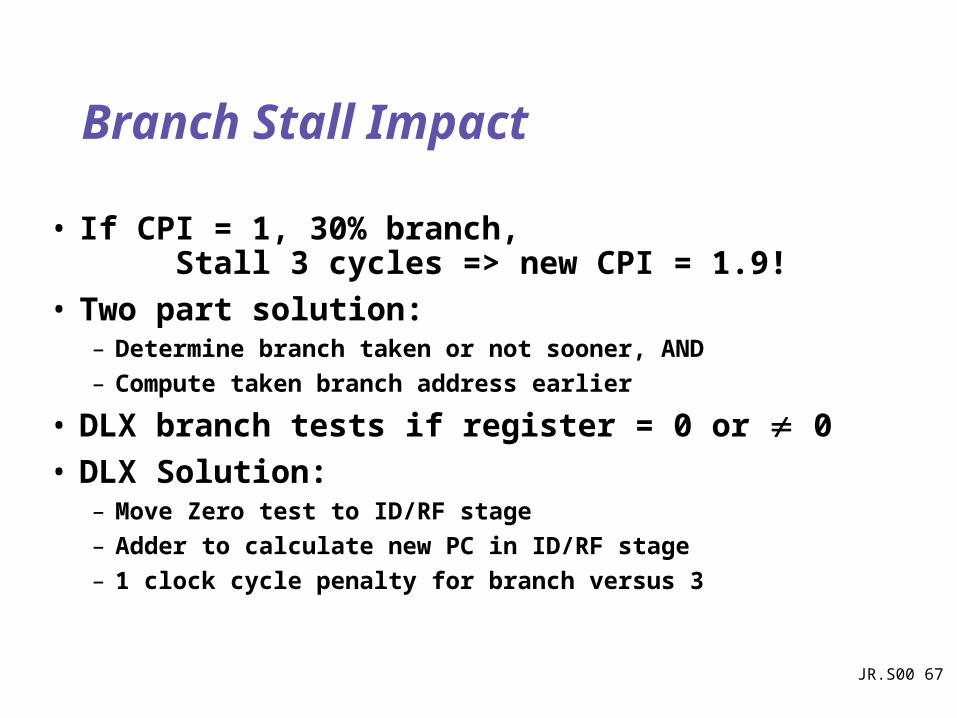
Branch Stall Impact
• If CPI = 1, 30% branch, Stall 3 cycles => new CPI = 1.9!
• Two part solution:– Determine branch taken or not sooner, AND
– Compute taken branch address earlier
• DLX branch tests if register = 0 or 0
• DLX Solution:– Move Zero test to ID/RF stage
– Adder to calculate new PC in ID/RF stage
– 1 clock cycle penalty for branch versus 3
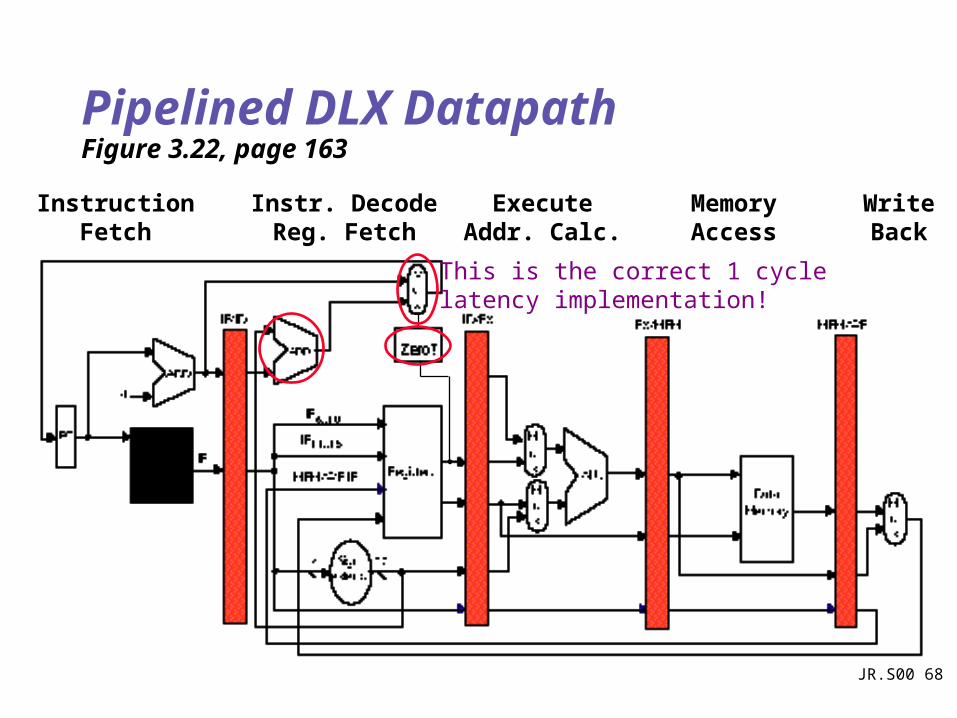
JR.S00 68
Pipelined DLX DatapathFigure 3.22, page 163
MemoryAccess
WriteBack
InstructionFetch
Instr. DecodeReg. Fetch
ExecuteAddr. Calc.
This is the correct 1 cyclelatency implementation!
JR.S00 69
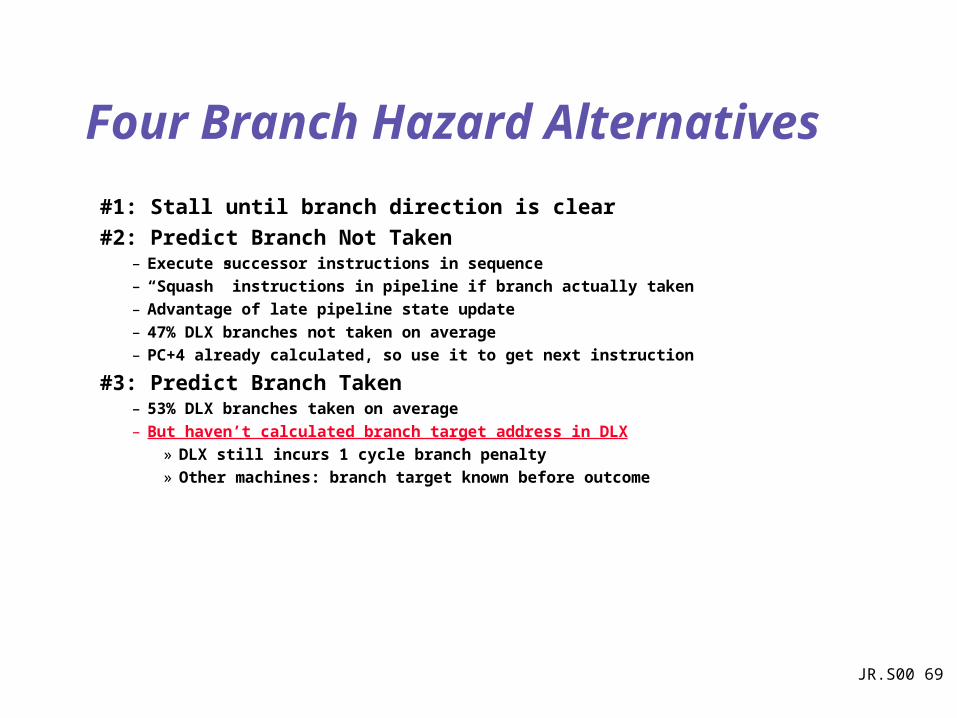
Four Branch Hazard Alternatives
#1: Stall until branch direction is clear
#2: Predict Branch Not Taken– Execute successor instructions in sequence
– “Squash” instructions in pipeline if branch actually taken
– Advantage of late pipeline state update
– 47% DLX branches not taken on average
– PC+4 already calculated, so use it to get next instruction
#3: Predict Branch Taken– 53% DLX branches taken on average
– But haven’t calculated branch target address in DLX
» DLX still incurs 1 cycle branch penalty
» Other machines: branch target known before outcome
JR.S00 70
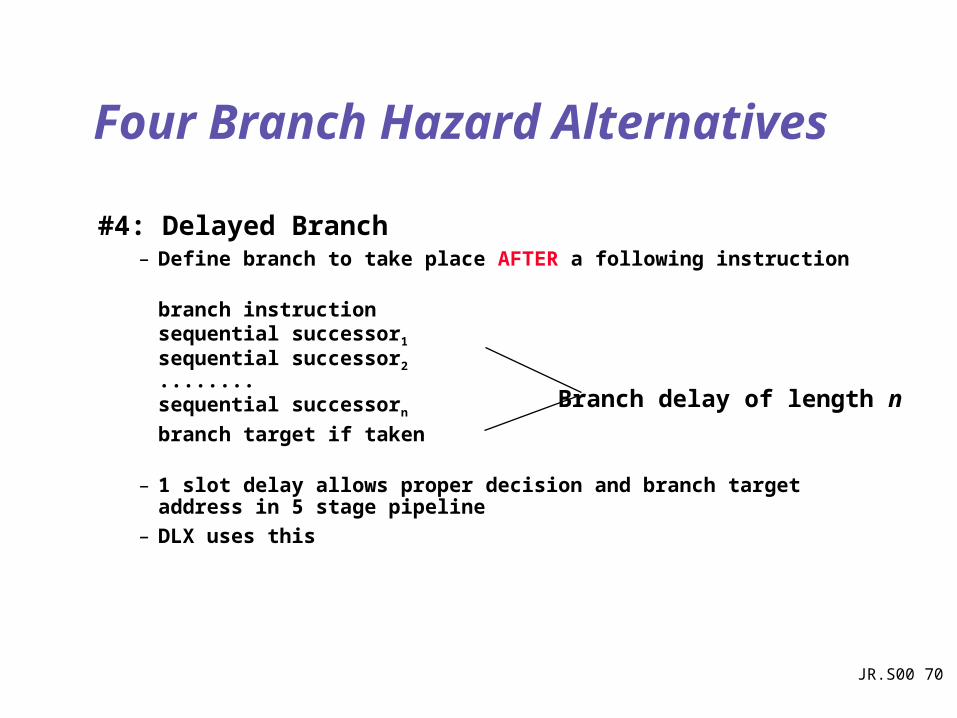
Four Branch Hazard Alternatives
#4: Delayed Branch– Define branch to take place AFTER a following instruction
branch instructionsequential successor1
sequential successor2
........sequential successorn
branch target if taken
– 1 slot delay allows proper decision and branch target address in 5 stage pipeline
– DLX uses this
Branch delay of length n
JR.S00 71
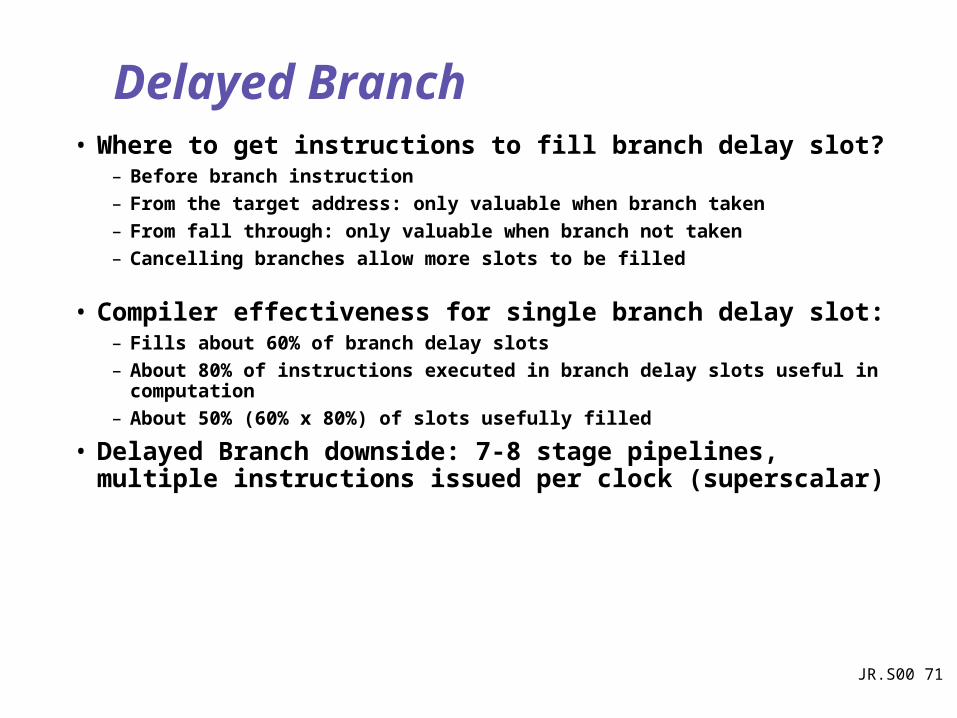
Delayed Branch• Where to get instructions to fill branch delay slot?
– Before branch instruction
– From the target address: only valuable when branch taken
– From fall through: only valuable when branch not taken
– Cancelling branches allow more slots to be filled
• Compiler effectiveness for single branch delay slot:– Fills about 60% of branch delay slots
– About 80% of instructions executed in branch delay slots useful in computation
– About 50% (60% x 80%) of slots usefully filled
• Delayed Branch downside: 7-8 stage pipelines, multiple instructions issued per clock (superscalar)
JR.S00 72
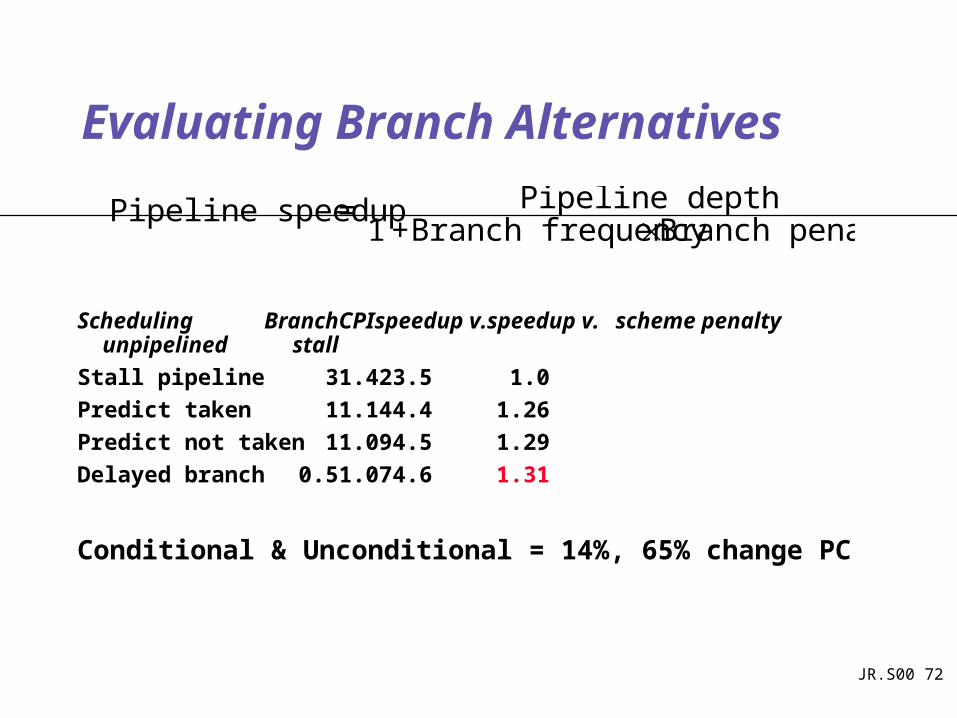
Evaluating Branch Alternatives
Scheduling Branch CPI speedup v. speedup v. scheme penalty unpipelined stall
Stall pipeline 3 1.42 3.5 1.0
Predict taken 1 1.14 4.4 1.26
Predict not taken 1 1.09 4.5 1.29
Delayed branch 0.5 1.07 4.6 1.31
Conditional & Unconditional = 14%, 65% change PC
Pipeline speedup = Pipeline depth1 +Branch frequencyBranch penalty
JR.S00 73
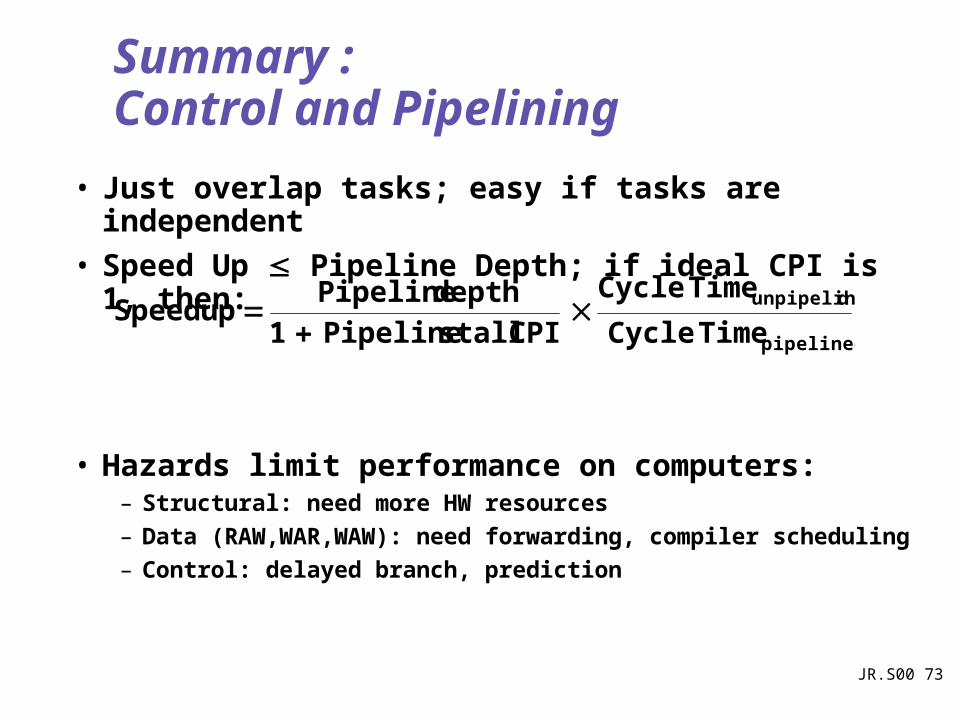
Summary : Control and Pipelining
• Just overlap tasks; easy if tasks are independent
• Speed Up Pipeline Depth; if ideal CPI is 1, then:
• Hazards limit performance on computers:– Structural: need more HW resources
– Data (RAW,WAR,WAW): need forwarding, compiler scheduling
– Control: delayed branch, prediction
pipelined
dunpipeline
TimeCycle
TimeCycle
CPI stall Pipeline 1depth Pipeline
Speedup


![Pipelineusers.utcluj.ro/~apateana/C_pipeline.pdf · [Prof. Jan M. Rabaey, Spring 2000, “Computer Architecture in Cory Hall”] ... -operanzii din memorie saaparanumai in instructiuni](https://img.pdfslide.net/doc/110x75/5c65ad5a09d3f29b6e8d1f04/apateanacpipelinepdf-prof-jan-m-rabaey-spring-2000-computer-architecture.jpg)


![[Jan M. Rabaey, Massoud Pedram] Low-Power-Design-M(Bookos.org)](https://img.pdfslide.net/doc/110x75/55cf9cda550346d033ab4ad0/jan-m-rabaey-massoud-pedram-low-power-design-mbookosorg.jpg)