Embed Size (px)
Citation preview

7/18/2012
1
MeasuringMeasuring Success:
Steps for a Healthier, Wealthier, more Equitable Future
Jeffrey Tumlin
Presentation Outline• Paradise LOSt: Why focus on LOS makes
our cities poorer and more congested.
• Other approaches to LOS
• Case Study: Santa Monica
2

7/18/2012
2
Commonly Used Performance Measures
Source: Reid Ewing 3
Old Speed Paradigm -> Roadway LOS
Source: Reid Ewing 4

7/18/2012
3
5Level of Service A
6Level of Service F Source: Neighborhoods.org

7/18/2012
4
7Level of Service F Source: Downtown San Jose Blog
What’s important depends upon perspective
Traffic engineer: F ATraffic engineer:
8
F AA FEconomist:

7/18/2012
5
What’s wrong with LOS?
• To be “conservative,” transportation analyses typically use ITE trip generation rates, data from isolated, single-use projects with no access
t bexcept by car.
• TODs typically generate ~50% fewer vehicle trips than predicted by ITE. (“Effects of TOD on Parking, Housing and Travel,” TCRP 128, 2008)
• Guidelines focus on localized traffic impacts and ignores regional impacts.
9
LOS Increases Congestion
• To mitigate a negative transportation impact:– Reduce density– Widen roadwaysWiden roadways– Transportation Demand
Management– Move the project to a more
isolated location with less existing traffic congestion
• Result: Less walking, biking and transit. Mitigation becomes a self-gfulfilling prophesy
10

7/18/2012
6
Induced and Latent Demand
Congestion
WidenRoadway
More PeopleDrive
11Faster Driving
What Get Measured Get Done

7/18/2012
7
How do we use Performance Measures?
• Improving efficiency of system operations
• Managing a given road or corridor
Prioritizing funding• Prioritizing funding
• Measuring impact of new development
• Imposing development fees
• Reporting to Congestion Management Agency
• Reporting on achievement of various goals
13
What is transportation for?
• Transportation is not an end in itself
• It is merely a means by which we supportwhich we support individual and collective goals and objectives
14

7/18/2012
8
How Transportation Meets Goals
• Accessibility
– Can I get the things and services I want?
• Mobility:
– Can I travel freely and easily to where I want to go?
– Bring people, goods and services closer together
– Mix uses
– Technology, delivery
g
– Reduce roadway congestion
– Increase transit frequency, reliability and speed
– Create bicycle lanes and complete sidewalks
15
Why not Consider…• Economic Development
– Job creation• Social Justice
Do benefits accrue equitably?
Measure what matters
Job creation– Real estate value increase– Retail sales
• Quality of Life– Access to jobs– Access to shopping– Residential property value impact
– Do benefits accrue equitably?– Are investments spread
equitably?
• Ecological Sustainability– VMT per capita (=CO2, NOx,
runoff, etc.)– Land use/transportation
connectionconnection
16

7/18/2012
9
Some performance measures• Substitute person delay for vehicle delay• Substitute Quality of Service for Level of Service • All modes
17
Some performance measures
• Transit: Frequency, span of service, reliability, loading, speedAutomobile: Average corridor travel• Automobile: Average corridor travel time
• Bicycle: Bicycle Compatibility index• Pedestrian: Perceived safety; Pedestrian environmental quality measures; Protected crossing f C l i i d lfrequency; Cumulative crossing delay
18

7/18/2012
10
Pedestrian LOS
Degree of comfort that pedestrians feel along the roadway
•How SAFE is the pedestrian from vehicular traffic?
•How much TRAFFIC is there?
•How FAST is the traffic moving?
• Is there SEPARATION?•Are there
OBSTRUCTIONS?OBSTRUCTIONS?
19
Pedestrian LOS
Sprinkle Consulting/FDOT ModelPed LOS = ‐1.2021 ln (Wol + Wl + fp x %OSP + fb x Wb + fsw x Ws) + 0.253 ln (Vol15/L) + 0.0005 SPD
2 + 5.3876
Sprinkle Consulting/FDOT ModelPed LOS = ‐1.2021 ln (Wol + Wl + fp x %OSP + fb x Wb + fsw x Ws) + 0.253 ln (Vol15/L) + 0.0005 SPD
2 + 5.38761.2021 ln (Wol + Wl + fp x %OSP + fb x Wb + fsw x Ws) + 0.253 ln (Vol15/L) + 0.0005 SPD + 5.3876whereWol = Width of outside lane (feet)Wl = Width of shoulder or bike lane (feet)fp = On‐street parking effect coefficient (=0.20)%OSP = Percent of segment with on‐street parkingfb = Buffer area barrier coefficient (=5.37 for trees spaced 20 feet on center)Wb = Buffer width (distance between edge of pavement and sidewalk, feet)fsw = Sidewalk presence coefficient = 6 – 0.3WsWs = Width of sidewalk (feet)
1.2021 ln (Wol + Wl + fp x %OSP + fb x Wb + fsw x Ws) + 0.253 ln (Vol15/L) + 0.0005 SPD + 5.3876whereWol = Width of outside lane (feet)Wl = Width of shoulder or bike lane (feet)fp = On‐street parking effect coefficient (=0.20)%OSP = Percent of segment with on‐street parkingfb = Buffer area barrier coefficient (=5.37 for trees spaced 20 feet on center)Wb = Buffer width (distance between edge of pavement and sidewalk, feet)fsw = Sidewalk presence coefficient = 6 – 0.3WsWs = Width of sidewalk (feet)Vol15 = average traffic during a fifteen (15) minute periodL = total number of (through) lanes (for road or street)SPD = Average running speed of motor vehicle traffic (mi/hr)
Vol15 = average traffic during a fifteen (15) minute periodL = total number of (through) lanes (for road or street)SPD = Average running speed of motor vehicle traffic (mi/hr)
20

7/18/2012
11
Make Walking a Pleasure
Case Study: Santa Monica
7/18/2012
12
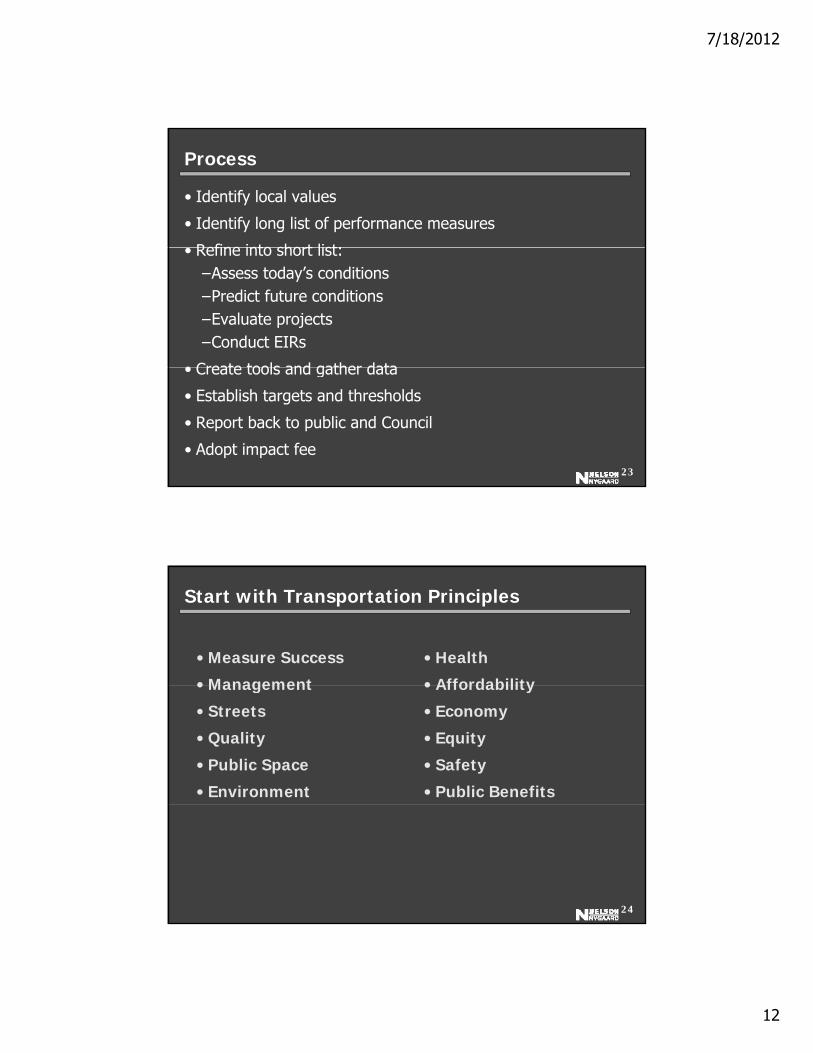
Process
• Identify local values
• Identify long list of performance measures
Refine into short list:• Refine into short list:–Assess today’s conditions–Predict future conditions–Evaluate projects–Conduct EIRs
• Create tools and gather data
23
• Create tools and gather data
• Establish targets and thresholds
• Report back to public and Council
• Adopt impact fee
Start with Transportation Principles
• Measure Success
• Management
• Health
• Affordability• Management
• Streets
• Quality
• Public Space
• Environment
• Affordability
• Economy
• Equity
• Safety
• Public Benefits
24

7/18/2012
13
Creating a Shortlist
• For each principle, a long list of potential measures – and tools for measuring
• Next step: Short list:Sh t t li t f th t t S t M i l– Shortest list of measures that captures Santa Monica values
– Minimize data collection costs– Maximize clarity
• Some measures, like per capita Vehicle Miles Traveled, capture many values: Greenhouse gases, congestion, air quality, etc.
25
The Long ListMeasure Cost/Time
ConsumptionImplementation EIR Project
ReviewCorrid
or Review
Report
CardTravel Model
MANAGEMENT
•Relative travel times by Medium Can be modeled; see WeHo traffic model. Can also be collected ymode
;through data collection. Transit travel times can be automated in GPS.
√ √ √ √ √
•Person capacity – walking, bike, transit, auto, parking, bike parking
Medium -Heavy
This is a GIS/Excel type function that can be included if there is survey data available. Can be modeled. This needs to be further defined.
√? √ √?
•Transit LOS: productivity, farebox return, delay, reliability
Medium -Heavy
This will take extensive model development if we want to get to this level in the demand model. Direct ridership modeling would be another option and would require less data/development time. Transit LOS could also be developed and monitored separate from the model in an Excel spreadsheet. BBB already does a basic collection of this info, and full transit LOS data may be available in upcoming GPS reporting from BBB Seattle uses transit LOS in an
√ √ √ √ √
26
upcoming GPS reporting from BBB. Seattle uses transit LOS in an annual GIS report card map, focusing on transit speed and frequency. SF uses transit LOS in their EIRs
•Neighborhood spill-over Medium Either traffic volumes or driver behavior (speed, etc)√ √
Congestion Light The sustainability report card currently measures intersection LOS. Congestion is also indirectly measured in the relative travel times by mode and the person capacity analysis above. (There is community resistance to using intersection LOS.) Adjust significance thresholds if used for EIRs.
√ √ √ √ √

7/18/2012
14
Vary targets by Context
27
Santa Monica: Application
• Main Street
FUNCTION CONTEXT ZONE Minimum Desirable Preferred MeasuredTransit Secondary N’hood Commercial ≥-1 ≥-0.5 ≥+1 -0.8
AutoSecondary N’hood Commercial <1.2 <0.8 >0.6 0.75
PedestrianPrimary N’hood Commercial B A A B
R lt OK t li htl d d t QOS t i t it d• Result: OK to slightly degrade auto QOS to improve transit and pedestrian QOS. Signal prioritization OK, but not dedicated transit lane.
• Goal: Bring all measures into balance
28

7/18/2012
15
Tools and Data
• GIS mapping
• Transportation Demand Management reporting datadata
• Big Blue Bus GPS data
• Public perception surveys
• Traffic counts
29
Results: Delay from Previous Tools
Increases in both directions on all corridors

7/18/2012
16
Decreases or no
Reduced delay from new approach
increase on 10 corridors in at least one direction during AM and/or PM peakpeak
4% decrease in per -1%
0%
1984 Plan LUCE
Achieves major outcome goals: Reduce VMT
capita Vehicle Miles Traveled for proposed LUCE
33% improvement in per capita VMT reduction compared to 1984 Plan 4%
-3%
-2%
1984 Plan.
“Per capita” includes population and employment
-5%
-4%
32

7/18/2012
17
900,000
950,000
1,000,000
AB 32 Target
Results: Achieves GHG Reduction Goals
650,000
700,000
750,000
800,000
850,000
Sustainable City Plan Target
500,000
550,000
600,000
Existing 1984 Plan (2030) Proposed LUCE (2030)
33
Best practice
• Focus on outcomes.
• Ensure your local values are reflected and quantified. Include the triple bottom line.
• Use available or easily collectable data.
• Focus on citywide or regional impacts: don’t make things a lot worse for everyone in order to make things a little better for a few.
• MMLOS can be bad for transit, biking and walking if misapplied.
• Focus on quality, not crowding.
• For congestion, focus on per capita Vehicle Miles Traveled.g , p p
34

7/18/2012
18
For More Information
Jeffrey Tumlin
Mobility Accessibility Sustainability
116 New Montgomery St, Ste 500San Francisco, CA 94103
Tel: 415-284-1544


![YEAR] SHORT TITLE 1 Fair Measures: A Behavioral Realist ...mrbworks/articles/manuscripts/Kang.pdfYEAR] SHORT TITLE 1 Fair Measures: A Behavioral Realist Revision of “ Affirmative](https://img.pdfslide.net/doc/110x75/5ad0eb7b7f8b9aca598e3550/year-short-title-1-fair-measures-a-behavioral-realist-mrbworksarticlesmanuscriptskangpdfyear.jpg)