Embed Size (px)
Citation preview

Cornell University Law SchoolScholarship@Cornell Law: A Digital Repository
Cornell Law Faculty Publications Faculty Scholarship
6-2011
Judge-Jury Difference in Punitive DamagesAwards: Who Listens to the Supreme Court?Theodore EisenbergCornell Law School, [email protected]
Michael HeiseCornell Law School, [email protected]
Follow this and additional works at: http://scholarship.law.cornell.edu/facpub
This Article is brought to you for free and open access by the Faculty Scholarship at Scholarship@Cornell Law: A Digital Repository. It has beenaccepted for inclusion in Cornell Law Faculty Publications by an authorized administrator of Scholarship@Cornell Law: A Digital Repository. Formore information, please contact [email protected].
Recommended CitationEisenberg, Theodore and Heise, Michael, "Judge-Jury Difference in Punitive Damages Awards: Who Listens to the Supreme Court?"(2011). Cornell Law Faculty Publications. Paper 199.http://scholarship.law.cornell.edu/facpub/199

Judge-Jury Difference in PunitiveDamages Awards: Who Listens to theSupreme Court?jels_1211 325..357
Theodore Eisenberg and Michael Heise*
We analyze thousands of trials from a substantial fraction of the nation’s most populouscounties as well as a smaller sample of less populous counties. Evidence from four major CivilJustice Survey data sets spanning more than a decade establishes that: (1) compensatoryawards are strongly associated with punitive awards and (2) the punitive-compensatoryrelation has not materially changed over time. But (3) 2005 data suggest, for the first time,systematic differences between judges and juries in the punitive-compensatory relation.Despite claims that the Supreme Court’s State Farm decision changed the punitive-compensatory relation, we present evidence that the 2005 shift is not attributable to the StateFarm case or to other possibly relevant likely factors such as the relative flow of personalinjury cases to judges and juries, inclusion of 110 small counties in the 2005 data, or changesin the 2005 data coding. The judge-jury difference more likely turns on unobserved factorsdriving the selection of cases for adjudication before judges and jurors.
I. Introduction
Punitive damages in general and juries’ role in particular persist as flashpoints in U.S. tortreform debates. Along with normative debates about whether punitive damages shouldexist, empirical debates about the pattern of punitive awards, as well as their relation to theunderlying compensatory award, persist. This article presents results that update andsupplement prior studies on the relation between compensatory and punitive damagesawards and provides new results with respect to how judges and juries award punitivedamages.
After decades of dispute, it is now generally understood that the bulk of punitivedamages awards have been reasonably sober, modest in size, and relatively stable over time,
*Address correspondence to Theodore Eisenberg, Cornell Law School, Myron Taylor Hall, Ithaca, NY 14853; email:[email protected]. Eisenberg is Henry Allen Mark Professor of Law and Adjunct Professor ofStatistical Sciences, Cornell University; Heise is Professor, Cornell Law School.
Valerie Hans and Dawn Chutkow provided valuable comments on earlier drafts of this article. Cornell Law Schoolreference librarians provided helpful research assistance. Earlier drafts of this article were presented at the EuropeanAssociation of Law and Economic meeting, Paris, 2010, and at the Randall Park Colloquium, University of KentuckyCollege of Law.
Journal of Empirical Legal StudiesVolume 8, Issue 2, 325–357, June 2011
325

though some groups continue to question that reality.1 For example, no credible debateexists about, in the mass of cases, the strong association linking punitive and compensatoryawards.2 The relation between punitive and compensatory awards has been strikinglyconsistent across many data sets.3 In Exxon Shipping Co. v. Baker, the Supreme Courtobserved that empirical research undercuts the most audible criticism of punitive damagesand that discretion to award punitive damages has not produced a mass of runaway awards.4
Although the Supreme Court now recognizes that much of the criticism of punitivedamages awards is misplaced, the Court nevertheless regards the punitive-compensatoryrelation as sufficiently important to expand the constitutional doctrine of substantive dueprocess to restrict punitive damages.5
Related debates about the proper role of jurors in the punitive damages contextsimilarly persist. Some observers suggest that greater reliance on judges and a correspond-ing reduced reliance on juries to award and set punitive damage levels will improve civil
1E.g., Swiss Re, Focus Report: The Globalisation of Collective Redress: Consequences for the Insurance Industry at 2(2009) (“Well publicised cases involving punitive damages have led to the commonly-held view that awards arebecoming increasingly extreme.”).
2See, e.g., Theodore Eisenberg & Martin T. Wells, The Significant Association Between Punitive and CompensatoryDamages in Blockbuster Cases: A Methodological Primer, 3 J. Empirical Legal Stud. 175, 177 (2006) [hereinafterEisenberg, Association] (“It is no longer the mass of punitive awards that is said to be so troublesome.”). For arecent claim that jury punitive damages behavior is unpredictable, see Joni Hersch & W. Kip Viscusi, PunitiveDamages by the Numbers: Exxon Shipping Co. v. Baker, 18 Sup. Ct. Econ. Rev. 259, 261, 279 (2010) [hereinafterHersch & Viscusi, By the Numbers]. However, this claim seems based on Exxon-funded experiments thatnever reconciled their findings with real-world punitive damages data. See Theodore Eisenberg, JeffreyRachlinski & Martin T. Wells, Reconciling Experimental Incoherence with Real-World Coherence in PunitiveDamages, 54 Stanford L. Rev. 1239 (2002). To our knowledge, no persuasive analysis of actual cases supportsthe absence of a relation between punitive and compensatory damages. See, e.g., Brief for Neil Vidmar et al. asAmici Curiae in Support of Respondent, Philip Morris USA v. Williams, 549 U.S. 346 (2007), 2006 WL 2689774[hereinafter Amicus Brief]. It has been erroneously claimed that no significant relation exists between punitiveand compensatory awards in very large cases. Joni Hersch & W. Kip Viscusi, Punitive Damages: How Judges andJuries Perform, 33 J. Legal Stud. 1 (2004) [hereinafter Hersch & Viscusi, Perform]. But see Eisenberg & Wells,supra. Others have incorrectly claimed no significant association between punitive and compensatory awards insexual harassment cases. Cass R. Sunstein & Judy M. Shih, Damages in Sexual Harassment Cases, in Directions inSexual Harassment Law (Catherine A. MacKinnon & Reva B. Siegel eds. 2004). But see Catherine M. Sharkey,Dissecting Damages: An Empirical Exploration of Sexual Harassment Awards, 3 J. Empirical Legal Stud. 1(2006).
3See Amicus Brief, supra note 2; David A. Hyman, Bernard Black, Kathryn Zeiler, Charles Silver & William M. Sage,Do Defendants Pay What Juries Award? Post-Verdict Haircuts in Texas Medical Malpractice Cases, 1988–2003, 4 J.Empirical Legal Stud. 3, 25 (2007) (tbl. 6 model 2); Jonathan M. Karpoff & John R. Lott, Jr., On the Determinantsand Importance of Punitive Damage Awards, 42 J.L. & Econ. 527, 543 (1999); Erik K. Moller, Nicholas M. Pace &Stephen J. Carroll, Punitive Damages in Financial Injury Jury Verdicts, 28 J. Legal Stud. 283, 300 n52 (1999); MargoSchlanger, Inmate Litigation, 116 Harv. L. Rev. 1555, 1605 & n136 (2003).
4Exxon Shipping Co. v. Baker, 554 U.S. 471, 497 (2008).
5E.g., Steven G. Calabresi, Substantive Due Process After Gonzales v. Carhart, 106 Mich. L. Rev. 1517, 1524–25(2008).
326 Eisenberg and Heise

justice.6 Others, however, either regard the reliance on the jury as a strength of the U.S.justice system or question calls for reducing jurors’ power absent evidence of judges’comparative superiority.7 Assumed judge-jury differences with respect to the punitive-compensatory relation have not found consistent empirical support. Nevertheless, evenwell-designed empirical studies analyzing identical data sometimes point in different direc-tions owing, in part, to debates about appropriate model specifications, assumptions, andstatistical techniques.8 The emergence of new data covering trials completed in 2005 offersthe opportunity for continued analysis of possible judge-jury differences in the punitive-compensatory relation. A recent analysis of the decision to award punitive damages (asdistinct from the punitive-compensatory relation) using the same data provides someevidence of judge-jury difference.9
This study extends prior work10 principally by including the newly available 2005 datain the analysis. These data, combined with prior data sets, permit unprecedented analysesof judge and jury punitive damages behavior over time. Our study explores two broadissues: (1) the relation between compensatory and punitive damages and (2) possible waysin which judges and juries award punitive damages differently. Some of the findings fromour current study comport with previous findings; other findings surprise and provide moretexture to analytical comparisons between judges and juries.
With respect to the relation between compensatory and punitive damages, our mainfindings comport with past findings—that variation in punitive damage awards is largely afunction of variation in the underlying compensatory award. The new data provide the firstsystematic evidence of judge-jury differences in the punitive-compensatory relation. Afteraccounting for the size of the compensatory award (itself correlated with the decision to
6Hersch & Viscusi, Perform, supra note 2, at 2 (arguing that juries are more likely to award punitive damages and theirawards are larger); David Schkade et al., Deliberating About Dollars: The Severity Shift, 100 Colum. L. Rev. 1139(2000); Reid Hastie & W. Kip Viscusi, What Juries Can’t Do Well: The Jury’s Performance as a Risk Manager, 40 Ariz.L. Rev. 901, 916 (1998); Paul Mogin, Why Judges, Not Juries, Should Set Punitive Damages, 65 U. Chi. L. Rev. 179(1998).
7E.g., Theodore Eisenberg, Neil LaFountain, Brian Ostrom, David Rottman & Martin T. Wells, Juries, Judges, andPunitive Damages: An Empirical Study, 87 Cornell L. Rev. 743 (2002) [hereinafter Eisenberg et al., PunitiveDamages] (finding no substantial evidence suggesting that jurors and judges differ in the rate of awarding punitivedamages or in the relation between punitive and compensatory awards); Richard Lempert, Juries, Hindsight, andPunitive Damages Awards: Failures of a Social Science Case for Change, 48 DePaul L. Rev. 867 (1999); Marc Galanter& David Luban, Poetic Justice: Punitive Damages and Legal Pluralism, Am. U. L. Rev. 1393, 1439 (1999); Michael L.Rustad, How the Common Good is Served by the Remedy of Punitive Damages, 64 Tenn. L. Rev. 793 (1997).
8See, e.g., Hersch & Viscusi, Perform, supra note 2, at 30 (identifying sources of disagreement with the Eisenberg et al.study).
9See Theodore Eisenberg, Michael Heise, Nicole L. Waters & Martin T. Wells, The Decision to Award PunitiveDamages: An Empirical Study, 2 J. Legal Analysis 577 (2010) [hereinafter Eisenberg et al., Decision].
10See, e.g., Theodore Eisenberg, Paula L. Hannaford-Agor, Michael Heise, Neil LaFountain, G. Thomas Munsterman,Brian Ostrom & Martin T. Wells, Juries, Judges, and Punitive Damages: Empirical Analyses Using the Civil JusticeSurvey of State Courts 1992, 1996, and 2001 Data, 3 J. Empirical Legal Stud. 263 (2006) [hereinafter Eisenberg et al.,Punitive].
Judge-Jury Difference in Punitive Damages Awards 327

award punitive damages11) and other critical background variables, one emerging result, inthe 2005 data but not in earlier data sets, is the higher amount of punitive damage awardsrelative to compensatory damages awards in cases tried to juries than in bench trials.
One source of newly found judge-jury differences in the punitive-compensatoryrelation is the possible asymmetrical influence on judges and juries of a major SupremeCourt punitive damages decision. The Court’s 2003 State Farm decision12 is important topunitive damages scholars and litigants seeking punitive damages because it demonstratesthe Court’s continuing sensitivity to proportionality between punitive and compensatoryawards.13 From a research design standpoint, this 2003 decision could only have influencedjudge and jury decisions in the 2005 data cohort, not in the data sets that predate 2003. Tworeasons suggest that judges may have been far more influenced than lay jurors by the StateFarm decision. One is that judges more than lay jurors are more likely to be aware ofrelevant Supreme Court precedent. Another reason is that judges—and not jurors—possessprofessional and reputational interests in avoiding having their damage awards adjusted onappeal. Interestingly, we find that the judge-jury differences we detect cut in a direction, ifany, opposite to that of a State-Farm-based explanation.
We instead attribute, largely by default, the 2005 evidence of judge-jury differences toselection effects. Systematic differences in the streams of cases that wind up in front ofjudges and juries assuredly explain some of the difference between judges and juries.Because the data do not permit judge-jury comparisons with identical case streams (or amore perfectly controlled research design), however, we cannot be certain how judges andjurors would have behaved had they decided identical cases. Our findings make clear thatassessments of judge-jury differences in the world of punitive damages persist as somethingof a puzzle, require continued careful analyses, and would benefit greatly from more dataand more detailed data. The findings reveal a more nuanced and complex picture of judgeand jury behavior than does conventional wisdom, which typically rests precariously onunstudied assumptions.
Section II describes our data, which include state civil trial court decisions involvingpunitive damages from four consistent data sets spanning 1991 though 2005. Section IIIpresents descriptive results with emphasis on the relation between compensatory andpunitive damages. The strong punitive-compensatory relation persists over time and appliesto juries and judges. Section IV reports regression results that largely reinforce Section III’score results. Section V considers a prime candidate for why differences between judges andjuries in the punitive-compensatory relation emerged after 2003: the State Farm decision. Italso discusses the influence of selection effects on our results, differential impact of legaldoctrine on judges and jurors, and considers other explanations. Section VI concludes.
11Id. at tbl.8; Eisenberg et al., Decision, supra note 9.
12State Farm Mut. Auto. Ins. Co. v. Campbell, 538 U.S. 408 (2003).
13Id. at 425.
328 Eisenberg and Heise

II. Data
The Civil Justice Survey of State Courts, a project of the National Center for State Courts(NCSC) and the Bureau of Justice Statistics (BJS), presents data gathered directly from statecourt clerks’ offices on tort, contract, and property cases resolved by trial in fiscal year1991–1992 and then in calendar years 1996, 2001, and 2005. The four separate data sets coverstate courts of general jurisdiction in a random sample of 46 of the 75 most populous countiesin the United States.14 The 75 counties sampled include approximately 33 percent of the1990 U.S. population; the actual 45 counties contributing data account for approximately 20percent of the population.15 Although the initial data set (1991–1992) includes only jurytrials, the three subsequent data sets, 1996, 2001, and 2005, include jury and bench trials,thereby allowing direct comparisons between judge and jury trials. The four data sets includeall completed trials in all four years in most of the counties. Sampling in the 1992 and 1996data sets is described in earlier publications.16 Sampling was used in three counties in the2001 data set, Cook County, Illinois, Philadelphia County, and Bergen County, New Jersey.
To maintain backward compatibility with the earlier Civil Justice Surveys, the 2005survey includes 46 of the 75 most populous counties. The 2005 data set expands the priordata set, however, by adding data from 110 counties selected to represent the 3,066 smallercounties not included in the country’s 75 largest counties.17 The 2005 data include 8,872trials of an estimated total of 27,128 in state courts in the United States in 2005, or 32.7percent.18 Based on the sample design, the trials from the 46 counties represent 10,813general bench and civil trials disposed of in the nation’s 75 most populous counties.19 Trialsfrom the 110 smaller counties represent 16,315 general civil and bench trials from outsidethe nation’s 75 most populous counties. Similar to the prior data sets, the 2005 data include
14The 2005 data include 156 counties. The 2001 data included 46 counties; the 1991–1992 and 1996 data included 45.One county included in the 1991–1992 and 1996 study, Norfolk, MA, fell out of the nation’s 75 most populous in the2000 Census and was replaced by Mecklenburg County, NC, and El Paso County, TX. Two Maryland counties declinedto participate in the 1991–1992 study, and were replaced with Fairfax County for all three iterations of the Civil JusticeSurvey.
15For a summary of the data and methodology, see Bureau of Justice Statistics Bulletin: Civil Justice Survey of StateCourts, 2005: Civil Bench and Jury Trials in State Courts, 2005 (Oct. 2008) [hereinafter BJS, 2005]; Bureau of JusticeStatistics Bulletin: Civil Justice Survey of State Courts, 2001: Civil Trial Cases and Verdicts in Large Counties, 2001(Apr. 2004); Bureau of Justice Statistics Bulletin: Civil Justice Survey of State Courts, 1996: Civil Trial Cases andVerdicts in Large Counties (1996); Bureau of Justice Statistics Bulletin: Civil Justice Survey of State Courts, 1992: TortCases in Large Counties 6 (1995). See also Eisenberg et al., Punitive, supra note 7 (describing 2001 data); Hersch &Viscusi, Perform, supra note 2, at 10–13 (2004) (describing 1996 data); Michael Heise, Justice Delayed?: An EmpiricalAnalysis of Civil Case Disposition Time, 50 Case W. Res. Univ. L. Rev. 813, 822–27 (2000) (describing 1992 data).
16See BJS sources cited in note 15 supra.
17BJS, 2005, supra note 15; Codebook, Inter-University Consortium for Political and Social Research, Civil JusticeSurvey of State Courts, 2005 [United States], Study No. 2386.
18See Eisenberg et al., Decision, supra note 9.
19Id.
Judge-Jury Difference in Punitive Damages Awards 329

all completed trials in the studied counties. Unlike the earlier data sets, the 2005 datainclude a variable that reports whether punitive damages had been sought in each case.These data are the most representative sample of state court trials in the United States. Withdirect access to state court clerks’ offices, as well as approximately 100 trained codersrecording data, the information gathered does not rely on litigants or third parties toreport. Self-reports, common in many commercial verdict reporters, typically overstateplaintiff win rates and award levels.20
III. Civil Trials and Punitive Damages
Civil complaints that ripen into trials on the merits remain rare events.21 Within the smallsubset of cases that reach a final verdict at trial, those that involve punitive damages are evenrarer. Table 1, which presents descriptive information based on the 16,412 cases in our dataset where the plaintiff prevailed (Panel A), shows that punitive damages were awarded inless than 5 percent of the cases (N = 732). In prior research we noted that judges and juriesawarded punitive damages at “roughly similar rates” and that jury trials numerically domi-nated punitive damages cases.22 The addition of the 2005 data does not materially dislodgeour prior observations. As Panel A illustrates, judges and juries award punitive damages inapproximately 4.8 percent and 3.4 percent of the cases, respectively. Moreover, applyingany realistic rate of filed cases reaching trial, less than 1 percent of civil lawsuits filedresulted in the awarding of punitive damages to prevailing plaintiffs. As a consequence,studies of punitive damages cases—such as ours—are necessarily studies of rare events.
The total sample of punitive damages cases (Table 1, Panel A) reveals interestingjudge-jury differences that the addition of the 2005 data set enhanced. For example,between 1992 and 2001, the difference in the rate at which juries and judges awardedpunitive damages was 0.92 percent.23 For the 2005 sample (Panel B), however, the judge-jury difference increased to 1.67 percent. This substantial increase in the difference in therate at which juries and judges award punitive damages from 1992 to 2005 hints at a possiblyimportant trend that supports seeking possible causes of increased judge-jury differences.
20Theodore Eisenberg et al., The Predictability of Punitive Damages, 26 J. Legal Studies 623, 641 n53 (1997)[hereinafter Eisenberg et al., Predictability] (finding bias in commercial verdict reporter samples); Deborah JonesMerritt & Kathryn A. Barry, Is the Tort System in Crisis? New Empirical Evidence, 60 Ohio St. L.J. 315, 324–26 (1999)(same); Moller et al., supra note 3, at 335 (reporting reasonable levels of confidence in the jury verdict reporters butacknowledging some potential bias). See also Paula L. Hannaford-Agor & Thomas Cohen, Treading on UncertainGround: The Reliability of Jury Verdict Reporter Statutes (unpublished paper) (finding that on average jury verdictreporter data sets contained half the number of jury trials as were included in the 2001 Civil Justice Survey, trialoutcomes were skewed toward higher plaintiff win rates, and higher mean and median compensatory and punitiveawards, but no difference in the rate of punitive awards).
21See Marc Galanter, The Vanishing Trial: An Examination of Trials and Related Matters in Federal and State Courts,1 J. Empirical Legal Stud. 459, 509 tbl.5 (2004) (analyzing state courts of general jurisdiction for 10 states from 1992to 2002).
22Eisenberg et al., Punitive, supra note 10, at 268.
23Computed from id. at 269, tbl.1.
330 Eisenberg and Heise

Tab
le1:
Ch
arac
teri
stic
sof
Dam
ages
Aw
ards
A(1
991–
92,
1996
,20
01,
2005
Dat
a)B
(200
5D
ata
Onl
y)
Jury
Ben
chC
ombi
ned
Jury
Ben
chC
ombi
ned
Num
ber
oftr
ials
w/
plai
nt.
requ
este
dPD
——
—32
814
647
4Pe
rcen
tof
tria
lsw
/pl
ain
t.re
ques
ted
PD—
——
10.8
09.
6210
.41
Num
ber
oftr
ials
w/
PD59
014
273
214
145
186
Perc
ent
oftr
ials
w/
PD4.
813.
424.
464.
642.
974.
03Pe
rcen
tof
tria
lsw
/PD
(wh
enre
ques
ted)
——
—42
.99
30.8
239
.24
PD
Cha
ract
eris
tics
Mea
n($
2004
)2,
906,
238
353,
422
2,41
1,02
02,
867,
701
242,
838
2,23
2,65
3M
edia
n($
2004
)75
,000
40,6
2555
,900
142,
183
36,2
8596
,723
SD2.
11·(
107 )
2,29
6,45
51.
90·(
107 )
1.08
·(10
7 )64
3,19
19,
436,
638
Mea
nlo
g10(
PD)
4.92
4.54
4.84
5.18
4.60
5.04
CD
Cha
ract
eris
tics
inP
DC
ases
(if
CD
>0)
Mea
n($
2004
)1,
841,
038
949,
245
1,66
8,19
12,
555,
649
1,36
9,37
82,
275,
742
Med
ian
($20
04)
117,
456
61,7
3810
2,01
312
6,00
353
,692
115,
246
SD8,
499,
713
5,45
8,77
08,
005,
561
9,15
3,45
77,
763,
221
8,83
8,54
2M
ean
log1
0(C
D)
5.10
4.79
5.04
5.19
4.78
5.09
Rat
ioof
PD
:CD
(if
CD
>0)
Mea
n3.
971.
383.
472.
921.
312.
54SD
26.9
33.
5324
.25
4.77
1.39
4.28
Med
ian
0.62
0.65
0.62
1.00
0.94
1.00
Per
cent
ofP
DA
war
dsin
the
Ran
ge$1
to9,
999
21.1
925
.35
21.9
914
.89
24.4
417
.2$1
0,00
0to
99,9
9934
.24
45.0
736
.34
32.6
248
.89
36.5
6$1
00,0
00to
299,
999
16.4
419
.01
16.9
416
.31
11.1
115
.05
$300
,000
to99
9,99
912
.37
7.04
11.3
410
.64
11.1
110
.75
$1,0
00,0
00or
mor
e15
.76
3.52
13.3
925
.53
4.44
20.4
3
No
te:
PD=
pun
itiv
eda
mag
es;C
D=
com
pen
sato
ryda
mag
es.P
anel
A(a
llca
ses
inB
JSda
ta)
N=
732,
ofw
hic
h71
2h
ada
non
zero
com
pen
sato
ryaw
ard.
Pan
elB
(BJS
2005
case
s)N
=18
6,of
wh
ich
178
had
an
onze
roco
mpe
nsa
tory
awar
d.A
mou
nts
are
inin
flat
ion
-adj
uste
d20
04do
llars
.So
urc
e:C
ivil
Just
ice
Surv
eyof
Stat
eC
ourt
s19
92–2
005.
Judge-Jury Difference in Punitive Damages Awards 331

Preliminarily, note that the rate of punitive damage awards reported in Table 1, PanelA’s fourth numerical row for combined judge and jury trials (4.46 percent) does not accountfor whether punitive damages were sought by the plaintiff. The 2005 data (Panel B) for thefirst time contain information on whether punitive damages were sought by the plaintiff.Surprisingly, plaintiffs only sought punitive damages in approximately 10 percent of the trialsthey won.24 Among those cases where plaintiffs requested punitive damages, the overall rateat which punitive damages were awarded (the effective punitive damages award rate) in 2005exceeds 39 percent.25 Thus, a comparison of the 39.2 percent effective punitive damage ratefor 2005 (Panel B) and the 4.46 percent punitive damage rate for the entire data set (PanelA) illustrates the importance of knowing whether punitive damages were requested. Themagnitude of the difference between the 2005 effective punitive damages award rate and therate for the entire data set—almost a factor of 10—underscores that interpretation warrantscareful attention. It also suggests that changes in judge-jury treatment of punitive damagescases in the 2005 data may be attributable to enhanced coding of punitive damagesinformation. We explore coding differences as a possible explanation in Section V.
A. General Punitive Damages Award Patterns
Punitive damages are most likely to be authorized in tort cases as punitive damages aregenerally not available for pure contract claims. Since tort trials are overwhelmingly jurytrials,26 it comes as no surprise that jury trials continued to dominate (80.6 percent: 590cases of 732 total cases, per Table 1, Panel A, third numerical row) cases in which punitivedamages were awarded. Even viewing all case categories in the aggregate, jury trials’dominance in the subset of punitive damages cases largely reflects litigants’ overall prefer-ence for jury trials in the case categories studied. Of the 16,412 cases where the plaintiffprevailed, 74.7 percent involved jury trials.27
Table 1 also makes clear that, consistent with conventional wisdom, jury trialsinvolved higher compensatory and punitive damage awards than judge trials.28 Nonrandomcase routing ensured, however, that juries and judges decided different streams of cases.For example, as Table 2 illustrates, juries saw a higher proportion of torts than contract
24Eisenberg et al., Decision, supra note 9. Also surprising is that in 25 of the 186 punitive damages cases in 2005 (13.4percent) punitive damages were not initially requested. These may be cases in which statutory doubling or treblingof damages is mandated, as in some consumer actions. Alternatively, evidence of punitive damages being requestedmay not have been detected in some cases in which they were requested.
25See id.
26Bureau of Justice Statistics, Civil Justice Survey of State Courts: Tort Bench and Jury Trials in State Courts, 2005, at2 (Nov. 2009) (90.0 percent of tort trials in the 2005 BJS data were jury trials).
27A data set limitation also helps accentuate the influence of jury trials. Although the 1996, 2001, and 2005 data setsinclude judge and jury trials, the initial data set (1991–1992) contains only jury trials.
28As expected, compensatory damages were awarded in almost all cases in which the plaintiff prevailed and receivedpunitive damages. In our data set of 732 cases in which the plaintiff prevailed and received punitive damages, thereare 20 instances where the compensatory award was zero.
332 Eisenberg and Heise

Table 2: Summary of Jury and Bench Trial Characteristics in Punitive Damage Cases
Jury Bench Percent of Total Cases
Case CategoryTorts 296 56 48.3Contract 285 84 50.6Property 7 1 1.1Selected Case TypesMotor vehicle accident 74 5 10.8Premises liability 19 8 3.7Product liability 7 0 1.0Intentional tort 92 30 16.7Medical and professional malpractice 31 3 4.6Fraud 79 37 15.9Employment discrimination or dispute 58 6 8.7Rental/lease agreement 14 2 2.2Selected Case CharacteristicsBodily injury (motor vehicle) 73 5 10.7Bodily injury (non-motor-vehicle) 142 30 26.3No bodily injury 375 107 65.9StatesAlabama 4 0 0.6Arizona 30 5 4.8California 155 54 28.6Connecticut 4 4 1.1Florida 25 1 3.6Georgia 28 0 3.8Hawaii 5 1 0.8Illinois 22 2 3.3Indiana 3 1 0.6Kentucky 24 3 3.7Massachusetts 10 1 1.5Michigan 5 0 0.7Minnesota 8 3 1.5Missouri 16 9 3.4North Carolina 3 1 0.6New Jersey 20 7 3.7New Mexico 4 1 0.7New York 11 1 1.6Ohio 42 7 6.7Pennsylvania 20 4 3.3Texas 109 27 18.6Virginia 28 5 4.5Washington 4 1 0.7Wisconsin 6 4 1.4N 590 142
Note: Total cases N = 732.Source: Civil Justice Survey of State Courts 1992–2005.
Judge-Jury Difference in Punitive Damages Awards 333

cases while the opposite was true for judges. Such systematic differences in the streams ofcases brought to juries and judges likely contribute to variations in how juries and judgesapproach punitive damages.
Much of the furor over punitive damages involves cases with the largest awards (theso-called blockbuster awards29). As defined by Professors Hersch and Viscusi, “blockbuster”punitive damages awards are at least $100 million. As they correctly note, juries tended todominate these large punitive damages cases.30 Table 1 illustrates, however, that “block-buster” punitive damage awards are rare and occupy the high end of the punitive damagecontinuum. Fewer than 14 percent of the punitive damages cases involved awards thatexceeded $1 million. Most punitive damages awards (86.6 percent) involved less than $1million and more than one-half (58.3 percent) were less than $100,000. It is clear, however,that judge trials are relatively more common for the smaller punitive damages cases andjury trials more common for the larger punitive damages cases.
The different streams of cases that flow to juries and judges help explain differencesin various case characteristics in bench and jury trials. As noted, juries saw a disproportion-ate number of torts cases and judges saw a higher number of contract cases than chancewould suggest. Similar variation is present in the distribution of more specific case types.For example, more than one-half (52.1 percent) of the punitive damages cases involved oneof four case types (motor vehicle accident, intentional tort, fraud, and employment dis-putes). Of the most frequent case types, juries saw a disproportionate number of the motorvehicle accident cases. Moreover, the distribution of judge-jury punitive damages casesacross states varied tremendously as well. The distribution ranged from one state (Con-necticut) where judges and juries evenly split punitive damages cases, to another state,Georgia, where all 28 punitive damages cases were tried to juries.
Cases involving personal injury and motor vehicle accidents warrant special attention.Bodily injury occupies a privileged place in the popular lore of U.S. tort law.31 Motor vehiclecases constitute a sizable percentage of torts in general and our punitive damages data setin particular.32 As a result, we separate motor vehicle and non-motor-vehicle personal injurycases. Consistent with the overall distribution of jury and judge trials that resulted inpunitive damages awards,33 82.6 percent of the non-motor-vehicle-related bodily injurycases and 77.8 percent of the non-bodily-injury cases went to a jury. Somewhat at odds withthe overall case trial mode distribution, however, is that virtually all (93.6 percent) of themotor vehicle bodily injury cases went to a jury.
29Hersch & Viscusi, Perform, supra note 2, at 4–10, tbl.1.
30However, there is little evidence that juries so do beyond the juries’ presumably large share of high-stakes tort trials.
31See, e.g., Dan B. Dobbs, The Law of Torts 9 (2000) (“Many people think of personal injury cases when they thinkof [U.S.] tort law.”).
32Of the 215 punitive damages cases that involved personal injury, 73 (34.0 percent) involved motor vehicle accidents.
33As Table 1 shows, of the 732 cases that involved punitive damages awards, 80.6 percent went to a jury and 19.4percent went to a judge.
334 Eisenberg and Heise

1. The Enduring Relation Between Compensatory and Punitive Damages
One key line of inquiry focuses on the relation between compensatory and punitivedamages. Figures 1, 2, and 3 permit visual inspection of both jury and bench trials over thefour data cohorts. The three scatterplots reveal a robust and consistent pattern over timeacross both trial modes in the ratio of logged punitive and compensatory damages.
Figures 1 and 2 present scatterplots of punitive (log) and compensatory damages(log) with individual bench and jury trials from all four data sets separately identified with“J” and “B,” respectively. We use logarithmic scales because, as is typical with awardamounts, linear scales fail to reveal the relation between the variables.34 Both figures alsoinclude best-fitting regression lines for jury and bench trials.35 Notably, the two regressionlines that describe the relation between compensatory and punitive damages awards are
34Equally important is that untransformed punitive and compensatory award damages are not normally distributed,do not possess a linear relation, and, therefore, violate standard regression assumptions. For a discussion of the needto transform award damages into logarithmic scales, and of the need for such transformations to satisfy basicregression assumptions, see generally Eisenberg & Wells, Association, supra note 2.
35Simple regression models of punitive damages (log) as the dependent variable and compensatory damages (log) asthe independent variable, run separately for judge and bench trials and using weighted data, yield the followingresults.
Figure 1: Bench and jury punitive and compensatory (logs) damages (all cases).
B
BB
B
B
BB
BB
B
B
B
B
BBB
B
B
B B
B
B
B
B
B
BB
BB
B
B
BB
B
B
B
B
B
B
B
B
B
B B
B
B
BBB
B
B
B BB B
B B
BB
BB
BBB
B
BB
B
B
BBB
B
BB
B
B
B
B B
B
B
B B
B
B
BBB
B
B
B
B
B
B
B
BBB
BB
B
B
B
B
B
B
B
BB
B
B
B
BBB B
BB
B
B
B
B
B
B
B
BB
BB
B
BB
BBB
B
B
JJ
J
J
J
J
J
J
J
J
J
J
J
J
J
J
J
J
J
J
J
J
J
JJ
J
J
J
J
JJ
J
JJJ
JJ
J
J
J
J
J
J
J
JJ
JJ
J
J
J
J
J
JJ
J
J
JJ
J
J
J
J
JJ
J
J
JJ
J
J J
J
J
J
J
J
J
J
J
J
J
J
J
J
J
J
JJ
J
J
J
J
J
J
J J
J
J
J
J
J
J
J
JJ
J
J
J
J
J
JJ
J
J
J
JJ
J
J
J
J
J
JJ
J
JJ
J
J
J
J
J
J
J
J J
JJ
J
J
J
J
JJ
J
J
J
JJ
J
J
J
J
J
J JJ
J
JJ
J
JJ
J
J
J
J
J
J J
JJ
J
JJ
JJ
J
J
J
J
J
J
J
J
J
J
JJ
J
J
J
J
J
JJ
J
JJ
J
J
J
JJ
J
J
J
J
J
J
J J
J
J
J
J
J
J
J
J
J JJJ
J
J
JJ
J
J
J
J
J
J
J
J
J
J
J
J
J J JJ
J
J
JJ
J
J
J
JJ
J
J
J
JJ
J
JJ
JJ
J
J
J
J
J
JJ
JJ J
J
J
J
J
J
J
J
J
J
J
J
J
J
J
J
J
J
J
J
J
JJ J
J
J
J
J
J
J
J J
J
J
J J
J J
J
J
J
JJ
J
JJ
J
J
J
J
JJ
JJ
J
J
JJJ J
J
J
JJ
J
J
J
J
J
J
J
J
J J
JJ
J
JJ
J
J
J
J
J
J
J
J
J
J
JJ
J
J
J
J
J
J
JJ
J
J
J
J
JJ
J
JJ
J
J
J
J
J
J
J
J
J
J
JJJ
J
JJ
J
J
J
J
J
J
J
J
J
J
J
J
J
J
J
J
JJ
J
J
J
J
JJ
J
J
J
J
JJ
J
J
J
J
J
J
J
J
J
JJ
JJ
J
J
J
J
J
J
JJ
J
J J
J
J
J J
J
J
J
J
J
J
JJ
JJ
J J
J
JJ
J
J
J
J
J
J
J
J
J
J J
JJ
J
J
J
JJ
J
J
J
J
J
J
J
JJ JJ
J
J
J
J
J
J
J
J
J J
J
J
J
JJ
J
J
J
JJ
J
J
J
J
JJJ
J
J
JJJ
J
J
J
J
J
J J
J
J
J
JJ
J JJ
J
J J
J
J
J
J
J
J
J
J
J
J
J
JJ
J
JJ
J
J
J
J
J
J
J
J
J
02
46
8P
unit
ive
(log
10)
0 2 4 6 8Compensatory (log10)
Jury Trials
Bench Trials
Note: The figure shows a scatterplot of punitive awards with the corresponding compensatory award for cases in thefour Civil Justice Survey of State Courts data sets. Jury trials are labeled “J” and bench (judge) trials are labeled “B.”Source: Civil Justice Survey of State Courts 1992–2005.
Judge-Jury Difference in Punitive Damages Awards 335

similar in terms of their respective slopes and intercepts. Also notable is that the overallpattern displayed in Figures 1 and 2 remains consistent with those in previous studies.36
The 2005 data set expands the three prior data sets by adding data from 110 countiesselected to represent the 3,066 smaller counties not included in the country’s 75 largestcounties.37 To preserve continuity with the three prior data sets, Figure 2 reproduces
Trial ModeCompensatory(Log)
Coefficient SE Intercept r2d N
Bench 0.932** 0.116 0.051 0.608 138Jury 0.857** 0.075 0.736 0.589 574
**p < 0.01.
36See, e.g., Eisenberg et al., Punitive, supra note 10 (1992–2001 data); Denise E. Antolini, Punitive Damages inRhetoric and Reality: An Integrated Empirical Analysis of Punitive Damages Judgments in Hawaii, 1985–2001, 20 J.L.& Pol. 143 (2004) (we analyzed the Hawaii data made available on Professor Antolini’s website); Eisenberg et al.,Predictability, supra note 20, at 638 fig.3 (1991–1992 data); Moller et al., supra note 3, at 300 n52.
37See supra note 14.
Figure 2: Bench and jury punitive and compensatory (logs) damages (excludingnonurban counties newly added in the 2005 data).
B
BB
B
B
BB
BB
B
B
B
B
BBB
B
B
B B
B
B
B
B
B
BB
BB
B
B
BB
B
B
B
B
B
B
B
B
B
B B
B
B
BBB
B
B BB B
B B
BB
BB
BBB
B
B
B
B
BBB
B
BB
B
B
B
B B
B
B
B B
B
B
BBB
B
B
B
B
B
B
B
BBB
BB
B
BB
B
B
B
BB
B
B
B BB B
BB
B
B
B
B
B
B
B
BB
B
B
BB
BBB
B
B
JJ
J
J
J
J
J
J
J
J
J
J
J
J
J
J
J
J
J
J
J
J
J
JJ
J
J
JJJ
J
JJJ
JJ
J
J
J
J
J
J
J
JJ
JJ
J
J
J
J
J
JJ
J
J
JJ
J
J
J
JJ
J
J
JJ
J
J J
J
J
J
J
J
J
J
J
J
J
J
J
J
J
JJ
J
J
J
J
J
J
J
J
J
J
J
J
J
J
JJ
J
J
J
J
JJ
J
J
J
J
J
J
J
J
J
JJ
J
JJ
J
J
J
JJ
J
J J
JJ
J
J
J
J
JJ
J
J
J
JJ
J
J
J
J
J
J JJ
J
J
J
J
J
J
J
J
J
J J
JJ
J
JJ
JJ
J
J
J
J
J
J
J
J
J
J
JJ
J
J
J
J
J
JJ
J
JJ
J
JJJ
J
J
J
J
J
J
J J
J
J
J
J
J
J
J
J JJJ
J
J
JJ
J
J
J
J
J
J
J
J
J
J
J
J J JJ
J
J
J
J
J
J
JJ
J
J
J
JJ
J
JJ
JJ
J
J
J
J
J
JJ
JJ J
J
J
J
J
J
J
J
J
J
J
J
J
J
J
J
J
J
J
JJ J
J
J
J
J
J
J
J J
J
J
J J
J J
J
J
J
JJ
J
JJ
J
J
J
J
JJ
J
J
J
JJJ J
J
J
JJ
J
J
J
J
J
J
J
J
J J
JJ
J
JJ
J
J
J
J
J
J
J
J
J
JJ
J
J
J
J
J
J
JJ
J
J
J
J
JJ
J
JJ
J
J
J
J
J
J
J
J
J
J
JJJ
J
JJ
J
J
J
J
J
J
J
J
J
J
J
J
J
J
J
JJ
J
J
J
J
J
J
J
J
JJ
J
J
J
J
J
J
J
J
J
JJ
JJ
J
J
J
JJ
JJ
J
J J
J
J J
J
J
J
J
J
J
JJ
JJ
J J
J
JJ
J
J
J
J
J
J
J
J
J
J J
JJ
J
J
J
JJ
J
J
J
J
J
J
J
JJ JJ
J
J
J
J
J
J
J
J
J J
J
J
J
JJ
J
J
J
JJ
J
J
J
J
JJJ
J
J
JJJ
J
J
J
J
J
J J
J
J
J
JJ
J JJ
J
J J
J
J
J
J
J
J
J
J
J
J
J
JJ
J
JJ
J
J
J
J
J
J
J
J
02
46
8P
unit
ive
(log
10)
0 2 4 6 8Compensatory (log10)
Jury Trials
Bench Trials
Note: The figure shows a scatterplot of punitive awards with the corresponding compensatory award for cases in thefour Civil Justice Survey of State Courts data. Jury trials are labeled “J” and bench (judge) trials are labeled “B.” Thisfigure excludes the smaller counties added to the 2005 Civil Justice Survey.Source: Civil Justice Survey of State Courts 1992–2005.
336 Eisenberg and Heise

Figure 1 but excludes all nonoriginal counties. Not only are the results in Figure 2 visuallysimilar with those in Figure 1, but the general pattern in Figure 2 also comports with thepatterns that emerged in prior studies.
Figure 3 explores the compensatory and punitive damages relation in greater detailby reporting the relation separately for each of the seven year and trial adjudicator com-binations in the BJS data. It illustrates that the general trend presented in Figures 1 and 2persists over time and across trial modes.
2. The Punitive-Compensatory Ratio
Further insight into the relation between punitive and compensatory damages emerges bycomputing a punitive-compensatory ratio for each punitive damages case. Our punitive-compensatory damage award level (log) ratio was constructed by dividing a case’s punitiveaward (log) by its compensatory award (log). Commentators describe such a ratio as a
Figure 3: Punitive and compensatory awards (logs) by trial mode and year.
02
46
80
24
68
02
46
8
0 2 4 6 8 0 2 4 6 8
0 2 4 6 8
jury trial--1992 jury trial--1996 bench trial--1996
jury trial--2001 bench trial--2001 jury trial--2005
bench trial--2005
Pun
itiv
e (l
og10
)
Compensatory (log10)Note: The figure shows scatterplots of punitive awards with the corresponding compensatory award for cases in thefour Civil Justice Survey of State Courts data sets. Each year of the data sets and each adjudicator are shown in separatescatterplots. This figure includes the smaller counties added to the 2005 Civil Justice Survey, but a figure that excludesthem does not materially differ from this figure.Source: Civil Justice Survey of State Courts 1992–2005.
Judge-Jury Difference in Punitive Damages Awards 337

“widely cited barometer of whether a punitive damages award is out of line.”38 Moreimportantly, the Supreme Court considered such a ratio in its important review of punitivedamages in light of due process protections.39
Table 3 summarizes various punitive-compensatory damage ratios by trial mode tofacilitate comparisons. Means and median ratios for jury and bench trials do not differsignificantly. Although the standard deviations do differ, a test of the entire distributionprecludes the rejection of the hypothesis that they are the same (p = 0.205).40 Althoughbench trial untransformed median ratios exceed those of jury trials, they do not signifi-cantly differ.41 Power calculations suggest that sample size is not a likely explanation for theoverall absence of statistically significant differences between bench and jury trial ratios.
Figure 4 presents kernel density estimates42 of the distributions of the punitive-compensatory damages award levels over time for jury and bench trials. Although theoverall visual impression is one of congruence, the distributions of the jury and bench trialsalso include some differences in their respective shapes. Notably, the jury trial distributionevidences slightly more “spread” than the bench trial distribution. Differences between juryand bench trial distributions, however, do not achieve statistical significance.
38See, e.g., Hersch & Viscusi, Perform, supra note 2, at 9. Although Hersch and Viscusi report that juries awardpunitive damages more frequently than judges, they do not question the very strong relation between punitive andcompensatory awards in the mass of cases. They do so only for what they call “blockbuster” awards and even their datashow a significant relation between punitive and compensatory awards. See Eisenberg & Wells, Association, supra note2 (showing substantial, statistically significant association between punitive and compensatory awards in blockbustercases); Alison F. Del Rossi & W. Kip Viscusi, The Changing Landscape of Blockbuster Punitive Damages Awards, 12Am. L. & Econ. Rev. 116, 147 (2010) (tbl. 9) (showing significant association between punitive and compensatoryawards in an expanded set of blockbuster cases).
39See State Farm Mut. Auto. Ins. Co. v. Campbell, 538 U.S. 408 (2003) (noting that to satisfy due process concerns,the punitive-compensatory damage ratio (not in logs) should not typically exceed a single digit).
40This result is based on a Kolmogorov-Smirnov test.
41A Kolmogorov-Smirnov test of the entire untransformed ratio distribution yields p = 0.103.
42For a discussion of kernel density estimation, see B.W. Silverman, Density Estimation for Statistics and Data Analysis(1986).
Table 3: Punitive-Compensatory Award Ratio by Trial Mode
Mean Ratio Median Ratio SDUntransformedMedian Ratio N
Bench trial 0.943 0.963 0.155 0.646 138Jury trial 0.966 0.962 0.235 0.620 574Significance of bench-jury
trial difference0.265 0.480 0.000 0.503
Note: Ratio is the ratio of punitive award (log) to compensatory award (log). Untransformed ratio is the ratio ofpunitive award to compensatory award. The significance of means difference is based on a t test; the significance ofmedians differences is based on a Mann-Whitney test; the significance of standard deviations differences is based onan f test.Source: Civil Justice Survey of State Courts 1992–2005.
338 Eisenberg and Heise

3. Award Ratios Over Time and Across Trial Modes
Figure 5 presents another perspective on the punitive-compensatory ratio and reinforces thepattern suggested in Figure 4. The box plots in Figure 5 convey stability in the dispersion ofthe punitive-compensatory damages ratio that is robust to time and trial mode. Setting asidethe incoherent distribution of the outlier ratios, separation between the 25th and 75thpercentiles (the lower and upper borders of the boxes) implies relatively small levels ofvariation. Aside from 1996 bench trials, separation between the 25th and 75th percentilesappears to have settled into a relatively consistent pattern. The most striking finding inFigure 5, however, is the stability in the median ratios. The line dissecting each box denotesthe median ratio. These lines consistently hover at or just below 1.0. This descriptiveconsistency illustrates similarity between judges and juries as well as stability over time.
4. Judge-Jury Comparisons
Past research noted judge-jury differences in discrete areas and attributed the likely causeto different streams of cases routed to judges and juries.43 To assess possible judge-jurydifferences we again begin with scatterplots of punitive (log) and compensatory damages(log) with individual bench and jury trials separately identified.
43See Eisenberg et al., Punitive, supra note 10, at 288–93; Eisenberg et al., Decision, supra note 9.
Figure 4: Kernel density estimates of punitive-compensatory ratio (logs).0
12
3
.6 .8 1 1.2 1.4Punitive (log)/Compensatory (log)
Jury Trials
Bench Trials
Note: Kernel density estimates of the ratio of punitive damages in cases containing both kinds of awards, by judgeor jury trial mode. Jury trials show greater “spread” than judge trials. Y-axis is a measure of density, but the shape ofthe distributions is identical if frequency is used.Source: Civil Justice Survey of State Courts 1992–2005.
Judge-Jury Difference in Punitive Damages Awards 339

Figure 6 displays the relation between punitive and compensatory damages for all2005 punitive damages cases. Figure 7 displays the same relation for the 1992–2001 cases.Comparing Figures 6 and 7 reveals important differences and provides visual evidence of adivergence between judge and jury cases. Specifically, the slopes of the respective best-fitting regression lines display more separation between judge and jury trials in 2005 cases(Figure 6) than they do for 1992–2001 cases (Figure 7). Thus, combining all the BJS datainto a single scatterplot, as in Figures 1 and 2, can obscure judge-jury heterogeneity in the2005 data. We explore the State Farm-based explanation for this increased heterogeneity, aswell as other possible explanations, in Section V.
IV. Punitive Damages Models
Our descriptive results imply a robust and persistent relation between compensatory andpunitive awards damages. Evidence of differences in how judges and jurors behave withrespect to the punitive-compensatory relation emerges in the 2005 cases. This sectionexplores whether these findings survive in regression models that simultaneously accountfor more than one factor.
Figure 5: Punitive-compensatory award ratio (logs) by trial mode and year.
0.5
11.
52
Pun
itive
/com
pens
ator
y ra
tio (
log)
jury trial--1992 jury trial--1996 bench trial--1996 jury trial--2001 bench trial--2001 jury trial--2005 bench trial--2005
Note: The figure shows the 25th and 75th percentiles, the median, the upper and lower adjacent values, and the datapoints more extreme than the adjacent values. Excludes two jury trial outliers in 2001.Source: Civil Justice Survey of State Courts 1992–2005.
340 Eisenberg and Heise

Tables 4 and 5 report results from two distinct though related models. Takentogether, the tables provide strong support for the argument that the amounts of compen-satory awards are associated with punitive awards as well as with the punitive-compensatoryratio. The tables also illustrate that, in the 2005 data, the punitive-compensatory ratio differsbetween jury and bench trials.
We analyze the 712 trials where the plaintiff won and was awarded a nonzero com-pensatory award.44 Our sample is nested on two levels. Individual cases are clustered at thecounty level and the counties are embedded in larger geographical units, states, the laws ofwhich vary and can influence punitive damages case outcomes.45 Our data are thus ame-nable to using hierarchical or multilevel models that account for the sample structure.46 Forboth Tables 4 and 5, Column A, the most parsimonious model, includes a single indepen-dent variable—the (log) compensatory damages award. Column B adds a dummy variable
44We excluded from our analyses the 20 cases where the plaintiff received a punitive award though no compensatoryaward. See supra note 28 and, for a general discussion, see Eisenberg et al., Predictability, supra note 20, at 629–30.
45Eisenberg et al., Decision, supra note 9.
46See Andrew Gelman & Jennifer Hill, Data Analysis Using Regression and Multilevel/Hierarchical Models 251 et seq.(2007). For discussion of the number of groups and the number of observations per group needed in multilevelmodels, see id. at 275–76.
Figure 6: Bench and jury punitive and compensatory (logs) damages (all 2005 cases).
B
BB
B
BB
B
BB
B
B
BBBB
B
B
B
B
B
B
B
BBB
B
BB
B
B
B
B
BB
B
B
B
BB
BB
B
J
J
J
J
J
J
J
J
J
J
J
J
J
J
J JJ
J
J
J
J
J
J
J
JJ
J
J
J
J
J
JJ
J
J
J
J
J
J
J
J
JJ
J
J
J
J
J
J
J
J
J
J
J
J
J
J
J
J
J
J
J
J
J
J
J
J
J
J
J
J
JJ
J
J
J
J
J
J
J JJ
J
J
J
J
J
J
J
JJJ
J
J
J
J
J
J
J
J
J
J
J
J
J
J
JJ JJ
J
J
J
JJ
J J
JJ
J
J
J
J
J
J
J
J
J J
J
J
J
J
J
J
J
02
46
8P
unit
ive
(log
10)
2 4 6 8Compensatory (log10)
Jury Trials
Bench Trials
Note: The figure shows a scatterplot of punitive awards with the corresponding compensatory award for cases in the2005 Civil Justice Survey of State Courts data set. Jury trials are labeled “J” and bench (judge) trials are labeled “B.”The lines are the best-fitting regression lines.Source: Civil Justice Survey of State Courts 2005.
Judge-Jury Difference in Punitive Damages Awards 341

indicating whether the case was tried to a jury (vs. a bench trial) to assess the potentialinfluence of trial mode. Column C includes an additional variable, an interaction termbetween the compensatory award and the jury trial dummy variable.47 Both tables facilitatecomparisons between all punitive damages cases (top panel; N = 712) and 2005 punitivedamages cases in which the plaintiff requested punitive damages (bottom panel; N = 152).Note that by limiting coverage to 2005 cases, the bottom panel isolates a subset of the entireuniverse of punitive damages cases (top panel).
Table 4 presents results from our models of punitive damages award levels. In allthree models and in both panels, the compensatory damages coefficient achieves statisticalsignificance. This finding comports with our prior research on earlier versions of the CivilJustice Survey data sets.48 Also interesting is that in the full data set (top panel), neither thejury trial dummy nor the interaction variables achieve statistical significance. Thus, with
47Although the analytic differences distinguishing Columns B and C are slight, we include the two separate models inresponse to earlier concerns about possible multicollinearity raised by Hersch and Viscusi (Perform, supra note 2,33–34). As these results illustrate (similar to past results; see Eisenberg et al., Punitive, supra note 10, at 281–82 tbls.4, 5), because it bears on the influence of the compensatory award, the inclusion of a jury trial dummy variable or aninteraction variable (or both) makes little difference.
48Eisenberg et al., Predictability, supra note 20, at 648 tbl. 5 (1992 data); Eisenberg et al., Punitive Damages, supranote 7, at 747–78 (1996 data); Eisenberg et al., Punitive, supra note 10, at 281–82 tbls. 4, 5 (1992–2001 data).
Figure 7: Bench and jury punitive and compensatory (logs) damages (1992–2001 cases).
B
BB
B
BBB
B
B
B
B
B
B BB
BB
B
BB
B
B
B
B
B
B
B
B
B
B
BB
B
B
BBB
B
BB B
B B
BB
BB
BBB
B
B B
BBB
B
B
B
B
B
B
B
B
B
BBB
B
B
B
B
B
B
B
B
BB
B
B
B
BB
B
B
B
B
BB
B
BB
BB
B
B
J
J
J
J
J
J
J
J
J
J
J
J
J
J
J
J
J
J
J
J
J
J
JJJ
J
JJJ
JJ
J
J J
J
J
J
JJ
JJ
J
JJ
J
J
J
J
J
J
J
J
J
J
JJ
J
J J
J
J
J
J
J
JJ
J
J
J
J
J
J
J
J
J
J
J
J
J
J
J
J
J
J
J
J
JJ
J
J
J
JJ
J
J
JJ
J
JJ
J
J
J
J
J J
J JJJ
J
J
J
J
JJ J
J
J
J
J
J
J
J
JJ
JJ
J
J
JJ
JJ
J
J
J
J
J
JJ
J
J
J
J
J
J
J
J
JJ
J
J
J
J
J JJ
J
J
J
JJ
JJJJ
J
JJ
J
J
J
J J JJ
J
J
J
J
J
J
J
J
J
J
J
JJ
JJ
J
J
J
J
J
JJ
JJ
J
J
J
J
J
J
J
J
J
J
J
J
J
J
JJJ J
J
J
JJ
J
J J
J
J
J
J J
J
J
J
J
J
J
J
J
J
J
JJ
J
J
J
JJJ J
J
J
JJ
J
J
J
J
J
J J
JJ
J
JJ
J
J
J
J J
J
J
JJ
J
J
J
J
J
J
JJ
J
J
J
J
J
J
J
J
J
J
J
J
J
J
J
J
JJ
J
J
J
J
J
J
J
JJ
J
JJ
J
J
J
J
J
J
JJ
J
J
J
J
J
J
J
J
JJ
JJ
J
JJ
J
J
J
J J
J
J J
J
J
J
J
J
JJ
JJ
J J
J
J
J
J
J
J
J
J
J
JJ
J
JJ
J
J
J
J
J
J
J JJ
J
J
J
J
J
J
J
J
J
J
J
JJ
J
J
JJ
J
J
J
J
JJJ
J
JJJ
J
J
J
J J
J
J
J
JJ
J J
J
J
J
J
J
J
J
J
J
JJ
J
J
J
J
J
J
J
J
J
02
46
8P
unit
ive
(log
10)
0 2 4 6 8Compensatory (log10)
Jury Trials
Bench Trials
Note: The figure shows a scatterplot of punitive awards with the corresponding compensatory award for cases inthree Civil Justice Survey of State Courts data sets, 1992, 1996, and 2001. Jury trials are labeled “J” and bench (judge)trials are labeled “B.” The lines are the best-fitting regression lines.Source: Civil Justice Survey of State Courts 1992–2001.
342 Eisenberg and Heise

respect to explaining punitive damage awards, the top panel (all cases) underscores theimportance of the compensatory award rather than trial mode.
The 2005 results in Table 4 (bottom panel) reveal a complicating wrinkle—theemerging importance of trial mode. The import of the compensatory damages awardremains intact as that coefficient achieves statistical significance in all three models. Whatchanges, however, is that the jury trial (Column B) and the interaction variable (Column C)coefficients are now statistically significant. This finding suggests that, as of 2005, trialmode, along with compensatory damages awards, is associated with punitive damages
Table 4: Multilevel Regression Models of Punitive Damages (Log) Levels
A B C
All CasesCompensatory damages (log) 0.819** 0.812** 0.812**
(0.029) (0.030) (0.080)Jury trial dummy (1 = yes) — 0.126 0.126
(0.075) (0.424)Jury trial ¥ compensatory (log) — — -0.000
(0.086)Constant 0.712** 0.644** 0.644
(0.158) (0.157) (0.391)N 712 712 712Number of states 26 26 26Number of counties 66 66 66Prob. > chi-square 0.000 0.000 0.0002005 Cases; Punitives RequestedCompensatory damages (log) 0.847** 0.819** 0.564**
(0.054) (0.055) (0.139)Jury trial dummy (1 = yes) — 0.311* -1.157
(0.138) (0.749)Jury trial ¥ compensatory (log) — — 0.296*
(0.148)Constant 0.752* 0.628* 1.881**
(0.293) (0.295) (0.692)N 152 152 152Number of states 21 21 21Number of counties 49 49 49Prob. > chi-square 0.000 0.000 0.000
Note: The “All Cases” (top) panel includes all cases with punitive damages from the four Civil Justice Survey data sets.Models that exclude cases from the smaller counties added to the 2005 Civil Justice Survey do not yield resultsmaterially different from those in the table. The “2005 Cases; Punitives Requested” (bottom) panel includes only casesfrom the 2005 Civil Justice Survey in which punitive damages were requested (see footnote 24). Variations on ModelsA and B that do not limit the sample to cases in which punitive damages were requested and that do not include casesfrom smaller counties added to the 2005 Civil Justice Survey do not yield results materially different from those in thetable. Variations on Model C that do not limit the sample to cases in which punitive damages were requested and thatdo not include cases from smaller counties added to the 2005 Civil Justice Survey yield results in which the interactionterm is not statistically significant. However, in models that include only the interaction term and not the jury trialdummy, the interaction term is statistically significant. *p < 0.05; **p < 0.01. Standard errors in parentheses. Multi-level models are used with random intercepts for locale and state.Source: Civil Justice Survey of State Courts 1992–2005.
Judge-Jury Difference in Punitive Damages Awards 343
award levels, independent of the compensatory award influence. Figure 6 confirms that theslope of the judge and jury trial lines noticeably differ.
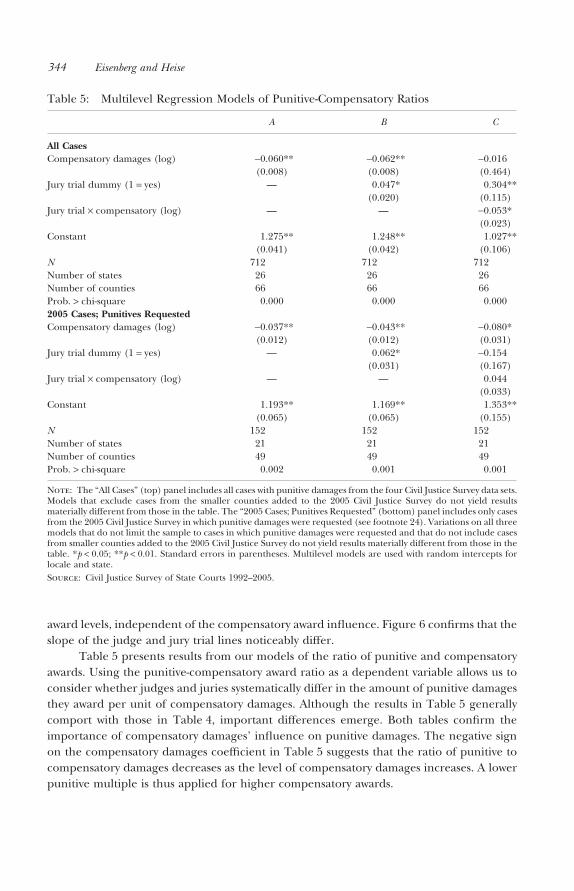
Table 5 presents results from our models of the ratio of punitive and compensatoryawards. Using the punitive-compensatory award ratio as a dependent variable allows us toconsider whether judges and juries systematically differ in the amount of punitive damagesthey award per unit of compensatory damages. Although the results in Table 5 generallycomport with those in Table 4, important differences emerge. Both tables confirm theimportance of compensatory damages’ influence on punitive damages. The negative signon the compensatory damages coefficient in Table 5 suggests that the ratio of punitive tocompensatory damages decreases as the level of compensatory damages increases. A lowerpunitive multiple is thus applied for higher compensatory awards.
Table 5: Multilevel Regression Models of Punitive-Compensatory Ratios
A B C
All CasesCompensatory damages (log) -0.060** -0.062** -0.016
(0.008) (0.008) (0.464)Jury trial dummy (1 = yes) — 0.047* 0.304**
(0.020) (0.115)Jury trial ¥ compensatory (log) — — -0.053*
(0.023)Constant 1.275** 1.248** 1.027**
(0.041) (0.042) (0.106)N 712 712 712Number of states 26 26 26Number of counties 66 66 66Prob. > chi-square 0.000 0.000 0.0002005 Cases; Punitives RequestedCompensatory damages (log) -0.037** -0.043** -0.080*
(0.012) (0.012) (0.031)Jury trial dummy (1 = yes) — 0.062* -0.154
(0.031) (0.167)Jury trial ¥ compensatory (log) — — 0.044
(0.033)Constant 1.193** 1.169** 1.353**
(0.065) (0.065) (0.155)N 152 152 152Number of states 21 21 21Number of counties 49 49 49Prob. > chi-square 0.002 0.001 0.001
Note: The “All Cases” (top) panel includes all cases with punitive damages from the four Civil Justice Survey data sets.Models that exclude cases from the smaller counties added to the 2005 Civil Justice Survey do not yield resultsmaterially different from those in the table. The “2005 Cases; Punitives Requested” (bottom) panel includes only casesfrom the 2005 Civil Justice Survey in which punitive damages were requested (see footnote 24). Variations on all threemodels that do not limit the sample to cases in which punitive damages were requested and that do not include casesfrom smaller counties added to the 2005 Civil Justice Survey do not yield results materially different from those in thetable. *p < 0.05; **p < 0.01. Standard errors in parentheses. Multilevel models are used with random intercepts forlocale and state.Source: Civil Justice Survey of State Courts 1992–2005.
344 Eisenberg and Heise

Tables 4 and 5 also illustrate the influence of trial mode in their lower panels (2005cases). In both panels, however, the findings for the punitive-compensatory ratio (Table 5)are less robust than the findings for punitive damages award levels (Table 4). The Appendixreports results from similar though more complex models that include additional explana-tory variables.
V. Discussion
Our core descriptive results in Section III persist in Section IV’s regression analyses.Compensatory awards systematically influence punitive awards. We also find evidence ofdifferences in how judges and jurors behave in the punitive damages context once we limitthe sample to the 2005 cases. Beginning in 2005, juries awarded more punitive damagesthan judges per unit of compensatory damages. We discuss here factors that might influ-ence the judge-jury difference. These include selection effects, the possible differentialinfluence on judges and juries of the Supreme Court’s 2003 State Farm decision, the possibledifference in judge and jury results for cases involving personal injury, the 2005 data’sinclusion of a variable that allows one to limit the sample to cases in which punitive damageswere requested, and the 2005 data’s inclusion of 110 smaller counties not included in theearlier Civil Justice Surveys.
A. Selection Effect Considerations
Our interpretation of judge-jury differences pivots on the nonrandom stream of casesdecided by judges and juries. Table 1 illustrates that larger stakes cases tend to be routed tojuries rather than judges for adjudication. This finding is especially true for the subset of2005 cases (Table 1, Panel B). Moreover, prior studies suggest that one would expect juriesrather than judges to see a sample of cases more amenable to punitive damages awards.49 Ofcourse, if plaintiffs route cases more amenable to punitive damages awards to juries, ourfindings may overstate the juries’ propensity to award punitive damages and preclude aconfident rejection of the hypothesis that judges are more likely than juries to awardpunitive damages. We simply cannot tell with certainty how judges would have respondedto a stream of cases similar to the stream of cases juries decided.
Conventional wisdom about the relative strengths and weaknesses of judges andjuries may also influence plaintiff selection of a bench or jury trial. Plaintiffs (or, moreprecisely, their attorneys) may regard judges as more reliable, and therefore select benchtrials in their strongest cases on the legal merits.50 Conversely, defendants in cases prone topunitive awards might demand jury trials in an effort to exploit perceived (or real) com-parative unpredictability. If so, we should observe judges awarding punitive damages at arate that exceeds that of juries. However, perceptions that juries are more amenable to
49See Eisenberg et al., Punitive, supra note 10, at 289.
50Id.
Judge-Jury Difference in Punitive Damages Awards 345
awarding punitive damages and awarding higher levels of punitive damages are widespreadand persist. Indeed, until the 1996 Civil Justice Survey data were gathered and analyzed, thesurprisingly robust role of judges in the punitive damages area was underappreciated. Thus,systematically seeking a reliable judge to bolster the prospect of punitive damages strikes usas unlikely. Similar to the empirical uncertainty surrounding how judges might respond toa stream of cases identical to the stream of cases decided by juries, uncertainty aboutwhether plaintiffs and defendants are more likely to seek jury or bench trials for cases withlegitimate punitive damages potential cannot be dismissed based on our data. That litigantsmight act strategically in their decisions about whether to seek a bench or jury trialcomports with prior research.51
B. State Farm’s Possible Differential Impact on Judges and Juries
Even if selection effects help explain judge-jury differences, one important question is whysuch a difference emerges only in the 2005 data. Assuming that the judge-jury differenceobserved in the 2005 punitive damages data set did not exist in prior data sets, whataccounts for its emergence in 2005? One factor distinguishing the 2005 data cohort fromthe prior three cohorts is that in 2003 the U.S. Supreme Court rendered its State Farm52
decision. Thus, one alternative (or additional) explanation for the judge-jury differenceobserved in the 2005 cases involves evolving legal doctrine and its differential impact onjudges and jurors. At least one article has attributed substantial changes in blockbusterpunitive damages cases to State Farm,53 and another reports a State Farm effect, though thisclaim is questionable because the study did not include pre-State Farm cases.54 One mightpause before embracing a case-based explanation for the change we report because similarclaims were made about BMW of North America, Inc. v. Gore, the Supreme Court case that firstinvalidated a punitive award on the constitutional ground that the punitive-compensatoryratio was excessive.55 Empirical study of cases decided before and after BMW provided noevidence that the punitive-compensatory ratio was materially affected by that case.56
51See, e.g., Kevin M. Clermont & Theodore Eisenberg, Trial by Jury or Judge: Transcending Empiricism, 77 CornellL. Rev. 1124 (1992) (explaining a higher plaintiff win rate in judge trials in products liability and medical malpracticecases partly as a function of the routing of cases between judges and juries).
52State Farm Mut. Auto Ins. Co. v. Campbell, 538 U.S. 408 (2003).
53Del Rossi & Viscusi, supra note 38.
54Lauren R. Goldman & Nickolai G. Levin, State Farm at Three: Lower Courts’ Application of the Ratio Guidepost, 2N.Y.U. J.L. & Bus. 509, 509 (2006) (study of 199 post-State Farm cases finds that State Farm “significantly altered thelandscape of punitive damages litigation in a wide range of cases”).
55517 U.S. 559 (1996).
56Theodore Eisenberg & Martin T. Wells, The Predictability of Punitive Damages Awards in Published Opinions, theImpact of BMW v. Gore on Punitive Damages Awards, and Forecasting Which Punitive Awards Will Be Reduced, 7 Sup.Ct. Econ. Rev. 59 (1999).
346 Eisenberg and Heise

Nevertheless, State Farm is important to punitive damages cases as it illustrates theCourt’s continued sensitivity to proportionality between punitive and compensatoryawards.57 By expressly noting that “few awards exceeding a single-digit ratio between puni-tive and compensatory, to a significant degree, will satisfy due process,”58 the Court spokedirectly to the level of the punitive-compensatory damages ratio. State Farm makes clear thatin cases with particularly large compensatory awards, the punitive damages award shouldmore closely hew to a one-to-one ratio.59
Although the State Farm Court assiduously steered clear of setting any bright-line ratiofor the punitive-compensatory relation,60 many commentators inferred as much. In particu-lar, conventional wisdom understood the State Farm decision to mean that any punitivedamage award that is more than nine times larger than the underlying compensatory awardis presumptively unconstitutional.61 Moreover, Justice Ginsburg, in dissent, reacted againstwhat she felt was the Court’s articulation of a functional “bright-line” ratio rule.62 Finally,the Court’s growing discomfort with ratios exceeding one was confirmed in its nonconsti-tutional Exxon Shipping63 decision in 2008.
The Supreme Court’s concerns about proportionality between punitive and compen-satory damages were clearly understood by some lower courts as well. Lower courts adopteda functional understanding of State Farm similar to what conventional wisdom implied.Mindful of the Court’s admonition of a “single-digit” ratio, lower courts called on to reviewpunitive damages awards have repeatedly reduced punitive awards so that they are consis-tent with State Farm’s perspective on the appropriate relation between punitive and com-pensatory awards.64 Results presented in Table 1 may suggest that judges and juries weremindful of the Court’s admonition about the punitive-compensatory ratio as the mean
57538 U.S. at 425. To be fair, concerns about proportionality were never the exclusive province of the Supreme Court.For example, tort reform advocates note that the American Bar Association, the American College of Trial Lawyers,and the American Law Institute have all advocated limiting punitive damages to a multiple of compensatory damages.See, e.g., Victor E. Schwartz & Mark A. Behrens, Punitive Damages Reform—State Legislatures Can and Should Meetthe Challenge Issued by the Supreme Court in Haslip, 42 Am. U.L. Rev. 1365, 1378–79 n82 (1993).
58538 U.S. at 425.
59Id.
60Id.
61See, e.g., Mark G. Bonino, The U.S. Supreme Court and Punitive Damages: On the Road to Reform, 70 Def. Couns.J. 432, 432 (2003) (arguing that the Court set a “single-digit multiplier” as the ordinary constitutional limit for thepermissible ratio between punitive and compensatory damages).
62538 U.S. at 438 (Ginsburg, J., dissenting) (characterizing the “numerical controls” as “boldly out of order”).
63Exxon Shipping Co. v. Baker, 128 S. Ct. 2605, 2624 (2008).
64See, e.g., Eden Elec., Ltd. v. Amana Co., L.P., 258 F. Supp. 2d 958, 974 (N.D. Iowa 2003) (court observed that afterState Farm the punitive-compensatory award ratio cannot exceed a 10-to-1 ratio); Diamond Woodworks, Inc. v.Argonaut Ins. Co., 135 Cal. Rptr. 2d 736, 760–61, 762 (Ct. App. 2003) (reducing a punitive damage award and notingthat “anything exceeding four-to-one would not comport with due process under Campbell ).
Judge-Jury Difference in Punitive Damages Awards 347

ratios dropped in the 2005 cohort (Panel B) of punitive damages cases.65 However, theseresults are equivocal because the median ratios reported in Table 1 show an increase, nota decrease, over time.
Could State Farm explain the 2005 difference in judge-jury results by having influ-enced judges and juries differently? Recent punitive damages research suggests anincreased importance to trial type (jury vs. bench trial) in explaining when punitivedamages will be awarded.66 Specifically, non-personal-injury cases tried to juries awardpunitive damages at a higher rate than cases tried to judges. Moreover, evidence of a jurytrial effect when it comes to predicting punitive damage awards is especially pronounced inlarge-county models.67 We find similar results, presented in Figure 6, in our analyses of the2005 data.
We hypothesize two reasons that might support an asymmetrical influence of StateFarm on judges and juries. First, in general, court decisions—including many (but not all)Supreme Court decisions—tend to be absorbed and propagated by judges more directlythan by lay jurors. Although the State Farm decision was described by many judges andacademics as “significant” and “important,” the decision—and its ratio nuances—mightstrike the lay public as less so.
Despite what many lawyers and judges (and law professors) may wish to believe, theempirical research on the “impact” of Supreme Court decisions on citizens is mixed, at best.According to Professor Kritzer, research on the public’s knowledge of the Supreme Courtsuggests that “the public knows little about the Court or its workings.”68 Indeed, Kritzer’sown analysis of the Court’s Bush v. Gore69 decision—revealing only modest impact on publicperceptions and knowledge of the Court—contributes to the conventional wisdom.70
Kritzer’s finding of only modest impact on public perceptions and knowledge of the Courtincident to its Bush v. Gore decision is remarkable given the unprecedented public, media,and political attention to the Court decision that may have functionally decided the 2000presidential race. That only “modest” impact flowed from this unprecedented Court deci-sion speaks volumes about the public’s attention to the Court’s specific decisions. More-over, to the extent that Bush v. Gore generated only modest impact on the public’sperceptions and knowledge of the Court and its decisions, the likelihood that the public wasengaged with the Court’s focus on the punitive-compensatory damages ratio (at issue in
65We caution that inferences from summary statistics in this area are risky and have been incorrect in the past.Theodore Eisenberg, Michael Heise & Martin T. Wells, Variability in Punitive Damages: Empirically Assessing ExxonShipping Co. v. Baker, 166 J. Institutional & Theoretical Econ. 5 (2010).
66Eisenberg et al., Decision, supra note 9.
67Id.
68See Herbert M. Kritzer, The Impact of Bush v. Gore on Public Perceptions and Knowledge of the Supreme Court, 85Judicature 32, 34 (2001).
69531 U.S. 98 (2000).
70Kritzer, supra note 68, at 33.
348 Eisenberg and Heise

State Farm ) is far lower. Consequently, that the State Farm decision might have impactedjudges more than lay jurors should surprise few.
A second possible reason explaining the State Farm decision’s uneven impact onjudges and lay jurors involves judges’ professional incentives. Unlike judges, most jurors arenot legally trained and participate in the legal system as jurors, if at all, typically no morethan once in their lives. Judges, in contrast, are classic “repeat players” who possess profes-sional and reputation interest in not having their legal decisions reversed. Possessing moreincentives to “get the law right,” judges are more apt to stay current with importantSupreme Court decisions, even cases like State Farm that deal with such technical nuance asthe mathematical relation between punitive and compensatory awards.
To be sure, the degree to which judges fear reversal remains contested in theliterature. Scholars note that in the absence of traditional economic “sticks-and-carrots,”models of judicial decision making rely on the power of appellate court reversal as a wayto ensure lower court compliance.71 To the extent that appellate reversal performs “sanc-tioning” work on lower court judges, it follows that trial court judges would, on balance,prefer their decisions affirmed rather than reversed on appeal. As Professor Kim notes,however, the degree to which judges might fear reversal is a function of the probabilitythat they will, in fact, be reversed. For example, although the Supreme Court reverses amajority of the cases it accepts for review,72 the Court reviews only a minute fraction oftrial and appellate court activity.73 Similarly, the great majority of state court trials are notappealed to conclusion and those that are appealed are usually affirmed.74 Consequently,the actual threat posed by reversal is quite low. Indeed, the few empirical studies that haveaddressed “fear of reversal” as a motivator for lower court judges’ adherence to precedentdo not supply support for the thesis. Although Kim concludes that while it is plausible thatjudges might dislike having their decisions reversed, it is doubtful that fear of reversalplays a significant factor.75 Of course, even a mere distaste for reversal might supply therequisite motivation for judges in our punitive damages cases (the 2005 cohort) to bemindful of the Court’s guidelines in State Farm. Such a motivation distinguishes judges andjurors.
To explore whether State Farm might have affected judges and juries differently, wefocus on the changes over time in the punitive-compensatory relation. We do so separatelyfor each adjudicator as our discussion above suggests that State Farm should have affected
71See, e.g., Pauline T. Kim, Lower Court Discretion, 82 N.Y.U. L. Rev. 383, 396–98 (2007).
72See Lee Epstein et al., The Supreme Court Compendium: Data, Decisions, and Developments 244, tbls. 3–6 (4th ed.2007).
73Id. at 74, tbls. 2–6.
74Theodore Eisenberg & Michael Heise, Plaintiphobia in State Courts? An Empirical Study of State Trial Courts onAppeal, 38 J. Legal Stud. 121 (2009).
75See Kim, supra note 71, at 403–04.
Judge-Jury Difference in Punitive Damages Awards 349

bench trials more than jury trials. Figure 8’s left panel shows bench trials, with the scatter-plots and best-fitting linear regression lines displayed for 2005 trials and pre-2005 trials. Theevidence of a State Farm effect is mixed at best. For a large range of compensatory awards,up to over $100,000 (105, shown as “5” on the x-axis), the 2005 trials (the solid line) showa higher punitive award per unit of compensatory damages than the pre-2005 trials. Forcompensatory awards somewhat below about $1 million, the two time period lines cross.Regression models confirm the absence of a significant effect of a dummy variable for 2005trials or an interaction term between this dummy variable and the compensatory award.
Figure 8’s right panel shows jury trials, with the scatterplots and best-fitting linearregression lines again displayed for 2005 trials and pre-2005 trials. The evidence of a StateFarm effect is stronger. For most of the range of compensatory awards, starting at less than$10,000 (104, shown as “4” on the x-axis), the 2005 trials (the solid line) show a higherpunitive award per unit of compensatory damages than the pre-2005 trials. Regressionmodels, both ordinary least squares models and multilevel models with locale and state aslevels, confirm a highly significant effect (p = 0.001) of a dummy variable for 2005 trials.
Figure 8: Bench and jury punitive-compensatory relation, before and after State Farm.
02
46
8
Pun
itiv
e (l
og10
)
2 4 6 8Compensatory (log10)
Bench trials, solid line=2005;dotted line=pre-2005
02
46
8
Pun
itiv
e (l
og10
)
0 2 4 6 8Compensatory (log10)
Jury trials, solid line=2005;dashed line=pre-2005
Note: The figure shows the punitive-compensatory relation separately for bench trials (left panel) and jury trials(right panel). Within each panel, the data for pre-2005 trials are indicated by a dashed line and by hollow circles, andthe data for 2005 trials are indicated by a solid line and by hollow diamonds. The lines are the best-fitting regressionlines.Source: Civil Justice Survey of State Courts 1992–2005.
350 Eisenberg and Heise

To further explore this preliminary possible State Farm effect, we employ lowess(locally weighted scatterplot smoothing) models that avoid any assumed global functionalform for the relation between punitive and compensatory damages. Figure 9 reports theresults, with the left panel again showing bench trial results and the right panel againshowing jury trial results. For both adjudicator types, for most of the range of compensatoryawards, the 2005 trials (the solid lines) tend to show higher punitive awards per unit ofcompensatory damages than the pre-2005 trials. This result, consistent with the loggedratios in Table 1, is the opposite of the expected State Farm effect.
Combining the judge-jury results represented in Figures 8 and 9 suggests that thepunitive-compensatory relation for juries changed more in the 2005 data from prior yearsthan did the relation for judges. This is the opposite of what theorizing about State Farm’spossible differential impact on judges and juries would forecast. The Civil Justice Surveydata thus provide no evidence that State Farm is the likely explanation for the shiftingrelation between judges and juries that we report in Tables 4 and 5.
Figure 9: Bench and jury punitive-compensatory relation, lowess smoothed, before andafter State Farm.
02
46
8P
unit
ive
(log
10)
2 4 6 8Compensatory (log10)
Bench trials, solid line=2005;dashed line=pre-2005
02
46
8P
unit
ive
(log
10)
0 2 4 6 8Compensatory (log10)
Jury trials, solid line=2005;dashed line=pre-2005
Note: The figure shows the lowess smoothed punitive-compensatory relation separately for bench trials (left panel)and jury trials (right panel). Within each panel, the data for pre-2005 trials are indicated by a dashed line and the datafor 2005 trials are indicated by a solid line.Source: Civil Justice Survey of State Courts 1992–2005.
Judge-Jury Difference in Punitive Damages Awards 351

C. Possible Judge-Jury Differences in Personal Injury Cases
Prior research has suggested a judge-jury difference in the decision to award punitivedamages based on whether cases involved personal injury. Judges award punitive damagesat a higher rate in personal injury cases and juries award them at a higher rate innonpersonal-injury cases.76 If a similar difference exists with respect to the relation betweenpunitive and compensatory damages, a change in the makeup of cases may explain the 2005judge-jury difference. A shift in the proportion of personal injury and non-personal-injurycases flowing to juries and judges could lead to newly observed judge-jury difference in2005. Such a difference would not be a consequence of a change in adjudicator behavior,but of the makeup of the flow of cases to the two kinds of adjudicators.
To explore this possibility, we reran all the models reported in Tables 4 and 5 withthe addition of a personal injury dummy variable equal to 1 for cases in which bodily injurywas claimed. The variable was not statistically significant in any of the models. In addition,the coefficients on the variables previously included in the models did not materiallychange. We thus found no evidence that personal injury cases, or the changing mix of casesflowing to juries and judges, explains the 2005 judge-jury difference.
D. The Effect of the 2005 Data Including a Variable Identifying Cases in Which Punitive DamagesWere Sought
Another possibility is that the judge-jury difference that emerged in 2005 is attributable tothe 2005 Civil Justice Survey’s inclusion of a variable signaling whether punitive damageswere requested. A judge-jury difference may lurk in the prior data sets but can be detectedonly with a punitives-requested variable such as that included in 2005. Obviously, becausesuch a variable was not added until the 2005 data set, we are precluded from fully investi-gating this possibility.
However, we performed alternative analyses of the 2005 data in which the 2005 datawere treated consistently with the earlier Civil Justice Surveys. We did so by not limiting the2005 punitive damages cases to those in which punitive damages were requested. Asreported above, a small subset of cases yielded punitive awards in cases in which the filesinspected did not report evidence of punitives being requested.77 We believe these casesmay have involved statutory doubling or trebling of damages that were interpreted aspunitive in nature. Those alternative analyses did not yield results materially different fromthose reported in Tables 4 and 5,78 so we do not believe that the 2005 judge-jury effect isattributable to the availability of the new punitives-requested variable in 2005.
76E.g., Eisenberg et al., Decision, supra note 9.
77See note 24 supra.
78See text note accompanying Tables 4 and 5 supra.
352 Eisenberg and Heise

E. The Effect of the 2005 Data Including 110 Smaller Counties Not in the Prior CivilJustice Surveys
Finally, the 2005 judge-jury difference may be attributable to the 2005 Civil Justice Survey’sinclusion of 110 smaller counties not included in earlier Civil Justice Surveys. In anotherarticle, we show that the smaller counties noticeably differed from the larger, original CivilJustice Survey counties with respect to whether punitive damages were awarded.79 Soheterogenous results across large and small counties may explain the new judge-jurydifference.
To assess this possibility, we performed alternative analyses of the 2005 data in whichthe 2005 data were limited to the large counties in the prior Civil Justice Surveys. Thosealternative analyses did not yield results materially different from those reported in Tables 4and 5,80 so we have no evidence that the 2005 judge-jury effect is attributable to theadditional counties included for the first time in the 2005 data.
VI. Conclusion
The addition of the 2005 Civil Justice Survey data cohort to its three prior cohorts providesthe most systematic and comprehensive view to date of punitive damages in state courts.Findings provide further support for the underlying relation between compensatory andpunitive damages and uncover additional wrinkles about the punitive-compensatory rela-tion. Moreover, results from the 2005 data point to a jury-trial effect. Absent other evidenceof the source of new judge-jury differences, we attribute the emerging difference to selec-tion effects resulting from litigants’ strategic decisions about whether to pursue bench orjury trials. A leading possible explanation for the new difference, the expected asymmetri-cal influence of the Supreme Court’s 2003 State Farm decision on judges and lay jurors, findsno support in our analysis. Nor do explanations based on previously reported judge-jurydifferences in personal injury cases involving punitive damages or on the different makeupof the 2005 sample find support. The findings reveal a more nuanced and complex pictureof judicial and juror behavior in the punitive damages context than that previouslyreported.
79Eisenberg et al., Decision, supra note 9.
80See text note accompanying Tables 4 and 5 supra.
Judge-Jury Difference in Punitive Damages Awards 353

AppendixTable A1: Full Multilevel Regression Models of Punitive Damages (Log) Levels (All Cases)
Independent Variables A B C
Compensatory damages (log) 0.808** 0.802** 0.830**(0.031) (0.031) (0.081)
Jury trial dummy (1 = yes) — 0.132 0.287(0.077) (0.429)
Jury trial ¥ log of compensatory — — -0.032(0.088)
Selected Case TypesAuto 0.169 0.139 0.137
(0.785) (0.784) (0.784)Premises liability -0.259 -0.236 -0.243
(0.185) (0.186) (0.187)Product liability (incl. asbestos) 0.155 0.145 0.146
(0.315) (0.314) (0.315)Intentional tort -0.200 -0.187 -0.189
(0.111) (0.111) (0.111)Medical and prof. malpractice -0.296 -0.300 -0.298
(0.153) (0.153) (0.153)Fraud -0.097 -0.080 -0.083
(0.090) (0.091) (0.091)Employment discrim. or dispute -0.066 -0.077 -0.075
(0.111) (0.112) (0.112)Rental/lease agreement 0.032 0.019 0.021
(0.209) (0.209) (0.209)Selected Case CharacteristicsBodily injury (nonauto) 0.628 0.603 0.607
(0.795) (0.794) (0.795)No bodily injury 0.457 0.445 0.447
(0.789) (0.787) (0.788)Constant 0.371 0.307 0.173
(0.805) (0.804) (0.882)N 708 708 708Number of states 25 25 25Number of counties 64 64 64Prob. > chi-square 0.000 0.000 0.000
Note: *p < 0.05; **p < 0.01. Standard errors in parentheses. Multilevel models are used with random intercepts forlocale and state.Source: Civil Justice Survey of State Courts 1992–2005.
354 Eisenberg and Heise

Table A2: Full Multilevel Regression Models of Punitive Damages (Log) Levels (2005Cases, Punitive Damages Requested)
Independent Variables A B C
Compensatory damages (log) 0.853** 0.826** 0.687**(0.060) (0.060) (0.060)
Jury trial dummy (1 = yes) — 0.333* -0.472(0.142) (0.829)
Jury trial ¥ log of compensatory — — 0.162(0.165)
Selected Case TypesAuto -0.007 -0.142 -0.136
(0.669) (0.660) (0.660)Premises liability -0.156 -0.101 -0.026
(0.534) (0.525) (0.531)Product liability (incl. asbestos) -0.098 -0.198 -0.228
(0.709) (0.697) (0.698)Intentional tort -0.179 -0.202 -0.171
(0.253) (0.249) (0.251)Medical and prof. malpractice 0.399 0.315 0.295
(0.368) (0.364) (0.364)Fraud -0.032 -0.070 -0.083
(0.156) (0.155) (0.155)Employment discrim. or dispute -0.031 -0.094 -0.109
(0.199) (0.197) (0.198)Rental/lease agreement 0.784 0.802 0.730
(0.357) (0.351) (0.358)Selected Case CharacteristicsBodily injury (nonauto) 0.106 0.040 -0.007
(0.736) (0.723) (0.725)No bodily injury 0.174 0.098 0.053
(0.699) (0.688) (0.689)Constant 0.576 0.524 1.249
(0.779) (0.766) (1.062)N 149 149 149Number of states 20 20 20Number of counties 47 47 47Prob. > chi-square 0.000 0.000 0.000
Note: *p < 0.05; **p < 0.01. Standard errors in parentheses. Multilevel models are used with random intercepts forlocale and state.Source: Civil Justice Survey of State Courts 2005.
Judge-Jury Difference in Punitive Damages Awards 355

Table A3: Full Multilevel Regression Models of Punitive-Compensatory Ratios (All Cases)
Independent Variables A B C
Compensatory damages (log) -0.061** -0.063** -0.010(0.008) (0.008) (0.022)
Jury trial dummy (1 = yes) — 0.053* 0.352**(0.021) (0.021)
Jury trial ¥ log of compensatory — — -0.062**(0.024)
Selected Case TypesAuto 0.017 0.006 0.004
(0.215) (0.214) (0.213)Premises liability -0.013 -0.003 -0.017
(0.051) (0.051) (0.051)Product liability (incl. asbestos) 0.151 0.146 0.148
(0.086) (0.086) (0.086)Intentional tort 0.013 0.018 0.014
(0.030) (0.030) (0.030)Medical and prof. malpractice -0.013 -0.015 -0.012
(0.042) (0.042) (0.042)Fraud -0.024 -0.017 -0.022
(0.025) (0.025) (0.025)Employment discrim. or dispute -0.015 -0.019 -0.015
(0.031) (0.030) (0.030)Rental/lease agreement -0.011 -0.016 -0.013
(0.057) (0.057) (0.057)Selected Case CharacteristicsBodily injury (nonauto) 0.071 0.063 0.070
(0.218) (0.217) (0.216)No bodily injury 0.088 0.085 0.088
(0.216) (0.215) (0.214)Constant 1.206** 1.178** 0.921**
(0.220) (0.220) (0.240)N 708 708 708Number of states 25 25 25Number of counties 64 64 64Prob. > chi-square 0.000 0.000 0.000
Note: *p < 0.05; **p < 0.01. Standard errors in parentheses. Multilevel models are used with random intercepts forlocale and state.Source: Civil Justice Survey of State Courts 1992–2005.
356 Eisenberg and Heise

Table A4: Full Multilevel Regression Models of Punitive-Compensatory Ratios (2005Cases, Punitive Damages Requested)
Independent Vriables A B C
Compensatory damages(log)
-0.035** -0.040** -0.050(0.013) (0.013) (0.034)
Jury trial dummy (1 = yes) — 0.066* 0.013(0.032) (0.184)
Jury trial ¥ log ofcompensatory
— — 0.011(0.037)
Selected Case TypesAuto -0.007 -0.034 -0.034
(0.147) (0.146) (0.146)Premises liability -0.034 -0.023 -0.017
(0.118) (0.116) (0.118)Product liability (incl.
asbestos)-0.002 -0.022 -0.024(0.156) (0.154) (0.155)
Intentional tort -0.041 -0.046 -0.044(0.056) (0.055) (0.056)
Medical and prof.malpractice
0.084 0.067 0.066(0.081) (0.081) (0.081)
Fraud -0.004 -0.011 -0.012(0.034) (0.034) (0.034)
Employment discrim. ordispute
-0.007 -0.020 -0.021(0.044) (0.044) (0.044)
Rental/lease agreement 0.193 0.196 0.191(0.079) (0.078) (0.080)
Selected Case CharacteristicsBodily injury (nonauto) 0.006 -0.007 -0.010
(0.162) (0.160) (0.161)No bodily injury 0.016 0.001 0.002
(0.154) (0.152) (0.153)Constant 1.171** 1.161** 1.209**
(0.172) (0.170) (0.236)N 149 149 149Number of states 20 20 20Number of counties 47 47 47Prob. > chi-square 0.039 0.013 0.021
Note: *p < 0.05; **p < 0.01. Standard errors in parentheses. Multilevel models are used with random intercepts forlocale and state.Source: Civil Justice Survey of State Courts 2005.
Judge-Jury Difference in Punitive Damages Awards 357