Embed Size (px)
Citation preview

Julius Center.nlJulius Center.nl Health Sciences and Primary Care
Estimating additive interaction between continuous determinants
M.J. Knol, I. van der Tweel, D.E. Grobbee, M.E. Numans, M.I. Geerlings
Julius Center, University Medical Center Utrecht
Center for Biostatistics, Utrecht University
The Netherlands
Julius Center.nlJulius Center.nl Health Sciences and Primary Care
Julius Center.nlJulius Center.nl Health Sciences and Primary Care
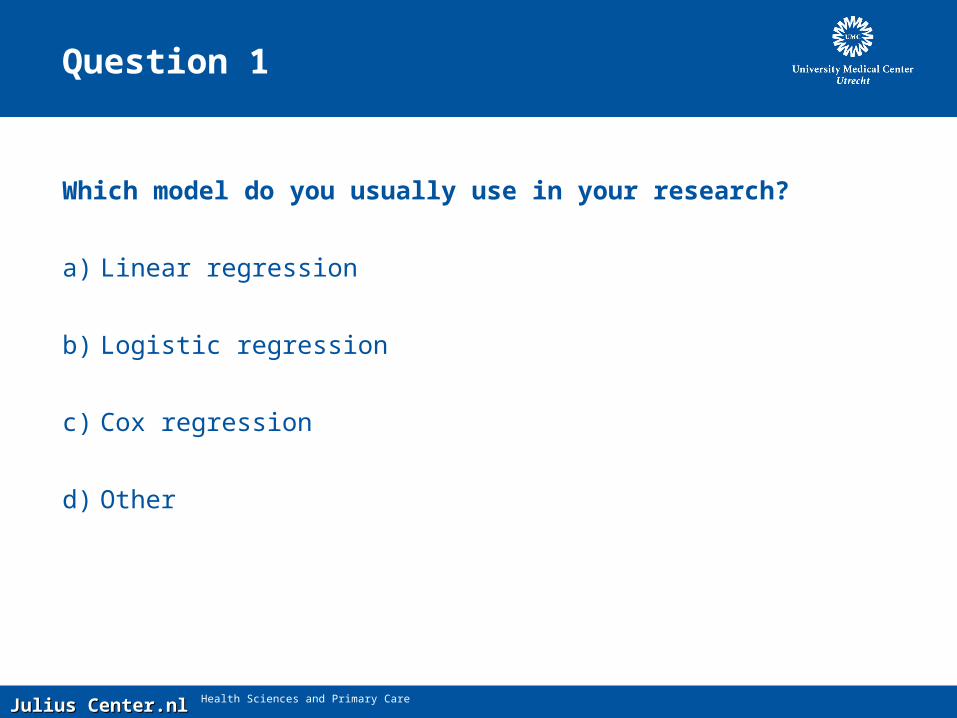
Question 1
Which model do you usually use in your research?
a) Linear regression
b) Logistic regression
c) Cox regression
d) Other

Julius Center.nlJulius Center.nl Health Sciences and Primary Care
Question 2
How do you usually assess interaction in your research?
a) Stratification
b) Product term
c) Never
d) Other
Julius Center.nlJulius Center.nl Health Sciences and Primary Care
Overview
• Background - interaction
• Example dataset
• Calculation of additive and multiplicative interaction
• Interaction in regression analysis
• Additive interaction in logistic regression
– Example
• Additive interaction between continuous determinants
– Formulas and example
• Application
Julius Center.nlJulius Center.nl Health Sciences and Primary Care
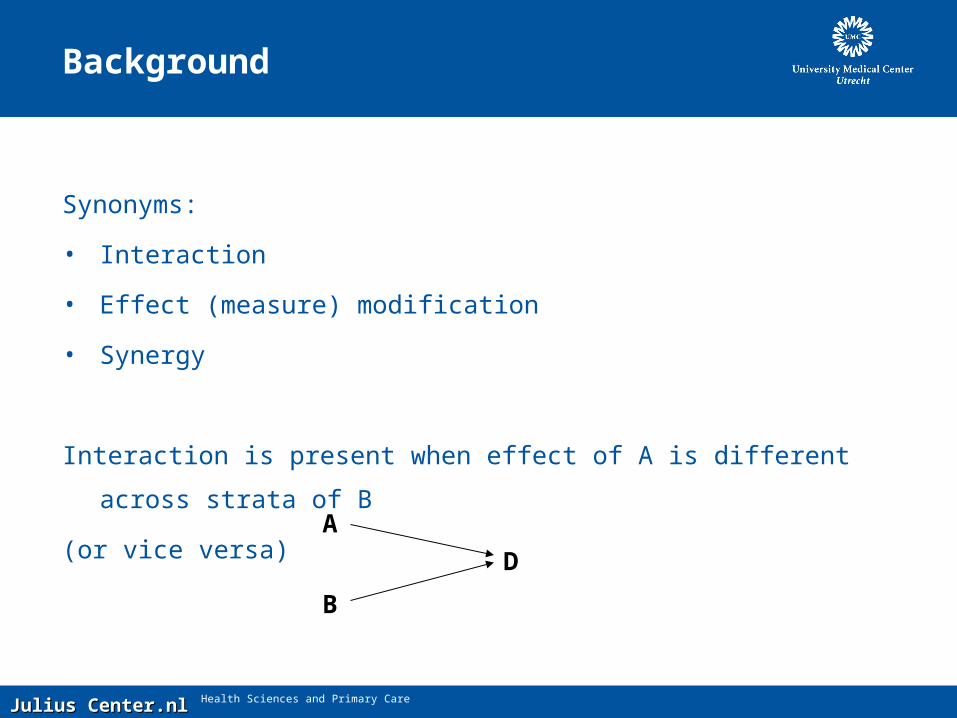
Background
Synonyms:
• Interaction
• Effect (measure) modification
• Synergy
Interaction is present when effect of A is different across strata of B
(or vice versa)A
B
D
Julius Center.nlJulius Center.nl Health Sciences and Primary Care
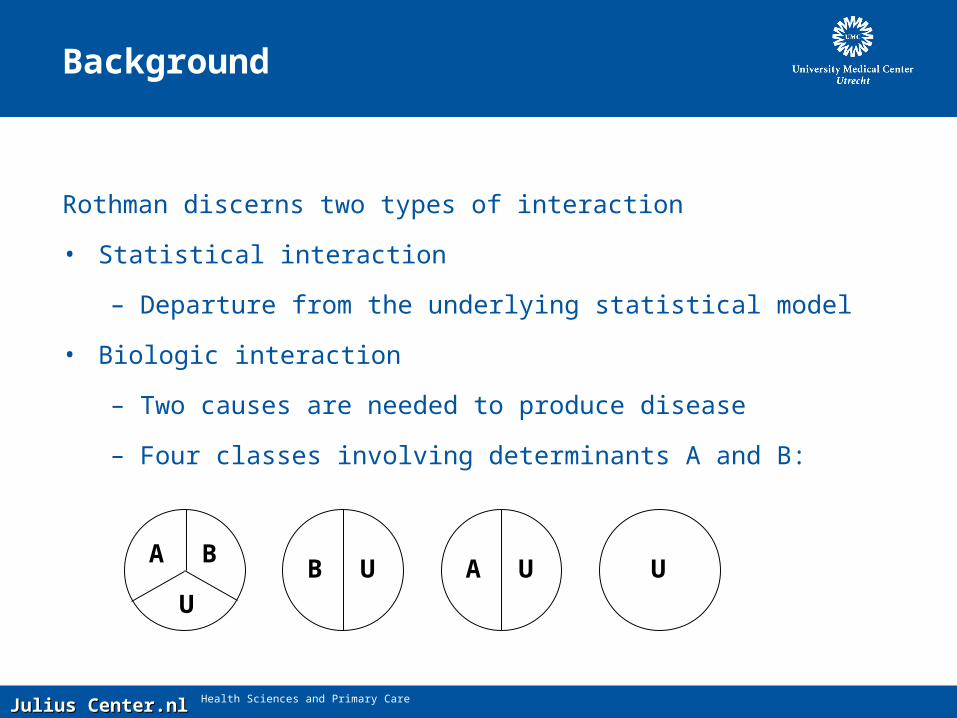
Background
Rothman discerns two types of interaction
• Statistical interaction
– Departure from the underlying statistical model
• Biologic interaction
– Two causes are needed to produce disease
– Four classes involving determinants A and B:
A
U
BUAUB U
Julius Center.nlJulius Center.nl Health Sciences and Primary Care
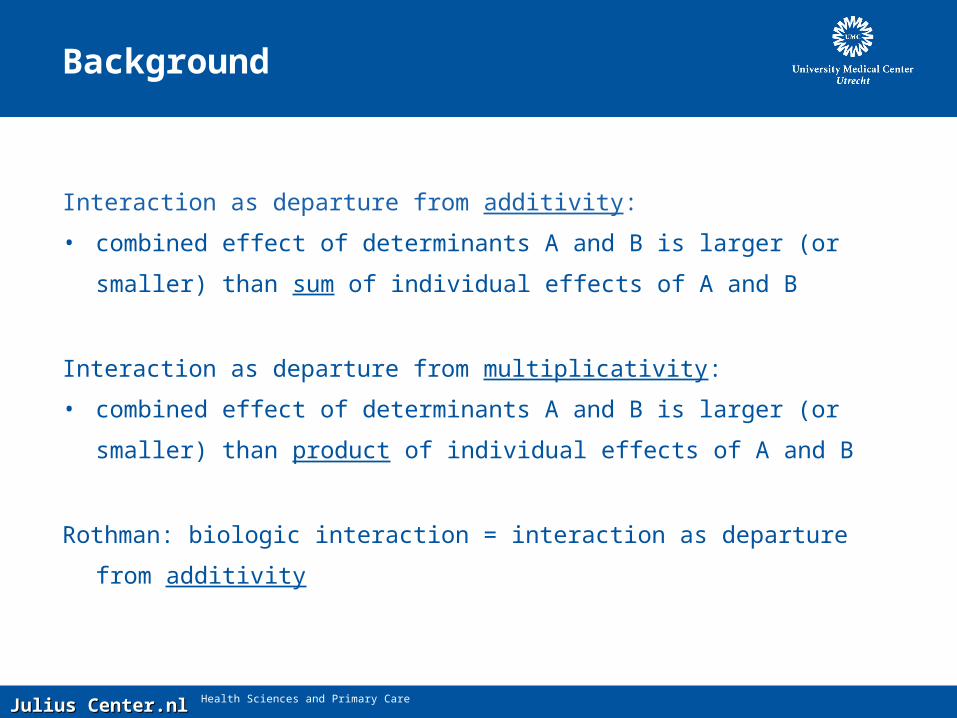
Background
Interaction as departure from additivity:
• combined effect of determinants A and B is larger (or smaller) than
sum of individual effects of A and B
Interaction as departure from multiplicativity:
• combined effect of determinants A and B is larger (or smaller) than
product of individual effects of A and B
Rothman: biologic interaction = interaction as departure from additivity
Julius Center.nlJulius Center.nl Health Sciences and Primary Care
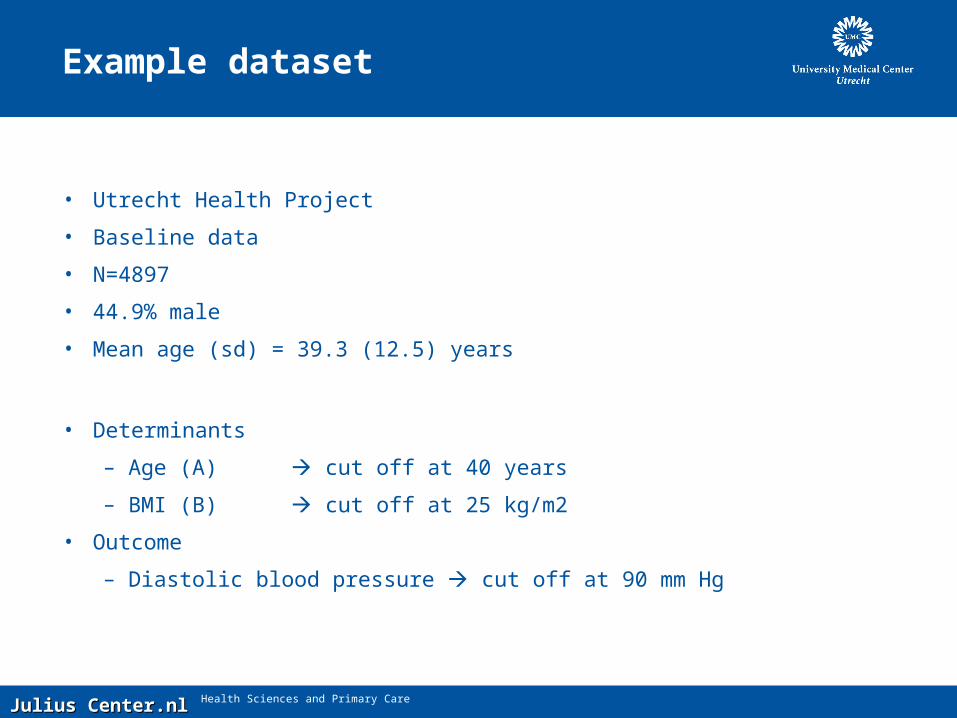
Example dataset
• Utrecht Health Project
• Baseline data
• N=4897
• 44.9% male
• Mean age (sd) = 39.3 (12.5) years
• Determinants
– Age (A) cut off at 40 years
– BMI (B) cut off at 25 kg/m2
• Outcome
– Diastolic blood pressure cut off at 90 mm Hg
Julius Center.nlJulius Center.nl Health Sciences and Primary Care
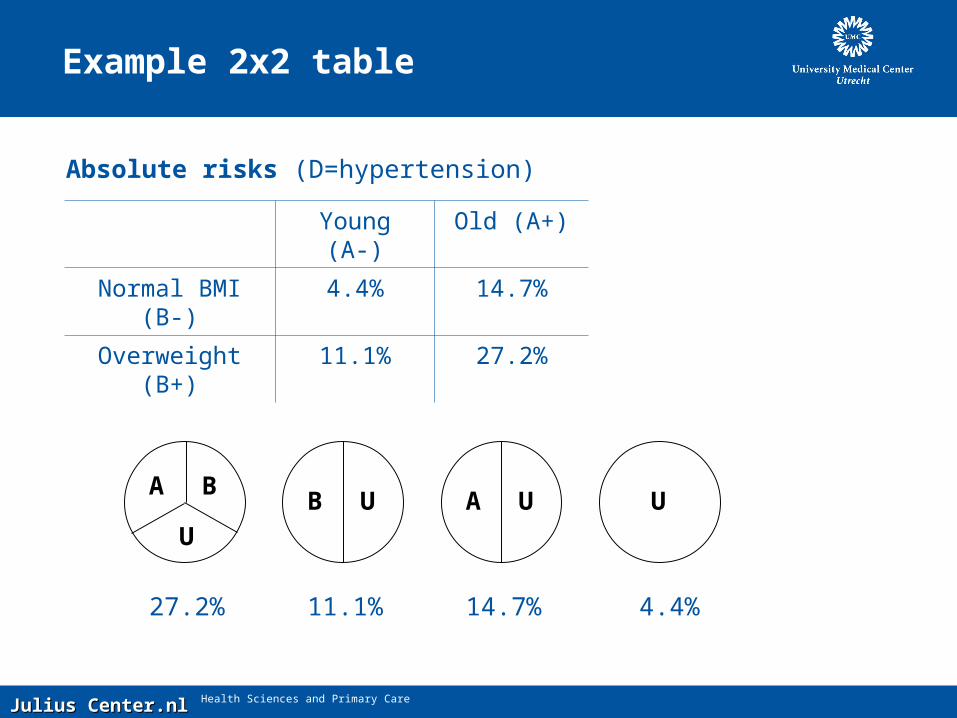
Example 2x2 table
Absolute risks (D=hypertension)
Young (A-) Old (A+)
Normal BMI (B-) 4.4% 14.7%
Overweight (B+) 11.1% 27.2%
A
U
BUAUB U
27.2% 11.1% 14.7% 4.4%

Julius Center.nlJulius Center.nl Health Sciences and Primary Care
Example 2x2 table
Absolute risks (D=hypertension)
Young (A-) Old (A+)
Normal BMI (B-) 4.4% 14.7%
Overweight (B+) 11.1% 27.2%
Interaction as departure from additivity:
• (27.2 - 4.4) ~= (14.7 - 4.4) + (11.1 - 4.4) 22.8 > 17.0
• Old subjects with overweight have excess risk for hypertension
• Risk difference
Julius Center.nlJulius Center.nl Health Sciences and Primary Care
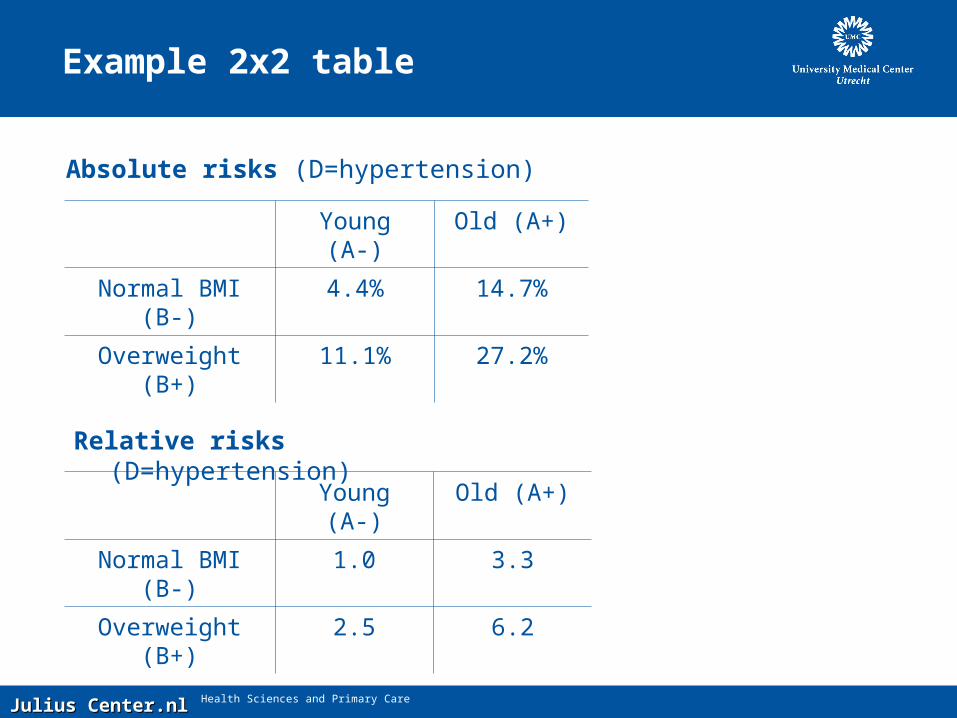
Example 2x2 table
Relative risks (D=hypertension)
Young (A-) Old (A+)
Normal BMI (B-) 1.0 3.3
Overweight (B+) 2.5 6.2
Young (A-) Old (A+)
Normal BMI (B-) 4.4% 14.7%
Overweight (B+) 11.1% 27.2%
Absolute risks (D=hypertension)
Julius Center.nlJulius Center.nl Health Sciences and Primary Care
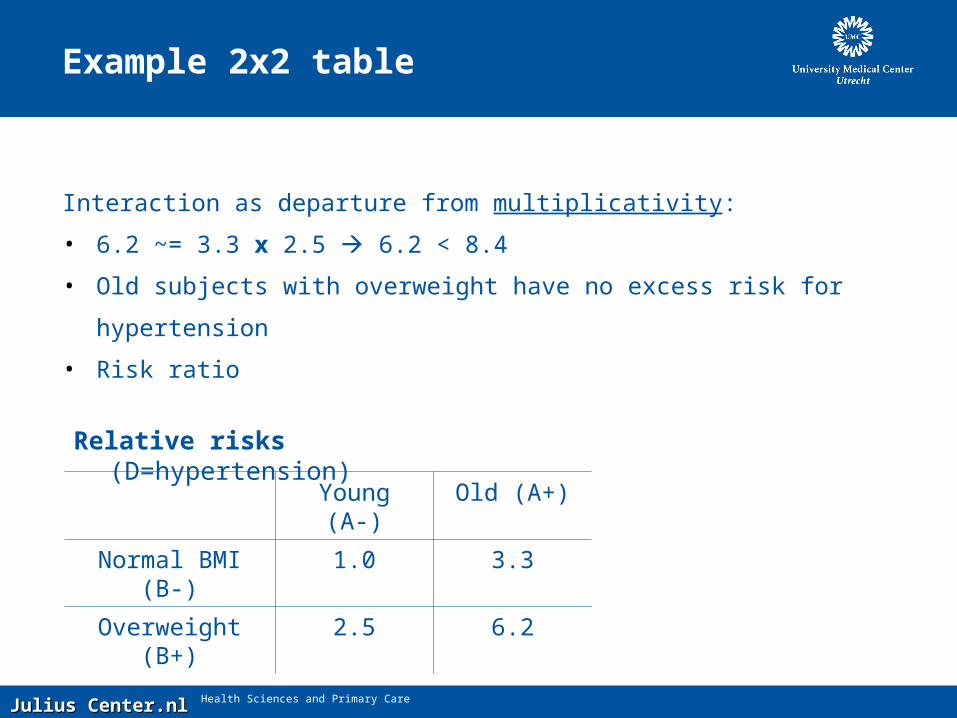
Example 2x2 table
Relative risks (D=hypertension)
Young (A-) Old (A+)
Normal BMI (B-) 1.0 3.3
Overweight (B+) 2.5 6.2
Interaction as departure from multiplicativity:
• 6.2 ~= 3.3 x 2.5 6.2 < 8.4
• Old subjects with overweight have no excess risk for hypertension
• Risk ratio
Julius Center.nlJulius Center.nl Health Sciences and Primary Care
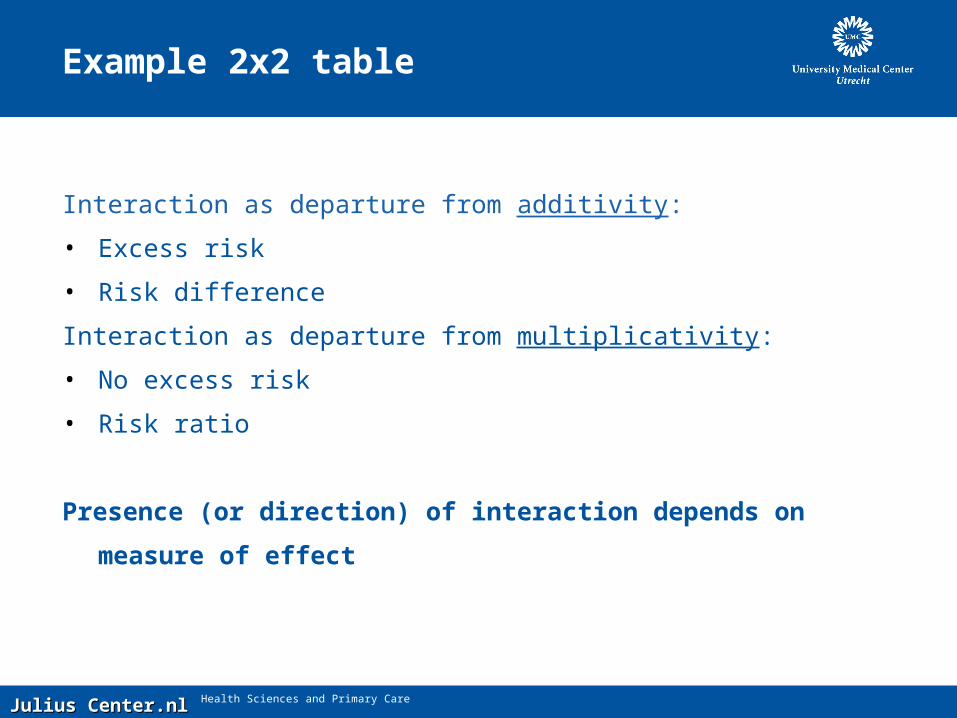
Example 2x2 table
Interaction as departure from additivity:
• Excess risk
• Risk difference
Interaction as departure from multiplicativity:
• No excess risk
• Risk ratio
Presence (or direction) of interaction depends on measure of effect
Julius Center.nlJulius Center.nl Health Sciences and Primary Care
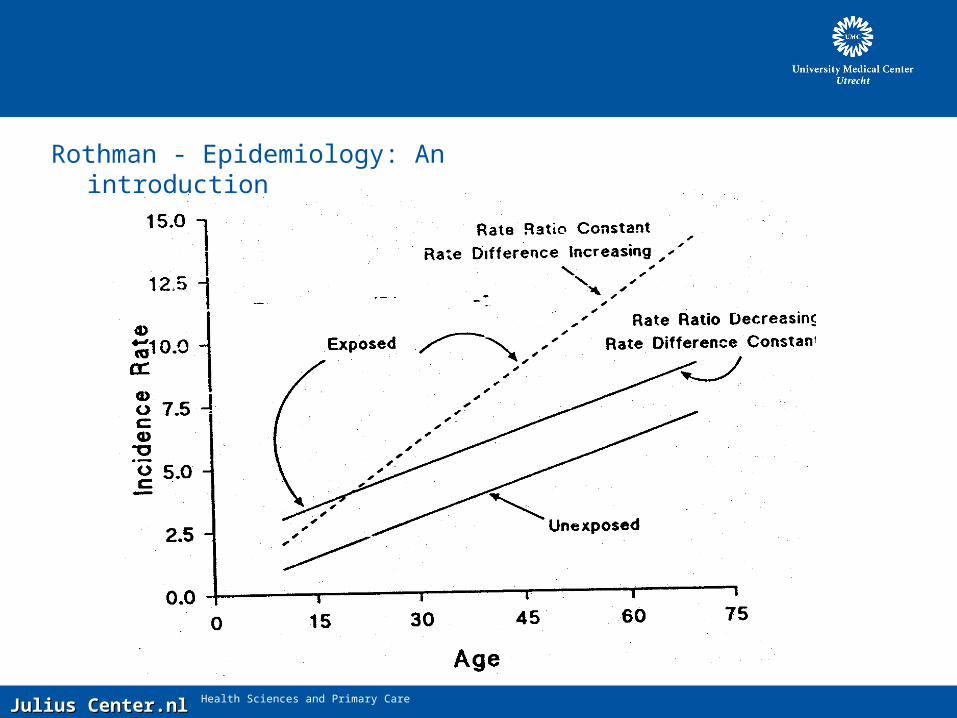
Rothman - Epidemiology: An introduction
Julius Center.nlJulius Center.nl Health Sciences and Primary Care
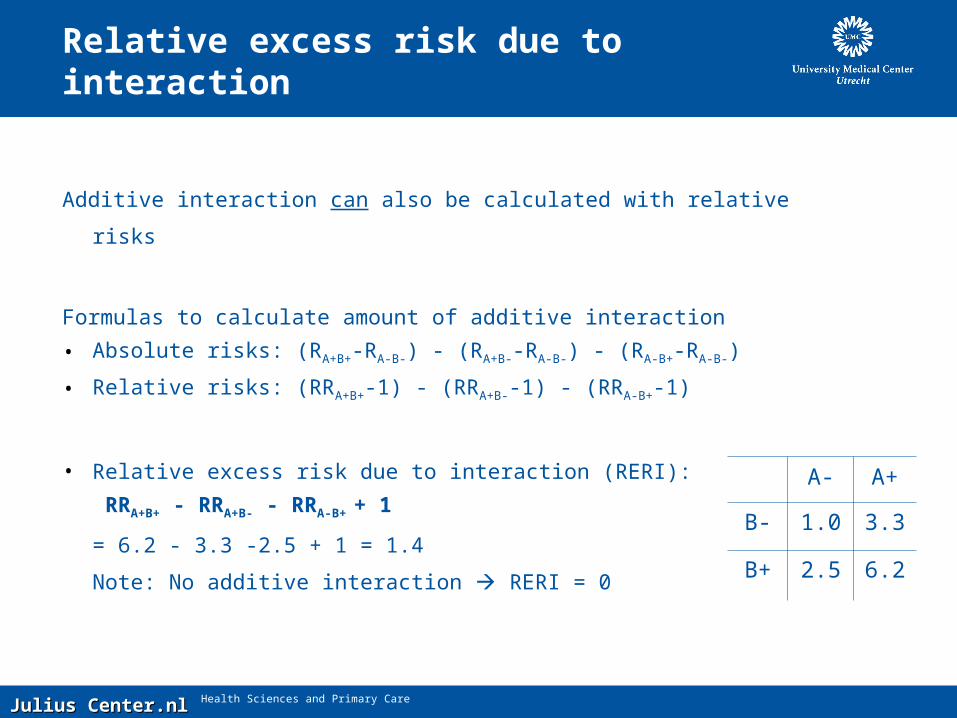
Relative excess risk due to interaction
A- A+
B- 1.0 3.3
B+ 2.5 6.2
Additive interaction can also be calculated with relative risks
Formulas to calculate amount of additive interaction
• Absolute risks: (RA+B+-RA-B-) - (RA+B--RA-B-) - (RA-B+-RA-B-)
• Relative risks: (RRA+B+-1) - (RRA+B--1) - (RRA-B+-1)
• Relative excess risk due to interaction (RERI):
RRA+B+ - RRA+B- - RRA-B+ + 1
= 6.2 - 3.3 -2.5 + 1 = 1.4
Note: No additive interaction RERI = 0
Julius Center.nlJulius Center.nl Health Sciences and Primary Care
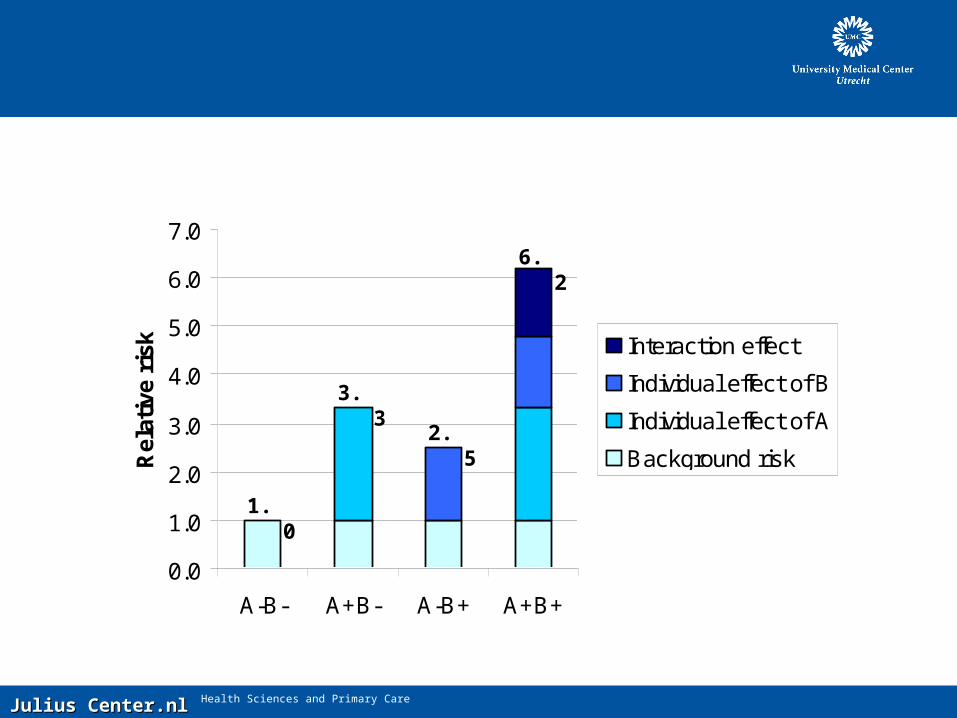
0.0
1.0
2.0
3.0
4.0
5.0
6.0
7.0
A-B- A+B- A-B+ A+B+
Rel
ativ
e ri
sk Interaction effect
Individual effect of B
Individual effect of A
Background risk
1.0
2.5
3.3
6.2
Julius Center.nlJulius Center.nl Health Sciences and Primary Care
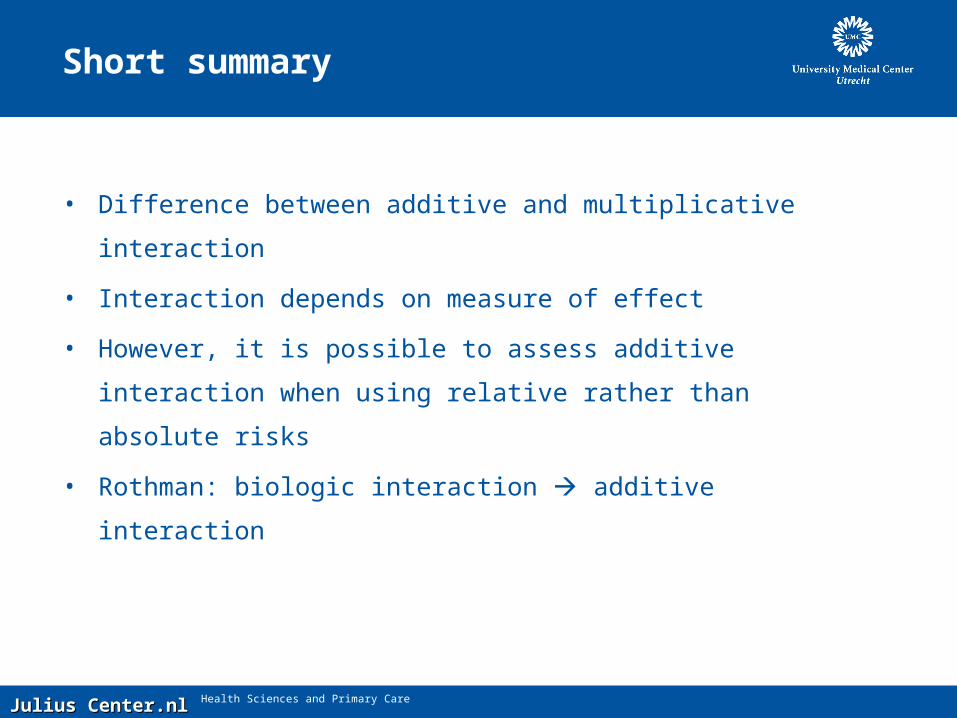
Short summary
• Difference between additive and multiplicative interaction
• Interaction depends on measure of effect
• However, it is possible to assess additive interaction when using
relative rather than absolute risks
• Rothman: biologic interaction additive interaction
Julius Center.nlJulius Center.nl Health Sciences and Primary Care
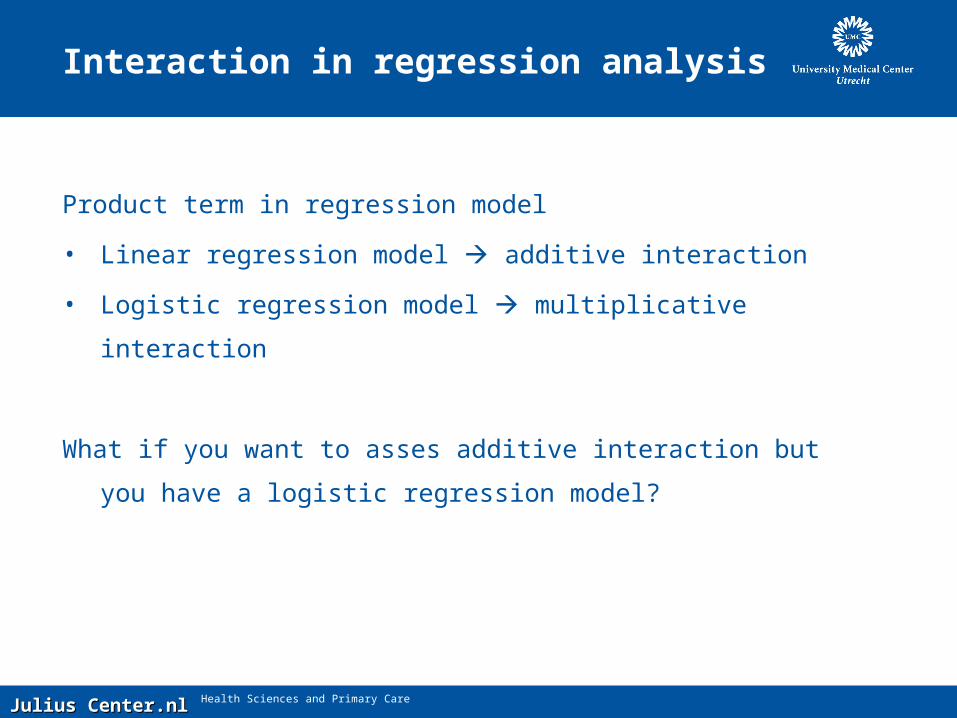
Interaction in regression analysis
Product term in regression model
• Linear regression model additive interaction
• Logistic regression model multiplicative interaction
What if you want to asses additive interaction but you have a logistic
regression model?
Julius Center.nlJulius Center.nl Health Sciences and Primary Care
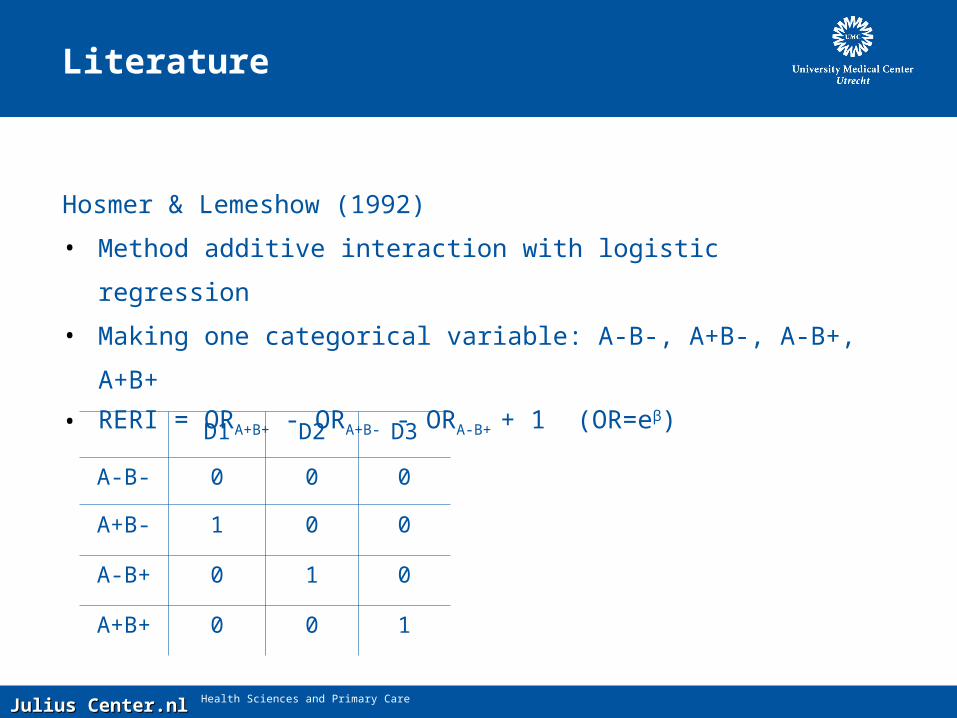
Literature
Hosmer & Lemeshow (1992)
• Method additive interaction with logistic regression
• Making one categorical variable: A-B-, A+B-, A-B+, A+B+
• RERI = ORA+B+ - ORA+B- - ORA-B+ + 1 (OR=eβ)
D1 D2 D3
A-B- 0 0 0
A+B- 1 0 0
A-B+ 0 1 0
A+B+ 0 0 1
Julius Center.nlJulius Center.nl Health Sciences and Primary Care
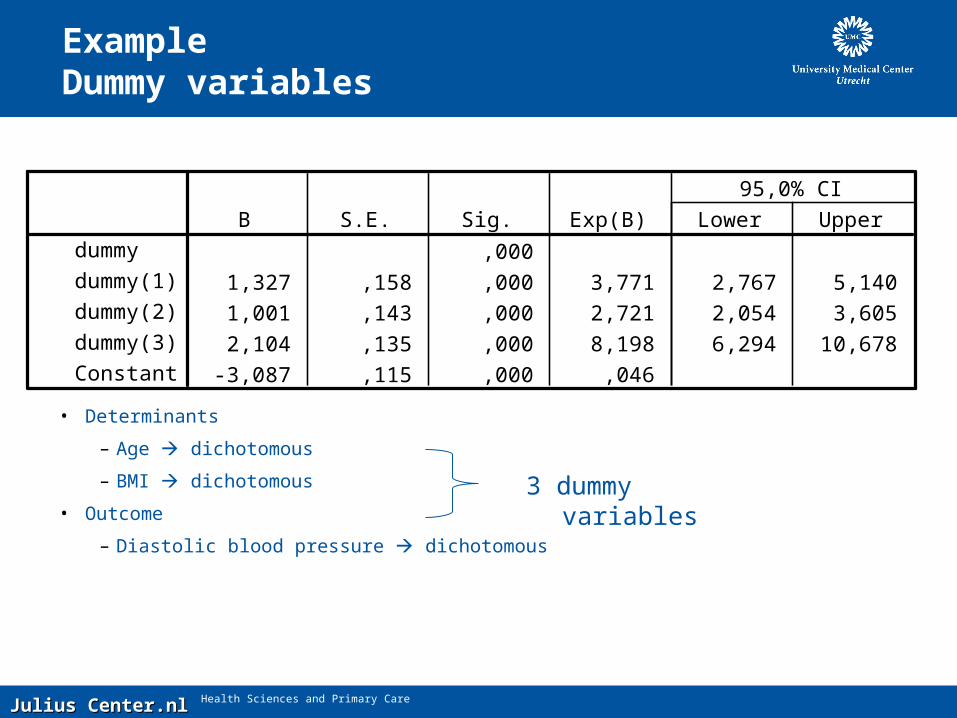
• Determinants
– Age dichotomous
– BMI dichotomous
• Outcome
– Diastolic blood pressure dichotomous
,000
1,327 ,158 ,000 3,771 2,767 5,140
1,001 ,143 ,000 2,721 2,054 3,605
2,104 ,135 ,000 8,198 6,294 10,678
-3,087 ,115 ,000 ,046
dummy
dummy(1)
dummy(2)
dummy(3)
Constant
B S.E. Sig. Exp(B) Lower Upper
95,0% CI
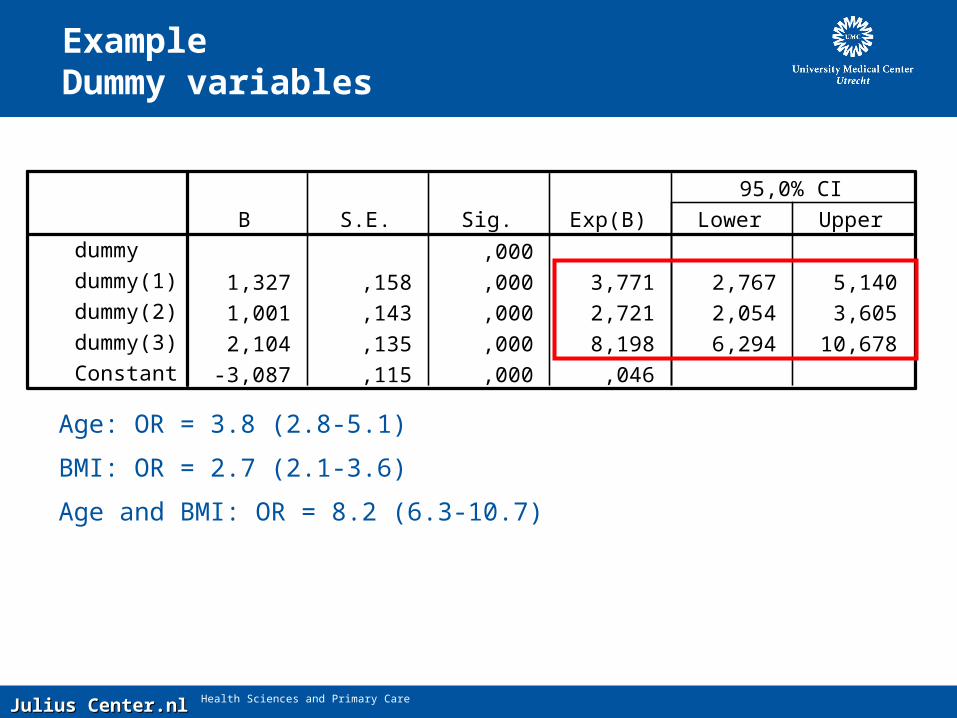
Example Dummy variables
3 dummy variables
Julius Center.nlJulius Center.nl Health Sciences and Primary Care
,000
1,327 ,158 ,000 3,771 2,767 5,140
1,001 ,143 ,000 2,721 2,054 3,605
2,104 ,135 ,000 8,198 6,294 10,678
-3,087 ,115 ,000 ,046
dummy
dummy(1)
dummy(2)
dummy(3)
Constant
B S.E. Sig. Exp(B) Lower Upper
95,0% CI
Example Dummy variables
Age: OR = 3.8 (2.8-5.1)
BMI: OR = 2.7 (2.1-3.6)
Age and BMI: OR = 8.2 (6.3-10.7)

Julius Center.nlJulius Center.nl Health Sciences and Primary Care
,000
1,327 ,158 ,000 3,771 2,767 5,140
1,001 ,143 ,000 2,721 2,054 3,605
2,104 ,135 ,000 8,198 6,294 10,678
-3,087 ,115 ,000 ,046
dummy
dummy(1)
dummy(2)
dummy(3)
Constant
B S.E. Sig. Exp(B) Lower Upper
95,0% CI
Example Dummy variables
RERI = ORA+B+ - ORA+B- - ORA-B+ + 1 = 8.2 – 3.8 – 2.7 + 1 = 2.7
Excess risk due to interaction is 2.7
Combined effect of A and B is 2.7 more than sum of individual effects
Significant ‘positive’ interaction on additive scale

Julius Center.nlJulius Center.nl Health Sciences and Primary Care
However…
• Only for dichotomous determinants, not for continuous ones
Julius Center.nlJulius Center.nl Health Sciences and Primary Care
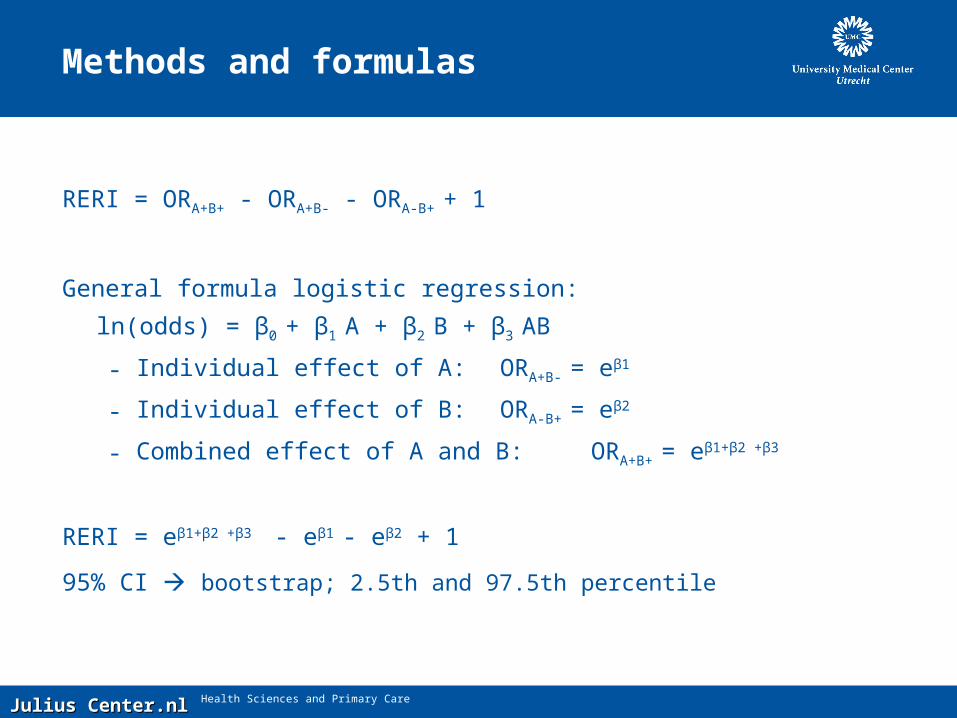
Methods and formulas
RERI = ORA+B+ - ORA+B- - ORA-B+ + 1
General formula logistic regression:
ln(odds) = β0 + β1 A + β2 B + β3 AB
- Individual effect of A: ORA+B- = eβ1
- Individual effect of B: ORA-B+ = eβ2
- Combined effect of A and B: ORA+B+ = eβ1+β2 +β3
RERI = eβ1+β2 +β3 - eβ1
- eβ2 + 1
95% CI bootstrap; 2.5th and 97.5th percentile
Julius Center.nlJulius Center.nl Health Sciences and Primary Care
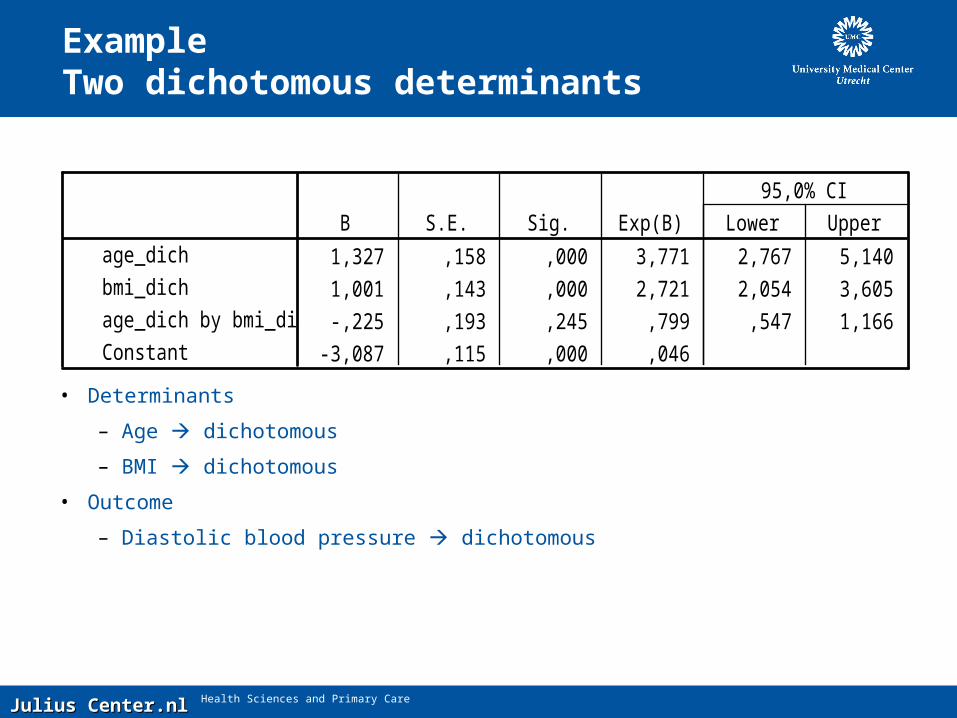
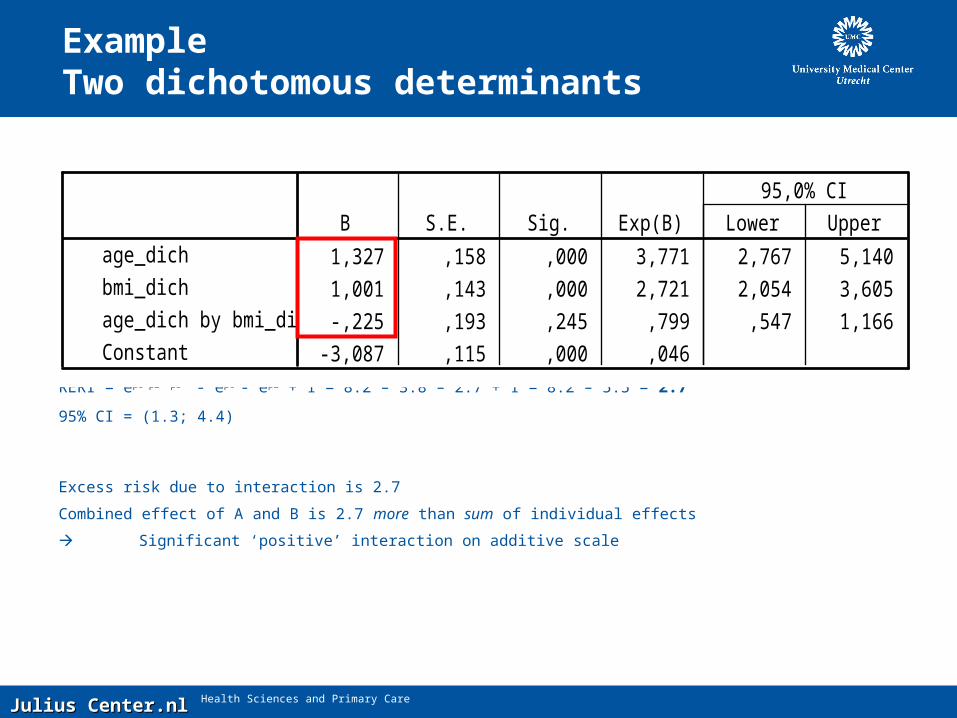
Example Two dichotomous determinants
• Determinants
– Age dichotomous
– BMI dichotomous
• Outcome
– Diastolic blood pressure dichotomous
1,327 ,158 ,000 3,771 2,767 5,140
1,001 ,143 ,000 2,721 2,054 3,605
-,225 ,193 ,245 ,799 ,547 1,166
-3,087 ,115 ,000 ,046
age_dich
bmi_dich
age_dich by bmi_dich
Constant
B S.E. Sig. Exp(B) Lower Upper
95,0% CI
Julius Center.nlJulius Center.nl Health Sciences and Primary Care
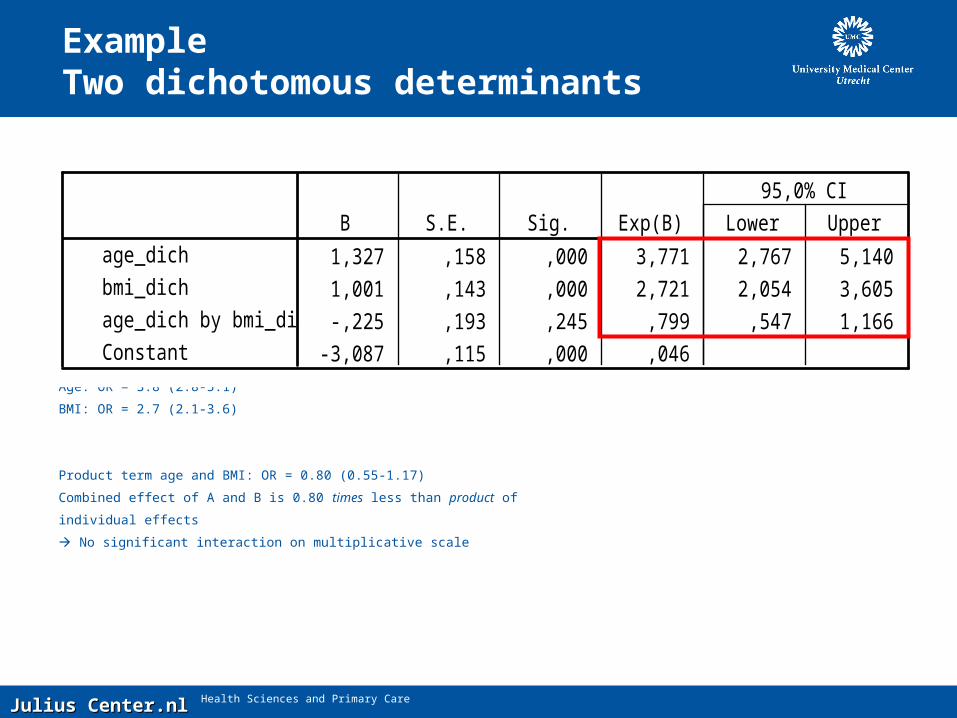
Example Two dichotomous determinants
Age: OR = 3.8 (2.8-5.1)
BMI: OR = 2.7 (2.1-3.6)
Product term age and BMI: OR = 0.80 (0.55-1.17)
Combined effect of A and B is 0.80 times less than product of
individual effects
No significant interaction on multiplicative scale
1,327 ,158 ,000 3,771 2,767 5,140
1,001 ,143 ,000 2,721 2,054 3,605
-,225 ,193 ,245 ,799 ,547 1,166
-3,087 ,115 ,000 ,046
age_dich
bmi_dich
age_dich by bmi_dich
Constant
B S.E. Sig. Exp(B) Lower Upper
95,0% CI
Julius Center.nlJulius Center.nl Health Sciences and Primary Care
Example Two dichotomous determinants
RERI = eβ1+β2 +β3 - eβ1
- eβ2 + 1 = 8.2 – 3.8 – 2.7 + 1 = 8.2 – 5.5 = 2.7
95% CI = (1.3; 4.4)
Excess risk due to interaction is 2.7
Combined effect of A and B is 2.7 more than sum of individual effects
Significant ‘positive’ interaction on additive scale
1,327 ,158 ,000 3,771 2,767 5,140
1,001 ,143 ,000 2,721 2,054 3,605
-,225 ,193 ,245 ,799 ,547 1,166
-3,087 ,115 ,000 ,046
age_dich
bmi_dich
age_dich by bmi_dich
Constant
B S.E. Sig. Exp(B) Lower Upper
95,0% CI
Julius Center.nlJulius Center.nl Health Sciences and Primary Care
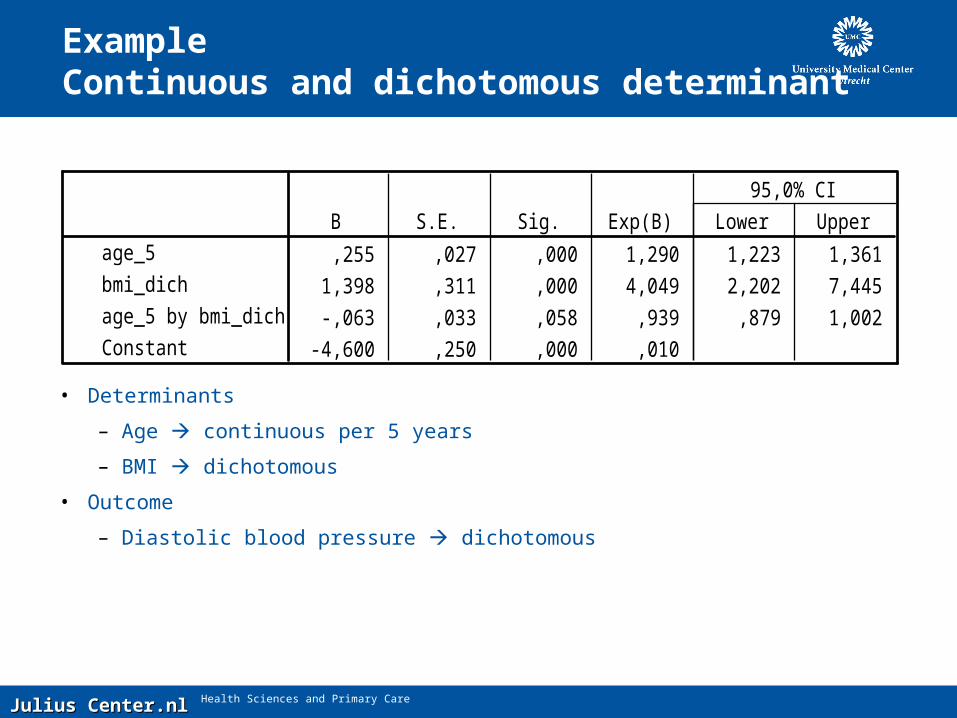
Example Continuous and dichotomous determinant
,255 ,027 ,000 1,290 1,223 1,361
1,398 ,311 ,000 4,049 2,202 7,445
-,063 ,033 ,058 ,939 ,879 1,002
-4,600 ,250 ,000 ,010
age_5
bmi_dich
age_5 by bmi_dich
Constant
B S.E. Sig. Exp(B) Lower Upper
95,0% CI
• Determinants
– Age continuous per 5 years
– BMI dichotomous
• Outcome
– Diastolic blood pressure dichotomous
Julius Center.nlJulius Center.nl Health Sciences and Primary Care
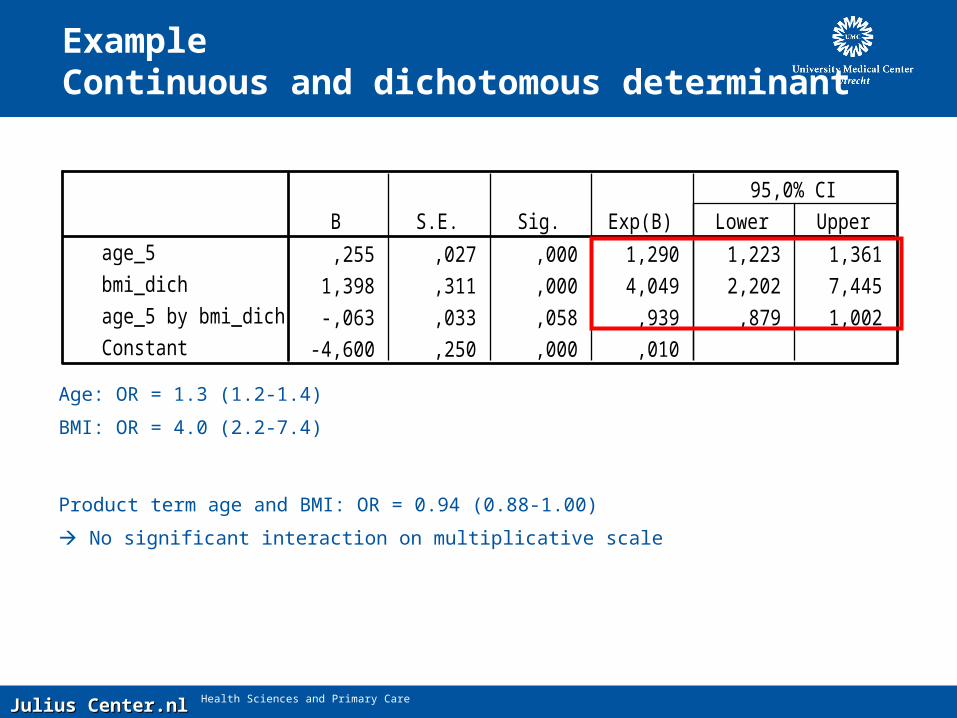
Example Continuous and dichotomous determinant
,255 ,027 ,000 1,290 1,223 1,361
1,398 ,311 ,000 4,049 2,202 7,445
-,063 ,033 ,058 ,939 ,879 1,002
-4,600 ,250 ,000 ,010
age_5
bmi_dich
age_5 by bmi_dich
Constant
B S.E. Sig. Exp(B) Lower Upper
95,0% CI
Age: OR = 1.3 (1.2-1.4)
BMI: OR = 4.0 (2.2-7.4)
Product term age and BMI: OR = 0.94 (0.88-1.00)
No significant interaction on multiplicative scale
Julius Center.nlJulius Center.nl Health Sciences and Primary Care
,255 ,027 ,000 1,290 1,223 1,361
1,398 ,311 ,000 4,049 2,202 7,445
-,063 ,033 ,058 ,939 ,879 1,002
-4,600 ,250 ,000 ,010
age_5
bmi_dich
age_5 by bmi_dich
Constant
B S.E. Sig. Exp(B) Lower Upper
95,0% CI
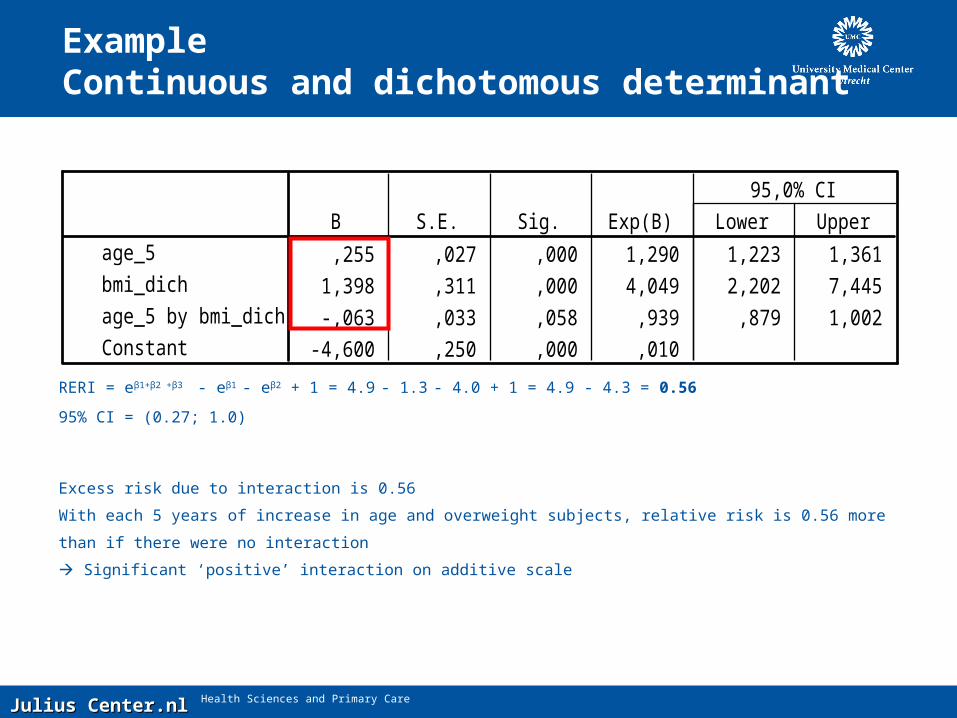
Example Continuous and dichotomous determinant
RERI = eβ1+β2 +β3 - eβ1
- eβ2 + 1 = 4.9 - 1.3 - 4.0 + 1 = 4.9 - 4.3 = 0.56
95% CI = (0.27; 1.0)
Excess risk due to interaction is 0.56
With each 5 years of increase in age and overweight subjects, relative risk is 0.56 more than if there were no
interaction
Significant ‘positive’ interaction on additive scale
Julius Center.nlJulius Center.nl Health Sciences and Primary Care
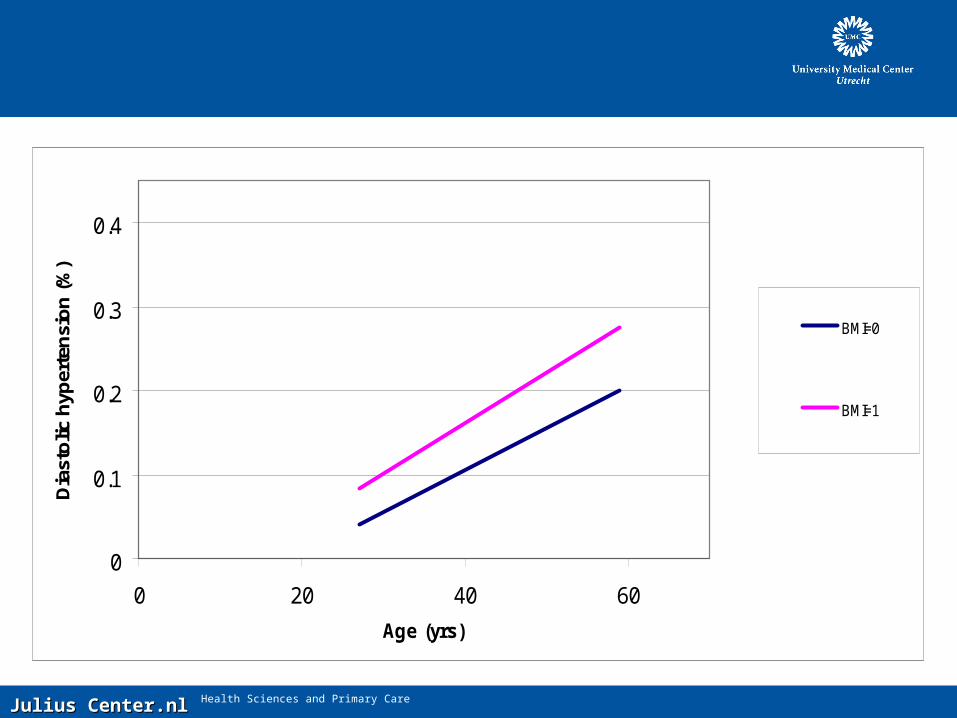
0
0.1
0.2
0.3
0.4
0 20 40 60
Age (yrs)
Dia
sto
lic h
yper
ten
sio
n (
%)
BMI=0
BMI=1

Julius Center.nlJulius Center.nl Health Sciences and Primary Care
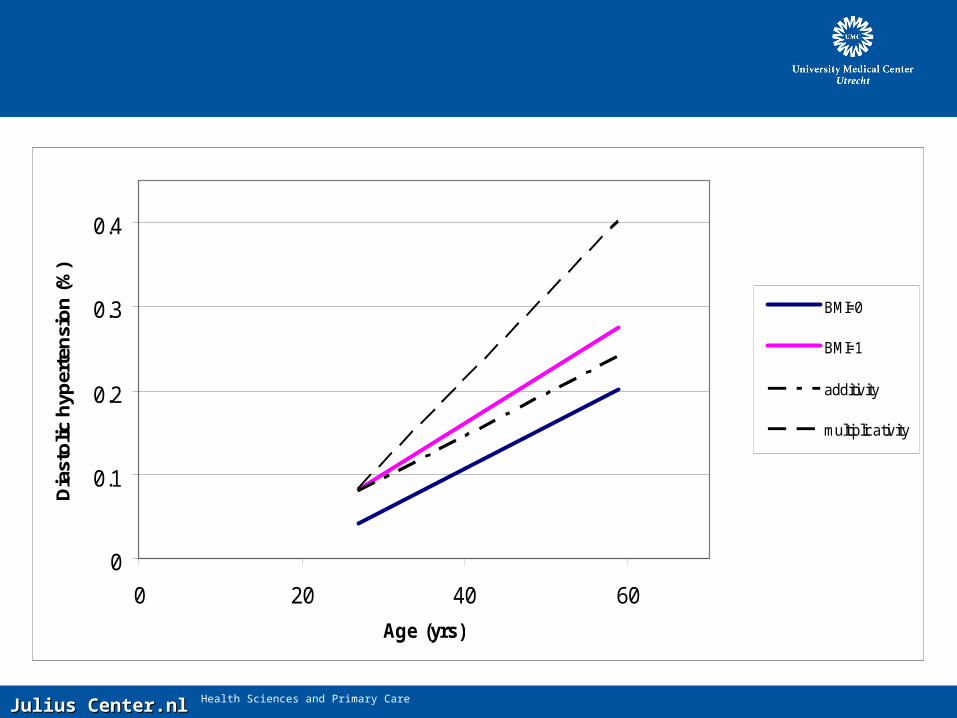
0
0.1
0.2
0.3
0.4
0 20 40 60
Age (yrs)
Dia
sto
lic h
yper
ten
sio
n (
%)
BMI=0
BMI=1
additivity
Julius Center.nlJulius Center.nl Health Sciences and Primary Care
0
0.1
0.2
0.3
0.4
0 20 40 60
Age (yrs)
Dia
sto
lic h
yper
ten
sio
n (
%)
BMI=0
BMI=1
additivity
multiplicativity

Julius Center.nlJulius Center.nl Health Sciences and Primary Care
Application of methods
Other measures of additive interaction
• Proportion attributable to interaction (AP)
• Synergy index (S)
Spreadsheet on www.juliuscenter.nl
• Regression coefficients
• RERI, AP, S
• Bootstrap script S-PLUS
BARR
RERIAP
11
1
BABA
BA
RRRR
RRS

Julius Center.nlJulius Center.nl Health Sciences and Primary Care
Conclusion
• Rothman’s theory about biologic interaction as starting point
• Study provides tools to estimate additive interaction and its
uncertainty

Julius Center.nlJulius Center.nl Health Sciences and Primary Care
Estimating additive interaction between continuous determinants
M.J. Knol, I. van der Tweel, D.E. Grobbee, M.I. Geerlings
Julius Center for Health Sciences and Primary Care
University Medical Center Utrecht
The Netherlands
Julius Center.nlJulius Center.nl Health Sciences and Primary Care
Julius Center.nlJulius Center.nl Health Sciences and Primary Care
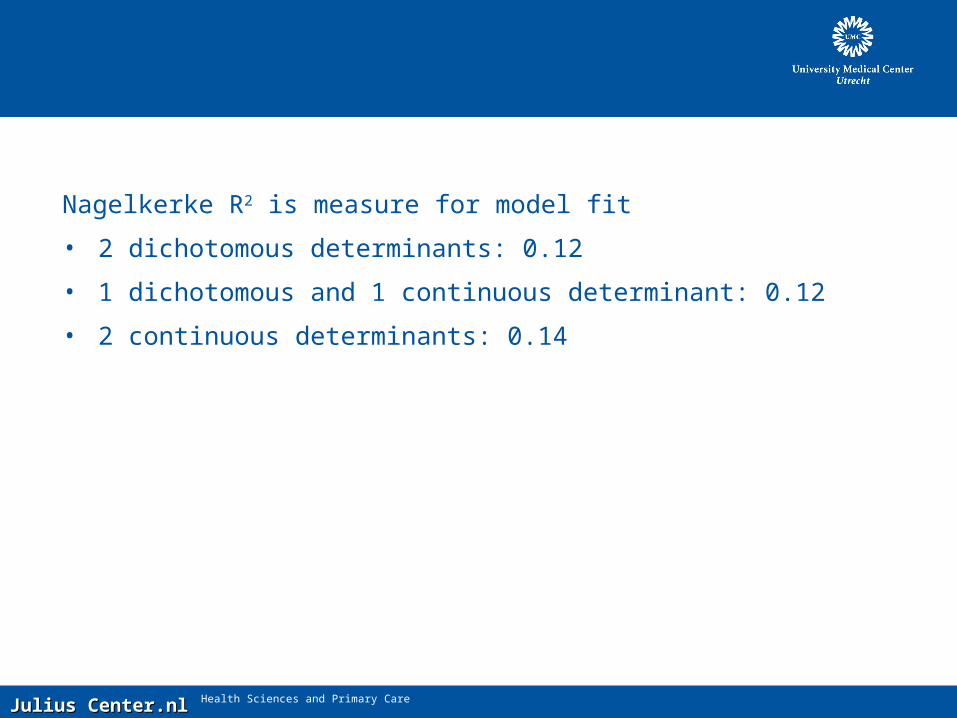
Nagelkerke R2 is measure for model fit
• 2 dichotomous determinants: 0.12
• 1 dichotomous and 1 continuous determinant: 0.12
• 2 continuous determinants: 0.14