Embed Size (px)
Citation preview
July 2001 Snowmass
A New Measurement of from KTeV
• Introduction• The KTeV Detector Analysis of 1997 Data• Update of Previous Result• Conclusions
E. Blucher, Chicago
The KTeV Collaboration: Arizona, Chicago, Colorado, Elmhurst, Fermilab, Osaka, Rice, Rutgers, UCLA, UCSD, Virginia, Wisconsin
1
/
/61
/Re0000
sL
sL
KK
KK
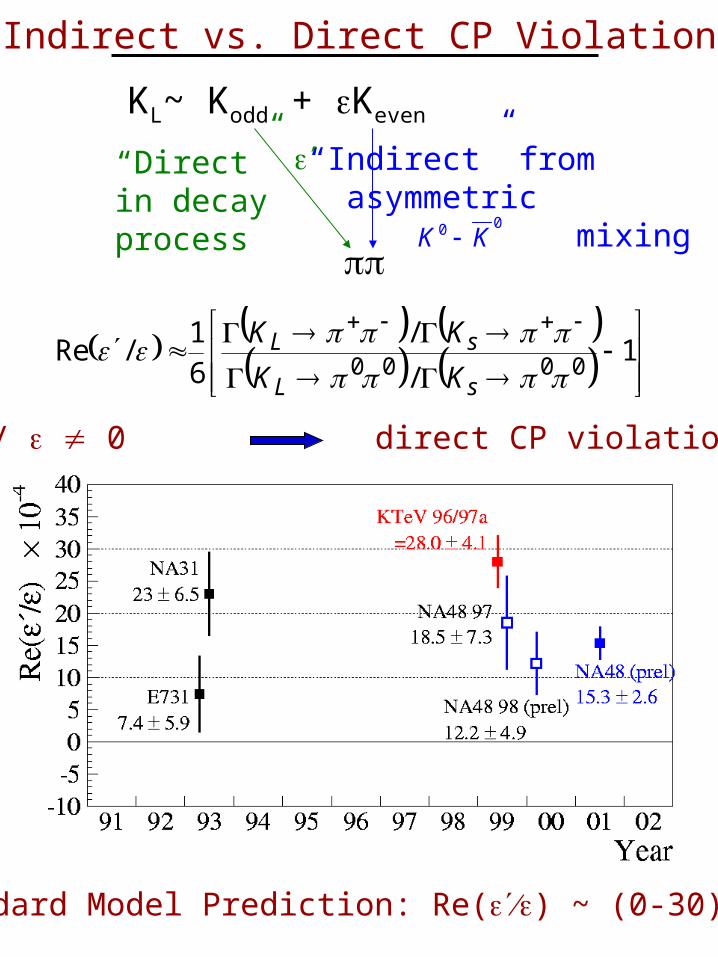
/ 0 direct CP violation
KL~ Kodd + Keven
“Direct”in decayprocess
“Indirect” from asymmetric mixing
Indirect vs. Direct CP Violation
00K K
Standard Model Prediction: Re() ~ (0-30)10-4
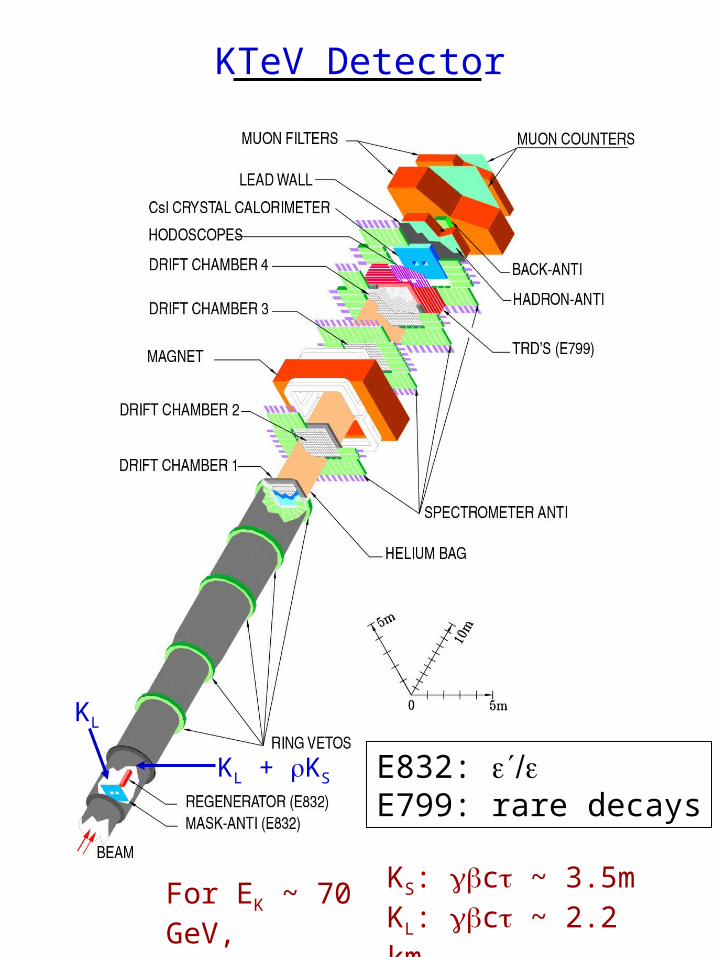
KTeV Detector
KL + KS
KL
For EK ~ 70 GeV, KS: c ~ 3.5mKL: c ~ 2.2 km
E832: E799: rare decays
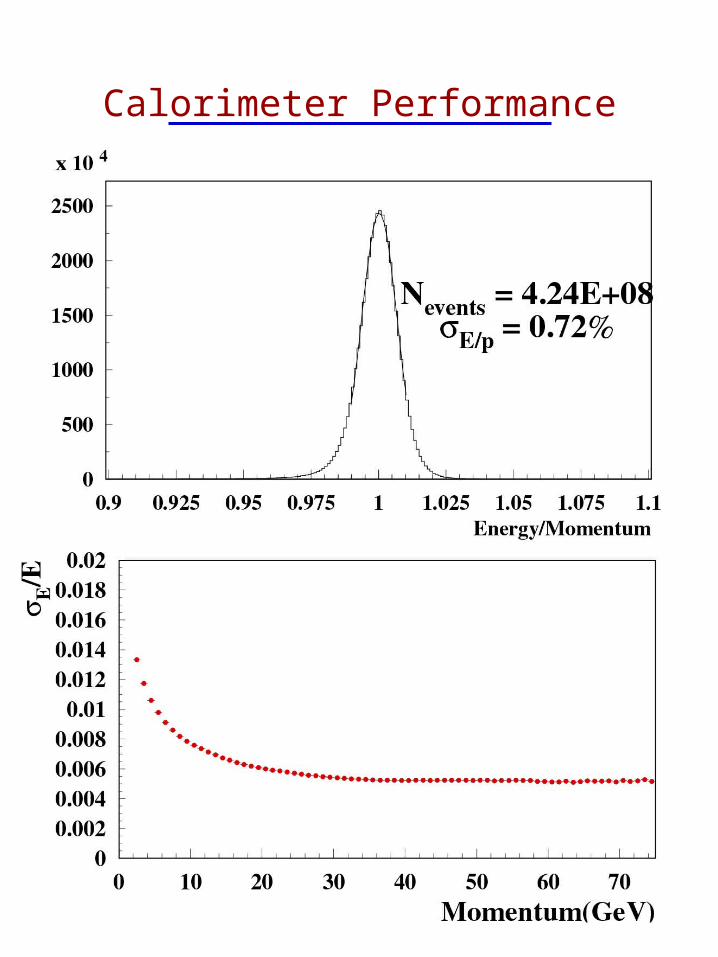
Calorimeter Performance
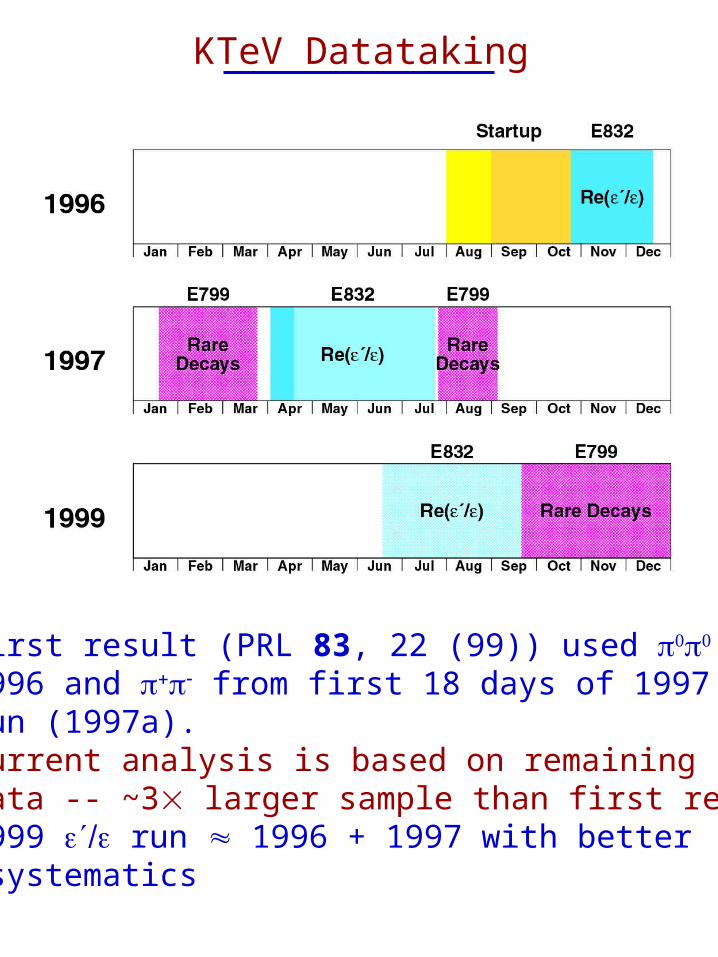
KTeV Datataking
• First result (PRL 83, 22 (99)) used from 1996 and from first 18 days of 1997 E832 run (1997a).• Current analysis is based on remaining 1997 data -- ~3 larger sample than first result.• 1999 run 1996 + 1997 with better systematics
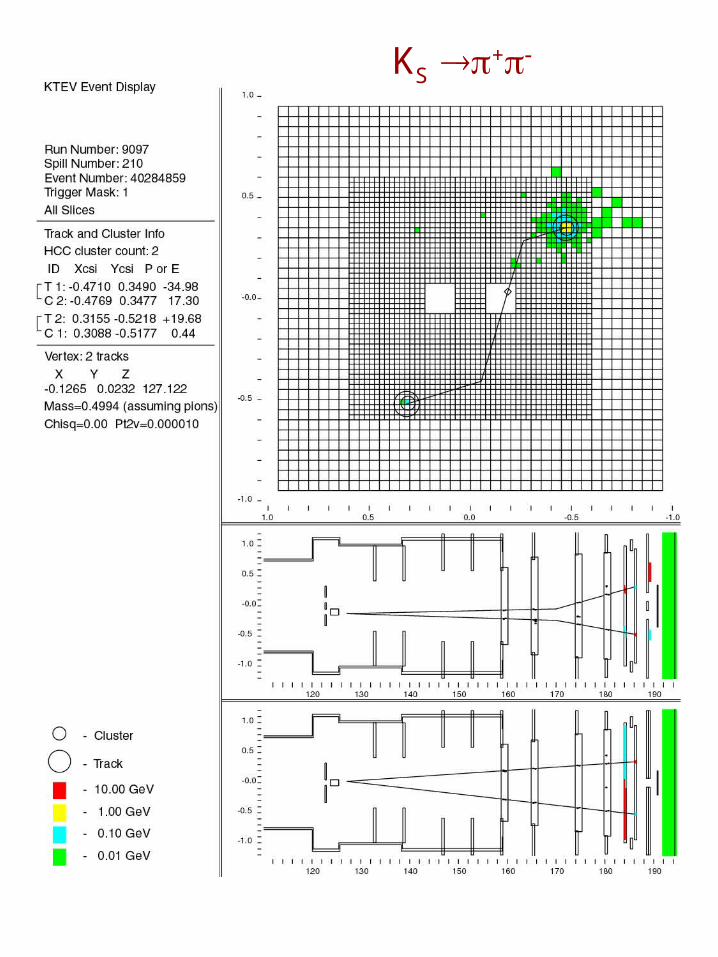
KS +
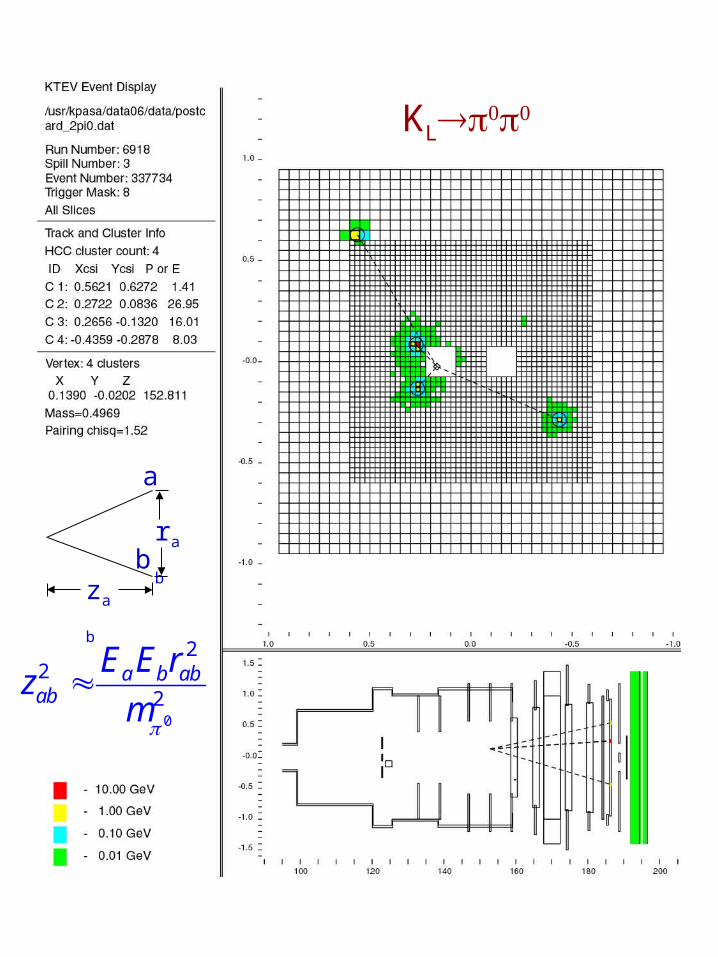
rab
zab
a
b
0
22
2a b ab
ab
E E rz
m
KL
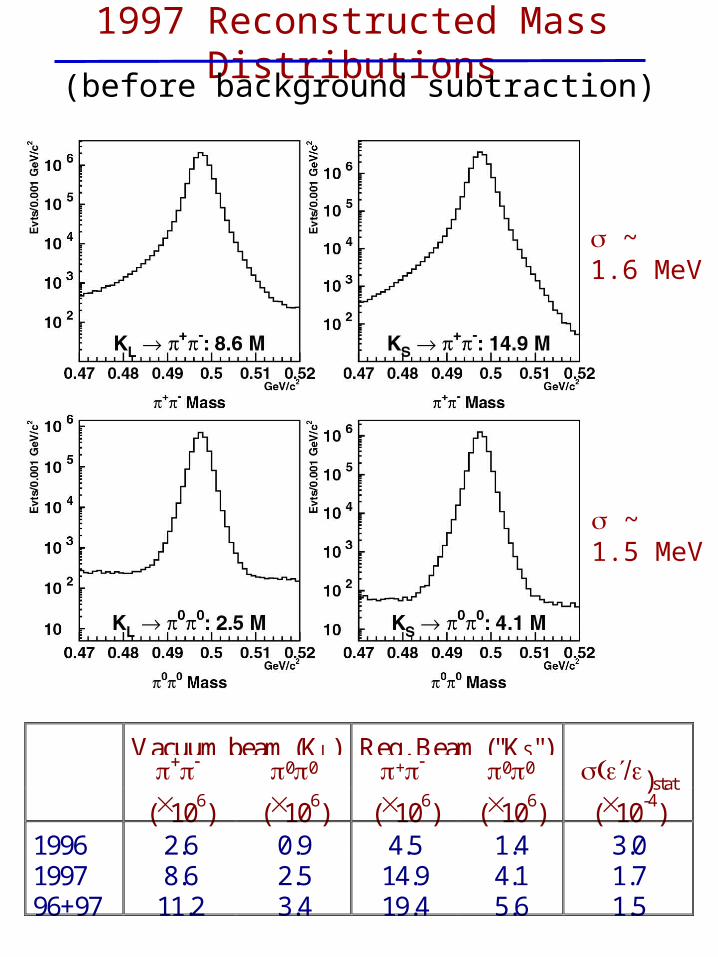
1997 Reconstructed Mass Distributions(before background subtraction)
~1.6 MeV
~1.5 MeV
Vacuum beam (KL) Reg. Beam ("KS") 00 + 00 )stat
(106) (106) (106) (106) (10-4)1996 2.6 0.9 4.5 1.4 3.01997 8.6 2.5 14.9 4.1 1.796+97 11.2 3.4 19.4 5.6 1.5
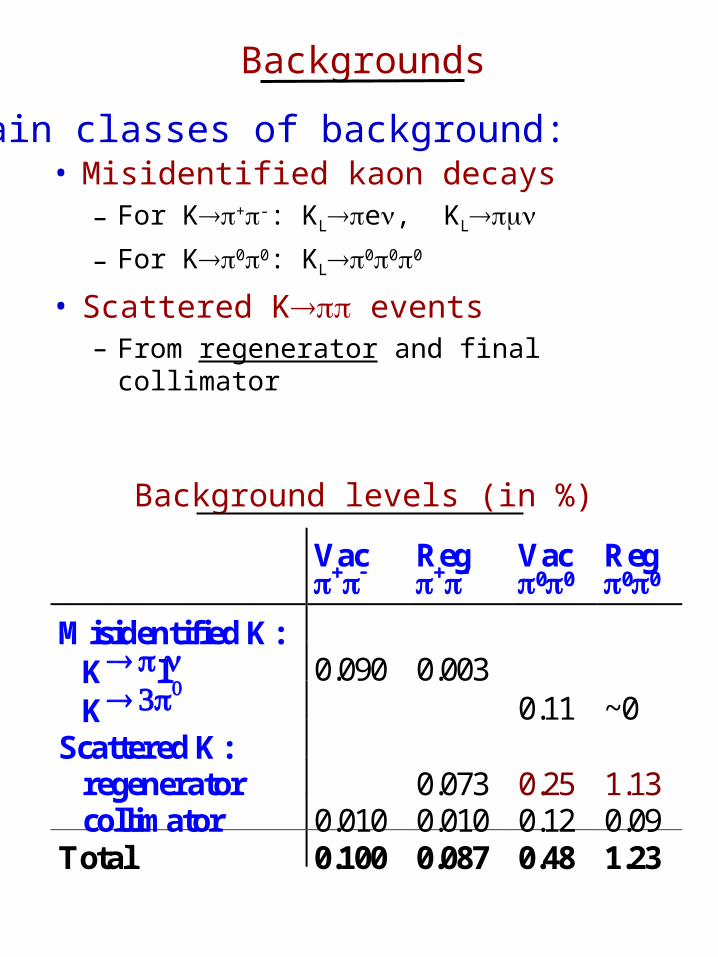
Backgrounds
• Misidentified kaon decays– For K+-: KLe, KL
– For K00: KL000
• Scattered K events– From regenerator and final collimator
Main classes of background:
Vac
Reg
Vac00
Reg00
Misidentified K: Kl 0.090 0.003 K
0.11 ~0Scattered K: regenerator 0.073 0.25 1.13 collimator 0.010 0.010 0.12 0.09Total 0.100 0.087 0.48 1.23
Background levels (in %)
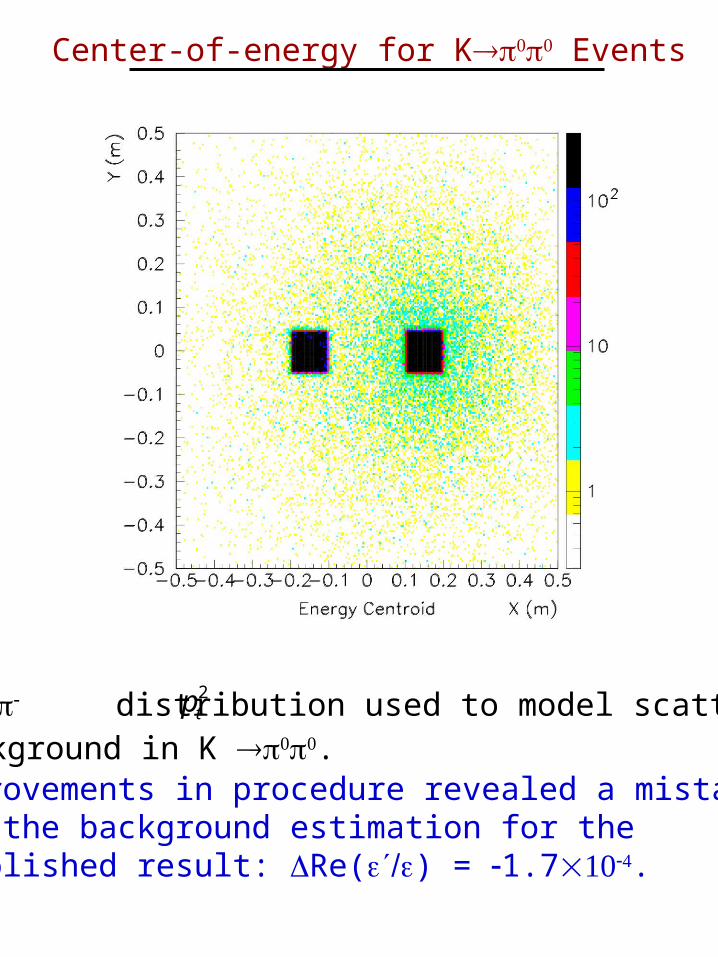
Center-of-energy for K Events
• KS+ distribution used to model scattering background in K .
2tp
• Improvements in procedure revealed a mistake in the background estimation for the published result: Re() = 1.7.
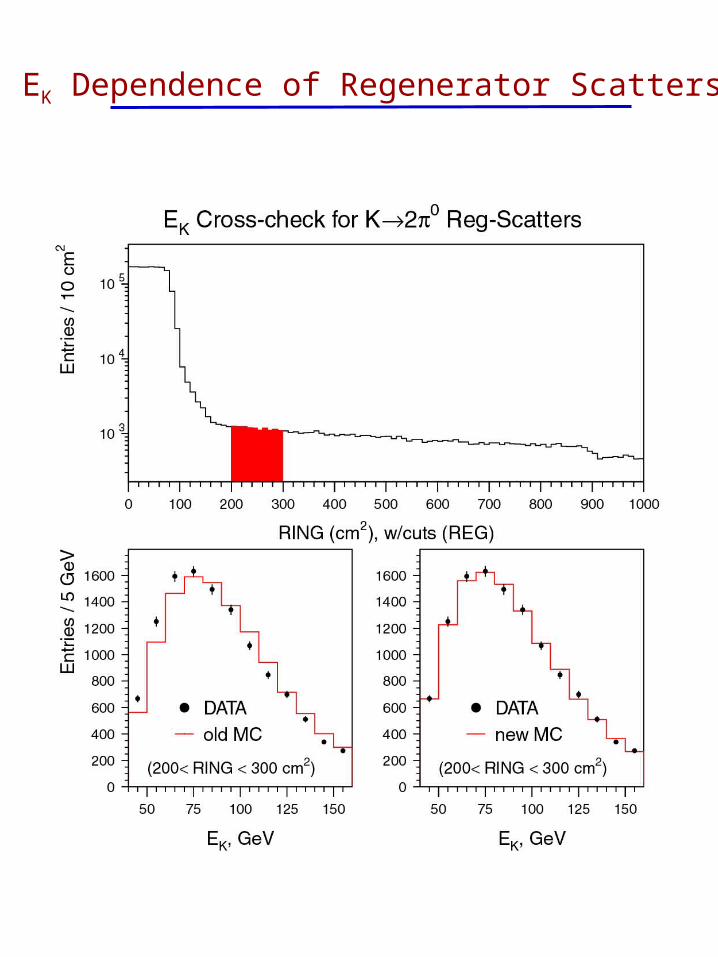
EK Dependence of Regenerator Scatters
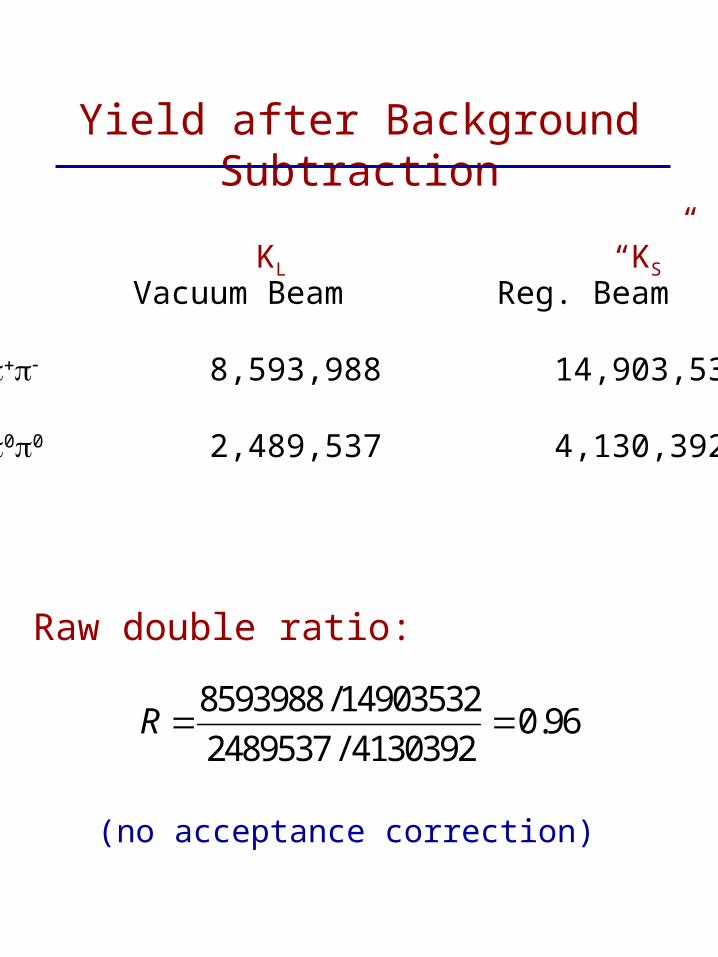
Yield after Background Subtraction
Vacuum Beam Reg. Beam
K 8,593,988 14,903,532
K00 2,489,537 4,130,392
Raw double ratio:
8593988 /149035320.96
2489537 / 4130392R
(no acceptance correction)
KL “KS”

1997 Reconstructed Vertex z Distributions
0.1% shift in E scale: ~3 cm shift in vertex; ~1 shift in
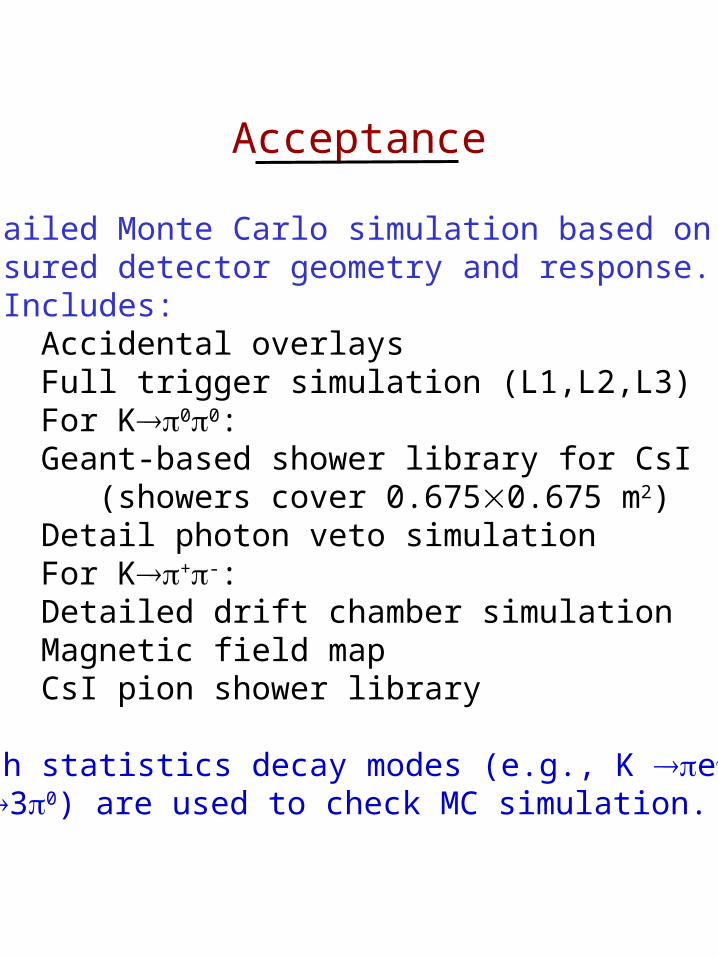
Acceptance
Detailed Monte Carlo simulation based on measured detector geometry and response. Includes:• Accidental overlays• Full trigger simulation (L1,L2,L3)• For K00:
Geant-based shower library for CsI (showers cover 0.6750.675 m2)Detail photon veto simulation
• For K+-:Detailed drift chamber simulationMagnetic field mapCsI pion shower library
High statistics decay modes (e.g., K e,K 30) are used to check MC simulation.
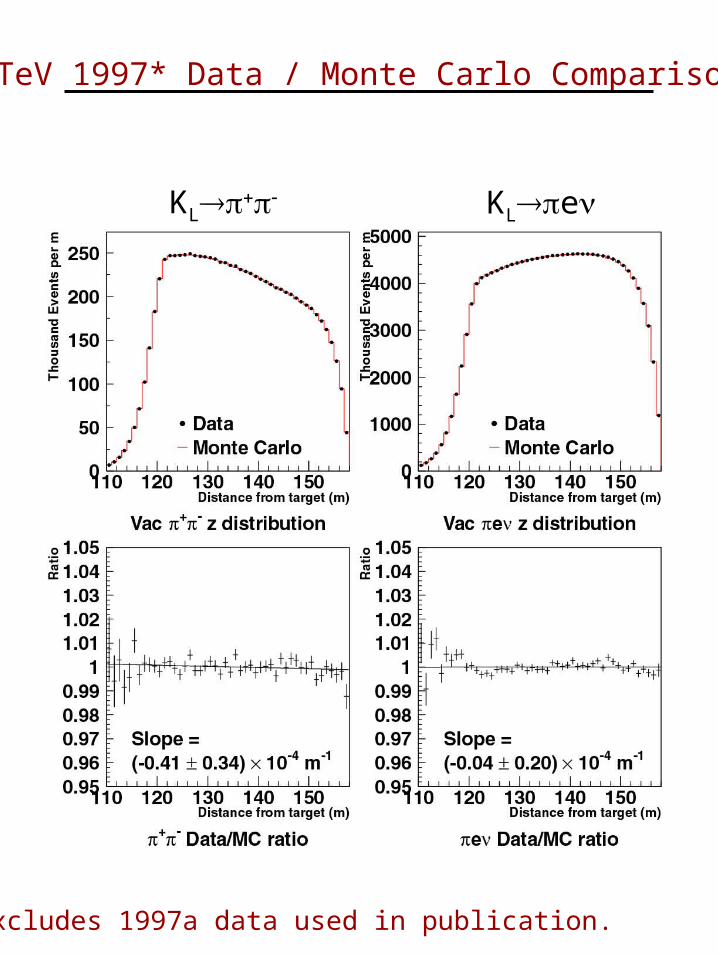
KTeV 1997* Data / Monte Carlo Comparison
* excludes 1997a data used in publication.
KL KLe
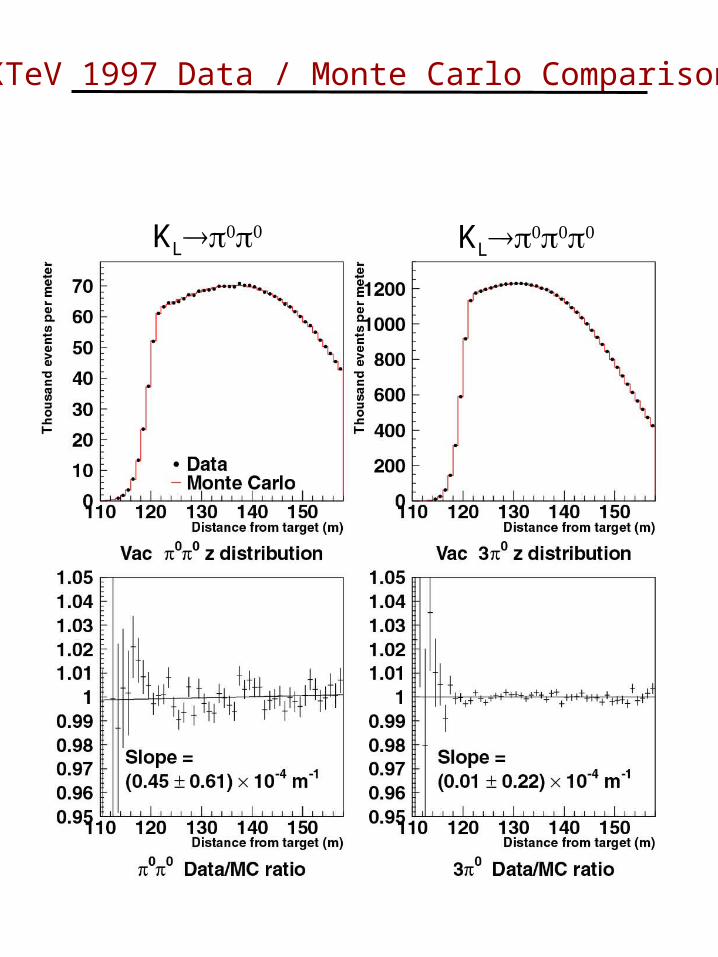
KTeV 1997 Data / Monte Carlo Comparison
KL KL
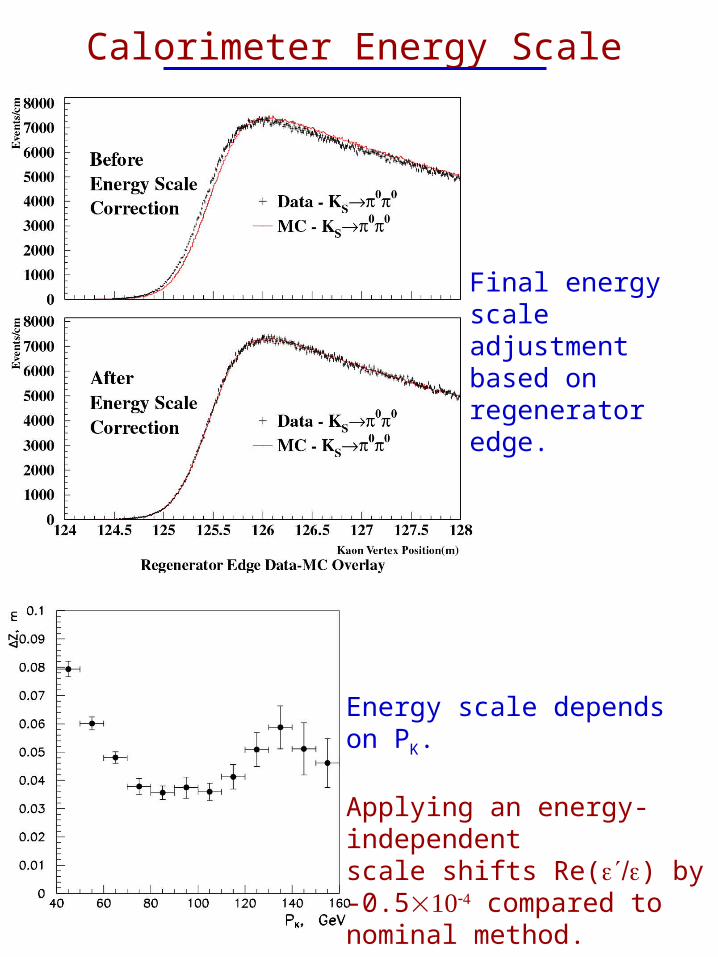
Calorimeter Energy Scale
Final energy scaleadjustment based on regenerator edge.
Energy scale depends on PK.
Applying an energy-independentscale shifts Re() by -0.5 compared to nominal method.
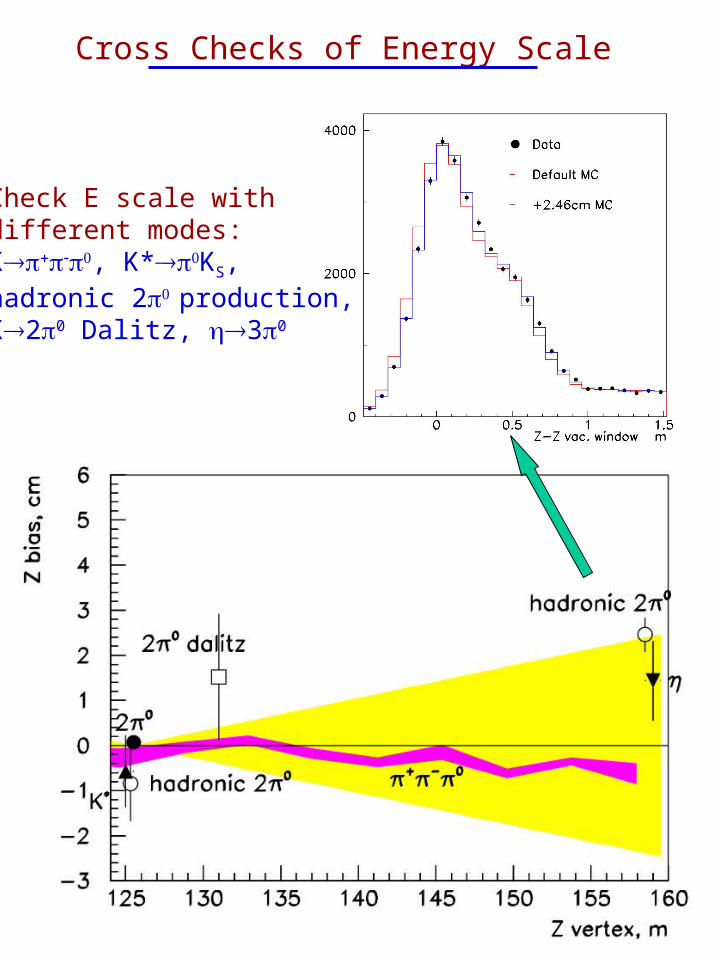
Check E scale with different modes:K, K*KS,hadronic 2 production,K20 Dalitz, 30
Cross Checks of Energy Scale
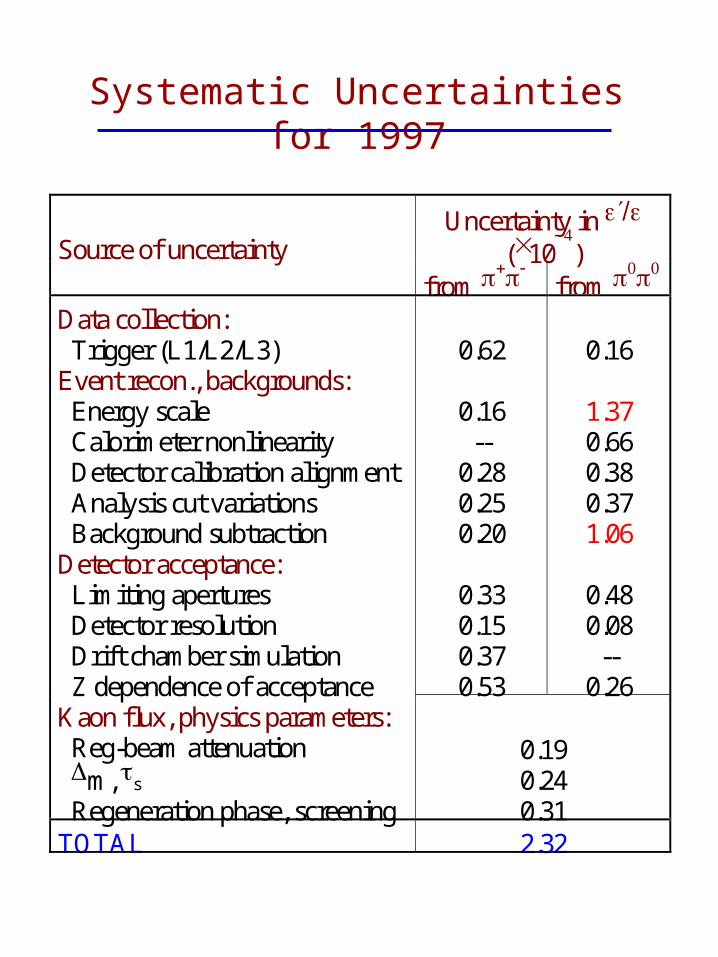
Systematic Uncertainties for 1997
Uncertainty in (10
)Source of uncertainty
from
from
0.62
0.16--
0.280.250.20
0.330.150.370.53
0.16
1.370.660.380.371.06
0.480.08
--0.26
Data collection: Trigger (L1/L2/L3)Event recon., backgrounds: Energy scale Calorimeter nonlinearity Detector calibration alignment Analysis cut variations Background subtractionDetector acceptance: Limiting apertures Detector resolution Drift chamber simulation Z dependence of acceptanceKaon flux, physics parameters: Reg-beam attenuation m, s
Regeneration phase, screening
0.190.240.31
TOTAL 2.32
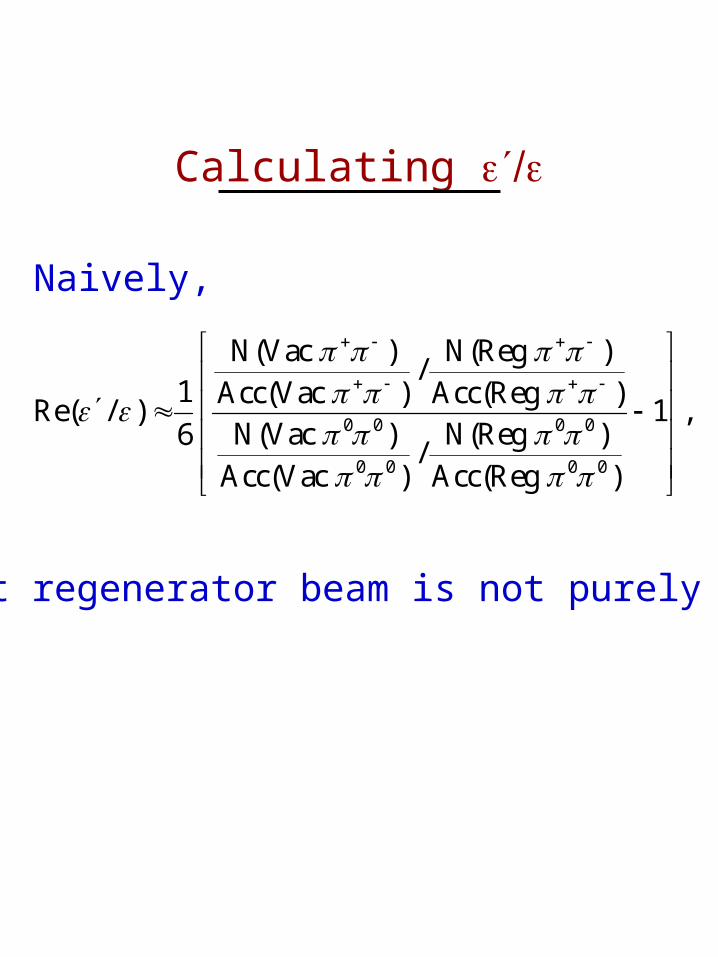
Calculating
0 0 0 0
0 0 0 0
N(Vac ) N(Reg )/
1 Acc(Vac ) Acc(Reg )Re( / ) 1 ,
N(Vac ) N(Reg )6/
Acc(Vac ) Acc(Reg )
Naively,
but regenerator beam is not purely KS.
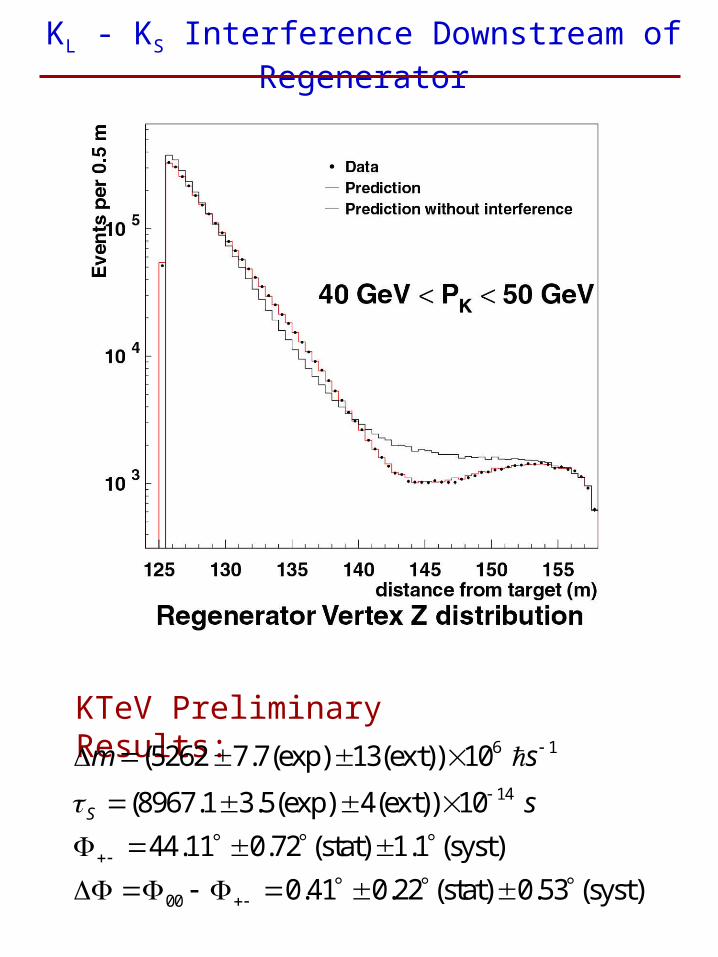
KL - KS Interference Downstream of Regenerator
KTeV Preliminary Results: 6 1
14
00
(5262 7.7(exp) 13(ext)) 10
(8967.1 3.5(exp) 4(ext)) 10
44.11 0.72 (stat) 1.1 (syst)
0.41 0.22 (stat) 0.53 (syst)
S
m s
s
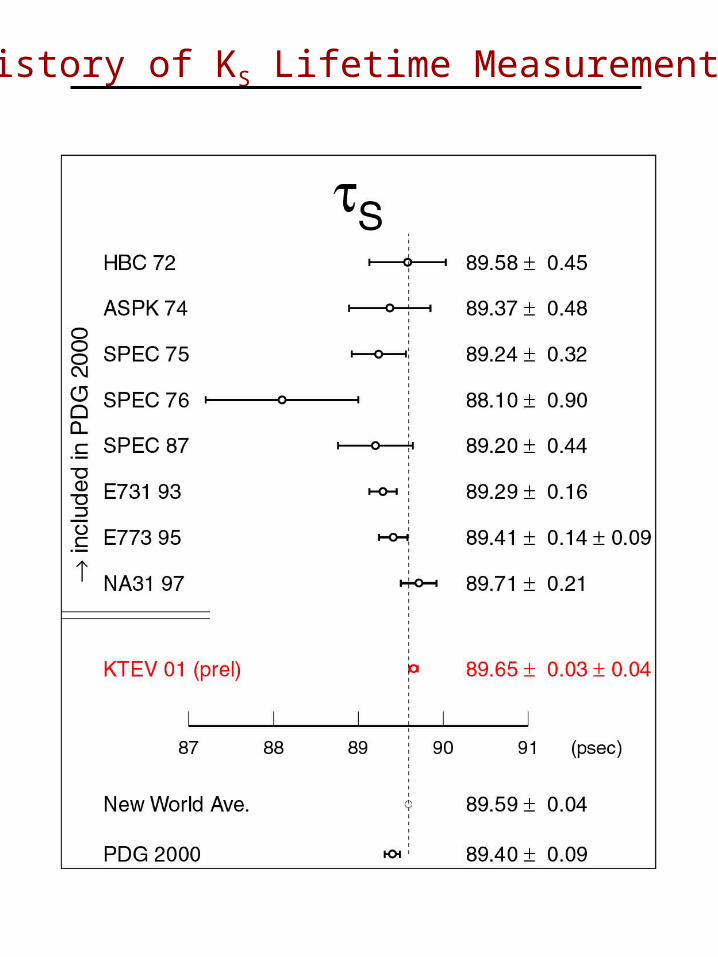
History of KS Lifetime Measurements
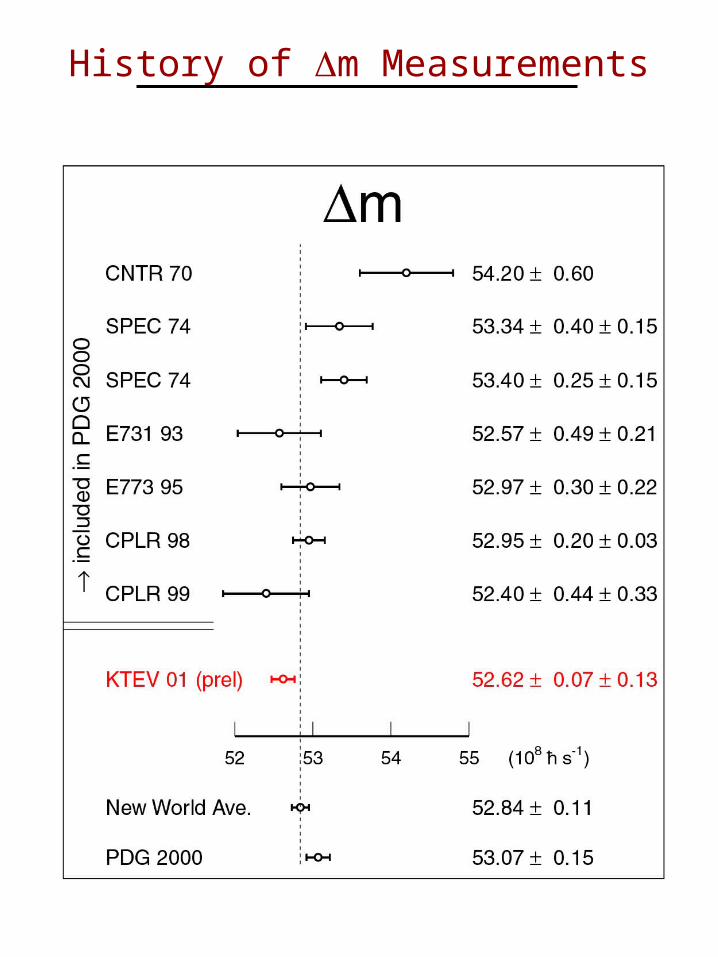
History of m Measurements
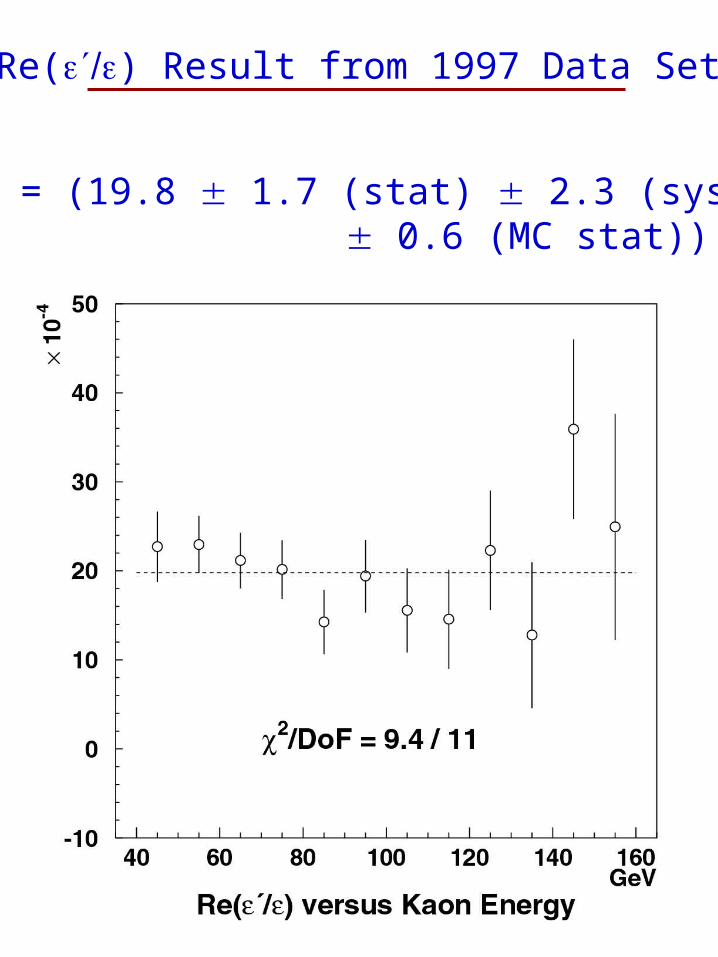
Re() = (19.8 1.7 (stat) 2.3 (syst) 0.6 (MC stat)) 10-4
Re() Result from 1997 Data Set
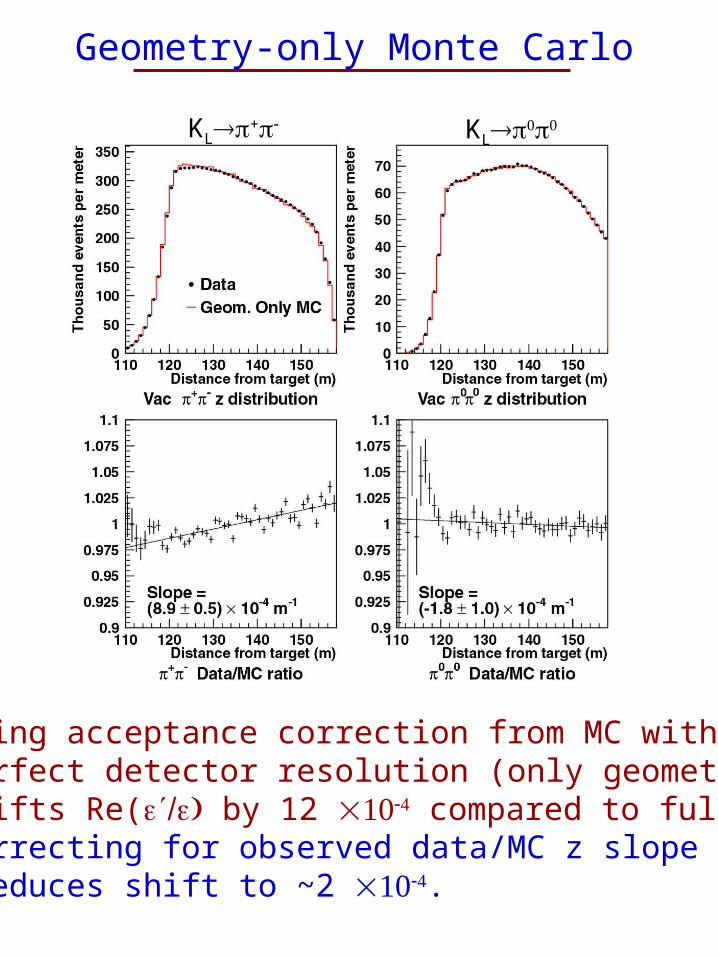
Geometry-only Monte Carlo
KLKL+
• Using acceptance correction from MC with perfect detector resolution (only geometry) shifts Re( by 12 compared to full MC. • Correcting for observed data/MC z slope reduces shift to ~2 .
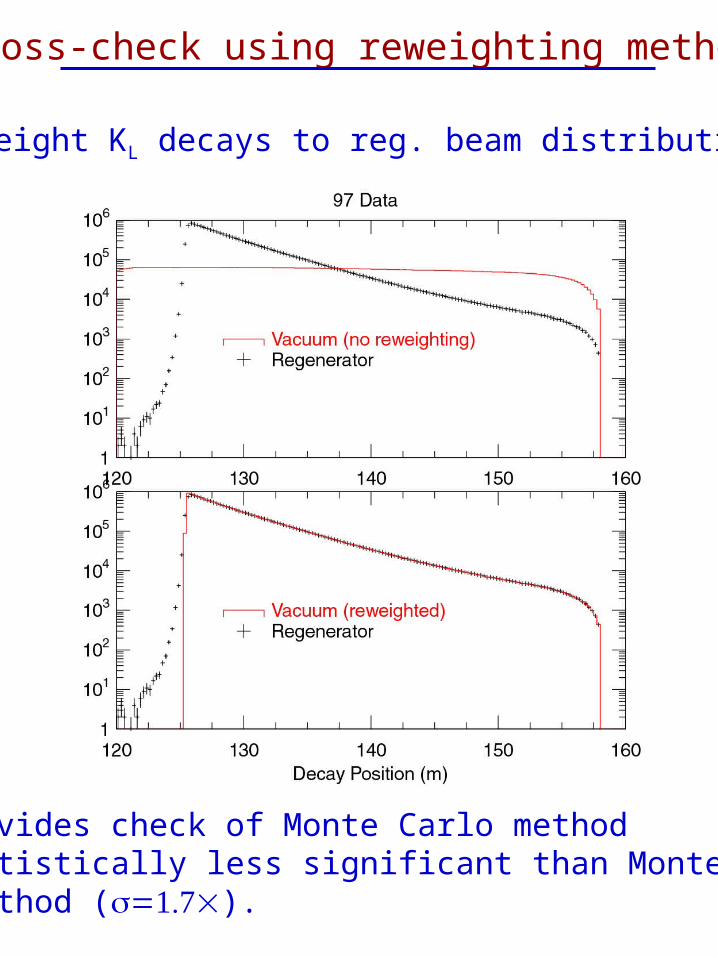
Cross-check using reweighting method
• Provides check of Monte Carlo method• Statistically less significant than Monte Carlo method ().
Reweight KL decays to reg. beam distribution.
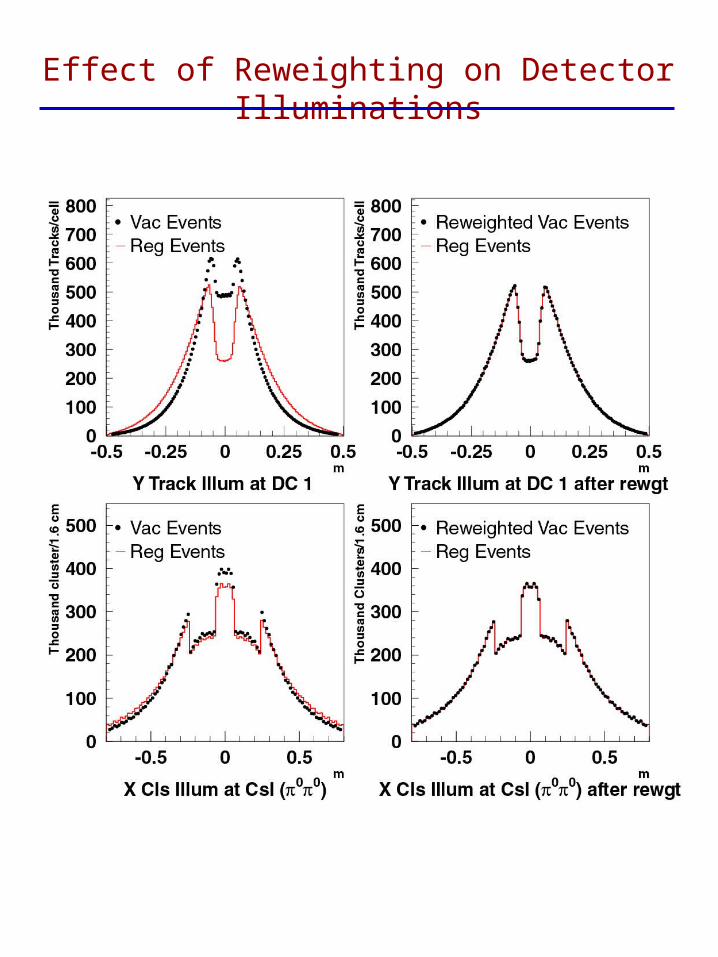
Effect of Reweighting on Detector Illuminations
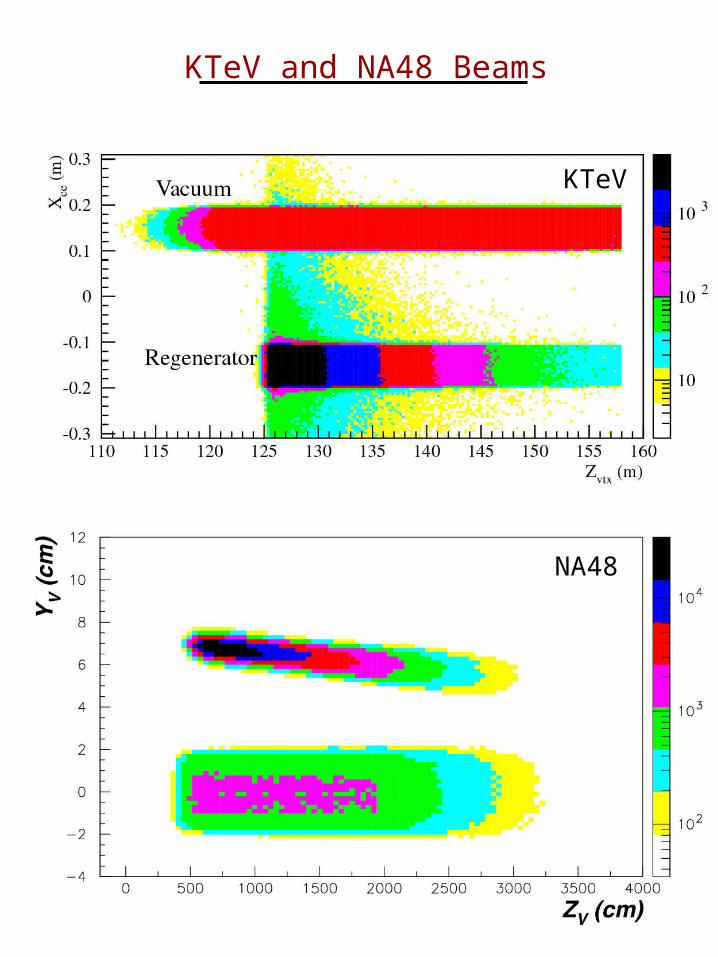
KTeV
NA48
KTeV and NA48 Beams
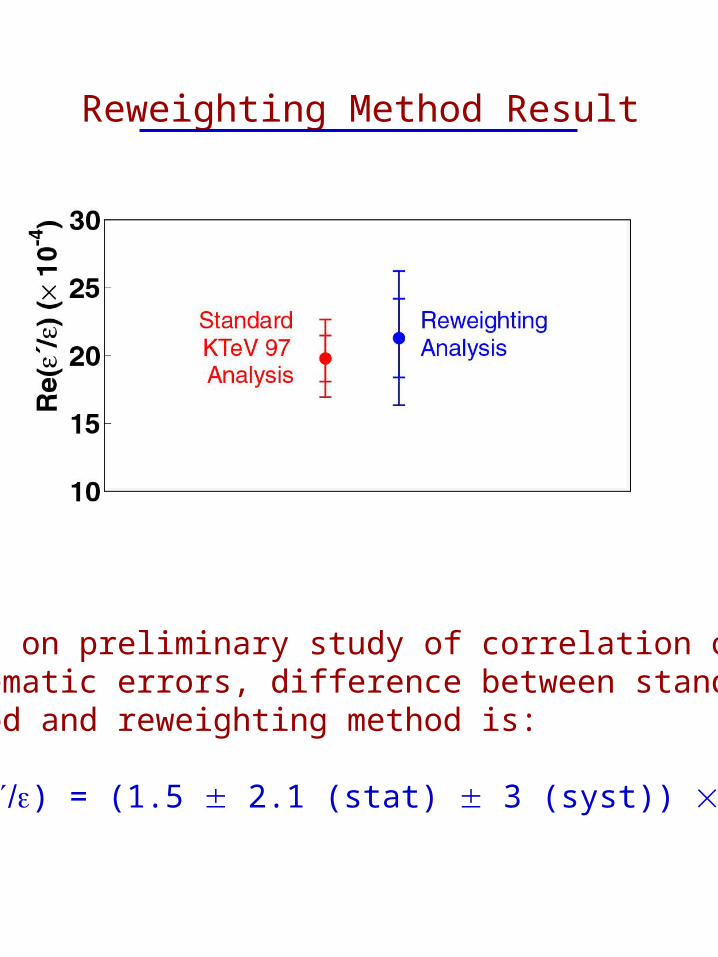
Reweighting Method Result
Based on preliminary study of correlation ofsystematic errors, difference between standard method and reweighting method is:
Re() = (1.5 2.1 (stat) 3 (syst))
Improvements in Analysis
• CsI Calibration• Drift Chamber calibration and
alignment• Neutral backgrounds• Apertures• Attenuation m, S
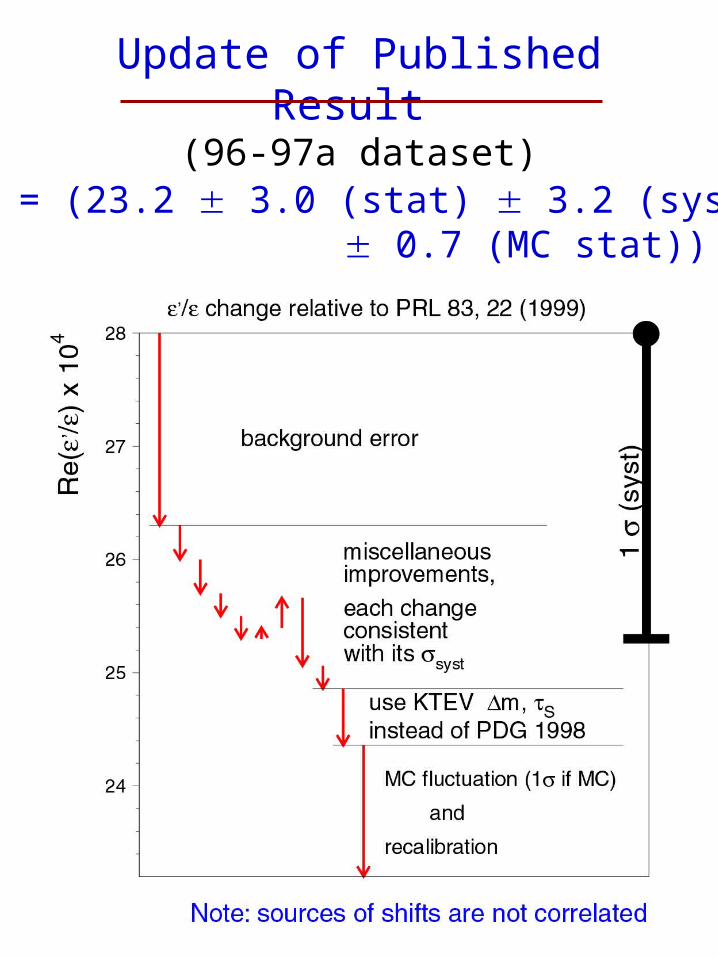
Update of Published Result (96-97a dataset)
Re() = (23.2 3.0 (stat) 3.2 (syst) 0.7 (MC stat)) 10-4
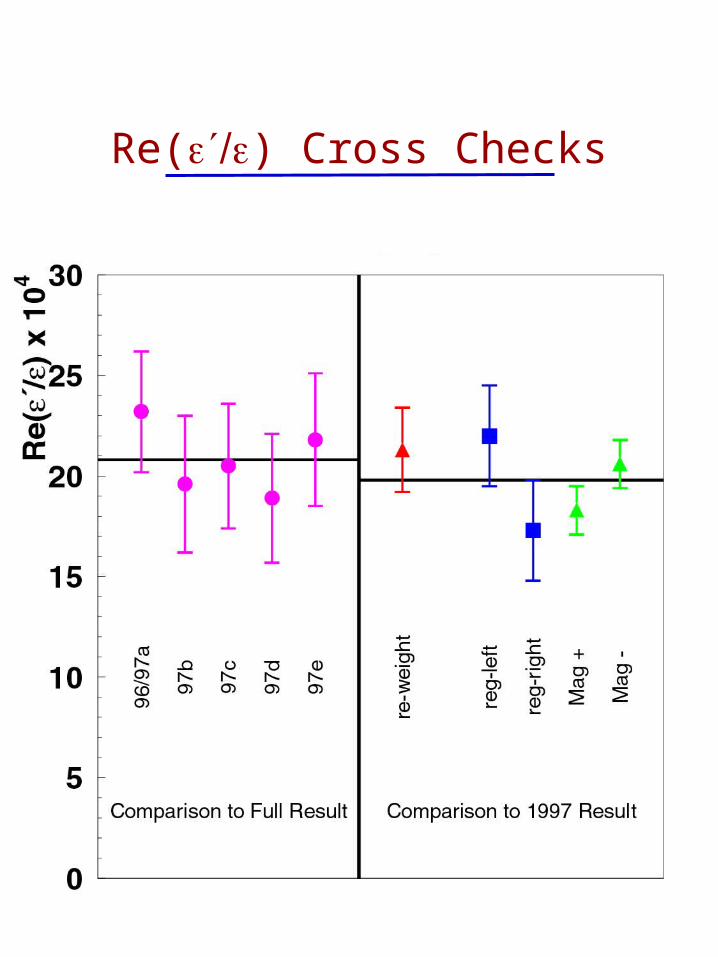
Re() Cross Checks
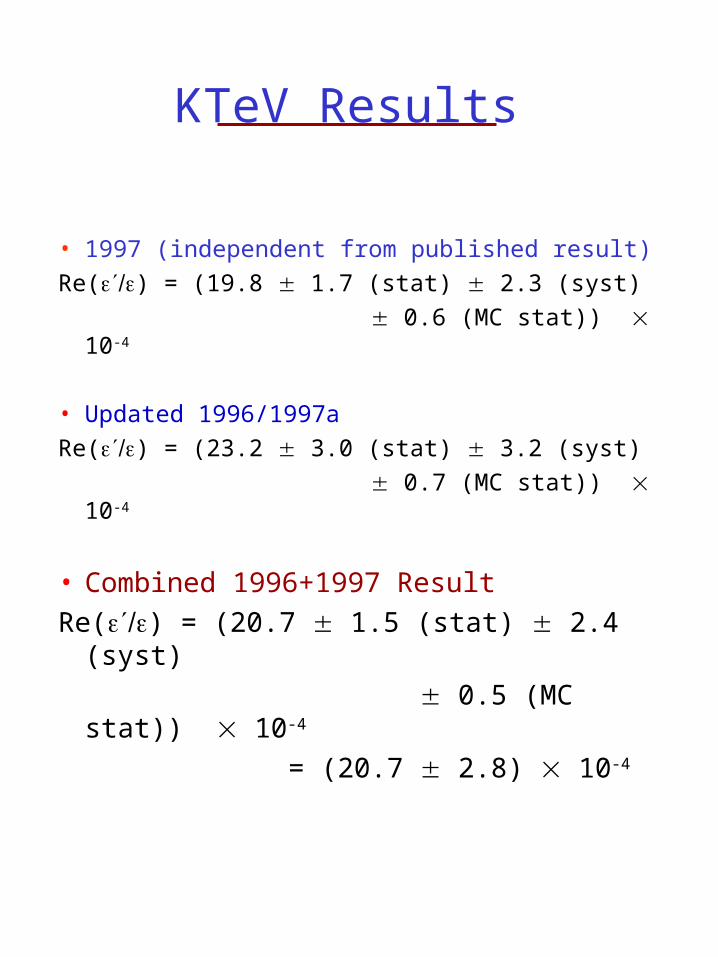
KTeV Results
• 1997 (independent from published result)
Re() = (19.8 1.7 (stat) 2.3 (syst)
0.6 (MC stat)) 10-4
• Updated 1996/1997a
Re() = (23.2 3.0 (stat) 3.2 (syst)
0.7 (MC stat)) 10-4
• Combined 1996+1997 Result
Re() = (20.7 1.5 (stat) 2.4 (syst)
0.5 (MC stat)) 10-4
= (20.7 2.8) 10-4
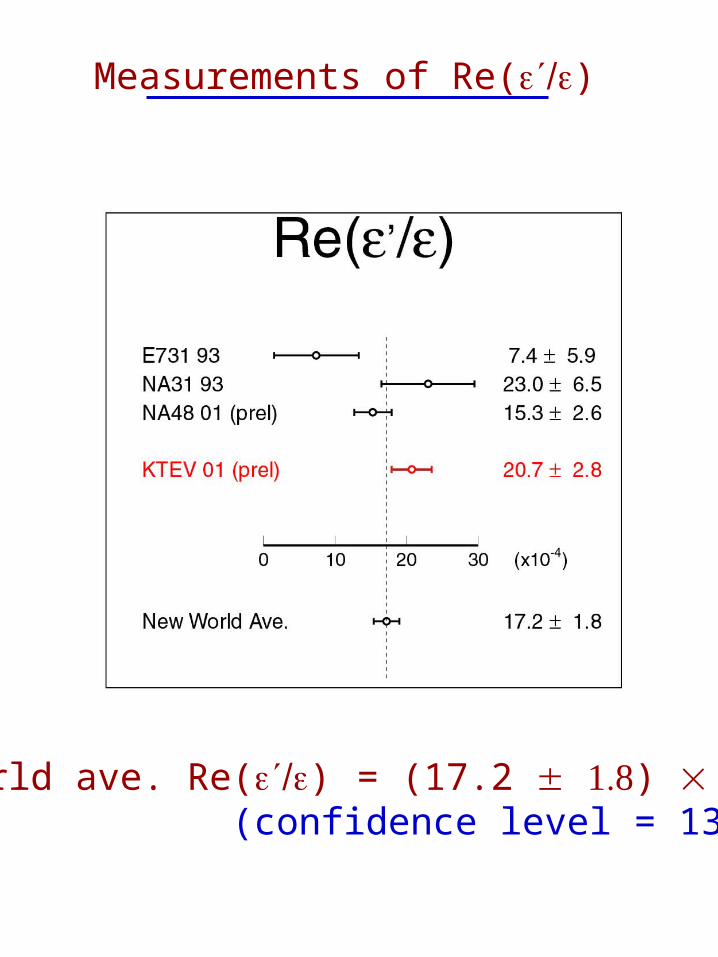
Measurements of Re()
World ave. Re() = (17.2 )
(confidence level = 13%)
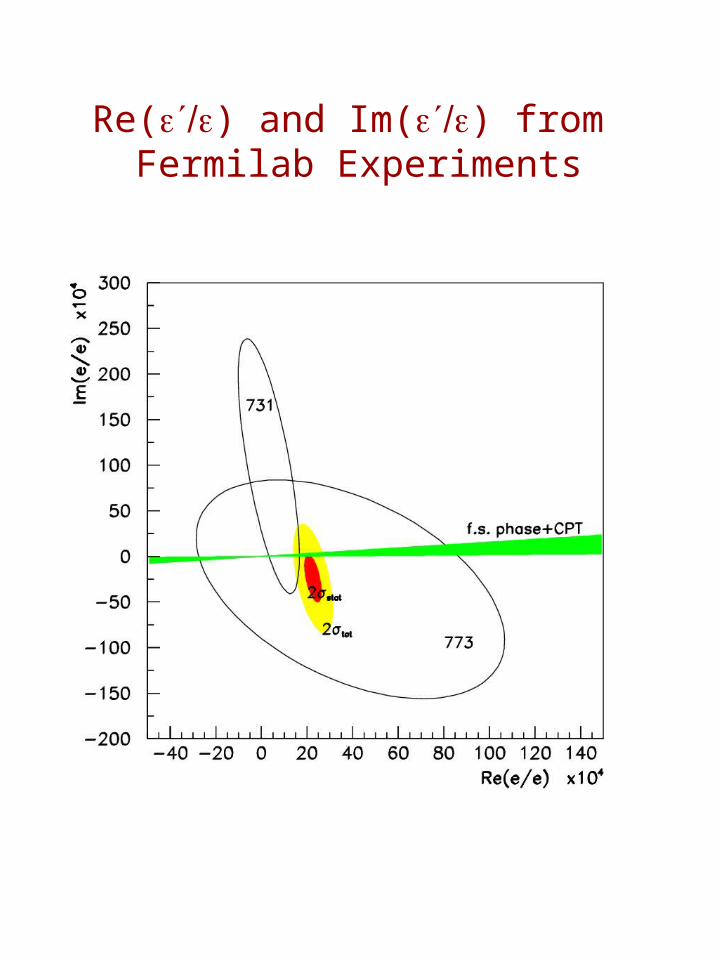
Re() and Im() from Fermilab Experiments

Conclusions
• KTeV results from 1996+1997 data:
Re() = (20.7 1.5 (stat) 2.4 (syst)
0.5 (MC stat)) 10-4
= (20.7 2.8) 10-4
New measurements of m, S, +, and • New world average:
Re() = (17.2 ) • Full KTeV data sample (96+97+99) will
reduce the statistical error on to
~ 1 10-4
significant work will be required to
reduce systematic error to similar level• Theory improvement needed to take full
advantage of this precision.