Embed Size (px)
Citation preview
July 2007
Population Health Model (POHEM)
• For educational / demonstration purposes• Not for distribution or citation
• Contact: [email protected]
July 2007
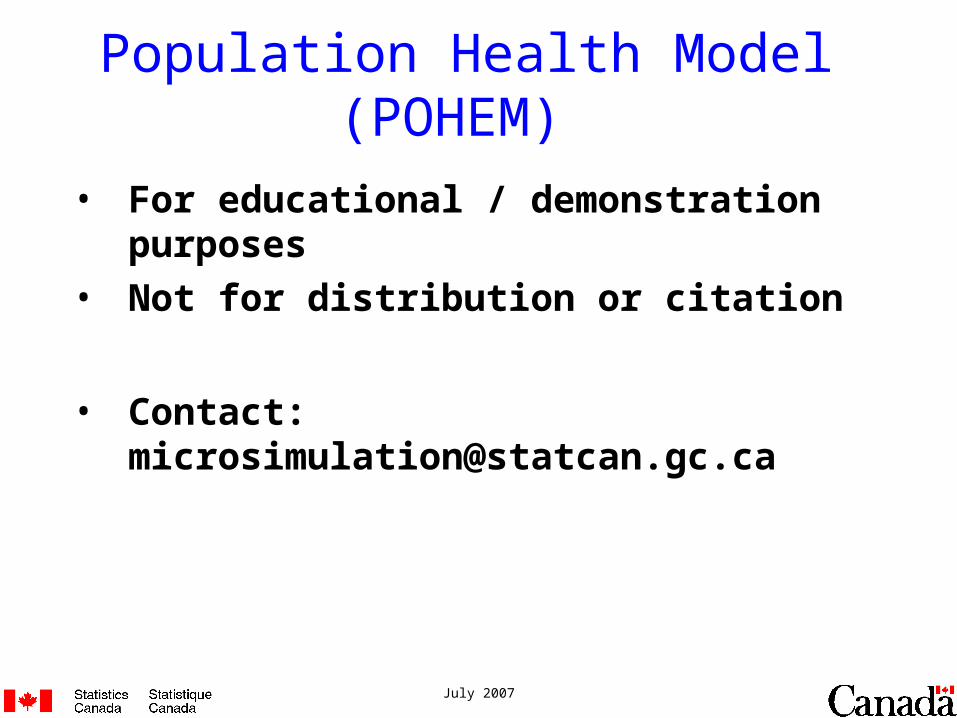
What can Micro-Simulation Do ?• project basic counts and distributions
– population– prevalence of risk factors – cases eligible for primary interventions– disease incidence and progression; e.g. first
AMIs, readmissions, and deaths
• simulate interventions and their potential impactsall these by age, sex, calendar year, geography, … any other modeled variables
July 2007
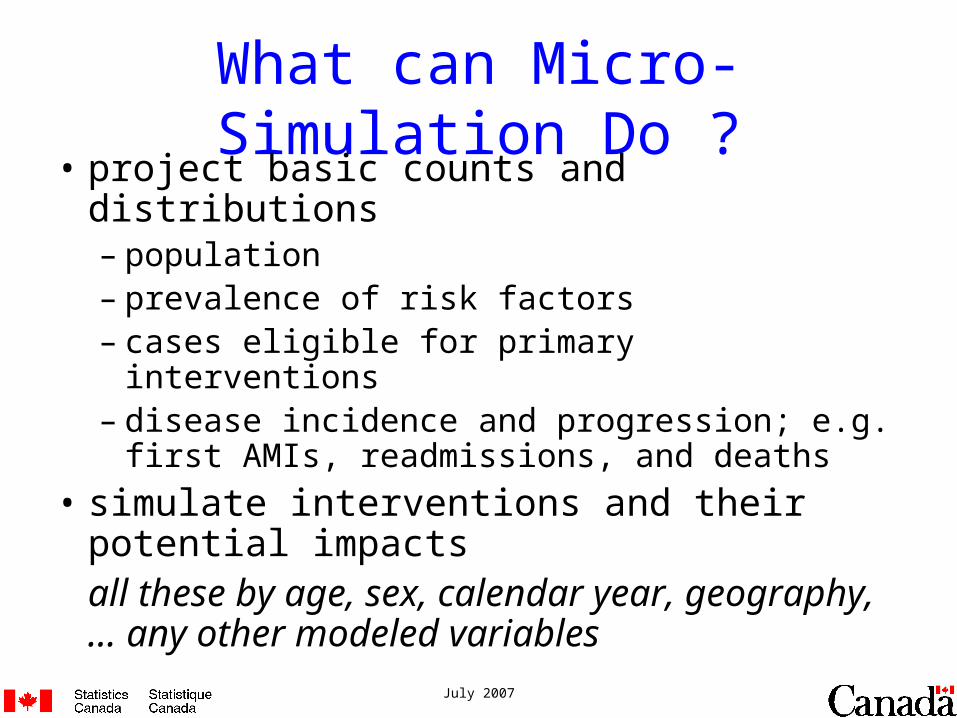
POpulation HEalth Model (POHEM)
• case-by-case, Monte Carlo microsimulation• directly encompasses competing risks and comorbidity• longitudinal risk factor and disease sub-modules • generates plausible health biographies for synthetic
individuals from empirical observations• population attributable fractions estimated through risk-
factor deletion (ie, relative risk set to 1)• projects population forward in continuous time
– population initialized in 2001 from Canadian Community Health Survey cycle 1.1
– subject to cohort-specific mortality hazards based on age, sex and year of birth
– new births and new immigrants generated in future years based on Census projections
July 2007
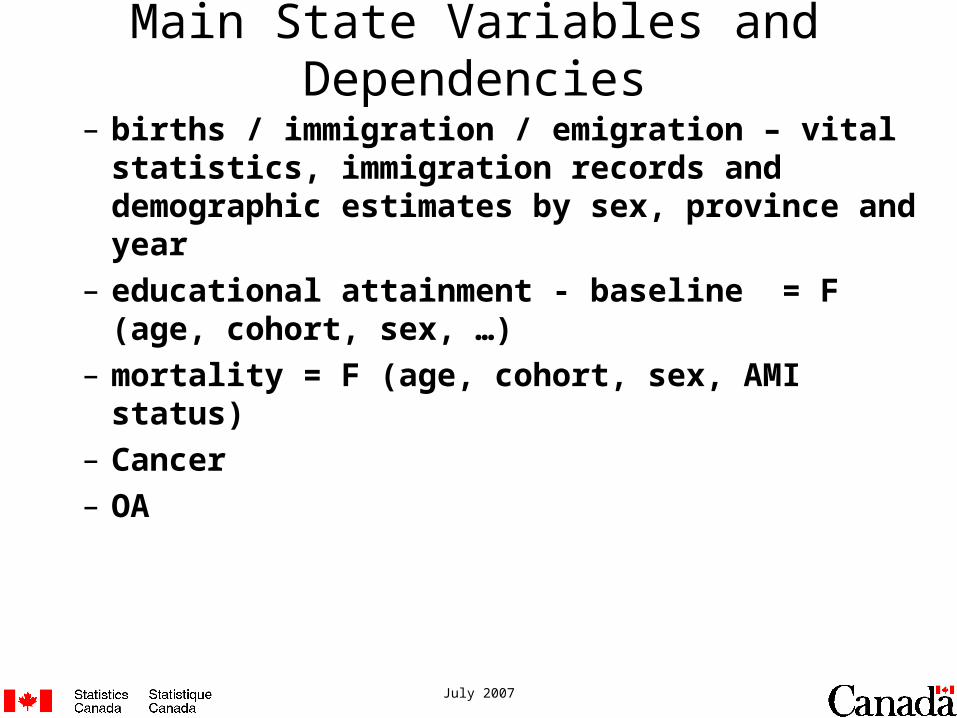
Main State Variables and Dependencies
– births / immigration / emigration – vital statistics, immigration records and demographic estimates by sex, province and year
– educational attainment - baseline = F (age, cohort, sex, …)
– mortality = F (age, cohort, sex, AMI status)– Cancer– OA
July 2007
2001
……..……..……..……..……..……..……..……..……..……..……..
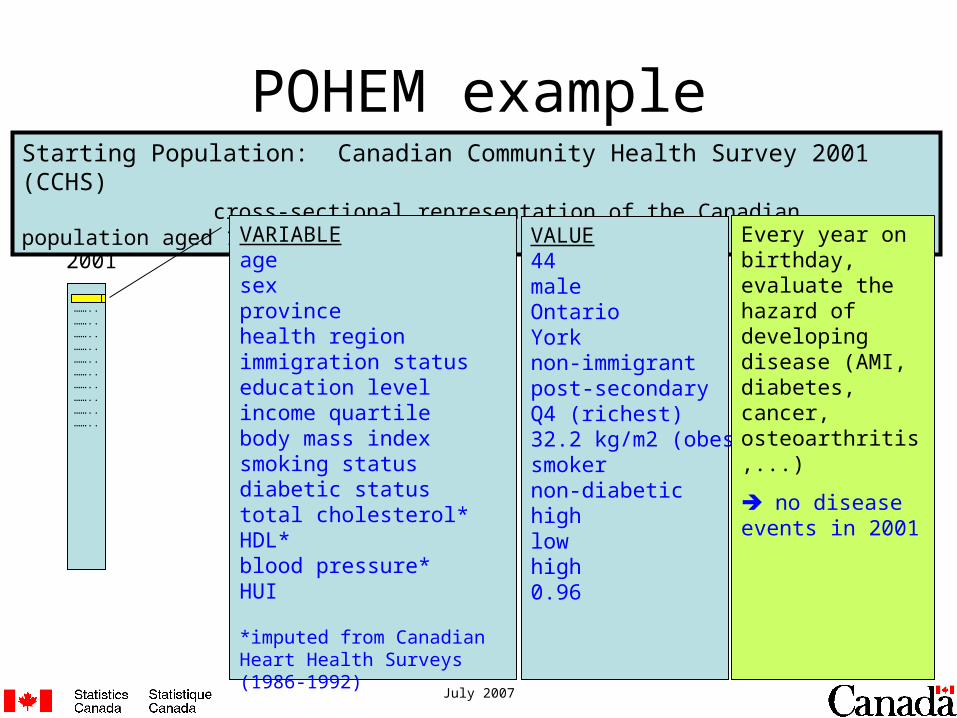
POHEM exampleStarting Population: Canadian Community Health Survey 2001 (CCHS)
cross-sectional representation of the Canadian population aged 18+
VARIABLEage sex provincehealth regionimmigration statuseducation levelincome quartilebody mass index smoking statusdiabetic statustotal cholesterol*HDL*blood pressure*HUI
*imputed from Canadian Heart Health Surveys (1986-1992)
VALUE44maleOntarioYorknon-immigrantpost-secondaryQ4 (richest)32.2 kg/m2 (obese)smokernon-diabetichighlowhigh0.96
Every year on birthday, evaluate the hazard of developing disease (AMI, diabetes, cancer, osteoarthritis,...)
no disease events in 2001

July 2007
AMI at age 45.3
Now at risk of 2nd AMI, CHF, UA, ...
2001
……..……..……..……..……..……..……..……..……..……..……..
POHEM example
2002
……..
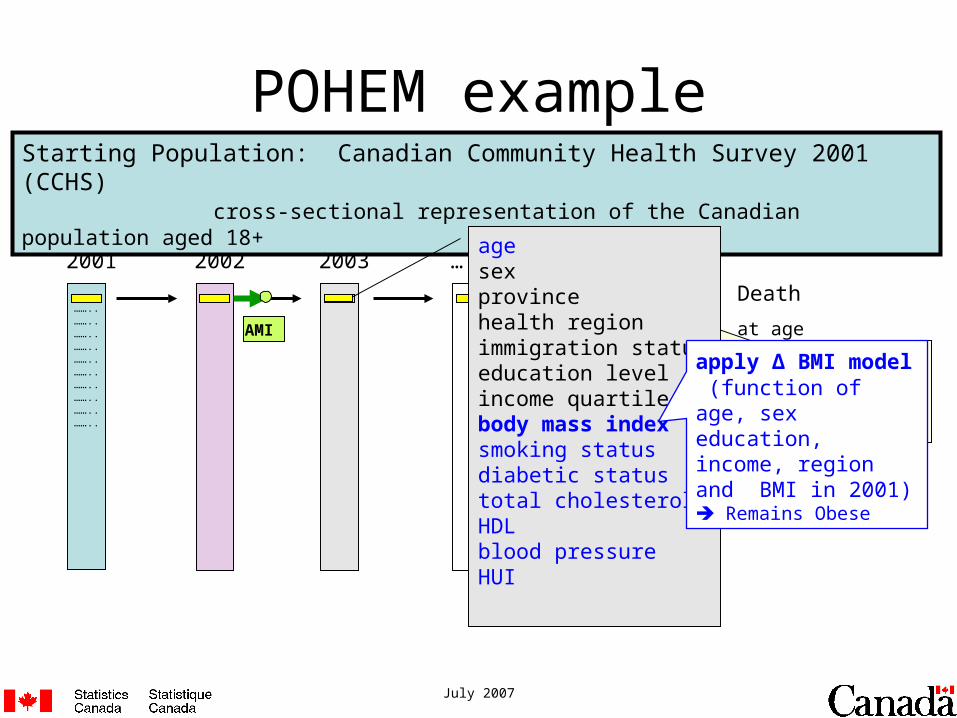
Starting Population: Canadian Community Health Survey 2001 (CCHS)cross-sectional representation of the Canadian population aged 18+
AMI
agesexprovincehealth region immigration statuseducation levelincome quartilebody mass indexsmoking statusdiabetic statustotal cholesterolHDLblood pressureHUI
Every year on birthday, evaluate the hazard of developing disease (AMI, diabetes, cancer, osteoarthritis,...)
AMI in 0.3 years
July 2007
…
……..
2001
……..……..……..……..……..……..……..……..……..……..……..
POHEM example
2002
……..
Starting Population: Canadian Community Health Survey 2001 (CCHS)cross-sectional representation of the Canadian population aged 18+
2003
…….. Death
at age 71.2
OA at age 69.4 in year 2028
(comorbid with Congestive Heart Failure)
AMI CHF OA
Congestive Heart Failueat age 66.1 in year 2023
agesexprovincehealth regionimmigration statuseducation levelincome quartilebody mass indexsmoking statusdiabetic statustotal cholesterolHDLblood pressureHUI
apply Δ BMI model (function of age, sex education, income, region and BMI in 2001) Remains Obese

July 2007
2001
……..……..……..……..……..……..……..……..……..……..……..
POHEM
2002
……..……..
Starting Population: Canadian Community Health Survey 2001 (CCHS)cross-sectional representation of the Canadian population aged 18+
2003
……..……..
…
……..…….. death
>100,000 records on CCHS representing ~24 million Canadians(4 hours on a PC)
July 2007
July 2007
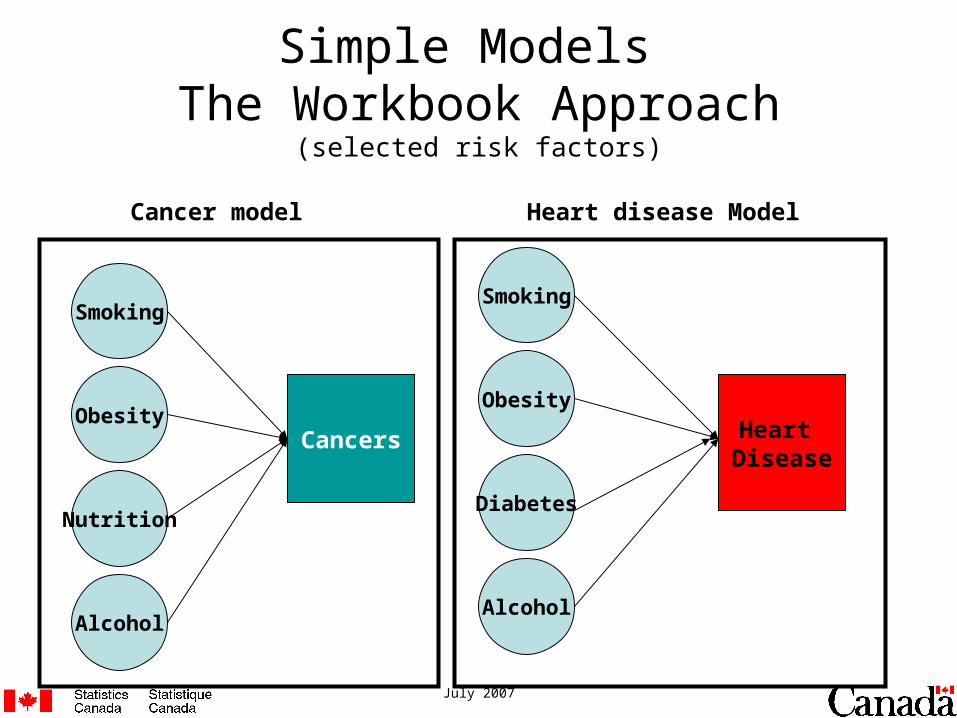
Simple Models The Workbook Approach
(selected risk factors)
Smoking
Obesity
Nutrition
Cancers
Cancer model
Alcohol
Smoking
Obesity
Alcohol
Heart Disease
Heart disease Model
Diabetes

July 2007
Obesity
Smoking Cancers
Diabetes
Complex Causal Web Diagram:The Microsimulation Approach
Nutrition
Alcohol
Heart Disease
July 2007
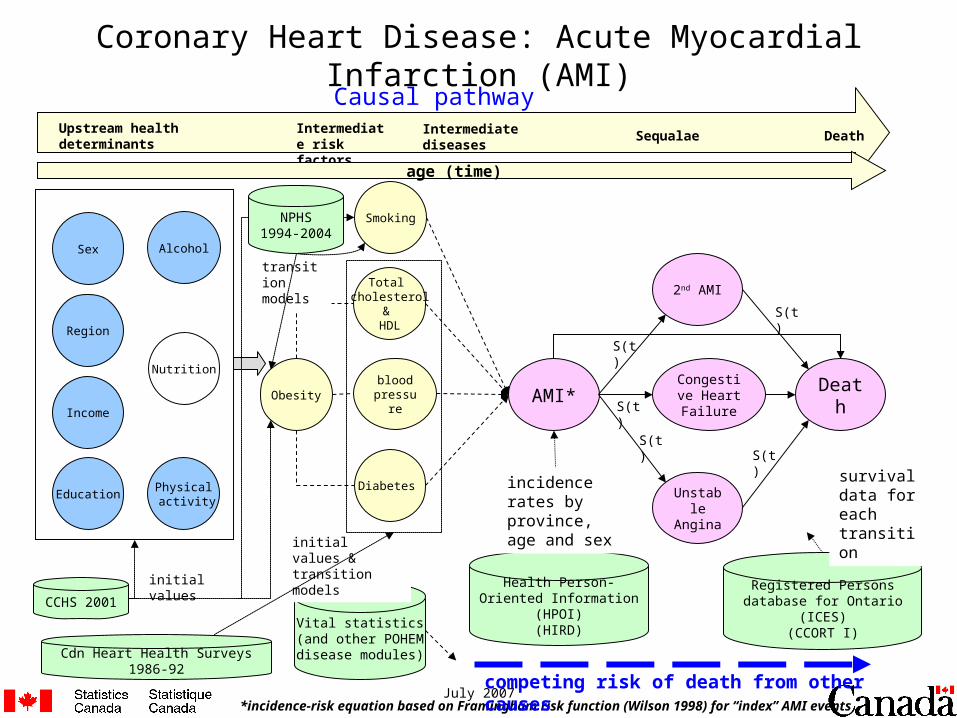
Coronary Heart Disease: Acute Myocardial Infarction (AMI)
Upstream health determinants
Intermediate risk factors
Intermediate diseases
Sequalae Death
AMI*
Health Person-Oriented Information (HPOI)
(HIRD)
incidence rates by province, age and sex
2nd AMI
Congestive Heart
Failure
Unstable
Angina
Death
Registered Persons database for Ontario (ICES)
(CCORT I)
survival data for each transition
*incidence-risk equation based on Framingham risk function (Wilson 1998) for “index” AMI events
competing risk of death from other causes
Vital statistics(and other POHEM disease modules)
initial values & transition models
Diabetes
Total cholesterol
& HDL
blood pressur
e
Cdn Heart Health Surveys 1986-92
age (time)
initial values
Obesity
Smoking
Nutrition
Physical activity
Alcohol
Income
Education
Region
Sex
CCHS 2001
transition models
NPHS 1994-2004
S(t)
S(t)
S(t)
S(t)
S(t)
Causal pathway
July 2007
Data Analysis and Input to POHEM:
a) incidence rates (I) estimated from administrative data by age group, sex and province
b) incidence-risk equation obtained from the literature:
• Framingham risk function
• α represents the baseline risk (by age, sex, province) after accounting for the other risk factors
coefficients vary by category for cholesterol, high density lipids, diabetes and smoking obtained from the study (Wilson, 1998)
c) the baseline risk (α) is calibrated such that the incidence-risk equation implemented in POHEM (F) reproduces the observed incidence rates by age, sex and province
• takes into account the distribution of the risk factors (by category) in the population
d) values and models of change in risk factors based on data and trends from national surveys
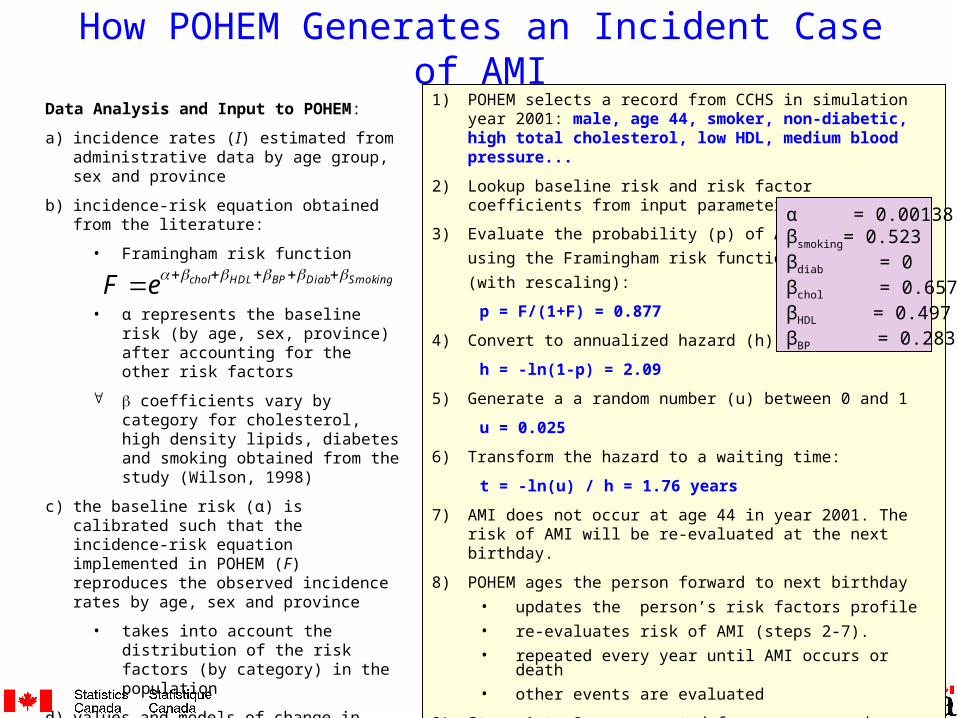
How POHEM Generates an Incident Case of AMI1) POHEM selects a record from CCHS in simulation year 2001:
male, age 44, smoker, non-diabetic, high total cholesterol, low HDL, medium blood pressure...
2) Lookup baseline risk and risk factor coefficients from input parameter table.
3) Evaluate the probability (p) of AMI
using the Framingham risk function
(with rescaling):
p = F/(1+F) = 0.877
4) Convert to annualized hazard (h):
h = -ln(1-p) = 2.09
5) Generate a a random number (u) between 0 and 1
u = 0.025
6) Transform the hazard to a waiting time:
t = -ln(u) / h = 1.76 years
7) AMI does not occur at age 44 in year 2001. The risk of AMI will be re-evaluated at the next birthday.
8) POHEM ages the person forward to next birthday
• updates the person’s risk factors profile
• re-evaluates risk of AMI (steps 2-7).
• repeated every year until AMI occurs or death
• other events are evaluated
9) Steps 1 to 8 are repeated for every record on CCHS
α = 0.00138βsmoking= 0.523βdiab = 0βchol = 0.657βHDL = 0.497βBP = 0.283
SmokingDiabBPHDLcholeF

July 2007
Data Sources• Canadian Community Health Survey (2001)
– starting population for POHEM (initialize age, sex, geography, BMI, smoking, diabetes)
• National Population Health Survey (1994-2004)– models of change in BMI and smoking
• Canadian Heart Health Survey (1986 to 1992)– joint distribution of other cardiac risk factors cholesterol, diabetes, blood pressure – HDL imputed
• Health Person-Oriented Information (1992/93 to 2001/02) – hospital separations by province– rate of index AMI (5-yr wash-out) by province– managed at STC
• Registered Person database (1988/89 to 2001/02) – Ontario hospital separations linked to vital statistics– Survival time from AMI event to subsequent AMI event or death– managed at ICES

July 2007
Geography
• Geography is an explanatory variable in the BMI model– ATLANTIC, QUEBEC, ONTARIO, PRAIRIES, BC
• Geography is a dimension of the incidence rates for index AMI (by sex, age group, province groups– ATLANTIC, QUEBEC, ONTARIO, PRAIRIES, BC
• Geography was not used in the smoking model, and was not used in the joint risk factor transition model

July 2007
Model Input: Smoking transitions
Never smokers
Successful quitter in1996
Quit in1998
Smokers in all 3 years
0%
10%
20%
30%
40%
50%
60%
70%
80%
90%
100%
non-smoker 94 smoker 94
non-smoker 96 and 98 non-smoker 96 and smoker 98smoker 96 and non-smoker 98 smoker 96 and 98
Source: NPHS

July 2007
transitions derived from NPHS (1996-2002)
transitions derived from CHHS
Diabt
CholtHyptt
Year2001 2003 2005 2007 2009 2011
t=0 t+5 t+10
BMIt+2
Diabt+10
Cholt+10Hyptt+10
BMIt BMIt+6 BMIt+8 BMIt+4
Diabt+5
Cholt+5Hyptt+5
BMIt+10
Initialization 2001
CCHS 2001age = 55sex = male income educationregionBMIdiabetes hypertension (y/n)smoker (y/n)
CHHS (86-92)total cholesterolHDLBlood pressure
Modeling Risk Factor Transitions
Legend:
Smokt+2 Smokingt Smokt+6 Smokt+8 Smokt+10 Smokt+4

July 2007
Example of HDL distribution by cholesterol for male aged 55-59, overweight and non-diabetic
Sex MaleAge 55-59BMI overweightDiabetic No
Total cholesterol Low HDL <35 mg/dl
Medium-Low HDL [35,45)
Medium HDL [45,50)
Medium-High HDL [50,60)
High HDL >=60
Low <160 mg/dl 0.06 0.11 0.53 0.30 0.00Medium-Low [160,200) 0.08 0.47 0.19 0.15 0.10Medium [200,240) 0.16 0.59 0.03 0.06 0.16Medium-Hi [240,280) 0.26 0.48 0.07 0.17 0.02High Chol. >=280 0.07 0.17 0.52 0.02 0.21

July 2007
Preliminary Results
July 2007
Acute Myocardial Infarction in Canada: Projection of risk
factors, incidence and progression from 2001 to 2021

July 2007
Objectives
• project the prevalence of risk factors most commonly associated with acute myocardial infarction (AMI) between 2001 and 2021
• project the number of resulting AMI events over that period
• estimate the contribution of each risk factor to AMI outcomes in future years

July 2007
Model Projection: Prevalence of Smoking
0
0.05
0.1
0.15
0.2
0.25
0.3
0.35
< 30 30-39 40-49 50-59 60-69 70-79 80+ All
Age
2001
2006
2011
Prop. of Pop

July 2007
Model Projection: Prevalence of Diabetes
0
0.02
0.04
0.06
0.08
0.1
0.12
0.14
0.16
20-29 30-39 40-49 50-59 60-69 70-79 80+ All
Age
2001
2006
2011
Prop of Pop
July 2007
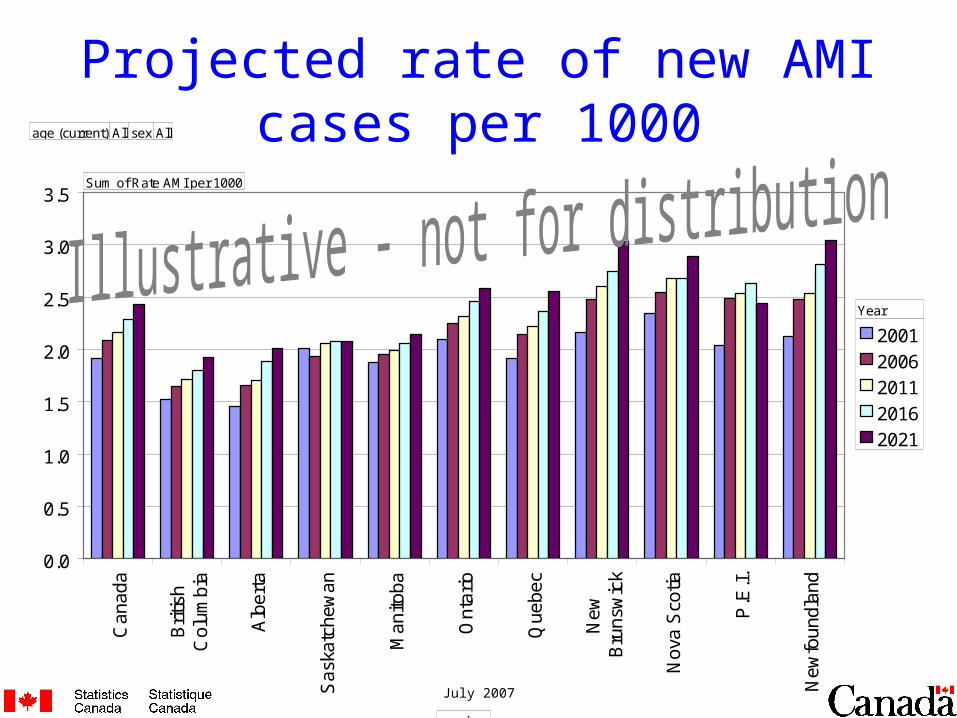
Projected rate of new AMI cases per 1000
0.0
0.5
1.0
1.5
2.0
2.5
3.0
3.5
Can
ada
Brit
ish
Col
umbi
a
Alb
erta
Sas
katc
hew
an
Man
itoba
Ont
ario
Que
bec
New
Bru
nsw
ick
Nov
a S
cotia
P.E
.I.
New
foun
dlan
d
20012006201120162021
age (current) All sex All
Sum of Rate AMI per 1000
province
Year

July 2007
Projected number of new AMI cases by province
0
5000
10000
15000
20000
25000
30000
British Columbia
Alberta
Saskatchewan
ManitobaOntario
Quebec
Nova Scotia
New BrunswickP.E.I.
Newfoundland
Nu
mb
er o
f in
dex
AM
I ev
ents
20012006201120162021

July 2007
Projected number of new AMI events (from new Index AMIs only)
0
20000
40000
60000
80000
100000
120000
140000
2001 2006 2011 2016 2021
Year
Nu
mb
er o
f A
MI-
rela
ted
eve
nts
Death after CHFDeath after UADeath after second AMIDeath after incidence AMIIn-hospital deathsCongestive Heart FailureUnstable AnginaSecond AMIIndex AMI
* includes death from non-IHD causes
*

July 2007
Projected Number Eligible for Statin Use in Ontario in 2001 – CMAJ 2000 Guidelines (’000s)
<4 4-5 5-6 6-7 >=7 Total
0-5% 4 148 1 887 969 373 288 7 666
5-10% 201 278 238 116 111 945
10-15% 54 102 88 51 56 351
15-20% 14 40 41 28 27 150
20-25% 2 11 19 14 16 63
25-30% 1 5 9 8 9 33
>=30% 0 2 8 9 13 33
Medication and lifestyle change, n = 109,000
Medication if target not reach after 6 months of lifestyle changes, n = 399,000Medication if target not reach after 3 months of lifestyle changes, n = 162,000
Based on the recommendations for the management and treatment of dyslipidemia (CMAJ 2000)
Total Cholesterol / HDL
10-y
ear
pre
dic
ted
ris
k o
f A
MI

July 2007
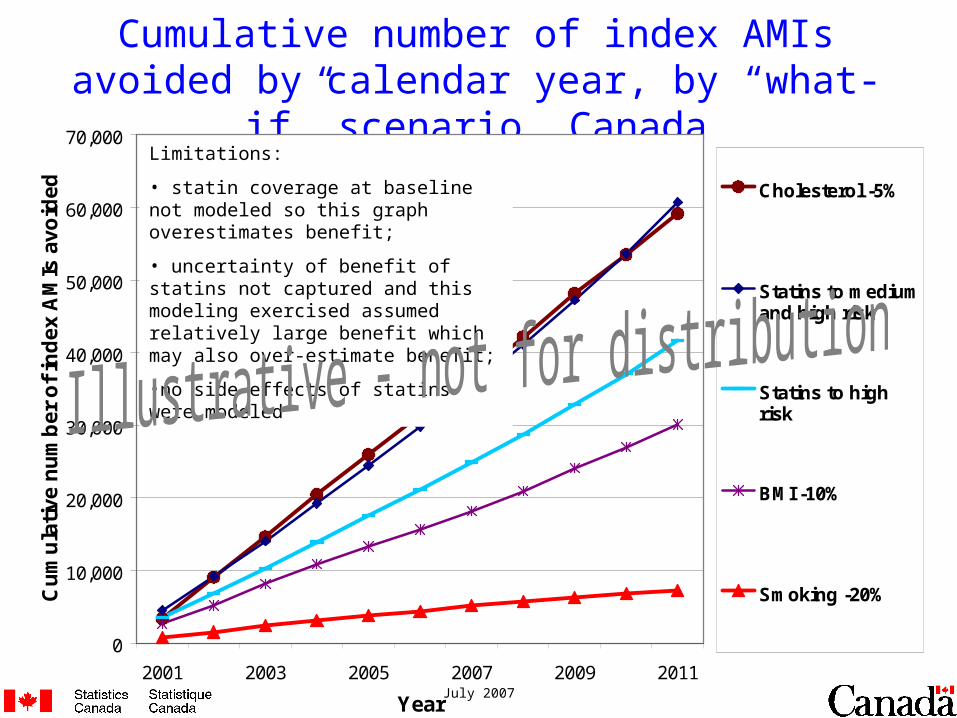
Illustrative “What-if ?” Scenarios• Statins: given to people at high risk according to
guidelines from working group on dyslipidemias; reduces their AMI risk by 31% (La Rosa, 99).
• BMI: 10% reduction for everyone overweight or obese (BMI ≥ 25) at baseline in 2001
• Smoking: 20% of smokers permanently quit smoking at baseline in 2001
• Cholesterol: 5% reduction of total cholesterol value for everyone at baseline in 2001
• Note: interactions in RF dynamics change in one at baseline affects subsequent levels of others
July 2007
Cumulative number of index AMIs avoided by calendar year, by “what-if” scenario, Canada
0
10,000
20,000
30,000
40,000
50,000
60,000
70,000
2001 2003 2005 2007 2009 2011
Year
Cu
mu
lati
ve n
um
ber
of
ind
ex A
MIs
avo
ided Cholesterol -5%
Statins to mediumand high risk
Statins to highrisk
BMI -10%
Smoking -20%
Limitations:
• statin coverage at baseline not modeled so this graph overestimates benefit;
• uncertainty of benefit of statins not captured and this modeling exercised assumed relatively large benefit which may also over-estimate benefit;
•no side-effects of statins were modeled

July 2007
0%
20%
40%
60%
80%
100%2
001
20
022
003
20
042
005
20
062
007
20
082
009
20
102
011
20
122
013
20
142
015
20
162
017
20
182
019
20
202
021
20
012
002
20
032
004
20
052
006
20
072
008
20
092
010
20
112
012
20
132
014
20
152
016
20
172
018
20
192
020
20
21
Female Male
Background Smoking Diabetes Blood pressure Cholesterol HDL
Projected fraction of AMI cases attributable to risk factors
37%
47%
58%62%
July 2007
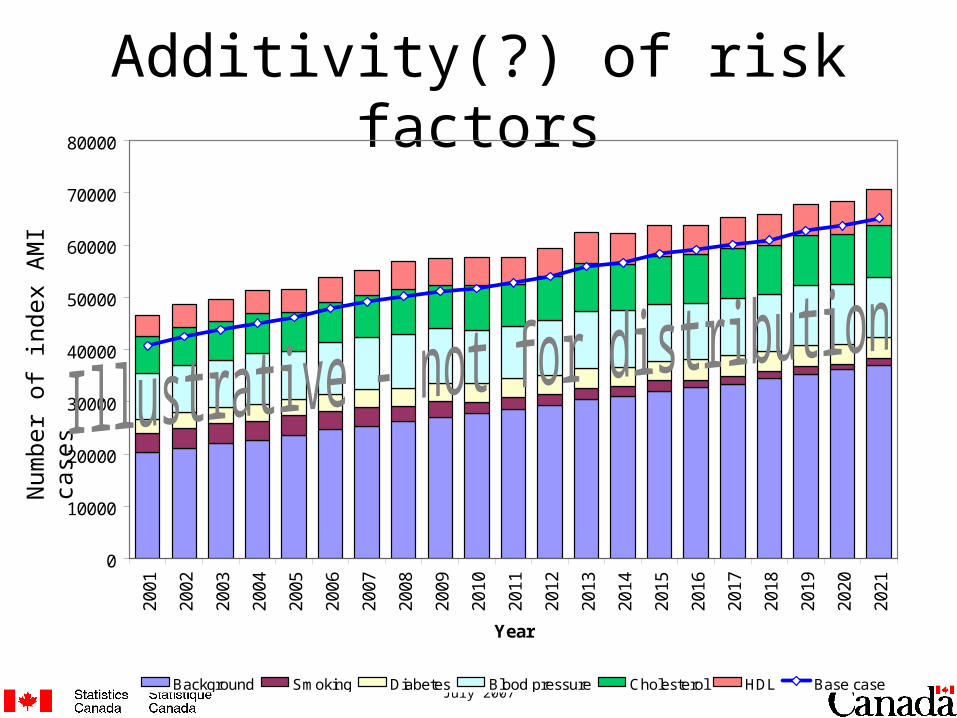
Additivity(?) of risk factors
0
10000
20000
30000
40000
50000
60000
70000
8000020
01
2002
2003
2004
2005
2006
2007
2008
2009
2010
2011
2012
2013
2014
2015
2016
2017
2018
2019
2020
2021
Year
Background Smoking Diabetes Blood pressure Cholesterol HDL Base case
Num
ber
of in
dex
AM
I ca
ses

July 2007
Summary of preliminary results
• Number of AMI cases projected to increase, principally due to aging of the population
• smoking projected to decline, reduces the overall increase in AMI
• proportion of persons with diabetes projected to rise• approximately 10% of new index AMI cases attributed to
diabetes• in males, 24% of new AMI cases attributed to elevated
blood pressure• in females, 17% of new AMI cases attributed to elevated
total cholesterol
July 2007
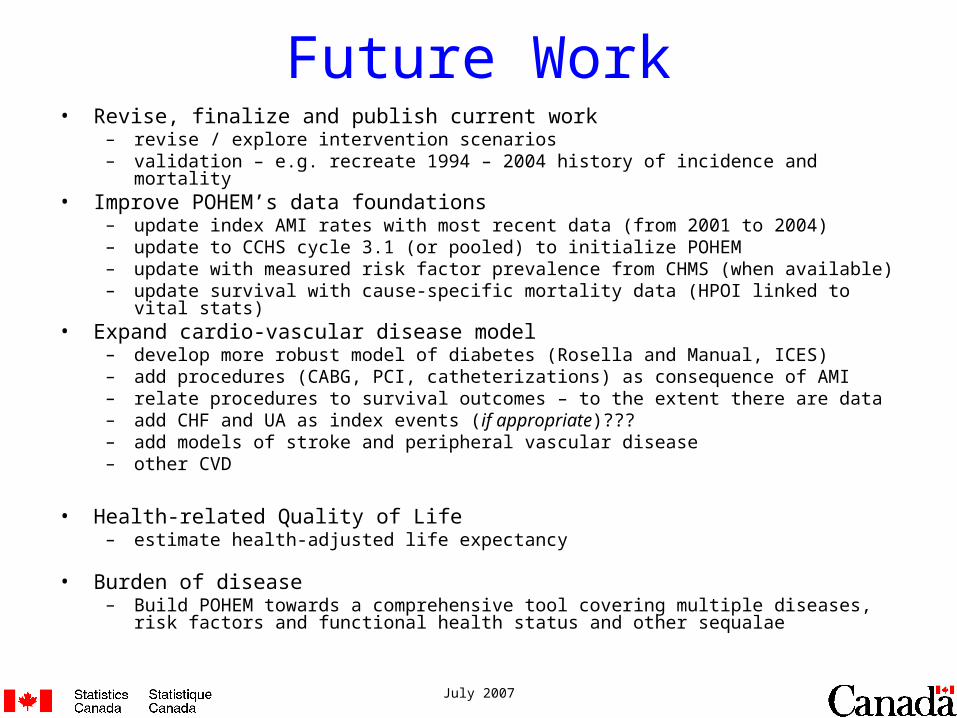
• Revise, finalize and publish current work– revise / explore intervention scenarios– validation – e.g. recreate 1994 – 2004 history of incidence and mortality
• Improve POHEM’s data foundations– update index AMI rates with most recent data (from 2001 to 2004)– update to CCHS cycle 3.1 (or pooled) to initialize POHEM– update with measured risk factor prevalence from CHMS (when available)– update survival with cause-specific mortality data (HPOI linked to vital stats)
• Expand cardio-vascular disease model– develop more robust model of diabetes (Rosella and Manual, ICES)– add procedures (CABG, PCI, catheterizations) as consequence of AMI– relate procedures to survival outcomes – to the extent there are data– add CHF and UA as index events (if appropriate)???– add models of stroke and peripheral vascular disease– other CVD
• Health-related Quality of Life– estimate health-adjusted life expectancy
• Burden of disease– Build POHEM towards a comprehensive tool covering multiple diseases, risk factors and
functional health status and other sequalae
Future Work
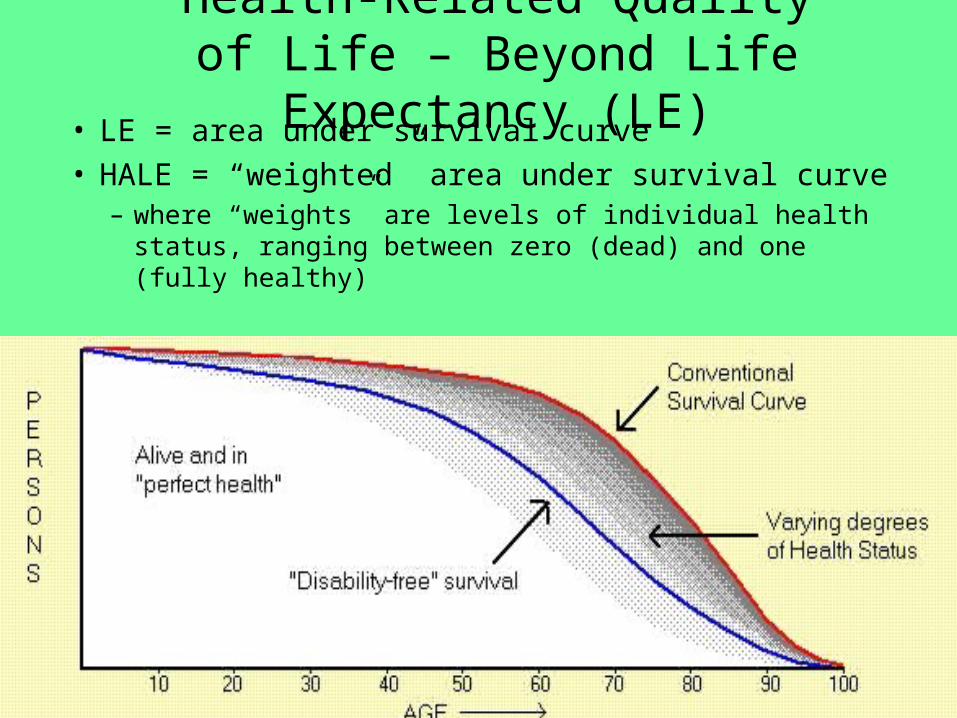
Health-Related Quality of Life – Beyond Life Expectancy (LE)
• LE = area under survival curve• HALE = “weighted” area under survival curve
– where “weights” are levels of individual health status, ranging between zero (dead) and one (fully healthy)
July 2007
NutritionDiabetes
Kidney Disease
Diabetic Retinopathy
Osteoarthritis
CoronaryHeart
Disease
PeripheralVascularDisease
Stroke
Obesity
Physical activity
Alcohol
25 Cancers
Region
Smoking
Cholesterol
blood pressur
e
hypertensive
Ethnicity
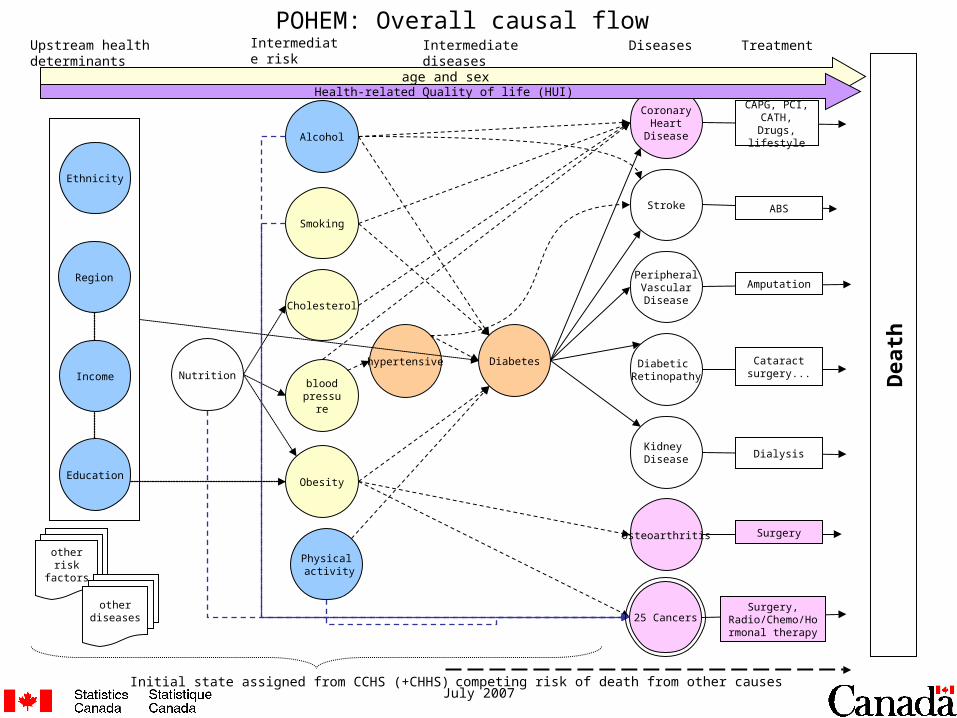
Upstream health determinants
Intermediate risk factors
Intermediate diseases Diseases Treatment
Initial state assigned from CCHS (+CHHS)
Dea
th
competing risk of death from other causes
Amputation
Dialysis
ABS
Surgery
Surgery, Radio/Chemo/Hor
monal therapy
Cataract surgery...
CAPG, PCI, CATH, Drugs,
lifestyle
POHEM: Overall causal flow
age and sex
other risk factors
other diseases
Income
Education
Health-related Quality of life (HUI)


![The Population Health Model (POHEM): an overview of ...chronic disease [11–14]. Beyond policy and program evaluation, microsimulation methods can also play an important role in population](https://img.pdfslide.net/doc/110x75/60a04c4f70869f4dec51b4d9/the-population-health-model-pohem-an-overview-of-chronic-disease-11a14.jpg)