Embed Size (px)
Citation preview

July 2012
The Economic Impact of Tourism in Clark County, Ohio
2
Clark County Tourism Summary
Clark County
Employment 4,271
Total Tourism ImpactClark County, Ohio
Taxes $41.8 million
Sales $326.2 million
Wages $79.8 million

3
Overview
Tourism is an integral and driving component of the Clark County economy, sustaining 8.9% of salaried employment.
Visitors to Clark County generated business sales of $326 million, directly and indirectly, in 2011.
Tourism is a diverse composite of economic activities, including transportation, recreation, retail, lodging, and food & beverage sectors.

State Summary

5
Key results
More than 440,000 jobs, with associated income of $10.5 billion, were sustained by visitors to Ohio last year.
These jobs represent 8.7% of total employment in Ohio – 1 in every 15.5 jobs in Ohio is sustained by the tourism economy.
Including indirect and induced impacts, tourism in Ohio generated $2.7 billion in state and local taxes and $2.6 billion in Federal taxes last year.
In the absence of the state and local taxes generated by tourism, each Ohio household would need to pay $600 to maintain the current level of government services.

6
Key themes for 2011
The Ohio visitor economy continued to expand in 2011. Visitor spending within Ohio rose 6.5% after a 7.4% increase in 2010.
■ Visitor volumes rose for a second straight year, 181.5 million people travelled in Ohio in 2011 – a new high.
■ Growth in overnight visitation remains strong. Domestic overnight visitation grew 4.7% buoyed by strong hotel room demand growth of 6.4% in 2011.
■ Per trip spending rose as gas prices rose and hotels and other tourism providers start to recoup recessionary price cuts.
Visitor spending of $26.3 billion generated $40 billion in total business sales in 2011 as tourism dollars flowed through the Ohio economy.
Tourism taxes grew faster than overall state tax receipts.

7
Growth in tourism sales
The tourism industry surpassed pre-recession highs.
Visitor spending increasing 6.5% and total sales (including indirect and induced impacts) increasing 5.5%.
Ohio registered over $40 billion in total tourism sales in 2011.
$34.9
$36.5
$38.3
$39.2
$35.8
$38.2
$40.3
$32
$33
$34
$35
$36
$37
$38
$39
$40
$41
2005 2006 2007 2008 2009 2010 2011
-10%
-8%
-6%
-4%
-2%
0%
2%
4%
6%
8%
TOTAL % Change
Total Tourism SalesUS$ Billions
Source : Tourism Economics
8
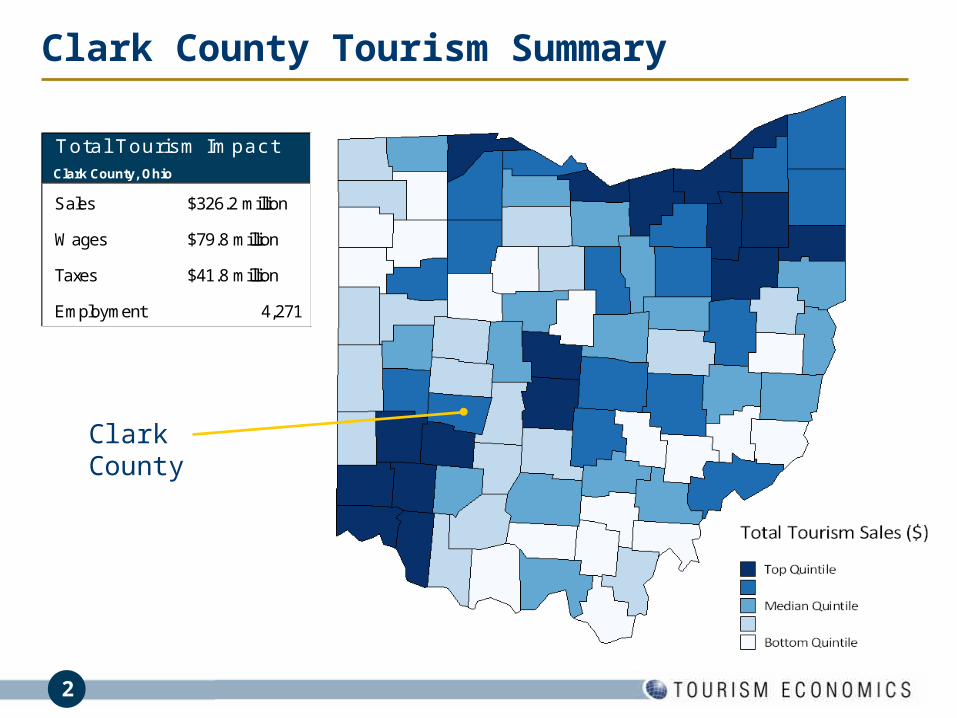
Visitor spending by sector
Higher gas prices in 2011 increased the transportation share of tourism spending to 31%, just short of the 2008 high.
Food & beverage spending ranks second, capturing 26% of visitor spending.
The growth in overnight stays along with increasing room rates increased the share of spending on accommodations to 10%.
F&B26%
Retail15%
Trans31%
Air2%
Rec16%
Lodging10%
Visitor Spending By Sector
Source : Tourism Economics
9
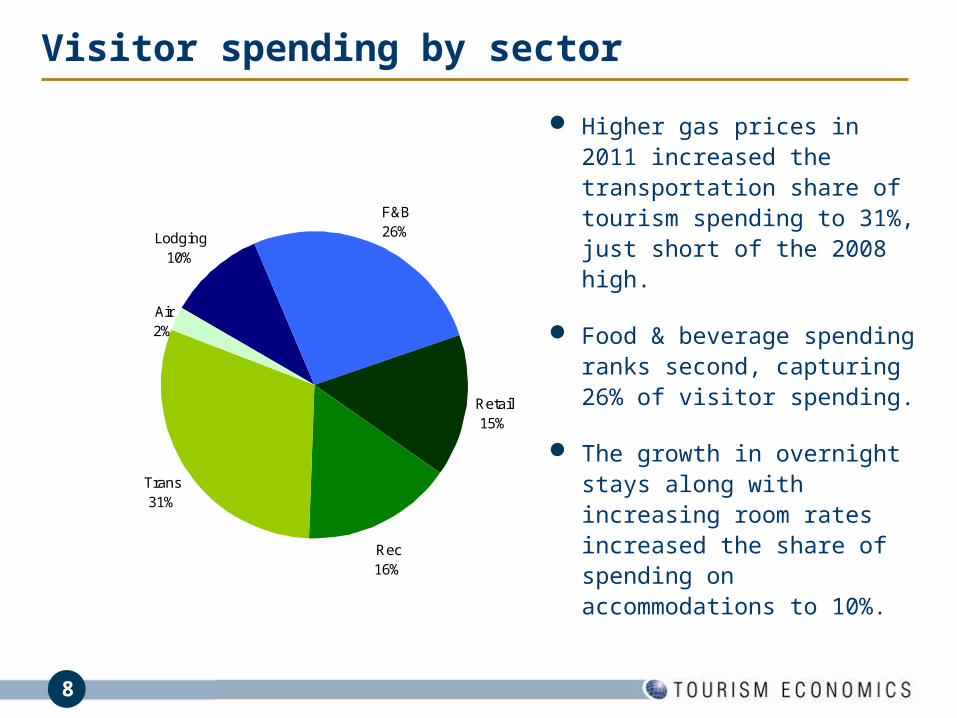
Total tourism sales
Business Day
Direct Indirect Induced Total2011 direct
sales growthAgriculture, Fishing, Mining - 189.9 69.5 259.4 0.0%Construction and Utilities - 445.8 181.7 627.5 0.0%
Manufacturing - 1,612.7 743.7 2,356.4 0.0%
Wholesale Trade - 53.7 39.5 93.2 0.0%
Air Transport 624.1 10.9 9.9 644.9 2.6%
Other Transport 2,758.8 451.3 191.9 3,402.0 6.8%
Retail Trade 3,846.1 215.1 868.5 4,929.7 4.6%
Gasoline Stations 4,569.9 14.7 54.5 4,639.1 14.6%
Communications - 457.4 197.4 654.8 0.0%
Finance, Insurance and Real Estate 972.4 1,324.1 904.4 3,200.8 5.7%
Business Services - 1,796.9 513.8 2,310.6 0.0%
Education and Health Care - 5.9 1,254.7 1,260.6 0.0%
Recreation and Entertainment 4,074.2 113.3 98.0 4,285.5 2.9%
Lodging 2,762.4 42.7 34.9 2,840.0 9.4%
Food & Beverage 6,727.6 116.1 330.9 7,174.6 3.9%
Personal Services - 175.1 299.5 474.6 0.0%
Government - 179.5 1,010.1 1,189.6 0.0%
TOTAL 26,335.5 7,205.1 6,802.6 40,343.3 6.5%
* Direct sales include cost of goods sold for retail sectors
Tourism Sales(US$ Million)

10
All business sectors of the Ohio economy benefit from tourism activity directly and/or indirectly.
Sectors that serve the tourism industry, like business services, gain as suppliers to a dynamic industry.
Total tourism sales
0
1,000
2,000
3,000
4,000
5,000
6,000
7,000
8,000
F&
B
Ret
ail T
rade
Gas
Rec
reat
ion
Oth
er T
rans
p
FIR
E
Lodg
ing
Man
u
Bus
. S
ervi
ces
Edu
catio
n
Gov
.
Com
m.
Induced
Indirect
Direct
Tourism Sales by Industry$ million

11
How visitor spending generates impact
• Lastly, the induced impact is generated when employees whose incomes are generated either directly or indirectly by tourism, spend those incomes in the state economy.
• Travelers create direct economic value within a discreet group of sectors (e.g. recreation, transportation). This supports a relative proportion of jobs, wages, taxes, and GDP within each sector.
• Each directly affected sector also purchases goods and services as inputs (e.g. food wholesalers, utilities) into production. These impacts are called indirect impacts.

12
Total tourism employment
Direct Indirect Induced TotalAgriculture, Fishing, Mining - 2,443 851 3,295 Construction and Utilities - 1,692 350 2,041
Manufacturing - 3,968 1,652 5,620
Wholesale Trade - 302 219 521
Air Transport 3,034 44 40 3,118
Other Transport 29,645 4,197 1,559 35,402
Retail Trade 43,748 3,173 12,700 59,622
Gasoline Stations 11,914 187 681 12,781
Communications - 2,052 707 2,759
Finance, Insurance and Real Estate 6,981 8,596 5,111 20,688
Business Services - 16,982 5,209 22,191
Education and Health Care - 91 15,220 15,311
Recreation and Entertainment 58,690 3,034 1,855 63,579
Lodging 37,216 611 478 38,305
Food & Beverage 136,346 2,349 6,605 145,300
Personal Services - 2,336 5,564 7,900
Government - 921 518 1,439
TOTAL 327,574 52,980 59,317 439,872
Tourism Economy Employment
The tourism sector directly and indirectly supported 440,000 jobs, or 8.7% of all employment in Ohio last year.
13
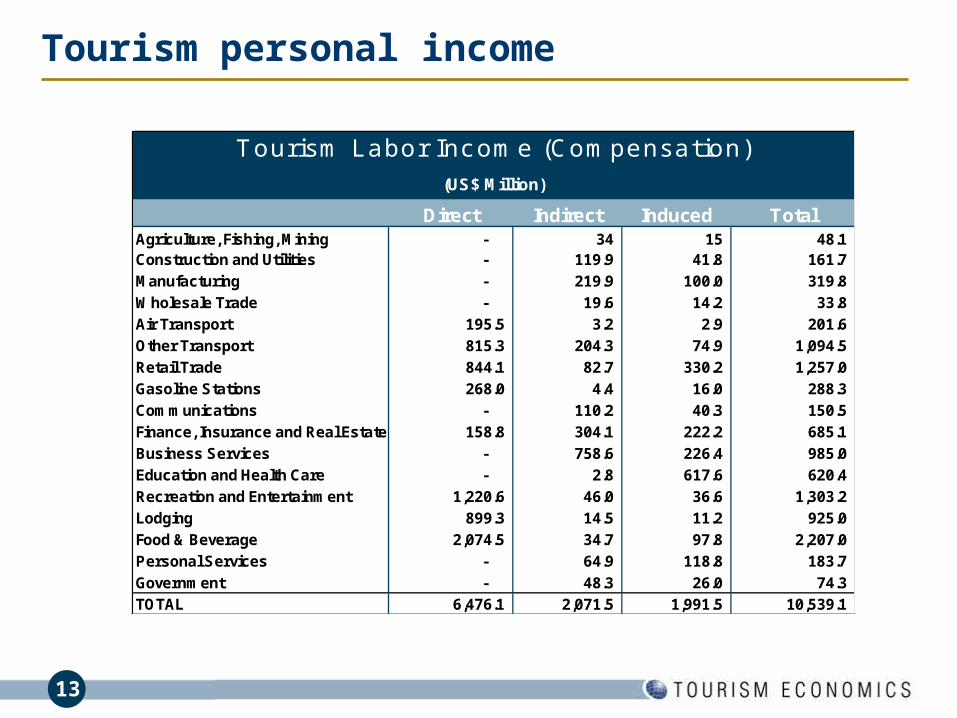
Tourism personal income
Business Day
Direct Indirect Induced TotalAgriculture, Fishing, Mining - 34 15 48.1 Construction and Utilities - 119.9 41.8 161.7
Manufacturing - 219.9 100.0 319.8
Wholesale Trade - 19.6 14.2 33.8
Air Transport 195.5 3.2 2.9 201.6
Other Transport 815.3 204.3 74.9 1,094.5
Retail Trade 844.1 82.7 330.2 1,257.0
Gasoline Stations 268.0 4.4 16.0 288.3
Communications - 110.2 40.3 150.5
Finance, Insurance and Real Estate 158.8 304.1 222.2 685.1
Business Services - 758.6 226.4 985.0
Education and Health Care - 2.8 617.6 620.4
Recreation and Entertainment 1,220.6 46.0 36.6 1,303.2
Lodging 899.3 14.5 11.2 925.0
Food & Beverage 2,074.5 34.7 97.8 2,207.0
Personal Services - 64.9 118.8 183.7
Government - 48.3 26.0 74.3
TOTAL 6,476.1 2,071.5 1,991.5 10,539.1
Tourism Labor Income (Compensation)(US$ Million)

14
Tourism tax generation
Taxes of $5.3 billion were directly and indirectly generated by tourism in 2011.
State and local taxes alone tallied $2.7 billion.
Each household in Ohio would need to be taxed an additional $600 per year to replace the tourism taxes received by state and local governments.
Business Day
Total 2011 growth
Federal Taxes 2,581.8 3.8% Corporate 464.9 Indirect Business 236.1 Personal Income 789.3 Social Security 1,091.5
State Taxes 1,603.2 5.3% Corporate 395.9 Personal Income 319.3 Sales 758.8 State Social Security 57.7 Excise and Fees 71.4
Local Taxes 1,116.0 4.4% Personal Income 31.9 Sales 138.0 Property 724.2 Admissions 23.6 Lodging 131.8 Other Taxes and Fees 66.4 TOTAL 5,301.1 4.4%
Tourism-Generated Taxes(US$ Million)

Regional Summary

16
Northeast36%
Southwest24%
Central23%
Northwest13%
Southeast4%
Tourism Sales by Region
■Including Cincinnati
■Including Cleveland
■Including Columbus
■Including Toledo
■Including Hocking Hills
Tourism Sales
Cleveland, Cincinnati and Columbus are anchors which influence the distribution of the tourism economy across Ohio.
Relative to the size of their economies, tourism is still of significant importance to the Northwest and Southeast regions.

17
Tourism Employment
020406080
100120140160180
Nor
thea
st
Sout
hwes
t
Cent
ral
Nor
thw
est
Sout
heas
t
ThousandsTourism Employment by Region
InducedIndirectDirect
■Business ■Day

18
Tourism Wages
0.00.51.01.52.02.53.03.54.04.5
Nor
thea
st
Sout
hwes
t
Cent
ral
Nor
thw
est
Sout
heas
t
$ BillionsTourism Earnings by Region
InducedIndirectDirect

Southwest Ohio Detail

20
Southwest Ohio Tourism Impact
County Sales Employment Wages TaxesAdams 29,074,506$ 475 7,466,149$ 3,719,547$
Brown 44,400,609 766 11,063,749 5,901,276
Butler 900,231,839 11,701 233,140,534 115,230,020
Champaign 45,692,272 922 11,559,575 5,838,281
Clark 326,214,817 4,271 79,835,086 41,774,782
Clermont 534,349,774 6,553 126,161,202 69,313,211
Clinton 81,469,282 851 20,471,176 10,465,197
Darke 63,338,113 1,426 16,773,241 8,112,104
Fayette 72,872,517 824 19,618,634 9,346,771
Greene 471,656,731 6,471 125,349,042 60,735,388
Hamilton 4,260,111,946 41,357 1,118,386,883 571,548,379
Highland 43,372,465 1,027 11,590,608 5,548,118
Miami 211,558,458 2,884 58,949,658 27,176,183
Montgomery 1,652,101,610 19,191 413,842,797 211,690,859
Preble 52,847,190 1,147 15,860,359 6,769,011
Warren 993,075,833 10,657 260,904,908 127,571,918
Southwest Ohio 9,782,367,962 110,524 2,530,973,601 1,280,741,045
* Includes Direct, Indirect and Induced impacts. Sales includes cost of goods sold for retail sectors.
Total Tourism Impact*

21
Hamilton
Montgomery
Warren
Butler
Clermont
Greene
ClarkMiamiClintonFayette
DarkePreble
ChampaignBrownHighlandAdams
Total Tourism Sales: $9.8 billion
Southwest Ohio Tourism Sales
Total tourism sales tallied $9.8 billion in Southwest Ohio in 2011, up 5.1% from 2010.

22
0%
2%
4%
6%
8%
10%
12%
14%
16%
Adam
s
Brow
n
Butle
r
Cham
paig
n
Clar
k
Cler
mon
t
Clin
ton
Dar
ke
Faye
tte
Gre
ene
Ham
ilton
Hig
hlan
d
Mia
mi
Mon
tgom
ery
Preb
le
War
ren
Tourism Share of Total Employment
DirectTotalState Average (Total)
Southwest Ohio Tourism Employment
At nearly 9% of all employment, tourism is an important part of the Southwest Ohio economy.

23
Southwest Ohio Tourism Wages
0
100
200
300
400
500
600Fo
od &
Bev
Reta
il Tra
de
Rec.
& E
nt.
Tran
spor
tatio
n
Busi
ness
Serv
.
Lodg
ing
Fin.
, Ins
. & R
E
Educ
. & H
ealth
Man
ufac
turin
g
Pers
onal
Ser
v.
Cons
t. &
Util
ities
Com
mun
icati
ons
Gov
ernm
ent
Ag. &
Min
ing
Who
lesa
le Tr
ade
$ MillionsTourism Earnings by Industry
InducedIndirectDirect

Clark County Detail

25
Tourism Sales Trend
■Business ■Day
2009 2010 2011Clark County sales trend:
Sales volume (US$ Million) 306.8 312.0 326.2
Sales growth (% year) -6.2% 1.7% 4.6%
Sales trend for the wider region and state:
Southwest Ohio sales growth (% year) -8.6% 7.4% 5.1%
Ohio sales growth (% year) -8.8% 6.9% 5.6%
Recent Trend in Tourism Sales (Output)

26
Tourism Sales
■Business ■Day
Visitors generated $326 million in business activity in Clark County in 2011.
In addition to direct tourism industries, the manufacturing sector and business services sectors are important tourism beneficiaries as suppliers.
Direct* Indirect Induced Total
Agriculture, Fishing, Mining - 1,534,450 563,583 2,098,033
Construction and Utilities - 3,602,217 1,473,821 5,076,038
Manufacturing - 13,031,454 6,033,619 19,065,074
Wholesale Trade - 433,940 320,150 754,090
Transportation 20,525,209 3,734,421 1,637,216 25,896,846
Retail Trade 67,798,908 1,857,521 7,488,067 77,144,496
Communications - 3,695,941 1,601,301 5,297,242
Finance, Insurance and Real Estate 24,837,453 10,699,100 7,337,550 42,874,103
Business Services - 14,519,426 4,168,438 18,687,863
Education and Health Care - 47,599 10,179,431 10,227,030
Recreation and Entertainment 21,820,666 915,328 795,134 23,531,128
Lodging 19,770,036 344,794 283,154 20,397,984
Food & Beverage 58,050,832 938,515 2,684,689 61,674,036
Personal Services - 1,415,286 2,429,621 3,844,907
Government - 1,450,621 8,195,326 9,645,946
TOTAL 212,803,104 58,220,613 55,191,101 326,214,817
% change 09 - 10 2.2% 1.0% 0.7% 1.7%
% change 10 - 11 5.4% 2.1% 3.8% 4.6%
* Direct sales includes cost of goods sold for retail sectors
Tourism Sales (Output)(US$)

27
Tourism Sales
0102030405060708090
Reta
il Tra
de
Food
& B
ev.
Fin.
, Ins
. & R
E
Tran
spor
tatio
n
Rec.
and
Ent
.
Lodg
ing
Man
ufac
turin
g
Busi
ness
Serv
.
Educ
. & H
ealth
Gov
ernm
ent
Com
mun
icati
ons
Cons
t. &
Util
ities
Pers
onal
Ser
v.
Ag. &
Min
ing
Who
lesa
le Tr
ade
$ MillionTourism Sales by Industry
InducedIndirectDirect

28
Tourism Employment
Tourism supports 1 in every 11 salaried jobs in Clark County.
Direct Indirect Induced TotalAgriculture, Fishing, Mining - 24 8 33
Construction and Utilities - 16 3 20
Manufacturing - 39 16 55
Wholesale Trade - 3 2 5
Transportation 269 41 16 326
Retail Trade 528 32 129 689
Communications - 20 7 26
Finance, Insurance and Real Estate 177 82 49 308
Business Services - 167 51 219
Education and Health Care - 1 148 149
Recreation and Entertainment 500 29 18 547
Lodging 320 6 5 331
Food & Beverage 1,387 23 64 1,474
Personal Services - 23 54 76
Government - 9 5 14
TOTAL 3,182 515 575 4,271
% change 09 - 10 -5.0% -4.6% -4.6% -4.9%
% change 10 - 11 -0.6% -0.5% -0.9% -0.7%
Tourism Employment

29
Tourism Employment
0.00.20.40.60.81.01.21.41.6
Food
& B
ev.
Reta
il Tra
de
Rec.
and
Ent
.
Lodg
ing
Tran
spor
tatio
n
Fin.
, Ins
. & R
E
Busi
ness
Serv
.
Educ
. & H
ealth
Pers
onal
Ser
v.
Man
ufac
turin
g
Ag. &
Min
ing
Com
mun
icati
ons
Cons
t. &
Util
ities
Gov
ernm
ent
Who
lesa
le Tr
ade
ThousandsTourism Employment by Industry
InducedIndirectDirect
30
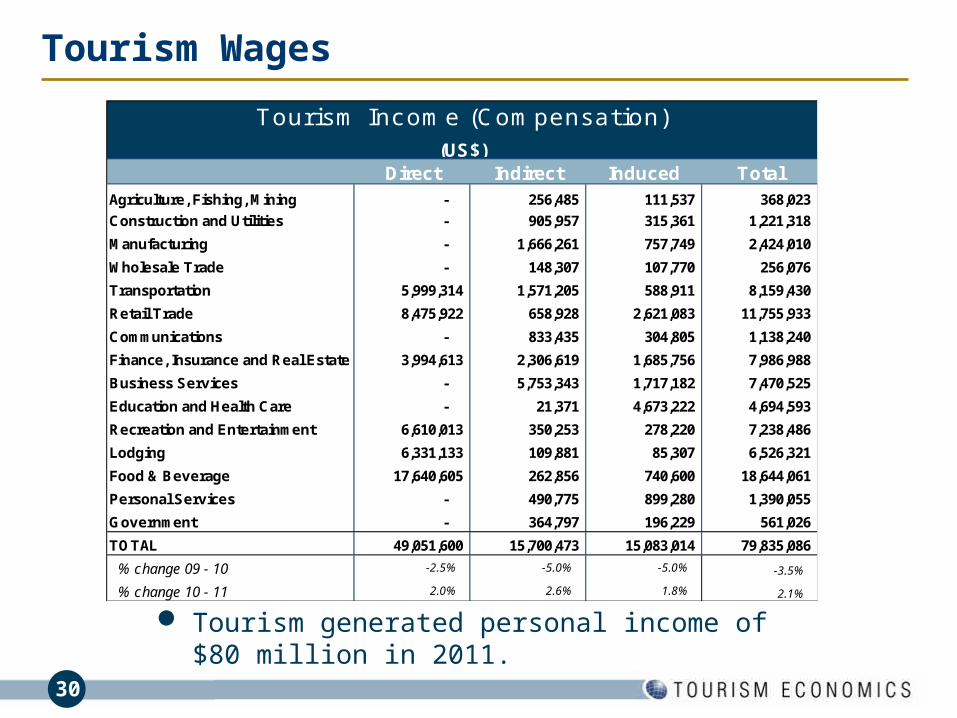
Tourism Wages
Tourism generated personal income of $80 million in 2011.
Direct Indirect Induced TotalAgriculture, Fishing, Mining - 256,485 111,537 368,023
Construction and Utilities - 905,957 315,361 1,221,318
Manufacturing - 1,666,261 757,749 2,424,010
Wholesale Trade - 148,307 107,770 256,076
Transportation 5,999,314 1,571,205 588,911 8,159,430
Retail Trade 8,475,922 658,928 2,621,083 11,755,933
Communications - 833,435 304,805 1,138,240
Finance, Insurance and Real Estate 3,994,613 2,306,619 1,685,756 7,986,988
Business Services - 5,753,343 1,717,182 7,470,525
Education and Health Care - 21,371 4,673,222 4,694,593
Recreation and Entertainment 6,610,013 350,253 278,220 7,238,486
Lodging 6,331,133 109,881 85,307 6,526,321
Food & Beverage 17,640,605 262,856 740,600 18,644,061
Personal Services - 490,775 899,280 1,390,055
Government - 364,797 196,229 561,026
TOTAL 49,051,600 15,700,473 15,083,014 79,835,086
% change 09 - 10 -2.5% -5.0% -5.0% -3.5%
% change 10 - 11 2.0% 2.6% 1.8% 2.1%
Tourism Income (Compensation)(US$)

31
Tourism Wages
02468
101214161820
Food
& B
ev.
Reta
il Tra
de
Tran
spor
tatio
n
Fin.
, Ins
. & R
E
Busi
ness
Serv
.
Rec.
and
Ent
.
Lodg
ing
Educ
. & H
ealth
Man
ufac
turin
g
Pers
onal
Ser
v.
Cons
t. &
Util
ities
Com
mun
icati
ons
Gov
ernm
ent
Ag. &
Min
ing
Who
lesa
le Tr
ade
$ MillionTourism Earnings by Industry
InducedIndirectDirect

32
Tourism Tax Generation
The tourism industry generated $42 million in taxes in 2011.
Tourism generated $21 million in state and local taxes.
■ $13 million in state taxes
■ $8 million in local taxes
Total
Federal Taxes 20,910,278
State Taxes 12,966,499
Local Taxes 7,898,005
TOTAL 41,774,782
Tourism-Generated Taxes(US$)

33
Methodological Notes
Visitor spending data are derived from several sources including:
Longwoods International survey of travelers
Longwoods International survey of accommodations
Statistics Canada data on spending in Ohio
Office of Travel & Tourism Industries estimates of overseas visits to Ohio
Economic data are compiled by industry from the Bureau of Economic Analysis and Bureau of Labor Statistics. These provide industry detail on employment, value added, and wages by industry.
The economic impact analysis uses an IMPLAN (www.implan.com) input-output model for the state of Ohio which tracks spending by visitors to industries and among industries and households. This estimates indirect (supply chain) impacts and induced (income effect) impacts as wages are spent in the state economy.

34
About Tourism Economics
Tourism Economics, headquartered in Philadelphia, is an Oxford Economics company dedicated to providing high value, robust, and relevant analyses of the tourism sector that reflects the dynamics of local and global economies. By combining quantitative methods with industry knowledge, Tourism Economics designs custom market strategies, project feasibility analysis, tourism forecasting models, tourism policy analysis, and economic impact studies.
Our staff have worked with over 100 destinations to quantify the economic value of tourism, forecast demand, guide strategy, or evaluate tourism policies.
Oxford Economics is one of the world’s leading providers of economic analysis, forecasts and consulting advice. Founded in 1981 as a joint venture with Oxford University’s business college, Oxford Economics is founded on a reputation for high quality, quantitative analysis and evidence-based advice. For this, it draws on its own staff of 40 highly-experienced professional economists; a dedicated data analysis team; global modeling tools; close links with Oxford University, and a range of partner institutions in Europe, the US and in the United Nations Project Link.
![State v. Clark...[Cite as State v.Clark, 2014-Ohio-4873.] IN THE COURT OF APPEALS OF OHIO THIRD APPELLATE DISTRICT HANCOCK COUNTY STATE OF OHIO, PLAINTIFF-APPELLEE, CASE NO. …](https://img.pdfslide.net/doc/110x75/5fa75f475a462a360b4b28df/state-v-clark-cite-as-state-vclark-2014-ohio-4873-in-the-court-of-appeals.jpg)
![Springfield v. State - supremecourt.ohio.gov · [Cite as Springfield v. State, 2016-Ohio-725.] IN THE COURT OF APPEALS OF OHIO SECOND APPELLATE DISTRICT CLARK COUNTY CITY OF SPRINGFIELD,](https://img.pdfslide.net/doc/110x75/5b17f8fa7f8b9a3c258b5880/springfield-v-state-cite-as-springfield-v-state-2016-ohio-725-in-the.jpg)


![PUB. DATE 144 647 DOCUMENTNISESUME. JC 770 458 TITLE Clark Te*chnical College Adjunct Faculty Handbook. INSTITUTION Clark Technical Coll., Springfield, Ohio. PUB. DATE [77] NOTE. 46p.;](https://img.pdfslide.net/doc/110x75/5b038ef07f8b9a89208c5d67/pub-date-144-647-documentnisesume-jc-770-458-title-clark-technical-college-adjunct.jpg)