Embed Size (px)
Citation preview

-=
July 2021

Contents
Stock Market Indices .................................................................................................... 3
TSE and IFB Market Capitalization ................................................................................ 4
Industries Market Capitalization .................................................................................. 5
Exchanges' Trading Statistics ........................................................................................ 6
Instruments' Trading Statistics ..................................................................................... 7
Share of Institutional and Individual Investors in Trading Value ................................. 8
Institutional and Individual Transactions ..................................................................... 8
Sukuk ............................................................................................................................. 9
Number of Listed and Unlisted Companies .................................................................. 9
Initial Public Offerings................................................................................................. 10
Abbreviation
IFB Iran Fara Bourse
IFX Iran Fara Bourse Index
IME Iran Mercantile Exchange
IRENEX Iran Energy Exchange
SPS Standard Parallel Salam
TEDPIX Tehran Dividend and Price Index
TRI Total Return Index
TSE Tehran Stock Exchange

Iran Capital Market Insight 3
Stock Market Indices
The end of month figure of Iran stock market major indices including the TSE's (TEDPIX) and
the IFB's total return index (IFX) is compared with that of the previous month in Table 1.
Table 1: Stock Market Indices
Change (%) June 2021 July 2021 Index
12.4% 1,168,665 1,313,306 TEDPIX
10% 17,319 19,049 IFX
The past year's trend of the indices is illustrated in the following figure.
15,000
16,000
17,000
18,000
19,000
20,000
21,000
22,000
1,000,000
1,200,000
1,400,000
1,600,000
1,800,000
2,000,000
2,200,000
2020
/08/
01
2020
/08/
09
2020
/08/
17
2020
/08/
25
2020
/09/
02
2020
/09/
10
2020
/09/
18
2020
/09/
26
2020
/10/
04
2020
/10/
12
2020
/10/
20
2020
/10/
28
2020
/11/
05
2020
/11/
13
2020
/11/
21
2020
/11/
29
2020
/12/
07
2020
/12/
15
2020
/12/
23
2020
/12/
31
2021
/01/
08
2021
/01/
16
2021
/01/
24
2021
/02/
01
2021
/02/
09
2021
/02/
17
2021
/02/
25
2021
/03/
05
2021
/03/
13
2021
/03/
21
2021
/03/
29
2021
/04/
06
2021
/04/
14
2021
/04/
22
2021
/04/
30
2021
/05/
08
2021
/05/
16
2021
/05/
24
2021
/06/
01
2021
/06/
09
2021
/06/
17
2021
/06/
25
2021
/07/
03
2021
/07/
11
2021
/07/
19
Figure 1: Major Indices
TEDPIX - (Left Axis) IFX - (Right Axis)
Iran Capital Market Insight 4
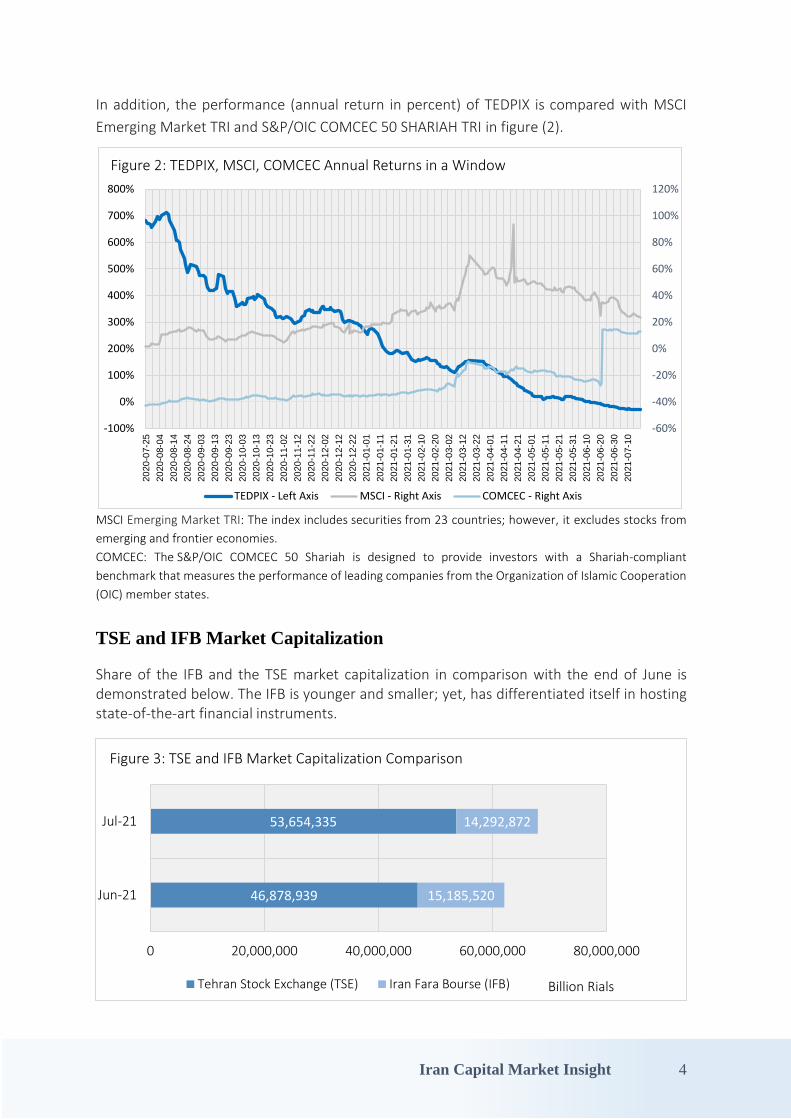
In addition, the performance (annual return in percent) of TEDPIX is compared with MSCI
Emerging Market TRI and S&P/OIC COMCEC 50 SHARIAH TRI in figure (2).
MSCI Emerging Market TRI: The index includes securities from 23 countries; however, it excludes stocks from
emerging and frontier economies.
COMCEC: The S&P/OIC COMCEC 50 Shariah is designed to provide investors with a Shariah-compliant
benchmark that measures the performance of leading companies from the Organization of Islamic Cooperation
(OIC) member states.
TSE and IFB Market Capitalization
Share of the IFB and the TSE market capitalization in comparison with the end of June is demonstrated below. The IFB is younger and smaller; yet, has differentiated itself in hosting state-of-the-art financial instruments.
-60%
-40%
-20%
0%
20%
40%
60%
80%
100%
120%
-100%
0%
100%
200%
300%
400%
500%
600%
700%
800%
20
20
-07-2
5
20
20
-08-0
4
20
20
-08-1
4
20
20
-08-2
4
20
20
-09-0
3
20
20
-09-1
3
20
20
-09-2
3
20
20
-10-0
3
20
20
-10-1
3
20
20
-10-2
3
20
20
-11-0
2
20
20
-11-1
2
20
20
-11-2
2
20
20
-12-0
2
20
20
-12-1
2
20
20
-12-2
2
20
21
-01-0
1
20
21
-01-1
1
20
21
-01-2
1
20
21
-01-3
1
20
21
-02-1
0
20
21
-02-2
0
20
21
-03-0
2
20
21
-03-1
2
20
21
-03-2
2
20
21
-04-0
1
20
21
-04-1
1
20
21
-04-2
1
20
21
-05-0
1
20
21
-05-1
1
20
21
-05-2
1
20
21
-05-3
1
20
21
-06-1
0
20
21
-06-2
0
20
21
-06-3
0
20
21
-07-1
0
Figure 2: TEDPIX, MSCI, COMCEC Annual Returns in a Window
TEDPIX - Left Axis MSCI - Right Axis COMCEC - Right Axis
46,878,939
53,654,335
15,185,520
14,292,872
0 20,000,000 40,000,000 60,000,000 80,000,000
Jun-21
Jul-21
Billion Rials
Figure 3: TSE and IFB Market Capitalization Comparison
Tehran Stock Exchange (TSE) Iran Fara Bourse (IFB)

Iran Capital Market Insight 5
Industries Market Capitalization
Tehran Stock Exchange and Iran Fara Bourse
The break-down of top industries' market capitalization in the aggregate of the IFB and the
TSE is depicted in the following figure.
Manufacture of chemical products,
22.5%
other, 17.4%
Manufacture of basic metals , 16.4%
Mining of metal ores, 9.3%
Banking and financial institutions, 7.2%
Investments7.0%
Multidisciplinary industrial activities, 6.8%
Manufacture of coke, refined petroleum
products and nuclear fuel, 5.4%
Automotive and manufacturing parts, 2.9%
Insurance & Pension Funds, except Social Security, 2.7%
Pharmaceutical products, 2.3%
FIGURE 4: TOP 10 INDUSTRIES

Iran Capital Market Insight 6
Exchanges' Trading Statistics The value of trades for each exchange is depicted in the following table.
Table 2: Value of trades for each exchange
Exchange Securities
Trade Value (Billion Rials) Percent change
Jul-21 Jun-21 Jul-20 compared to
previous month
compared to previous year
Tehran Stock Exchange
Stock 954,874 711,031 3,745,248 34.29% -74.50%
Sukuk 23,462 9,264 8,287 153.27% 183.13%
ETFs 209,325 288,877 114,031 -27.54% 83.57%
Iran Fara Bourse
Stock 345,746 205,929 1,368,613 67.90% -74.74%
Sukuk 1,889,999 1,108,397 391,565 70.52% 382.68%
ETFs 76,932 76,313 82,419 0.81% -6.66%
IME
Physical Market
375,175 442,452 232,264 -15.21% 61.53%
ETFs 2498 2073 5,997 20.50% -58.35%
IRENEX
Physical Market
106,391 68,696 112,182 54.87% -5.16%
ETFs 0 0.063 16 -100.00% -100.00%
Grand Total 3,984,403 2,913,033 6,060,623 36.78% -34.26%
Daily Average 199,220 138,716 263,505 43.62% -24.40%
The trading value of each exchange is depicted in the following figures.
0
1,000,000
2,000,000
3,000,000
4,000,000
5,000,000
6,000,000
Bill
ion
Ria
ls
Aug-20 Sep-20 Oct-20 Nov-20 Dec-20 Jan-21 Feb-21 Mar-21 Apr-21 May-21 Jun-21 Jul-21
IRENEX 91,405 39,346 388,427 21,448 62,007 33,335 33,231 86,274 43,755 74,869 68,696 106,391
IME 213,209 311,503 352,811 206,393 321,149 342,656 399,781 484,972 350,883 407,989 444,525 377,673
IFB 1,364,737 958,559 843,178 1,004,574 1,717,438 1,854,037 2,025,815 3,437,057 2,312,019 1,461,774 1,390,640 2,312,677
TSE 3,447,645 2,316,468 1,902,996 1,191,933 3,369,873 2,238,551 2,056,365 1,371,675 916,969 687,278 1,009,172 1,187,662
Figure5: Annual trend of total transaction value by exchanges

Iran Capital Market Insight 7
Instruments' Trading Statistics
444,525
1,975
1,281
251,357
187,839
2,073
377,673
4,421
2,769
195,388
172,597
2,498
0 100,000 200,000 300,000 400,000 500,000
Figure 6: IME Trade Value of Different Groups Jul JunB
illion
Rials
68,696
905
0
67,791
106,391
274
0
106,117
0 15,000 30,000 45,000 60,000 75,000 90,000 105,000 120,000
Figure 7: IRENEX Trade Value of Different Groups Jul Jun
Billio
nR
ials
Debt48%
Stock33%
Physical Markets
12%
ETFs 7%
Figure 8: Transactions value by type of securities
Iran Capital Market Insight 8
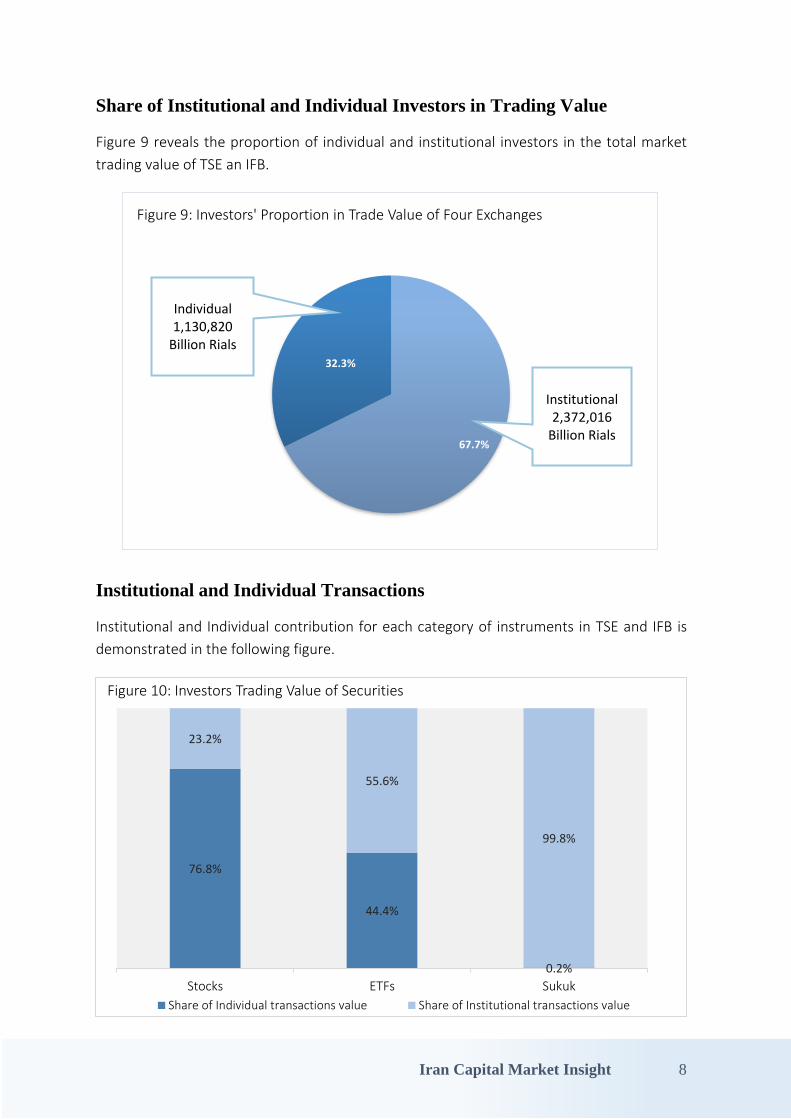
Share of Institutional and Individual Investors in Trading Value
Figure 9 reveals the proportion of individual and institutional investors in the total market
trading value of TSE an IFB.
Institutional and Individual Transactions
Institutional and Individual contribution for each category of instruments in TSE and IFB is
demonstrated in the following figure.
67.7%
32.3%
Figure 9: Investors' Proportion in Trade Value of Four Exchanges
Institutional 2,372,016
Billion Rials
Individual 1,130,820
Billion Rials
76.8%
44.4%
0.2%
23.2%
55.6%
99.8%
Stocks ETFs Sukuk
Figure 10: Investors Trading Value of Securities
Share of Individual transactions value Share of Institutional transactions value
Iran Capital Market Insight 9
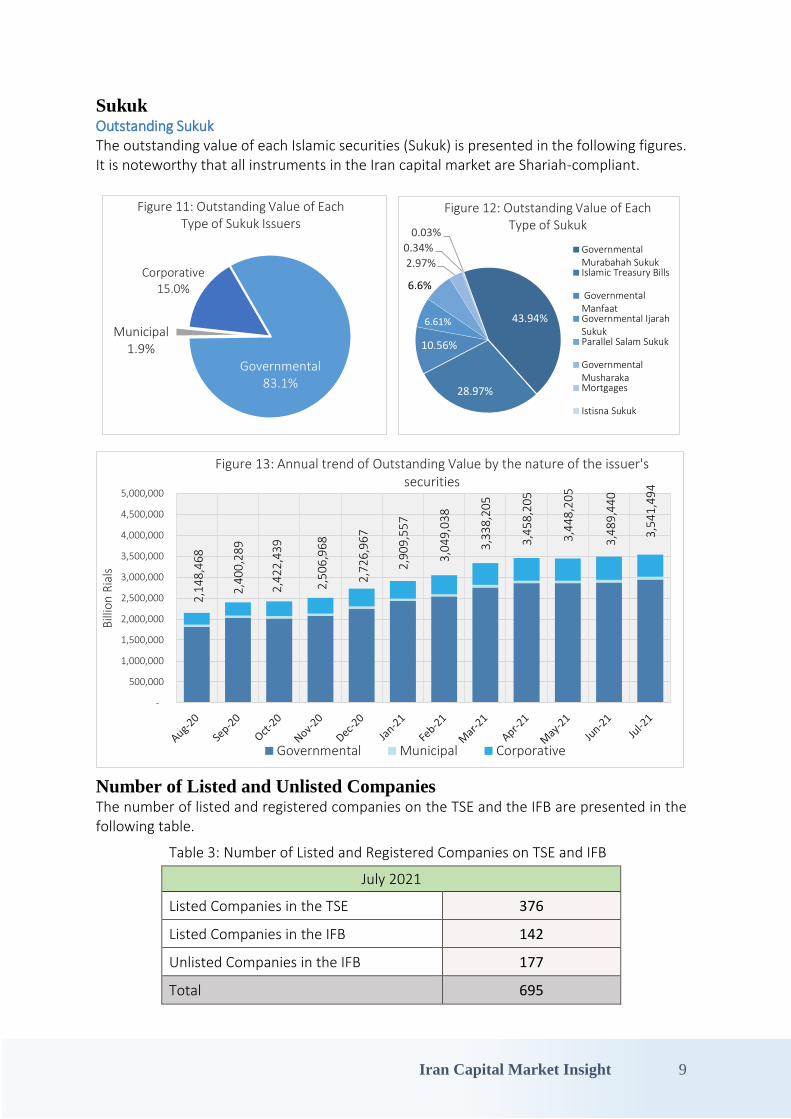
Sukuk Outstanding Sukuk The outstanding value of each Islamic securities (Sukuk) is presented in the following figures. It is noteworthy that all instruments in the Iran capital market are Shariah-compliant.
Number of Listed and Unlisted Companies The number of listed and registered companies on the TSE and the IFB are presented in the following table.
Table 3: Number of Listed and Registered Companies on TSE and IFB
July 2021
376 Listed Companies in the TSE
142 Listed Companies in the IFB
177 Unlisted Companies in the IFB
695 Total
Governmental83.1%
Municipal1.9%
Corporative15.0%
Figure 11: Outstanding Value of Each Type of Sukuk Issuers
43.94%
28.97%
10.56%
6.61%
6.6%
2.97%
0.34%
0.03%
Figure 12: Outstanding Value of Each Type of Sukuk
GovernmentalMurabahah SukukIslamic Treasury Bills
GovernmentalManfaatGovernmental IjarahSukukParallel Salam Sukuk
GovernmentalMusharakaMortgages
Istisna Sukuk
2,1
48
,46
8
2,4
00
,28
9
2,4
22
,43
9
2,5
06
,96
8
2,7
26
,96
7
2,9
09
,55
7
3,0
49
,03
8
3,3
38
,20
5
3,4
58
,20
5
3,4
48
,20
5
3,4
89
,44
0
3,5
41
,49
4
-
500,000
1,000,000
1,500,000
2,000,000
2,500,000
3,000,000
3,500,000
4,000,000
4,500,000
5,000,000
Bill
ion
Ria
ls
Figure 13: Annual trend of Outstanding Value by the nature of the issuer's securities
Governmental Municipal Corporative

Iran Capital Market Insight 10
Initial Public Offerings The trend of the number of initial public offerings in the TSE and the IFB is presented in the
following figure.
The detail of IPOs in the TSE and the IFB is shown in the following table.
Table 4: detail of IPOs
Offering Date
Percent of
Supply (%)
Trade-Value
(Billion Rials)
No.Shares (Milion)
Ticker Company
Name Industry Exchange
2021/07/17 17% ̴ 3,800 1,005 SPID Sepid
Makian Co.
Agriculture and Related Services
TSE - Listed
2021/06/23 50% ̴ 5,463 200 LPCZ Latif Paper Paper and
Paper Products IFB -
Listed
2021/06/30 5% ̴ 2,567 3,000 NITP Negin
Iranian Tr. Hotels &
Restaurants IFB -
Unlisted
4
1 1 10
3
1
4
1
1
2
1 12
1
1
1
1
1
21
0
1
2
3
4
5
6
7
8
9
Figure 14: Annual trend of IPO on the TSE and the IFB
TSE IFB-Listed IFB-Unlisted

Iran Capital Market Insight 11
Unified Investment Services Window
The Minister of Finance and Economic Affairs together with the SEO Chairman
unveiled the “Unified Investment Services Window”.
The “Unified Investment Services Window” which is located in the new SEO premise,
has a mechanism consisting of a unit for providing physical services and its related
electronic system.
This Window provides services that requires interaction with other organizations such
as the Real Estate Registration Organization of Iran (RERO), Iranian National Tax
Administration (INTA), Official Gazette and post office.
Currently, this Window provides and support services include establishing a company,
capital increase, confirmation of the professional qualifications of managers, changing
the information of companies, matters related to the minutes of the board of directors
and corporate general assemblies.
Meet Iran’s Market with FEAS
The Iranian Capital Market event is taking place on July 15th, at 14:30 Tehran time.
The representatives of Tehran Stock Exchange, Iran Farabourse and Central Securities
Depository of Iran will introduce the Iranian Capital Market, present the information
about the country and about how to invest in this promising market.
The presentations will be followed by Q&A Session.
You are invited to register and participate in the event (Click Here).
SEO to Hold the 13th Virtual International Forum on Islamic Capital Market in
October 2021
The Securities and Exchange Organization of Iran (SEO) is to hold the 13th Virtual
International Forum on Islamic Capital Market in October 17-18, 2021.
The SEO has organized this event for 12 years in a row, while has welcomed by a
number of high-caliber internationally well-known speakers, lecturers and
participants. Given the outbreak of Corona virus and for the safety measures of all
respected participants, the SEO has decided to hold this Forum online for the second
successive year.
The theme of this Forum is “Global All-pervasiveness of Islamic Finance in Crisis”.
The main topics of this ICM are:

Iran Capital Market Insight 12
• Islamic Capital Market and Sukuk Industry Roles in Macro
Financial Environment,
• Artificial Intelligence and Machine Learning in the Context of
Islamic Finance,
• Islamic Alternative Investments: Passive Investing, PE Funds,
VCs, etc.,
• Fintech and Islamic Capital Markets: Experiences, Innovations and
Challenges,
• Start-Ups and SMEs Financing in the Context of Islamic Finance
to remove Inflammation caused by COVID-19,
• Socially Responsible Investment during COVID-19 Crisis, and
• Crypto Assets in the Context of Islamic Capital Market: Practical
and Regulatory Issues (Crypto ETFs, Platforms, ICOs, Tokenization
and Related Issues).
The SEO is ready to welcome speakers / lecturers. The interested speakers / lecturers
may send their topic of presentation, which should be relevant to the theme, and the
topics.
Once confirmed by the “ICM Scientific Committee”, the speakers / lecturers may send
their PPT no later than September 17, 2021.
For more details, you may directly contact the SEO at: [email protected].

Iran Capital Market Insight 13
At the end of July 2021, the market capitalization reached 67,947,207 billion IR, which represents 9.5% increase compare with the previous month .
The TSE's total return index (TEDPIX) at the end of one-month trading session in July 2021 increased by 12.2% and touched 1,311,306, while the IFB's total return index (IFX) reached 19,049, which demonstrates a 9.99% increase.
The total trading value of four exchanges (TSE, IFB, IME, and IRENEX) amounted to 3,984,403 Billion IRR in July 2021, which shows 37.78% increase comparing to the last month.