Embed Size (px)
Citation preview
8/10/2019 Jun 14 Shophouses
http://slidepdf.com/reader/full/jun-14-shophouses 1/7
SHOPHOUSESINGAPORE’S ARCHITECTURAL GEM
JUN 2014 / ISSUE 14
SQUARE FOOT RESEARCH PTE. LTD.
Phone: +65 6223 2163
Website: www.squarefoot.com.sg
Shophouses are now more costly to own than ever due to its ever rising capital values. On average,
the median price of shophouses has risen by nearby 20% annually over the last 10 years and now
stands at a historical high of $4,111 psf.
8/10/2019 Jun 14 Shophouses
http://slidepdf.com/reader/full/jun-14-shophouses 2/7
SHOPHOUSES I N G A P O R E ’ S A R C H I T E C T U R A L G E M
JUNE 2014 – SHOPHOUSE Page 2
Median Price
Once a humble compound,
shophouses are now a much
sought-after investment,
judging from the trend in
recent years.
Shophouses have also become
more costly to purchase than
ever. Median transaction price
soared to $4,111 psf in 1Q14,an increase of 24.2% y-o-y and
is now at its highest ever in
history. In absolute price, the
median transaction price is
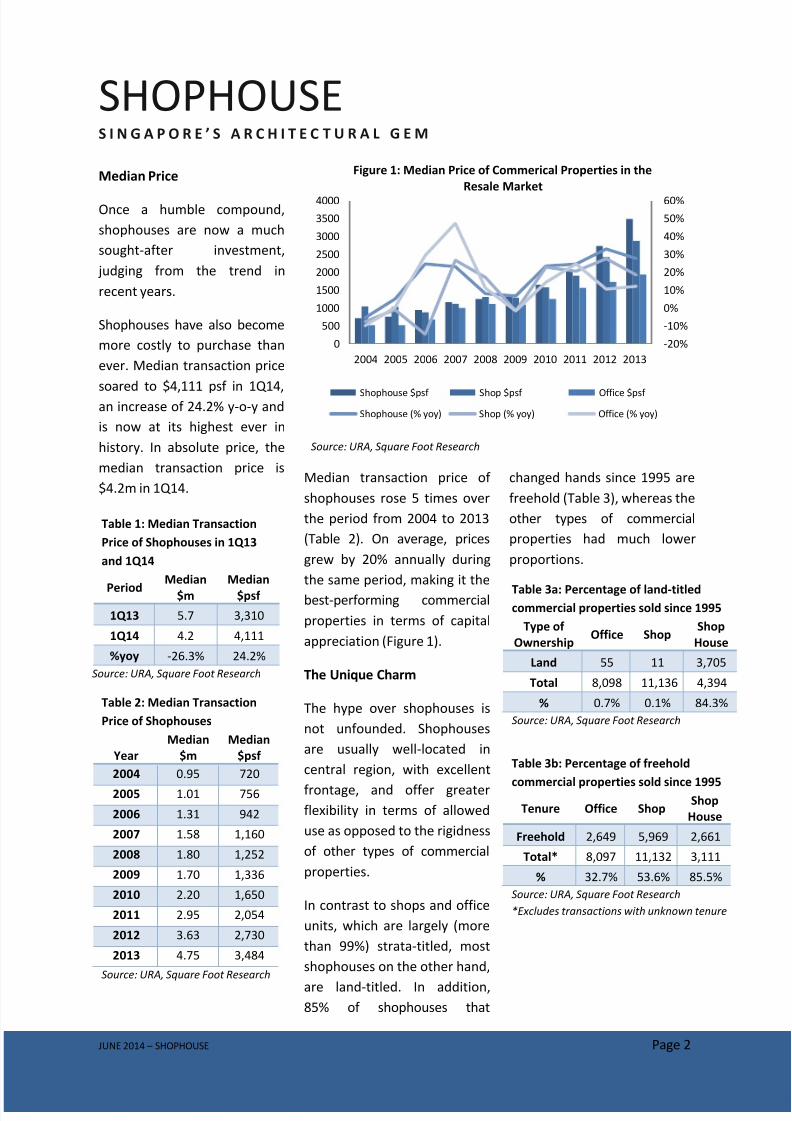
$4.2m in 1Q14.Median transaction price of
shophouses rose 5 times over
the period from 2004 to 2013
(Table 2). On average, prices
grew by 20% annually during
the same period, making it the
best-performing commercial
properties in terms of capital
appreciation (Figure 1).
The Unique Charm
The hype over shophouses is
not unfounded. Shophouses
are usually well-located in
central region, with excellent
frontage, and offer greater
flexibility in terms of allowed
use as opposed to the rigidness
of other types of commercial
properties.
In contrast to shops and office
units, which are largely (more
than 99%) strata-titled, most
shophouses on the other hand,
are land-titled. In addition,
85% of shophouses that
changed hands since 1995 are
freehold (Table 3), whereas the
other types of commercial
properties had much lower
proportions.
Table 2: Median Transaction
Price of Shophouses
Year
Median
$m
Median
$psf
2004 0.95 720
2005 1.01 756
2006 1.31 942
2007 1.58 1,160
2008 1.80 1,252
2009 1.70 1,336
2010 2.20 1,650
2011 2.95 2,054
2012 3.63 2,730
2013 4.75 3,484
Source: URA, Square Foot Research
Table 3a: Percentage of land-titledcommercial properties sold since 1995
Type of
OwnershipOffice Shop
Shop
House
Land 55 11 3,705
Total 8,098 11,136 4,394
% 0.7% 0.1% 84.3%
Source: URA, Square Foot Research
Table 3b: Percentage of freehold
commercial properties sold since 1995
Tenure Office ShopShop
House
Freehold 2,649 5,969 2,661
Total* 8,097 11,132 3,111
% 32.7% 53.6% 85.5%
Source: URA, Square Foot Research
*Excludes transactions with unknown tenure
-20%
-10%
0%
10%
20%
30%
40%
50%
60%
0
500
1000
1500
2000
2500
3000
3500
4000
2004 2005 2006 2007 2008 2009 2010 2011 2012 2013
Figure 1: Median Price of Commerical Properties in the
Resale Market
Shophouse $psf Shop $psf Office $psf
Shophouse (% yoy) Shop (% yoy) Office (% yoy)
Source: URA, Square Foot Research
Table 1: Median Transaction
Price of Shophouses in 1Q13
and 1Q14
Period
Median
$m
Median
$psf
1Q13 5.7 3,310
1Q14 4.2 4,111
%yoy -26.3% 24.2%
Source: URA, Square Foot Research
8/10/2019 Jun 14 Shophouses
http://slidepdf.com/reader/full/jun-14-shophouses 3/7
SHOPHOUSES I N G A P O R E ’ S A R C H I T E C T U R A L G E M
JUNE 2014 – SHOPHOUSE Page 3
Shophouses hold great intrinsic
value serving as anembodiment of Singapore’s
historical and cultural heritage,
forming the main bulk of
Singapore’s gazetted
conservation buildings, and are
sought after for their scarcity
and dearth in supply.
In view of the Land Acquisition
Act where the government hasthe right to acquire land
compulsorily for public
development projects such as
in the case of constructing new
MRT lines, shophouses located
in conservation areas may
have the added advantage of
being protected from such
redevelopments.
Sales
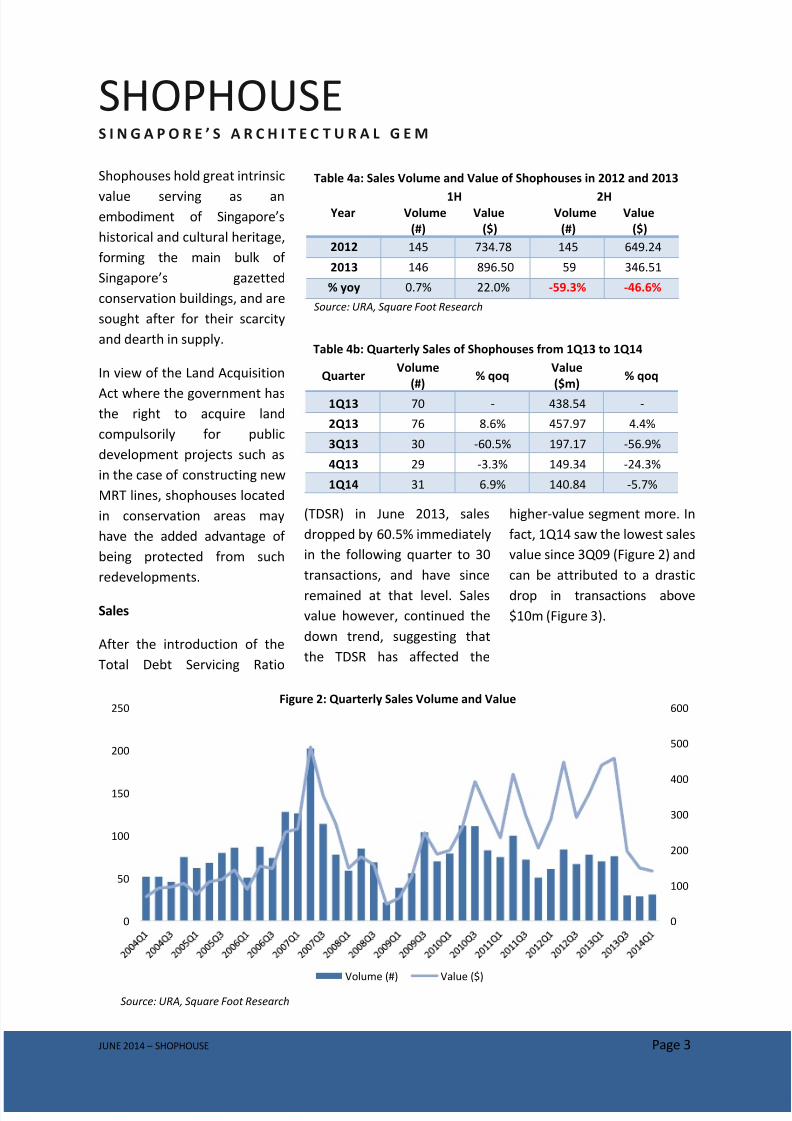
After the introduction of the
Total Debt Servicing Ratio
(TDSR) in June 2013, sales
dropped by 60.5% immediately
in the following quarter to 30
transactions, and have since
remained at that level. Sales
value however, continued the
down trend, suggesting that
the TDSR has affected the
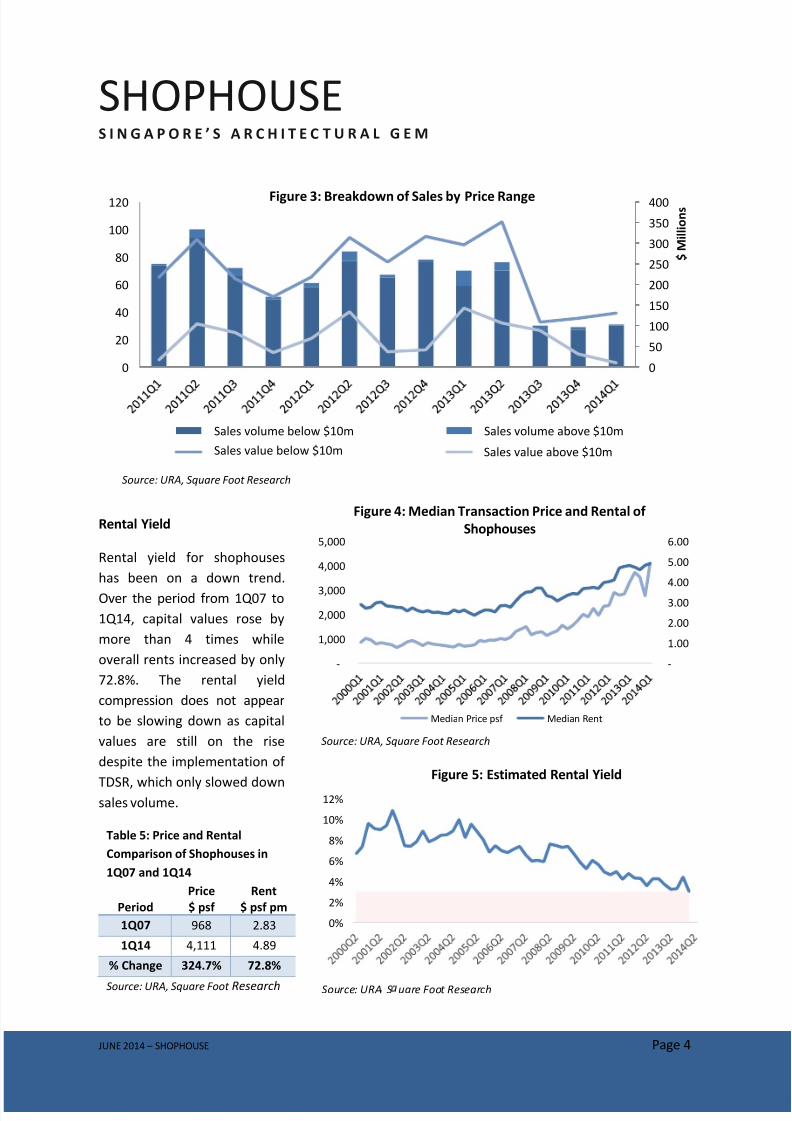
higher-value segment more. In
fact, 1Q14 saw the lowest sales
value since 3Q09 (Figure 2) and
can be attributed to a drastic
drop in transactions above
$10m (Figure 3).
Table 4a: Sales Volume and Value of Shophouses in 2012 and 2013
Year1H
Volume Value
(#) ($)
2HVolume Value
(#) ($)
2012 145 734.78 145 649.24
2013 146 896.50 59 346.51
% yoy 0.7% 22.0% -59.3% -46.6%
Source: URA, Square Foot Research
Table 4b: Quarterly Sales of Shophouses from 1Q13 to 1Q14
Quarter
Volume
(#)% qoq
Value
($m)% qoq
1Q13 70 - 438.54 -
2Q13 76 8.6% 457.97 4.4%
3Q13 30 -60.5% 197.17 -56.9%
4Q13 29 -3.3% 149.34 -24.3%
1Q14 31 6.9% 140.84 -5.7%
0
100
200
300
400
500
600
0
50
100
150
200
250
Figure 2: Quarterly Sales Volume and Value
Volume (#) Value ($)
Source: URA, Square Foot Research
8/10/2019 Jun 14 Shophouses
http://slidepdf.com/reader/full/jun-14-shophouses 4/7
SHOPHOUSES I N G A P O R E ’ S A R C H I T E C T U R A L G E M
JUNE 2014 – SHOPHOUSE Page 4
Rental Yield
Rental yield for shophouses
has been on a down trend.
Over the period from 1Q07 to
1Q14, capital values rose by
more than 4 times while
overall rents increased by only
72.8%. The rental yield
compression does not appear
to be slowing down as capital
values are still on the rise
despite the implementation of
TDSR, which only slowed downsales volume.
-
1.00
2.00
3.00
4.00
5.00
6.00
-
1,000
2,000
3,000
4,000
5,000
Figure 4: Median Transaction Price and Rental of
Shophouses
Median Price psf Median Rent
Source: URA, Square Foot Research
0%
2%
4%
6%
8%
10%
12%
Figure 5: Estimated Rental Yield
Source: URA S uare Foot Research
Table 5: Price and Rental
Comparison of Shophouses in
1Q07 and 1Q14
Period
Price
$ psf
Rent
$ psf pm
1Q07 968 2.83
1Q14 4,111 4.89
% Change 324.7% 72.8%
Source: URA, Square Foot Research
0
50
100
150
200
250
300
350
400
0
20
40
60
80
100
120
$ M i l l i o n sFigure 3: Breakdown of Sales by Price Range
# txn ≤$10m # txn >$10m
Total Amt from txn ≤$10m ($) Total Amt from >$10m ($)
Source: URA, Square Foot Research
Sales volume below $10m Sales volume above $10m
Sales value above $10mSales value below $10m
8/10/2019 Jun 14 Shophouses
http://slidepdf.com/reader/full/jun-14-shophouses 5/7
SHOPHOUSES I N G A P O R E ’ S A R C H I T E C T U R A L G E M
JUNE 2014 – SHOPHOUSE Page 5
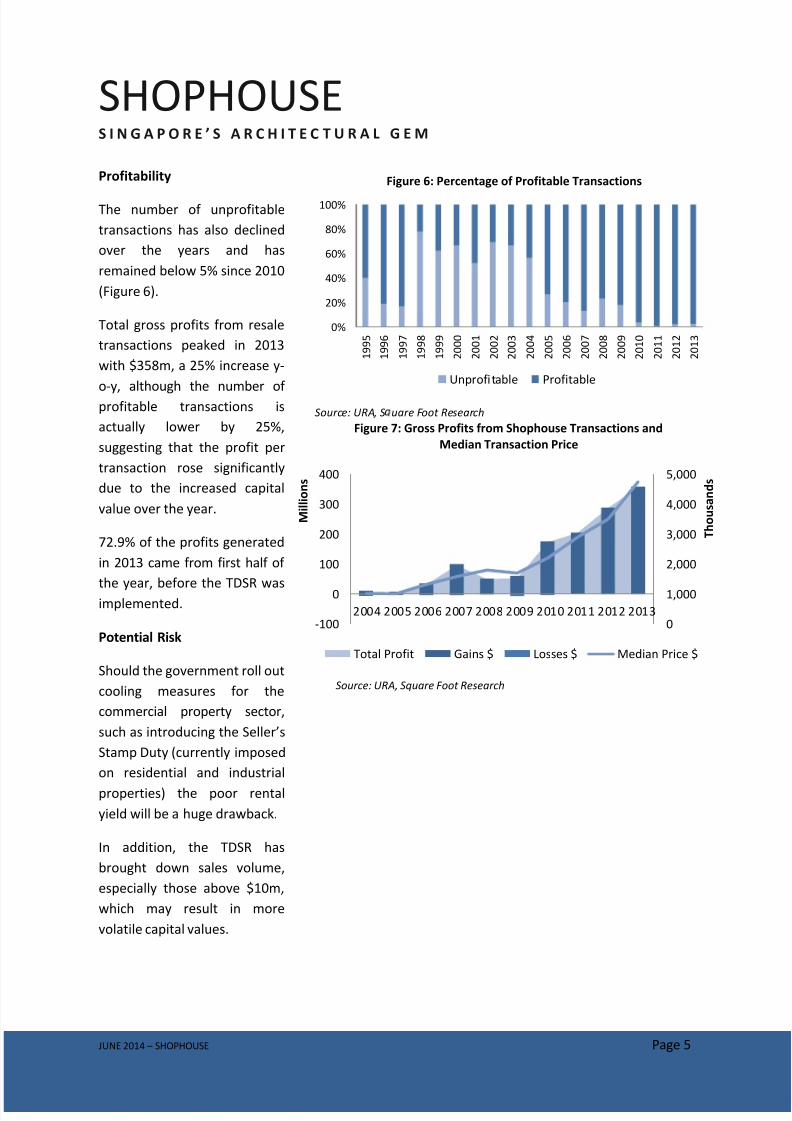
Profitability
The number of unprofitable
transactions has also declined
over the years and has
remained below 5% since 2010
(Figure 6).
Total gross profits from resale
transactions peaked in 2013
with $358m, a 25% increase y-
o-y, although the number ofprofitable transactions is
actually lower by 25%,
suggesting that the profit per
transaction rose significantly
due to the increased capital
value over the year.
72.9% of the profits generated
in 2013 came from first half of
the year, before the TDSR wasimplemented.
Potential Risk
Should the government roll out
cooling measures for the
commercial property sector,
such as introducing the Seller’s
Stamp Duty (currently imposed
on residential and industrial
properties) the poor rental
yield will be a huge drawback.
In addition, the TDSR has
brought down sales volume,
especially those above $10m,
which may result in more
volatile capital values.
0
1,000
2,000
3,000
4,000
5,000
-100
0
100
200
300
400
2004 2005 2006 2007 2008 2009 2010 2011 2012 2013
T h o u s a n d s
M i l l i o n s
Figure 7: Gross Profits from Shophouse Transactions and
Median Transaction Price
Total Profit Gains $ Losses $ Median Price $
Source: URA, Square Foot Research
0%
20%
40%
60%
80%
100%
1 9 9 5
1 9 9 6
1 9 9 7
1 9 9 8
1 9 9 9
2 0 0 0
2 0 0 1
2 0 0 2
2 0 0 3
2 0 0 4
2 0 0 5
2 0 0 6
2 0 0 7
2 0 0 8
2 0 0 9
2 0 1 0
2 0 1 1
2 0 1 2
2 0 1 3
Figure 6: Percentage of Profitable Transactions
Unprofitable Profitable
Source: URA, S uare Foot Research
8/10/2019 Jun 14 Shophouses
http://slidepdf.com/reader/full/jun-14-shophouses 6/7
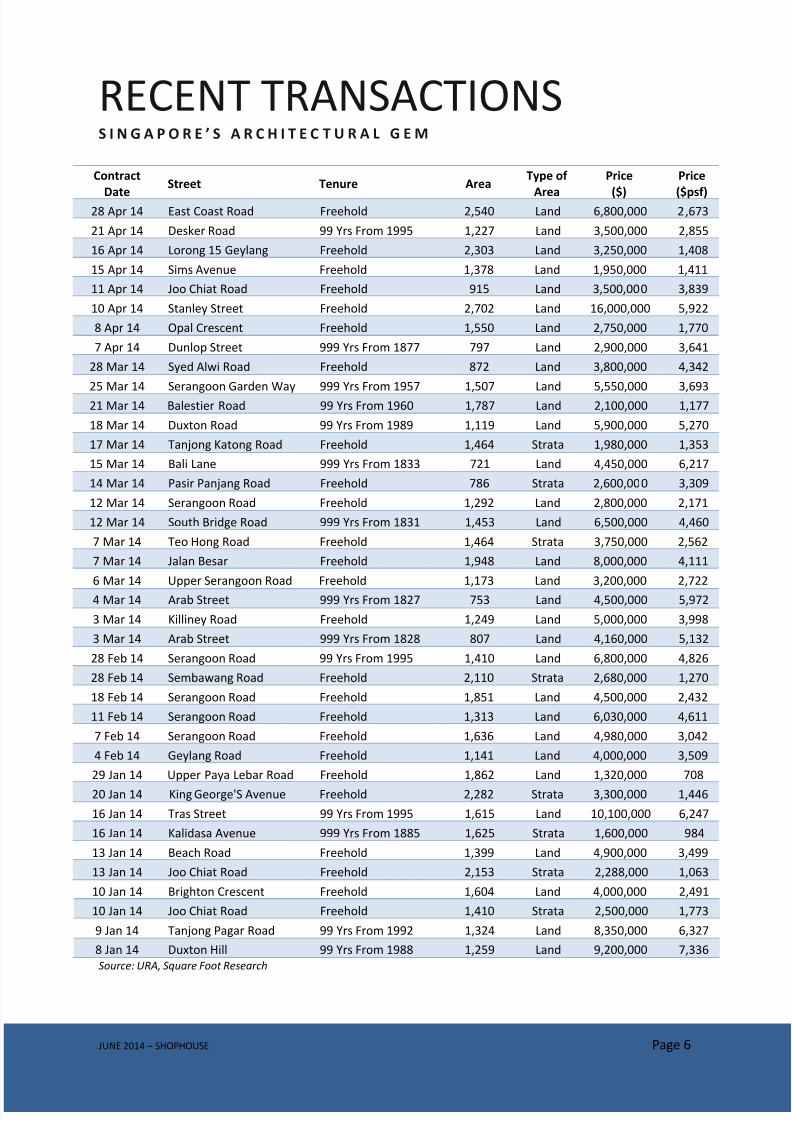
RECENT TRANSACTIONSS I N G A P O R E ’ S A R C H I T E C T U R A L G E M
JUNE 2014 – SHOPHOUSE Page 6
Contract
Date
Street Tenure AreaType of
Area
Price
($)
Price
($psf)28 Apr 14 East Coast Road Freehold 2,540 Land 6,800,000 2,673
21 Apr 14 Desker Road 99 Yrs From 1995 1,227 Land 3,500,000 2,855
16 Apr 14 Lorong 15 Geylang Freehold 2,303 Land 3,250,000 1,408
15 Apr 14 Sims Avenue Freehold 1,378 Land 1,950,000 1,411
11 Apr 14 Joo Chiat Road Freehold 915 Land 3,500,000 3,839
10 Apr 14 Stanley Street Freehold 2,702 Land 16,000,000 5,922
8 Apr 14 Opal Crescent Freehold 1,550 Land 2,750,000 1,770
7 Apr 14 Dunlop Street 999 Yrs From 1877 797 Land 2,900,000 3,641
28 Mar 14 Syed Alwi Road Freehold 872 Land 3,800,000 4,342
25 Mar 14 Serangoon Garden Way 999 Yrs From 1957 1,507 Land 5,550,000 3,693
21 Mar 14 Balestier Road 99 Yrs From 1960 1,787 Land 2,100,000 1,177
18 Mar 14 Duxton Road 99 Yrs From 1989 1,119 Land 5,900,000 5,270
17 Mar 14 Tanjong Katong Road Freehold 1,464 Strata 1,980,000 1,353
15 Mar 14 Bali Lane 999 Yrs From 1833 721 Land 4,450,000 6,217
14 Mar 14 Pasir Panjang Road Freehold 786 Strata 2,600,000 3,309
12 Mar 14 Serangoon Road Freehold 1,292 Land 2,800,000 2,171
12 Mar 14 South Bridge Road 999 Yrs From 1831 1,453 Land 6,500,000 4,460
7 Mar 14 Teo Hong Road Freehold 1,464 Strata 3,750,000 2,562
7 Mar 14 Jalan Besar Freehold 1,948 Land 8,000,000 4,111
6 Mar 14 Upper Serangoon Road Freehold 1,173 Land 3,200,000 2,722
4 Mar 14 Arab Street 999 Yrs From 1827 753 Land 4,500,000 5,972
3 Mar 14 Killiney Road Freehold 1,249 Land 5,000,000 3,998
3 Mar 14 Arab Street 999 Yrs From 1828 807 Land 4,160,000 5,132
28 Feb 14 Serangoon Road 99 Yrs From 1995 1,410 Land 6,800,000 4,826
28 Feb 14 Sembawang Road Freehold 2,110 Strata 2,680,000 1,270
18 Feb 14 Serangoon Road Freehold 1,851 Land 4,500,000 2,432
11 Feb 14 Serangoon Road Freehold 1,313 Land 6,030,000 4,611
7 Feb 14 Serangoon Road Freehold 1,636 Land 4,980,000 3,042
4 Feb 14 Geylang Road Freehold 1,141 Land 4,000,000 3,509
29 Jan 14 Upper Paya Lebar Road Freehold 1,862 Land 1,320,000 708
20 Jan 14 King George'S Avenue Freehold 2,282 Strata 3,300,000 1,446
16 Jan 14 Tras Street 99 Yrs From 1995 1,615 Land 10,100,000 6,247
16 Jan 14 Kalidasa Avenue 999 Yrs From 1885 1,625 Strata 1,600,000 984
13 Jan 14 Beach Road Freehold 1,399 Land 4,900,000 3,499
13 Jan 14 Joo Chiat Road Freehold 2,153 Strata 2,288,000 1,063
10 Jan 14 Brighton Crescent Freehold 1,604 Land 4,000,000 2,491
10 Jan 14 Joo Chiat Road Freehold 1,410 Strata 2,500,000 1,773
9 Jan 14 Tanjong Pagar Road 99 Yrs From 1992 1,324 Land 8,350,000 6,327
8 Jan 14 Duxton Hill 99 Yrs From 1988 1,259 Land 9,200,000 7,336
Source: URA, Square Foot Research
8/10/2019 Jun 14 Shophouses
http://slidepdf.com/reader/full/jun-14-shophouses 7/7
APPENDIX
D I S C L A I M E R
JUNE 2014 – SHOPHOUSE Page 7
This report provides information and opinions as reference resource only. This report is not intended to be and does not
constitute financial advice, investment advice or any other advice. The report has been prepared without regard to the
individual financial circumstances, needs or objectives of persons who receive it. Readers should not rely on any of the
information herein as authoritative or substitute for the exercise of their own skill and judgment in making any investment
or other decision. You agree that any and all use of this report which you make, is solely at your own risk and without any
recourse whatsoever to Square Foot Research Pte. Ltd., its related and affiliate companies and/or their employees. You
understand that you are using this report at your own risk. Square Foot Research Pte. Ltd. makes reasonable effort to use
reliable, comprehensive information, but we make no representation that it is accurate or complete.
© 2014 Square Foot Research Pte. Ltd.. All rights reserved. Except as specifically permitted, no part of this report may be
reproduced or distributed in any manner without the prior written permission of Square Foot Research Pte. Ltd.. Square
Foot Research Pte. Ltd. accepts no liability whatsoever for the actions of third parties in this respect.