Embed Size (px)
Citation preview

Also in this issue: • Hydrogen-PoweredCarBreaksRecord
• SimulatingtheSeismicResponseofDams
• ProstheticDeviceHelpsRestoreSight
• Teller’sLegacyinEducation
National Nuclear Security Administration’sLawrence Livermore National Laboratory
June 2007
dana jacobs
AbouttheCover
AbouttheReview
© 2007. The Regents of the University of California. All rights reserved. This document has been authored by the Regents of the University of California under Contract No. W-7405-Eng-48 with the U.S. Government. To request permission to use any material contained in this document, please submit your request in writing to Library Report Orders, Lawrence Livermore National Laboratory, Mail Stop L-610, P.O. Box 808, Livermore, California 94551, or to our e-mail address [email protected].
This document was prepared as an account of work sponsored by an agency of the United States Government. Neither the United States Government nor the University of California nor any of their employees makes any warranty, expressed or implied, or assumes any legal liability or responsibility for the accuracy, completeness, or usefulness of any information, apparatus, product, or process disclosed, or represents that its use would not infringe privately owned rights. Reference herein to any specific commercial product, process, or service by trade name, trademark, manufacturer, or otherwise, does not necessarily constitute or imply its endorsement, recommendation, or favoring by the United States Government or the University of California. The views and opinions of authors expressed herein do not necessarily state or reflect those of the United States Government or the University of California and shall not be used for advertising or product endorsement purposes.
Prepared by LLNL under ContractNo. W-7405-Eng-48
Experiments being planned for the National Ignition Facility—the world’s largest laser—will require instrumentation that can capture ultrafast signal details in the realm of a single picosecond (a trillionth of a second). In a technical leap that combines old and new technologies, engineer Corey V. Bennett of Livermore’s Engineering Directorate has designed a fiber-optic-based “time microscope” that can be attached to the front end of an oscilloscope or streak camera, increasing the time resolution and dynamic range of these instruments by two orders of magnitude—from tens of picoseconds to hundreds of femtoseconds. On the cover, engineering associate Bryan Moran (left) and Bennett work on the time microscope system in their laboratory. An oscilloscope displays a signal (right).
Lawrence Livermore National Laboratory is operated by the University of California for the Department of Energy’s National Nuclear Security Administration. At Livermore, we focus science and technology on ensuring our nation’s security. We also apply that expertise to solve other important national problems in energy, bioscience, and the environment. Science & Technology Review is published 10 times a year to communicate, to a broad audience, the Laboratory’s scientific and technological accomplishments in fulfilling its primary missions. The publication’s goal is to help readers understand these accomplishments and appreciate their value to the individual citizen, the nation, and the world. Please address any correspondence (including name and address changes) to S&TR, Mail Stop L-664, Lawrence Livermore National Laboratory, P.O. Box 808, Livermore, California 94551, or telephone (925) 423-3432. Our e-mail address is [email protected]. S&TR is available on the World Wide Web at www.llnl.gov/str.
Cov
er d
esig
n: D
anie
l Moo
re. P
hoto
grap
her:
Nan
cy R
utte
r.

Scientific editor
Harry B. Radousky
Managing editor
Ray Marazzi
Publication editor
Carolin Middleton
WriterS
Arnie Heller, Ann Parker, Gabriele Rennie, Maurina S. Sherman, and Katie Walter
art director
Daniel Moore
Proofreader
Pam MacGregor
S&TR, a Director’s Office publication, is produced by the Technical Information Department under the direction of the Office of Policy, Planning, and Special Studies.
S&TR is available on the Web at www.llnl.gov/str.
Printed in the United States of America
Available fromNational Technical Information ServiceU.S. Department of Commerce5285 Port Royal RoadSpringfield, Virginia 22161
UCRL-52000-06-12Distribution Category UC-99December 2006
June 2007
Lawrence Livermore National Laboratory
Scientific editor
Diane J. Chinn
Managing editor
Ray Marazzi
Publication editor
Pam MacGregor
WriterS
Alane L. Alchorn, Arnie Heller, Ann Parker, and Katie Walter
art director and deSigner
Daniel Moore
cover PhotograPher
Nancy Rutter
Proofreader
Carolin Middleton
Print Production
Charlie M. Arteago, Jr., and Cenveo GAC Indianapolis
S&TR, a Director’s Office publication, is produced by the Technical Information Department under the direction of the Office of Policy, Planning, and Special Studies.
S&TR is available on the Web at www.llnl.gov/str.
Printed in the United States of America
Available fromNational Technical Information ServiceU.S. Department of Commerce5285 Port Royal RoadSpringfield, Virginia 22161
UCRL-TR-52000-07-6Distribution Category UC-99June 2007
3 UltrafastDiagnosticsSatisfytheNeedforSpeed Commentary by Steven R. Patterson
4 DoingaStretchofTimeA Livermore-developed time microscope stretches out very fast signals over time to reveal details previously undetectable.
11 SettingaWorldDrivingRecordwithHydrogenLivermore researchers demonstrate just how far a hybrid car can travel on one tank of liquid hydrogen.
17 VirtualDamsSubjectedtoStrongEarthquakesLaboratory expertise is helping the U.S. Bureau of Reclamation determine the seismic safety of their dams.
20 ASecondChanceatSightAn implanted prosthesis restores partial sight to those blinded by retinal diseases.
22 AGiftedTeacherofAppliedand FundamentalPhysics
Edward Teller shared his passion for physics with three generations of students.
2 The Laboratory in the News
24 Patents and Awards
25 Abstracts
S&TR Staff
ResearchHighlights
TellerCentennialHighlight
Departments
ContentsFeatures
TheLaboratoryintheNews S&TR June 20072
Lawrence Livermore National Laboratory
Machinedetectsexplosives,chemicals,andbioagentsNew research by a team of Livermore scientists has expanded
the capability of the Single-Particle Aerosol Mass Spectrometry (SPAMS) system to detect explosives as well as chemical and biological agents. The three-in-one machine has been conceptually proven to detect minuscule particles of explosives, weighing one trillionth of a gram, on clothing or baggage. This latest advance is described in the March 1, 2007, edition of Analytical Chemistry.
The research expands the capabilities of SPAMS to include several types of explosives that have been used worldwide in improvised explosive devices and other terrorist attacks. “SPAMS is a potential option for airport and baggage screening,” says George Farquar, a postdoctoral fellow and physical chemist at the Glenn T. Seaborg Institute in the Chemistry, Materials, and Life Sciences Directorate. “The ability of the SPAMS technology to determine the identity of a single particle could be a valuable asset when the substance is dangerous in small quantities or has no legal reason for being present in an environment.”
Future plans for SPAMS include field testing at a large public facility in the U.S. later this year, upgrading the technology for removing particles from luggage and clothing, and adding the capability to detect narcotics. Research funds have been provided by the Defense Advanced Research Projects Agency, the U.S. Department of Homeland Security, and the Glenn T. Seaborg Institute.Contact: George Farquar (925) 424-4275 ([email protected]).
TocatchanexplodingdwarfstarA University of Chicago team’s groundbreaking simulation
of a white dwarf star exploding—the first complete three-dimensional (3D) simulation of a type 1a supernova—was made possible with computing support from Livermore’s Advanced Simulation and Computing (ASC) Program. The success of the simulation has broad implications for the role of type 1a supernovae as distance markers for cosmology, according to Stephen Libby, a Livermore physicist who has served as a liaison with the Chicago team. Libby says, “Simulating a full 3D detonation is a remarkable achievement.”
By better understanding how a type 1a supernova explodes, astrophysicists hope to gain insight into the mystery of dark energy, an unknown force pushing apart the cosmos that accounts for two-thirds of the aggregate energy in the universe. Scientists use Type 1a supernovae as “standardized candles” to determine the distance and acceleration of distant galaxies and thus want to
measure their output accurately. In addition, understanding the physics of thermonuclear burn, such as that in supernovae, is of great interest to the National Nuclear Security Administration (NNSA), which is responsible for ensuring the safety, security, and reliability of the nation’s nuclear stockpile in the absence of underground nuclear testing.
The 3D simulation was conducted by a team at the University of Chicago’s Center for Astrophysical Thermonuclear Flashes with the assistance of Laboratory computer scientists from NNSA’s ASC Program. Dona Crawford, associate director for Livermore’s Computation Directorate, says, “Laboratory computer scientists worked assiduously behind the scenes to ensure that the code ran smoothly over the long hours required for this complex simulation.” University of Chicago scientists discussed the breakthrough simulation at the Paths to Exploding Stars Conference in Santa Barbara, California, March 22, 2007.Contact: Dona Crawford (925) 422-1985 ([email protected]) or
Stephen B. Libby (925) 422-9785 ([email protected]).
AstepclosertoimagingbiologicalmoleculesLivermore researchers have confirmed a key factor in imaging
biological molecules at atomic resolution. Using ultrashort photon pulses from an x-ray free-electron laser, the researchers probed new regimes of laser–solid interactions. They found that there are no induced structural changes to irradiated samples at a nearly atomic scale (0.3 nanometer) over the time of the laser pulse. A nanometer is 100,000 times smaller than a human hair. The Livermore team, led by Stefan Hau-Riege of the Physics and Advanced Technologies Directorate, found that the structural change of materials is limited by the inertia of the atoms.
The experiment demonstrated that with intense ultrafast pulses, structural damage does not occur during the pulse, giving credence to the concept of diffraction imaging of single macromolecules. These new results are a prerequisite for imaging biological molecules at atomic resolution. The Livermore team identified the limits for imaging biological materials at the Department of Energy’s Linac Coherent Light Source, which is scheduled to begin operation in 2009.
The work was performed on the x-ray free-electron laser FLASH at Deutsches Elektronen-Synchrotron in Hamburg, Germany. Other Livermore researchers include Henry Chapman, Saša Bajt, Richard London, Eberhard Spiller, Sherry Baker, and Richard Bionta. The research appeared in the April 4, 2007, issue of Physical Review Letters.Contact: Stefan Hau-Riege (925) 422-5892 ([email protected]).

CommentarybyStevenR.Patterson 3
Lawrence Livermore National Laboratory
Ultrafast Diagnostics Satisfy the Need for Speed
with the absence of the underground test itself, they could not use the same overall energy. The only way the necessary experiments could be executed was to make the size of the experimental assembly smaller in proportion to the reduced total energy available. But with similar physical processes occurring in smaller assemblies, the time scale of results shrunk along with the dimensional size, creating the need for even faster diagnostics.
This transition in high-energy-density science reaches its ultimate modern expression in experiments carried out with the National Ignition Facility laser. These experiments involve target assemblies of millimeter proportion and micrometer feature size. The resulting experiments excite processes with event times of 1 to 10 picoseconds and significant temporal structures of fractions of a picosecond. As described in the article beginning on p. 4, this advancement has required a revolutionary new look at techniques for recording these ultrashort, nonrepeating events. Engineer Corey V. Bennett’s “time lens” solution uses nonlinear crystal waveguides and a chirped fiber Bragg grating to artificially expand the time scale of the signal so its wave shape can be captured on current oscilloscopes and streak cameras, extending their capabilities by orders of magnitude.
The development of the time lens is not only a striking advance in instrumentation but also a powerful illustration of our collaborative approach to engineering research and development. Bennett’s pioneering work builds on commercial equipment and techniques developed for the telecommunications industry. In addition to the interaction with industrial partners, the project has benefited from collaboration with academic partners and close involvement with agencies having similar technical interests, such as the Department of Defense. These collaborations are two-way exchanges essential to a thriving technical community. We both contribute and benefit by exchanging discoveries, supporting and stimulating academic inquiry, helping to meet diverse national security needs, and producing new technologies of potential commercial value.
It is in this collaborative fashion that we express both our passion for mission and responsible stewardship of the public trust.
EVERYTHING about modern life seems to be moving faster and faster as we progress toward the future. Even
our vocabulary of the last half-century reflects this trend with expressions such as fast food, minute rice, and instant messaging. The general acceleration of life is mirrored in the challenges of today’s science and engineering as demonstrated in the interest in instantaneous kinetics of chemical reactions, ever-faster electronic processing, and the steady increase of bandwidth for speedier communications.
When Karl Braun invented the cathode-ray tube in Germany a century ago, he created the basis for the modern oscilloscope, an instrument that has become the mainstay of experimentation for generations of scientists and engineers. As researchers have improved their understanding of physical phenomena, they have been driven to examine processes on shorter and shorter time scales, which poses an apparently insurmountable challenge to the venerable cathode-ray tube. Nowhere has this challenge been more apparent than in the study of high-energy-density science at the Laboratory.
Early underground tests of nuclear assemblies dealt with devices having features measuring 1 to 10 centimeters, resulting in transient event times of 100 picoseconds to 1 nanosecond. These very fast events provided a substantial challenge to the electronic instrumentation of the time, pushing the acceleration potential and faceplate sensitivities of cathode-ray tubes to their physical limits. Moreover, maintaining the temporal fidelity of signals in the transmission path between the experimental sensor and the recording device created demands beyond the limits of conventional electronic cabling. In the 1980s, Livermore scientists and engineers began introducing optical modulation and transmission of signals, capitalizing on the higher temporal resolution and lower dispersion that could be achieved with optical signals. However, the sensor itself and the recorder were still electronic devices, with their attendant limitations.
The cessation of underground testing in 1992 resulted in even more pressure to increase the speed of diagnostics. To scientifically support the nuclear weapons stockpile, scientists still needed to carry out measurements of energy densities similar to those achieved in the underground tests. However, n Steven R. Patterson is associate director for Engineering.

A new way of “stretching out” very fast signals in
time promises to reveal never-before-seen details
in experiments at the National Ignition Facility
and elsewhere.
4 S&TR June 2007
Lawrence Livermore National Laboratory
S&TR June 2007 Time Microscope 5
Lawrence Livermore National Laboratory
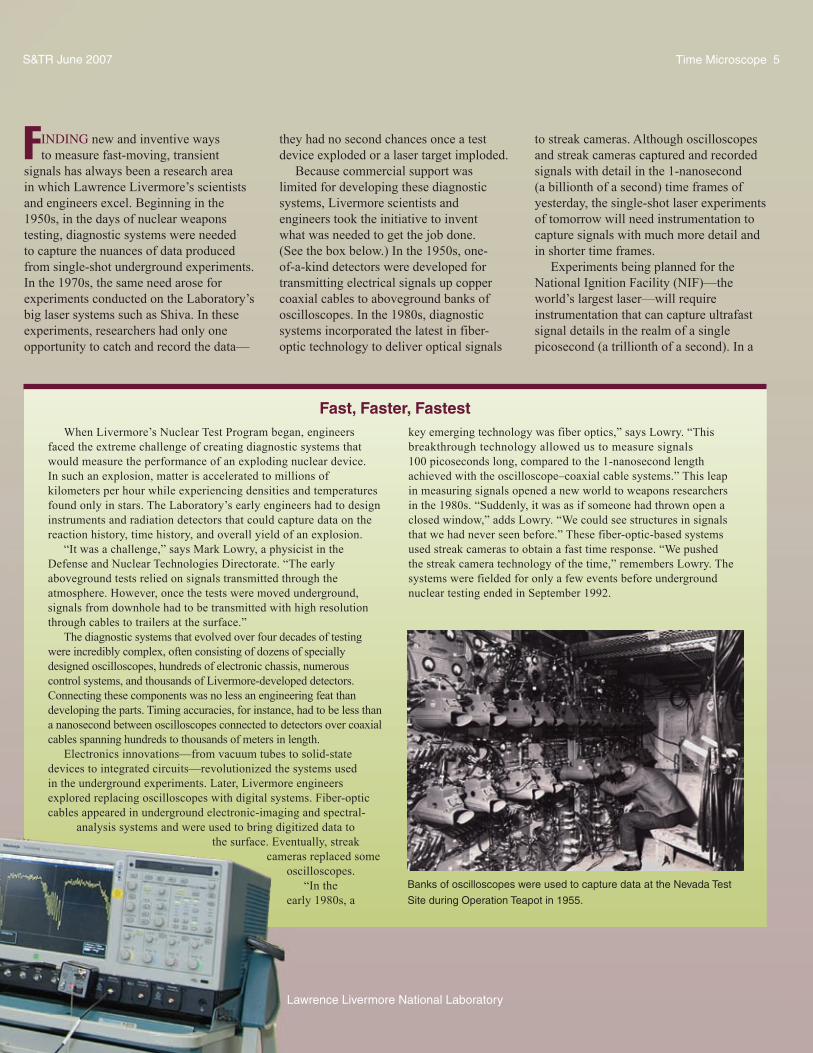
When Livermore’s Nuclear Test Program began, engineers faced the extreme challenge of creating diagnostic systems that would measure the performance of an exploding nuclear device. In such an explosion, matter is accelerated to millions of kilometers per hour while experiencing densities and temperatures found only in stars. The Laboratory’s early engineers had to design instruments and radiation detectors that could capture data on the reaction history, time history, and overall yield of an explosion.
“It was a challenge,” says Mark Lowry, a physicist in the Defense and Nuclear Technologies Directorate. “The early aboveground tests relied on signals transmitted through the atmosphere. However, once the tests were moved underground, signals from downhole had to be transmitted with high resolution through cables to trailers at the surface.”
The diagnostic systems that evolved over four decades of testing were incredibly complex, often consisting of dozens of specially designed oscilloscopes, hundreds of electronic chassis, numerous control systems, and thousands of Livermore-developed detectors. Connecting these components was no less an engineering feat than developing the parts. Timing accuracies, for instance, had to be less than a nanosecond between oscilloscopes connected to detectors over coaxial cables spanning hundreds to thousands of meters in length.
Electronics innovations—from vacuum tubes to solid-state devices to integrated circuits—revolutionized the systems used in the underground experiments. Later, Livermore engineers explored replacing oscilloscopes with digital systems. Fiber-optic cables appeared in underground electronic-imaging and spectral-
analysis systems and were used to bring digitized data to the surface. Eventually, streak
cameras replaced some oscilloscopes.
“In the early 1980s, a
Banks of oscilloscopes were used to capture data at the Nevada Test
Site during Operation Teapot in 1955.
key emerging technology was fiber optics,” says Lowry. “This breakthrough technology allowed us to measure signals 100 picoseconds long, compared to the 1-nanosecond length achieved with the oscilloscope–coaxial cable systems.” This leap in measuring signals opened a new world to weapons researchers in the 1980s. “Suddenly, it was as if someone had thrown open a closed window,” adds Lowry. “We could see structures in signals that we had never seen before.” These fiber-optic-based systems used streak cameras to obtain a fast time response. “We pushed the streak camera technology of the time,” remembers Lowry. The systems were fielded for only a few events before underground nuclear testing ended in September 1992.
Fast,Faster,Fastest
FINdING new and inventive ways to measure fast-moving, transient
signals has always been a research area in which Lawrence Livermore’s scientists and engineers excel. Beginning in the 1950s, in the days of nuclear weapons testing, diagnostic systems were needed to capture the nuances of data produced from single-shot underground experiments. In the 1970s, the same need arose for experiments conducted on the Laboratory’s big laser systems such as Shiva. In these experiments, researchers had only one opportunity to catch and record the data—
they had no second chances once a test device exploded or a laser target imploded.
Because commercial support was limited for developing these diagnostic systems, Livermore scientists and engineers took the initiative to invent what was needed to get the job done. (See the box below.) In the 1950s, one-of-a-kind detectors were developed for transmitting electrical signals up copper coaxial cables to aboveground banks of oscilloscopes. In the 1980s, diagnostic systems incorporated the latest in fiber-optic technology to deliver optical signals
to streak cameras. Although oscilloscopes and streak cameras captured and recorded signals with detail in the 1-nanosecond (a billionth of a second) time frames of yesterday, the single-shot laser experiments of tomorrow will need instrumentation to capture signals with much more detail and in shorter time frames.
Experiments being planned for the National Ignition Facility (NIF)—the world’s largest laser—will require instrumentation that can capture ultrafast signal details in the realm of a single picosecond (a trillionth of a second). In a

S&TR June 20076
Lawrence Livermore National Laboratory
Time Microscope
technical leap that combines old and new technologies, engineer Corey V. Bennett of Livermore’s Engineering Directorate has designed a fiber-optic-based “time microscope” that can be attached to the front end of an oscilloscope or streak camera, improving the time resolution and dynamic range of these instruments by two orders of magnitude—from tens of picoseconds to hundreds of femtoseconds (where 1 femtosecond equals 10–15 second). Just as a scanning electron microscope’s powers of magnification can reveal nanometer-size details of an object’s structure not viewable with an ordinary desktop microscope, the time microscope’s powers of time magnification can reveal the peaks and valleys in a 1-picosecond signal not detected by a stand-alone oscilloscope or streak camera.
TheNeedforSpeedNIF is a key component of the National
Nuclear Security Administration’s (NNSA’s) Stockpile Stewardship Program, which is responsible for ensuring the safety, security, and reliability of the nation’s nuclear stockpile in the absence of underground nuclear testing. NIF is crucial to the program because it is the only facility that can create the extreme
temperature and pressure conditions found in stars and in exploding nuclear weapons. In addition, NIF is the only facility that can create fusion ignition and thermonuclear burn in the laboratory. Nuclear fusion is the process that modern nuclear weapons use to achieve their immense explosive power. The understanding of these conditions and the data provided by NIF will allow the country’s weapon stewards to assess and certify the aging stockpile using supercomputer modeling tools that have been experimentally validated.
Future high-energy-density and inertial confinement fusion experiments on NIF will generate neutrons, gamma rays, and hard x rays. During these shots, the reaction histories, dynamic temperatures of targets, and dynamic opacities must be measured. Capturing the nuances of these measurements—such as the detailed shape of a signal over time—is a challenge. Scientists will require ultrafast diagnostics that can reveal, for instance, when high-energy photons first appear and what happens from their first appearance to their peak production. The experiments will require diagnostics with time resolutions on the scale of 1 picosecond or less. In addition, these diagnostics must detect and record a high dynamic range of
signal strengths—from very weak signal intensities to very strong—far beyond the capabilities of existing systems.
NIF is not the only facility that will require improved diagnostics for measuring superfast events. In 2009, the Linac Coherent Light Source (LCLS) at the Stanford Linear Accelerator Center will begin operation as the world’s first x-ray free-electron laser. Pulses of x-ray laser light from LCLS will be many orders of magnitude brighter and several orders of magnitude shorter than those produced by any other x-ray source available now or in the near future. These characteristics will enable researchers to discover and probe new states of matter, follow and understand chemical reactions and biological processes in real time, image chemical and structural properties of materials on the nanoscale, and image noncrystalline biological materials at atomic resolution. For these experiments and others, LCLS will need diagnostic systems that can measure the timing and pulse shapes of its 100-femtosecond x-ray pulses.
Bennett says, “Upcoming experiments at NIF, LCLS, and elsewhere will involve faster physics on shorter timescales than on past single-shot events. It’s now a different world in terms of scale. The question is: How do we measure the resulting signals at a resolution that will allow the extraction of information needed to understand what happened in the experiment?”
Mark Lowry, a physicist in the Defense and Nuclear Technologies Directorate, participated in the last underground tests in the early 1990s. He says, “You can use simple scaling arguments to estimate the relationship between instrumentation requirements for the underground experiments and NIF. At the underground test sites, we were interested in measuring signals emanating from sources about 1 centimeter in size. The experiments used diagnostics that could capture 100-picosecond signals. We could see details of interest that yielded important information on the
106
105
104
103
102
101 ns 100 ps 10 ps
Temporal resolution
Fusion burn historymeasurement
Emergingneeds Fusion burn history
measurement
1 ps 100 fs 1 ns 100 ps 10 ps 1 ps 100 fsTemporal resolution
Dyn
amic
ran
ge
Oscilloscopes
Oscilloscopes
Streak cameras
Streak cameras
Emergingneeds
(a) The current technologies available to record fast events—digital oscilloscopes and streak
cameras—cannot reach the temporal resolution and dynamic range required for planned experiments
at the National Ignition Facility. (b) Adding the time microscope to the front end of these recording
devices “stretches out” the signal over time, augmenting the capabilities of these systems: ns =
nanoseconds, ps = picoseconds, and fs = femtoseconds.
(a) (b)

7
Lawrence Livermore National Laboratory
S&TR June 2007 Time Microscope
performance of a device.” NIF target sources will have diameters of 100 micrometers or less, about two orders of magnitude smaller than the underground test sources. “It takes a certain amount of time for a signal to transit a given dimension, which sets a minimum timescale of interest,” says Lowry. “We must capture signals at a rate at least two orders of magnitude faster to see the interesting data. The 1-picosecond temporal resolutions will be extremely useful.”
AMatterofResolutionBoth the dynamic ranges and temporal
resolutions of current technologies fall short of what will be needed to capture the details of fast-moving, complex events such as fusion burn history for NIF experiments. To reveal important nuances in the burn history, such experiments will require a dynamic range of about 105 and time resolutions of 1 picosecond. Engineer John Heebner of the Engineering Directorate says, “A challenge of extending existing instruments such as oscilloscopes and streak cameras to reach these regimes is that dynamic range and temporal resolution on these systems are coupled. The more temporal resolution we need, the less dynamic range we get, and vice versa.”
For example, an oscilloscope can capture a signal with a dynamic range of 104 only when the duration of the signal details are 10 nanoseconds or longer. Conversely, a 10-picosecond pulse recorded by an oscilloscope reveals almost no dynamic range. Streak cameras are somewhat better able to capture these signals—a dynamic range of 103 can be captured on a 5-picosecond pulse—but still fall short of what is required for NIF experiments. “If these instruments are going to be used, we need technologies that can extend their performance capabilities,” says Heebner.
The beauty of Bennett’s time microscope is that when it is attached
LensObject
Inputdispersion
Timelens
Outputdispersion
Image
InputFiber
Amplifiers
Nonlinear crystal waveguide
Laser system
Fiber pumpdispersion
Pulse picker
Chirped fiberBragg grating
Output
Optical and time microscopes work on the same basic principles. An optical microscope uses a
convex glass lens to form a magnified image of the original object. The time microscope has a “time
lens” consisting of a chirped pump pulse and a nonlinear crystal. Optical signals (flashes of light)
arriving via a fiber-optic cable are the “object” of the time microscope. These signals pass through
the time lens and are magnified, or stretched out, over time thus making them more recordable.
to a recording instrument such as an oscilloscope or streak camera, the microscope will slow down or “magnify” time for these instruments, allowing signals to be captured that otherwise would be too fast to record in any detail. “Time magnification not only extends the resolution of a recording instrument but also increases its dynamic range at longer timescales,” says Heebner.
AMicroscopebyAnyNameThe time microscope that Bennett
developed and built with engineering associate Bryan Moran of the Engineering Directorate had its genesis as a Laboratory Directed Research and Development project. The instrument works similar to an optical microscope but in the time domain rather than the spatial domain.
“The purpose of both instruments is to magnify something,” says Bennett. “When using the time microscope, we are magnifying the detail and duration of a signal, such as an optical pulse (a short flash of light) being transmitted through a fiber-optic cable. Stretching out a signal over time allows us to see rapidly varying little peaks and valleys in a signal’s strength.”
In a conventional optical microscope, a glass convex lens is the main element for magnifying the object. When diffracting light passes through the lens, the wavefront of the light converges. At some point beyond the lens, a scaled or magnified image of the original object forms. Why the wavefront converges has to do with the physics of light as it propagates through materials of differing properties and the curved lens.
S&TR June 20078
Lawrence Livermore National Laboratory
Time Microscope
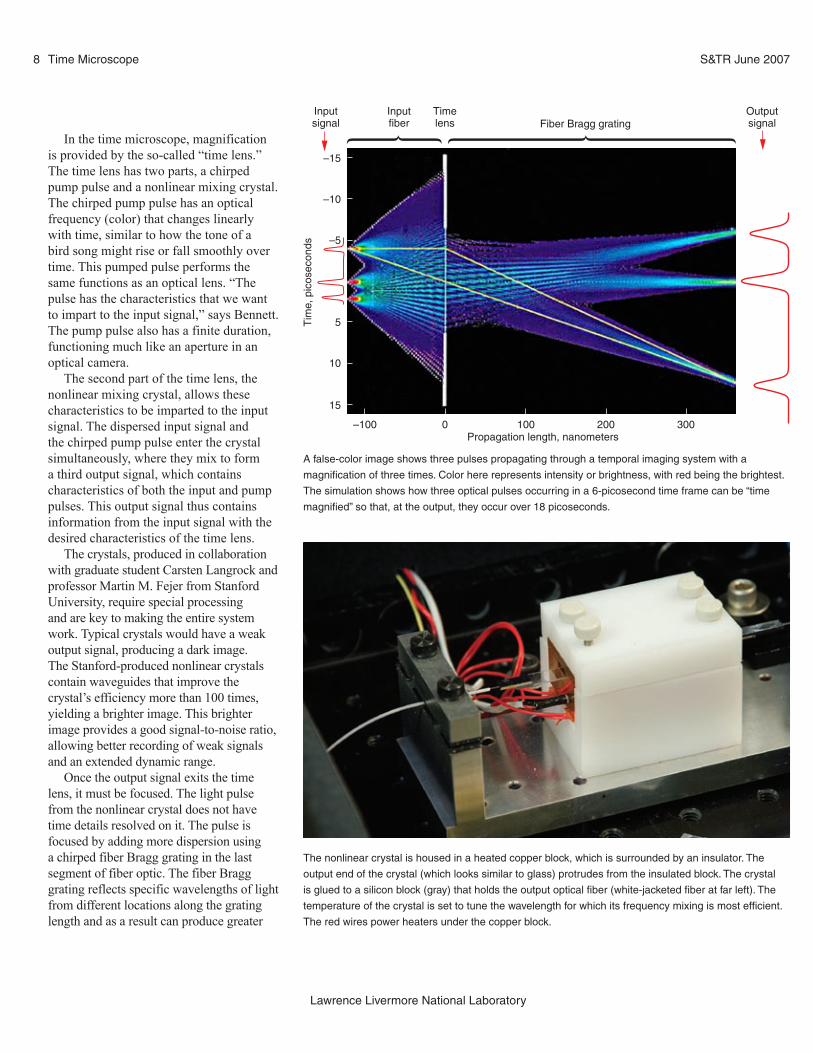
In the time microscope, magnification is provided by the so-called “time lens.” The time lens has two parts, a chirped pump pulse and a nonlinear mixing crystal. The chirped pump pulse has an optical frequency (color) that changes linearly with time, similar to how the tone of a bird song might rise or fall smoothly over time. This pumped pulse performs the same functions as an optical lens. “The pulse has the characteristics that we want to impart to the input signal,” says Bennett. The pump pulse also has a finite duration, functioning much like an aperture in an optical camera.
The second part of the time lens, the nonlinear mixing crystal, allows these characteristics to be imparted to the input signal. The dispersed input signal and the chirped pump pulse enter the crystal simultaneously, where they mix to form a third output signal, which contains characteristics of both the input and pump pulses. This output signal thus contains information from the input signal with the desired characteristics of the time lens.
The crystals, produced in collaboration with graduate student Carsten Langrock and professor Martin M. Fejer from Stanford University, require special processing and are key to making the entire system work. Typical crystals would have a weak output signal, producing a dark image. The Stanford-produced nonlinear crystals contain waveguides that improve the crystal’s efficiency more than 100 times, yielding a brighter image. This brighter image provides a good signal-to-noise ratio, allowing better recording of weak signals and an extended dynamic range.
Once the output signal exits the time lens, it must be focused. The light pulse from the nonlinear crystal does not have time details resolved on it. The pulse is focused by adding more dispersion using a chirped fiber Bragg grating in the last segment of fiber optic. The fiber Bragg grating reflects specific wavelengths of light from different locations along the grating length and as a result can produce greater
–15
–10
–5
5
10
15
–100 0 100Propagation length, nanometers
200 300
Tim
e, p
icos
econ
ds
Inputsignal
OutputsignalFiber Bragg grating
Timelens
Inputfiber
A false-color image shows three pulses propagating through a temporal imaging system with a
magnification of three times. Color here represents intensity or brightness, with red being the brightest.
The simulation shows how three optical pulses occurring in a 6-picosecond time frame can be “time
magnified” so that, at the output, they occur over 18 picoseconds.
The nonlinear crystal is housed in a heated copper block, which is surrounded by an insulator. The
output end of the crystal (which looks similar to glass) protrudes from the insulated block. The crystal
is glued to a silicon block (gray) that holds the output optical fiber (white-jacketed fiber at far left). The
temperature of the crystal is set to tune the wavelength for which its frequency mixing is most efficient.
The red wires power heaters under the copper block.
9
Lawrence Livermore National Laboratory
S&TR June 2007 Time Microscope
amounts of dispersion with less loss than traditional fibers.
“Different wavelengths in the spectrum of the signal are reflected with different delays,” explains Bennett. “This increased dispersion in the back end of the time microscope leads to a greater magnification, but the balance of the input dispersion and time-lens modulation allows the fine temporal details to come back into focus.” The fiber Bragg gratings are produced in collaboration with Morten Ibsen at the Optoelectronics Research Centre, University of Southampton, United Kingdom.
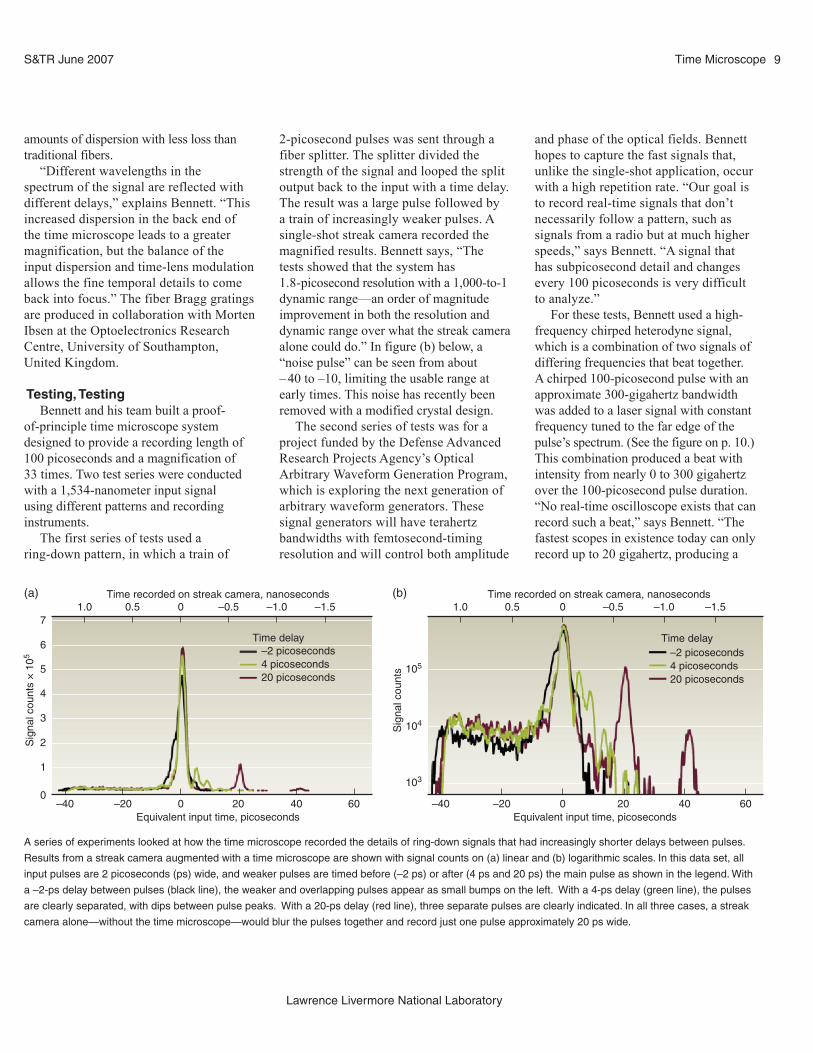
Testing,TestingBennett and his team built a proof-
of-principle time microscope system designed to provide a recording length of 100 picoseconds and a magnification of 33 times. Two test series were conducted with a 1,534-nanometer input signal using different patterns and recording instruments.
The first series of tests used a ring-down pattern, in which a train of
2-picosecond pulses was sent through a fiber splitter. The splitter divided the strength of the signal and looped the split output back to the input with a time delay. The result was a large pulse followed by a train of increasingly weaker pulses. A single-shot streak camera recorded the magnified results. Bennett says, “The tests showed that the system has 1.8-picosecond resolution with a 1,000-to-1 dynamic range—an order of magnitude improvement in both the resolution and dynamic range over what the streak camera alone could do.” In figure (b) below, a “noise pulse” can be seen from about – 40 to –10, limiting the usable range at early times. This noise has recently been removed with a modified crystal design.
The second series of tests was for a project funded by the Defense Advanced Research Projects Agency’s Optical Arbitrary Waveform Generation Program, which is exploring the next generation of arbitrary waveform generators. These signal generators will have terahertz bandwidths with femtosecond-timing resolution and will control both amplitude
and phase of the optical fields. Bennett hopes to capture the fast signals that, unlike the single-shot application, occur with a high repetition rate. “Our goal is to record real-time signals that don’t necessarily follow a pattern, such as signals from a radio but at much higher speeds,” says Bennett. “A signal that has subpicosecond detail and changes every 100 picoseconds is very difficult to analyze.”
For these tests, Bennett used a high-frequency chirped heterodyne signal, which is a combination of two signals of differing frequencies that beat together. A chirped 100-picosecond pulse with an approximate 300-gigahertz bandwidth was added to a laser signal with constant frequency tuned to the far edge of the pulse’s spectrum. (See the figure on p. 10.) This combination produced a beat with intensity from nearly 0 to 300 gigahertz over the 100-picosecond pulse duration. “No real-time oscilloscope exists that can record such a beat,” says Bennett. “The fastest scopes in existence today can only record up to 20 gigahertz, producing a
7
6
5
4
3
2
1
0–40 –20 0
1.0 0.5 0 –0.5Time recorded on streak camera, nanoseconds
Equivalent input time, picoseconds
–1.0 –1.5
20 40 60
Sig
nal c
ount
s ×
105
Time delay–2 picoseconds4 picoseconds20 picoseconds
Time delay–2 picoseconds4 picoseconds20 picoseconds
105
104
103
–40 –20 0
1.0 0.5 0 –0.5Time recorded on streak camera, nanoseconds
Equivalent input time, picoseconds
–1.0 –1.5
20 40 60
Sig
nal c
ount
s
A series of experiments looked at how the time microscope recorded the details of ring-down signals that had increasingly shorter delays between pulses.
Results from a streak camera augmented with a time microscope are shown with signal counts on (a) linear and (b) logarithmic scales. In this data set, all
input pulses are 2 picoseconds (ps) wide, and weaker pulses are timed before (–2 ps) or after (4 ps and 20 ps) the main pulse as shown in the legend. With
a –2-ps delay between pulses (black line), the weaker and overlapping pulses appear as small bumps on the left. With a 4-ps delay (green line), the pulses
are clearly separated, with dips between pulse peaks. With a 20-ps delay (red line), three separate pulses are clearly indicated. In all three cases, a streak
camera alone—without the time microscope—would blur the pulses together and record just one pulse approximately 20 ps wide.
(a) (b)

S&TR June 200710
Lawrence Livermore National Laboratory
Time Microscope
digitized sample every 20 picoseconds. They would record five data points in the digitized pulse, and the high-frequency modulation would be completely missed.” The time microscope expanded the timescale, and the oscilloscope captured the fine detail of the high-frequency beat. Each recorded pulse was captured in real time in a single shot, and the process was repeated up to 155-megahertz, capturing every fourth pulse in the laser’s pulse train.
SignalforSuccessThe time microscope system is
generating interest from scientists in the Defense and Nuclear Technologies Directorate, who are planning experiments for NIF. “In addition to fusion burn history measurements, we have the potential to get a closer look at equation of state,” says Lowry. “Evidence exists that changes are occurring on the subpicosecond timescale, and we may finally begin to see these with the time microscope. A benefit of the time microscope is that we can use some of our existing recording instruments such as streak cameras. We only need to attach the time microscope to see details of phenomena that occur on much shorter timescales.”
Ted Perry, also a physicist in the Defense and Nuclear Technologies Directorate, is equally enthusiastic.
“The time microscope is a wonderful technology, and I foresee it having a variety of uses in any number of areas, including the Test Readiness Program.” The Department of Energy through NNSA maintains this program, which is charged with retaining essential skills and improving the diagnostics needed to conduct a nuclear test. “Should nuclear weapons testing become necessary sometime in the future, we must be ready to resume underground testing within two years,” explains Perry. As part of the program, researchers look at old diagnostics from previous underground nuclear tests and consider what, given the technological advances over the past decade or two, might be improved. Perry asks, “If testing were to resume, what would we want to do better by a factor of 10? The time microscope could vastly improve some of our diagnostic systems. It’s a novel idea and a major leap in technology.”
Lowry agrees, adding, “Whenever a new diagnostic instrument or capability is developed, it suddenly provides a clearer view into what’s going on. We need to be prepared to see new and unexpected phenomena. No doubt, some of those phenomena will surprise us, and that’s a good thing because it means we have made scientific progress.”
—Ann Parker
KeyWords: Bragg grating, diagnostic system, dynamic range, fiber optic, free-electron laser, Linac Coherent Light Source (LCLS), National Ignition Facility (NIF), nonlinear crystal, oscilloscope, Stanford Linear Accelerator Center, Stockpile Stewardship Program, streak camera, time microscope, underground nuclear testing, x-ray pulse.
For further information contact Corey V.
Bennett (925) 422-9394 ([email protected]).
–80
–60
–40
–20
0
–40
1.5 1.0 0.5 0 –0.5 –1.0 –1.5
7200
150
100
6
5
4
3
–20 0Equivalent input time, picoseconds
Recorded signalLocal beat frequencyLinear fit of beat frequency
Sig
nal,
meg
avol
ts
Freq
uenc
y on
sco
pe, g
igah
ertz
Equ
ival
ent i
nput
freq
uenc
y, g
igah
ertz
Time recorded on scope, nanoseconds
20 40
In this experiment, a time-magnified
heterodyne beat signal recorded
a single shot on an 8-gigahertz
oscilloscope. The recorded
signal changes beat frequency
–3.45 gigahertz per nanosecond
indicating that the color of light in
the input pulse was chirped at a
rate of 313 gigahertz per
100 picoseconds.
11
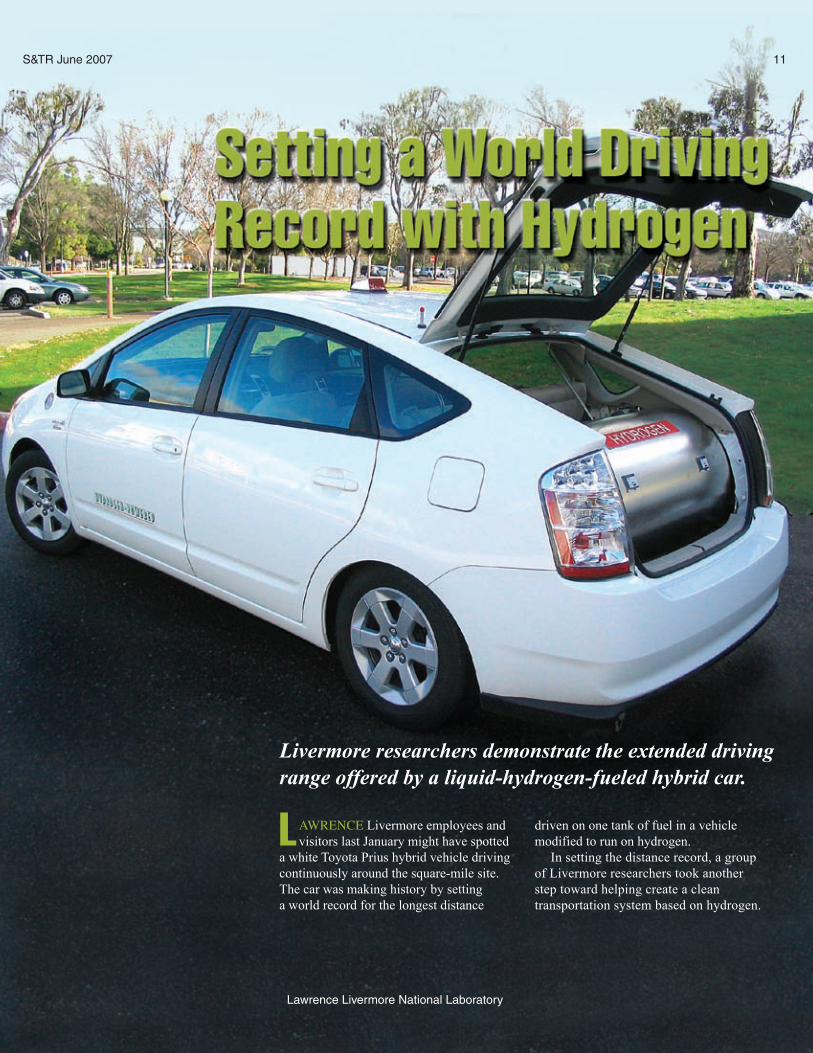
Livermore researchers demonstrate the extended driving range offered by a liquid-hydrogen-fueled hybrid car.
Lawrence Livermore National Laboratory
S&TR June 2007
LawRENcE Livermore employees and visitors last January might have spotted
a white Toyota Prius hybrid vehicle driving continuously around the square-mile site. The car was making history by setting a world record for the longest distance
driven on one tank of fuel in a vehicle modified to run on hydrogen.
In setting the distance record, a group of Livermore researchers took another step toward helping create a clean transportation system based on hydrogen.
S&TR June 200712
Lawrence Livermore National Laboratory
Cryo-Compressed Hydrogen Storage System
The group made history with a prototype of a concept called cryogenic-compressed tanks. These superinsulated, high-pressure tanks contain extremely cold, liquid hydrogen instead of the room-temperature compressed hydrogen gas typically used in hydrogen test vehicles. (See the box on p. 13.)
The Prius, which has a combination electric motor and small internal combustion engine, traveled 1,050 kilometers (653 miles) on a tank containing 150 liters (almost 40 gallons) of liquid hydrogen. The overall fuel economy for the driving conditions used by the Livermore team was about 105 kilometers per kilogram of hydrogen, which is equivalent to about 65 miles per gallon of gasoline. Coincidently, 1 kilogram of hydrogen has about the same energy content as 1 gallon of gasoline.
“One thousand kilometers is a very long range for a hydrogen vehicle because the fuel is difficult to store compactly,”
says Salvador Aceves, who leads the Energy and Environment Directorate’s Energy Conversion and Storage Group. Chief technician Tim Ross says, “The range we achieved is better than we expected. We originally anticipated the car would travel about 800 kilometers (500 miles) on 10 kilograms of hydrogen.” He describes the group’s Prius as a “moving hydrogen-storage technology test bed.”
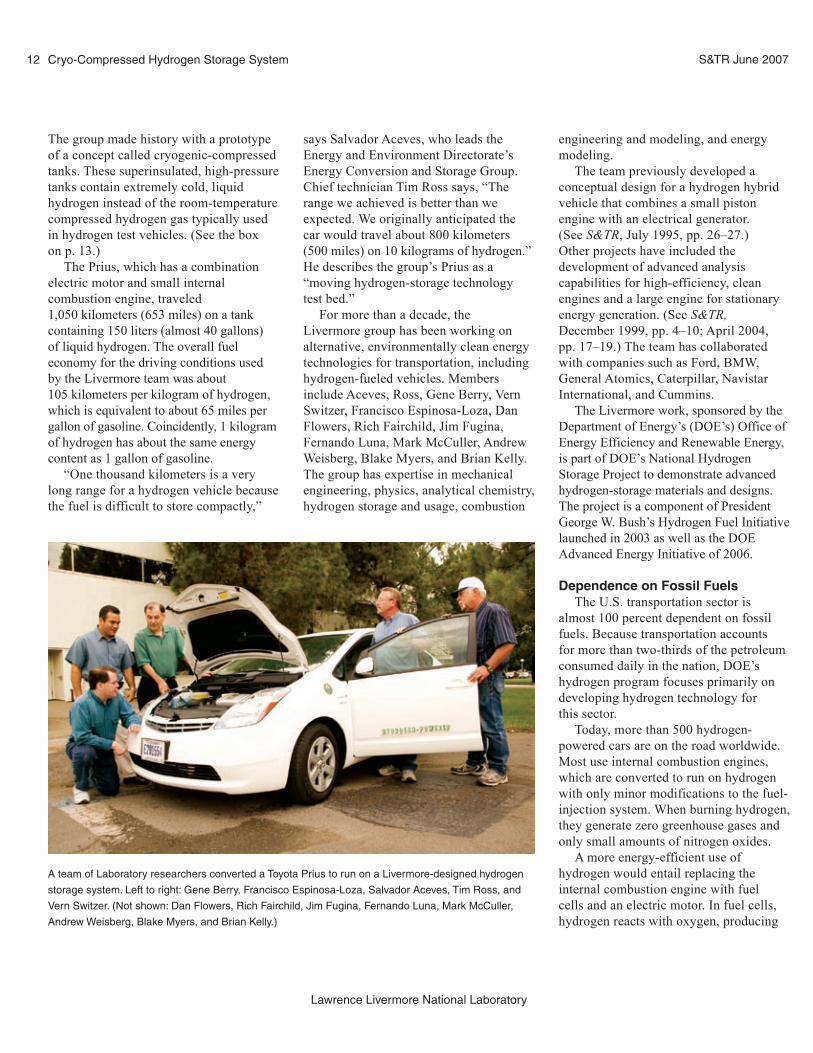
For more than a decade, the Livermore group has been working on alternative, environmentally clean energy technologies for transportation, including hydrogen-fueled vehicles. Members include Aceves, Ross, Gene Berry, Vern Switzer, Francisco Espinosa-Loza, Dan Flowers, Rich Fairchild, Jim Fugina, Fernando Luna, Mark McCuller, Andrew Weisberg, Blake Myers, and Brian Kelly. The group has expertise in mechanical engineering, physics, analytical chemistry, hydrogen storage and usage, combustion
A team of Laboratory researchers converted a Toyota Prius to run on a Livermore-designed hydrogen
storage system. Left to right: Gene Berry, Francisco Espinosa-Loza, Salvador Aceves, Tim Ross, and
Vern Switzer. (Not shown: Dan Flowers, Rich Fairchild, Jim Fugina, Fernando Luna, Mark McCuller,
Andrew Weisberg, Blake Myers, and Brian Kelly.)
engineering and modeling, and energy modeling.
The team previously developed a conceptual design for a hydrogen hybrid vehicle that combines a small piston engine with an electrical generator. (See S&TR, July 1995, pp. 26–27.) Other projects have included the development of advanced analysis capabilities for high-efficiency, clean engines and a large engine for stationary energy generation. (See S&TR, December 1999, pp. 4–10; April 2004, pp. 17–19.) The team has collaborated with companies such as Ford, BMW, General Atomics, Caterpillar, Navistar International, and Cummins.
The Livermore work, sponsored by the Department of Energy’s (DOE’s) Office of Energy Efficiency and Renewable Energy, is part of DOE’s National Hydrogen Storage Project to demonstrate advanced hydrogen-storage materials and designs. The project is a component of President George W. Bush’s Hydrogen Fuel Initiative launched in 2003 as well as the DOE Advanced Energy Initiative of 2006.
DependenceonFossilFuelsThe U.S. transportation sector is
almost 100 percent dependent on fossil fuels. Because transportation accounts for more than two-thirds of the petroleum consumed daily in the nation, DOE’s hydrogen program focuses primarily on developing hydrogen technology for this sector.
Today, more than 500 hydrogen-powered cars are on the road worldwide. Most use internal combustion engines, which are converted to run on hydrogen with only minor modifications to the fuel-injection system. When burning hydrogen, they generate zero greenhouse gases and only small amounts of nitrogen oxides.
A more energy-efficient use of hydrogen would entail replacing the internal combustion engine with fuel cells and an electric motor. In fuel cells, hydrogen reacts with oxygen, producing

13
Lawrence Livermore National Laboratory
S&TR June 2007 Cryo-Compressed Hydrogen Storage System
electricity to power the vehicle. Water vapor is the only emission. Although research is progressing at a fast pace, fuel cells are still quite expensive.
HydrogenOffersBigAdvantagesMany energy scientists are optimistic
that hydrogen-burning vehicles will not only help the nation’s energy consumption but also curb the release of greenhouse gases such as carbon dioxide. “Increasing use efficiency is an important first step but may not be enough for steep reductions in petroleum dependence and greenhouse-gas emissions,” says Aceves. “We ultimately need to advance to a carbonless energy system using hydrogen fuel.”
Aceves says, “Hydrogen-fueled vehicles enable carbonless transportation. We can’t collect all the greenhouse gases from the tailpipes of cars and trucks. Instead, we can make hydrogen from natural gas or coal and sequester underground the greenhouse gases that are generated during production.” A better choice, he says, is to use nuclear power or
renewable energy (wind, solar, or biomass) to drive electrolysis, which splits water into hydrogen and oxygen and does not generate any pollutants.
Most prototype hydrogen vehicles use compressed hydrogen stored at room temperature and high pressure (35 to 70 megapascals or 350 to 700 atmospheres). Despite hydrogen’s stellar fuel efficiency, it is difficult to store compressed hydrogen in the large quantities needed to provide the driving range achieved by gasoline- and diesel-powered vehicles. The energy density of compressed hydrogen at 35 megapascals is only about one-twelfth that of gasoline. As a result, hydrogen cars use large high-pressure tanks often located in the trunk. According to DOE studies, these cars have a driving range of up to 300 kilometers, adequate for around town or most commutes but not for a long trip.
CoolingIsKeyLike all gases, compressed hydrogen
can be stored more compactly at colder
temperatures. Pressurized hydrogen at 35 megapascals becomes twice as dense when cooled from ambient temperature to –150°C. Cooling it further to –210°C (close to that of liquid nitrogen) triples the energy density. Cooling hydrogen also lowers the potential risk of a sudden tank rupture, increasing the safety factor.
The team has focused on liquid hydrogen (–253°C) because it does not require a high-pressure tank, and it takes up one-third the volume of compressed hydrogen at room temperature. Liquid hydrogen can also be delivered in large quantities (up to 4,000 kilograms) cost-effectively by truck. Finally, liquid hydrogen is relatively safe to store in compact, lightweight, low-pressure containers that depend on superinsulation instead of refrigeration to keep the hydrogen extremely cold.
Livermore researchers are experienced at using liquid hydrogen in research projects. For example, physicists used liquid hydrogen in targets for shock-compression experiments to achieve
With one proton and one electron, hydrogen is the first element on the periodic table and the lightest, most abundant element in the universe. Invisible and odorless, hydrogen is not toxic or corrosive.
Hydrogen does not exist naturally on Earth in its pure form. It must be produced from water using a source of energy such as electricity, heat, or another fuel (for instance, natural gas or coal). The most widespread production method reacts natural gas with steam to produce hydrogen and carbon dioxide. However, this method begins with a fossil fuel and therefore generates greenhouse gases. One approach to managing the greenhouse-gas problem is to immediately sequester the gases underground. Alternatively, nuclear or renewable energy (wind, solar, or biomass) could be used to electrolyze water.
Hydrogen has the highest combustion energy by weight of any fuel. Burning 1 kilogram of hydrogen produces 2.6 times more energy than 1 kilogram of gasoline. However, gaseous hydrogen pressurized to 35 megapascals needs about 12 times the volume of gasoline to produce the same amount of energy. Widespread development of vehicles running on compressed hydrogen gas has been slow because of this low energy density.
MostAbundantElementintheUniverseHydrogen has been safely used as a fuel since the 1950s by
the National Aeronautics and Space Administration in the U.S. space program and as a feedstock in the chemical industry and for oil refineries. Hydrogen suffers from many misperceptions about its safety, especially since the explosion of the hydrogen-fueled Hindenburg dirigible in 1937. However, the fire that destroyed the Hindenburg was caused by an electrical charge that ignited the flammable coating.
California state government leaders have been among the strongest supporters of using hydrogen as a transportation fuel. “California is becoming the capital of hydrogen research,” says Livermore’s GeneBerry, an engineer and energy analyst. The goal of the California Hydrogen Highway Network initiative is to support a transition to a hydrogen-based transportation economy. The initiative has a goal of 50 to 100 hydrogen-fueling stations (about 24 have already been built) and 2,000 hydrogen-powered vehicles on the road by 2010. One plan is to locate liquid-hydrogen filling stations near freeways because drivers on long trips would choose that form of hydrogen for its longer range.
For more information on the California initiative, see http://hydrogenhighway.ca.gov/.
S&TR June 200714
Lawrence Livermore National Laboratory
Cryo-Compressed Hydrogen Storage System
hydrogen’s metallized state for the first time. (See S&TR, September 1996, pp. 12–18.) Aceves’s group is using the same liquid-hydrogen storage and pumping facility that the physicists installed for their shock experiments.
Among the automotive companies, BMW has spearheaded the use of liquid hydrogen in automobiles. BMW is leasing 100 dual-fuel luxury V-12 automobiles that run on both gasoline and hydrogen. The driver switches operation between gasoline and the liquid hydrogen stored in a low-pressure tank behind the rear seat.
A major drawback to using liquid hydrogen is the significant electricity required to liquefy it (about equal to 30 percent of the energy content of the hydrogen molecule). In addition, liquid hydrogen is extremely sensitive to heat; it expands significantly when warmed only a
few degrees. As a result, vehicles that use low-pressure tanks are usually not filled to maximum capacity and must have a system to release some of the hydrogen vapor that accumulates in the tank when the car is not driven for several days. In a parked car, the tank pressure can build until it surpasses the service pressure (the pressure for which the tank was built). At this point, the hydrogen is released through a safety valve from the vessel. A driver leaving his or her car at the airport for a long time, for example, might find the tank empty upon returning. Drivers whose cars also run on gasoline, such as the new dual-fuel BMWs, would not have this problem because they could use the gasoline fuel.
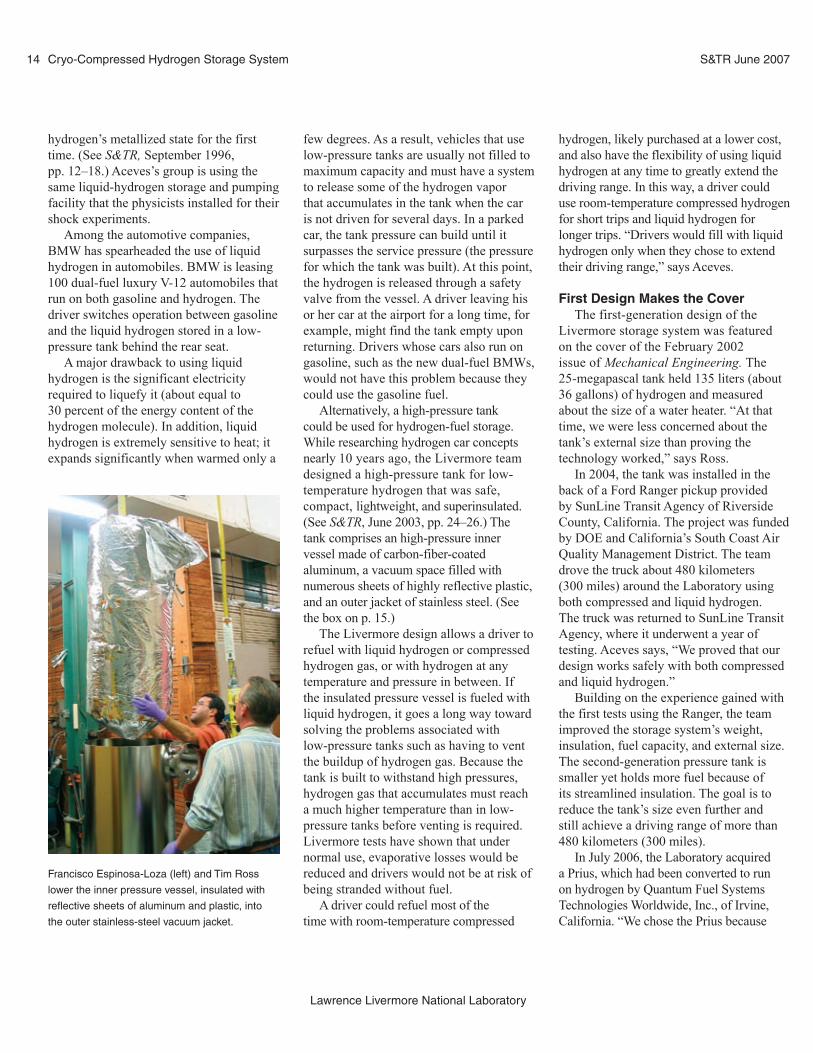
Alternatively, a high-pressure tank could be used for hydrogen-fuel storage. While researching hydrogen car concepts nearly 10 years ago, the Livermore team designed a high-pressure tank for low-temperature hydrogen that was safe, compact, lightweight, and superinsulated. (See S&TR, June 2003, pp. 24–26.) The tank comprises an high-pressure inner vessel made of carbon-fiber-coated aluminum, a vacuum space filled with numerous sheets of highly reflective plastic, and an outer jacket of stainless steel. (See the box on p. 15.)
The Livermore design allows a driver to refuel with liquid hydrogen or compressed hydrogen gas, or with hydrogen at any temperature and pressure in between. If the insulated pressure vessel is fueled with liquid hydrogen, it goes a long way toward solving the problems associated with low-pressure tanks such as having to vent the buildup of hydrogen gas. Because the tank is built to withstand high pressures, hydrogen gas that accumulates must reach a much higher temperature than in low-pressure tanks before venting is required. Livermore tests have shown that under normal use, evaporative losses would be reduced and drivers would not be at risk of being stranded without fuel.
A driver could refuel most of the time with room-temperature compressed
hydrogen, likely purchased at a lower cost, and also have the flexibility of using liquid hydrogen at any time to greatly extend the driving range. In this way, a driver could use room-temperature compressed hydrogen for short trips and liquid hydrogen for longer trips. “Drivers would fill with liquid hydrogen only when they chose to extend their driving range,” says Aceves.
FirstDesignMakestheCoverThe first-generation design of the
Livermore storage system was featured on the cover of the February 2002 issue of Mechanical Engineering. The 25-megapascal tank held 135 liters (about 36 gallons) of hydrogen and measured about the size of a water heater. “At that time, we were less concerned about the tank’s external size than proving the technology worked,” says Ross.
In 2004, the tank was installed in the back of a Ford Ranger pickup provided by SunLine Transit Agency of Riverside County, California. The project was funded by DOE and California’s South Coast Air Quality Management District. The team drove the truck about 480 kilometers (300 miles) around the Laboratory using both compressed and liquid hydrogen. The truck was returned to SunLine Transit Agency, where it underwent a year of testing. Aceves says, “We proved that our design works safely with both compressed and liquid hydrogen.”
Building on the experience gained with the first tests using the Ranger, the team improved the storage system’s weight, insulation, fuel capacity, and external size. The second-generation pressure tank is smaller yet holds more fuel because of its streamlined insulation. The goal is to reduce the tank’s size even further and still achieve a driving range of more than 480 kilometers (300 miles).
In July 2006, the Laboratory acquired a Prius, which had been converted to run on hydrogen by Quantum Fuel Systems Technologies Worldwide, Inc., of Irvine, California. “We chose the Prius because
Francisco Espinosa-Loza (left) and Tim Ross
lower the inner pressure vessel, insulated with
reflective sheets of aluminum and plastic, into
the outer stainless-steel vacuum jacket.

15
Lawrence Livermore National Laboratory
S&TR June 2007 Cryo-Compressed Hydrogen Storage System
The Livermore liquid-hydrogen storage tank consists of an inner pressure vessel and an outer vacuum jacket. The inner vessel is made of aluminum coated with carbon fibers for high strength. It was custom-fabricated by Structural Composites Industries of Pomona, California. Once the inner pressure vessel arrived at Livermore, technicians wrapped it in 50 layers of highly reflective metallized plastic. The inner vessel was then slid into a stainless-steel vacuum jacket fabricated by a vendor to Livermore specifications. The inner vessel was centered inside the outer jacket using several small fiberglass rings. The two-part tank was then welded shut, and the air between the two vessels was pumped out to create a vacuum.
The vacuum minimizes the conduction of heat between the outer steel jacket and the inner pressure vessel, which would cause liquid hydrogen to evaporate quickly. In addition, the multiple layers of reflective material almost eliminate heat transfer from radiation, much like a Thermos bottle.
The outer steel jacket has cutouts for thermocouples and sensors to measure pressure, temperature, and the fuel level within the inner vessel. In addition, the system is equipped with two safety devices to prevent catastrophic failure in case of overpressure. The first device is spring actuated and can open and reseal to minimize the loss of hydrogen. The second device is a backup rupture disk that once opened, stays open. The rupture disk would be triggered if the tank was in a fire and the pressure rose too fast for the spring-loaded valve to vent it.
The storage tank has undergone numerous tests to demonstrate its safety and reliability. The tests follow procedures specified by the U.S. Department of Transportation, the Society of Automotive Engineers, and the International Organization for Standardization. In every case, the tank met the test criteria. The tests were conducted both at Livermore test facilities and at outside private laboratories certified by the Department of Transportation. Some of the tests focused on the inner aluminum-composite vessel, and other tests evaluated the entire tank.
One test involved 900 high-pressure cycles and 100 low-temperature cycles. During a high-pressure cycle, the pressure is increased from ambient pressure to the service pressure (35 megapascals) and then reduced back to ambient pressure. During a temperature cycle, the inner vessel is filled with liquid nitrogen and then emptied. The cycles are alternated, with nine pressure cycles being run followed by a temperature cycle. This sequence is repeated 100 times. The test is equivalent to more than 480,000 kilometers of driving with a high-efficiency vehicle. The vessel withstood the cyclic tests without evidence of damage, distortion, or leakage.
TankCanTaketheHeat—andtheColdMany other tests were performed, including cycling 5,000 times
from zero to service pressure at different temperatures and humidities. In another test, the inner vessel was burst-tested after being cycled at cryogenic temperature. The inner vessel was also pressurized with gaseous nitrogen to service pressure and shot with a 0.30-caliber armor-piercing projectile from 15 meters. The vessel remained in one piece when pierced by the bullet.
The entire tank was also placed in a bonfire, and the pressure relief device fully vented the gas. In another test, the tank was subjected to a drop from 3 meters while empty and from 10 meters filled with liquid nitrogen. In both instances, the tank remained intact.
In addition to these tests, the inner pressure vessel was analyzed with finite-element computer software. The results indicated that repeated cryogenic and high-pressure cycling is unlikely to damage the vessel, which is in agreement with experimental results.
In a test of strength, the tank
was dropped from a height of
3 meters while empty and from
10 meters (shown) filled with
liquid nitrogen. The tank
successfully contained the
liquid nitrogen for the required
60 minutes.
In one test, the tank was placed
in a bonfire for 20 minutes.
The pressure-relief device fully
vented the gas, as designed.

S&TR June 200716
Lawrence Livermore National Laboratory
Cryo-Compressed Hydrogen Storage System
it was energy-efficient and required only a small tank of liquid hydrogen,” says Aceves. The Prius was selected because Quantum was already converting about 40 of the cars for use in cities in the Los Angeles area.
The modified Prius arrived with two room-temperature compressed hydrogen tanks rated at a pressure of 34 megapascals. The tanks could store a total of 1.8 kilograms of compressed gaseous hydrogen, enough to travel about 145 kilometers (90 miles). Livermore researchers removed the tanks and installed their second-generation tank system, relocating the Prius’s electric motor batteries to underneath the car.
“We first performed tests using a combination of compressed hydrogen and liquid hydrogen in the tanks. Then for the continuous test drive on one full tank, we used all liquid hydrogen,” says Ross.
The circuit testing of the Prius took place over a two-week period in January 2007, with group members taking turns driving on a continuous 5-kilometer (3-mile) circuit on the Livermore site. Drivers recorded operating parameters, including driving distance, fuel use and pressure, fuel temperature, and fill level. The test drive was conducted at 40 to 56 kilometers (25 to 35 miles) per hour because of site speed limits. Aceves estimates that under more realistic driving conditions, the Prius would average about 88 kilometers (55 miles) per kilogram instead of the 105 kilometers (65 miles) per kilogram achieved at the low speeds.
OneSmallStepDespite the resounding success of the
Livermore system, Aceves cautions that a great deal more research is needed before the design is ready for mass-produced
hydrogen vehicles. The team is collaborating with industry to design more compact vessels with improved thermal endurance. In addition, the team has had discussions with both domestic and foreign automakers. A third-generation tank design is planned, with even greater performance expected.
The Livermore team is playing an important role in making possible both clean and sustainable transportation fueled by the simplest element in the universe.
—Arnie Heller
KeyWords:carbon sequestration,compressed hydrogen gas, greenhouse gases, hydrogen-powered vehicle, liquid hydrogen, National Hydrogen Storage Project.
For further information contact Salvador
Aceves (925) 422-0864 ([email protected]).
Left to right: Mark McCuller, Jim Fugina, Francisco Espinosa-Loza, and
Tim Ross worked on the first-generation design of the Livermore hydrogen
storage system, which was installed in the back of a Ford Ranger pickup.
Vern Switzer (left) and Tim Ross check the pressure on the inner vessel
that holds hydrogen of any temperature.

17
Lawrence Livermore National Laboratory
ResearchHighlights
THE U.S. Bureau of Reclamation (USBR) has constructed more than 600 dams in the western U.S. over the past several
decades. USBR’s Dam Safety Program ensures the safety of these structures and protects the public by using computer simulations to identify those dams that pose a potential risk to the public. With the help of Livermore computer codes and the expertise of civil engineer Chad Noble, USBR has advanced its computational and analysis capabilities for studying the response of dams to earthquakes.
“We want to help the Bureau of Reclamation study these structures using advanced computational methods,” says Noble, who works in Livermore’s Engineering Directorate. Realistic computer analyses of dams’ vulnerabilities to Earth movement are critical because overestimating a dam’s response can lead to unnecessary and expensive modifications, while underestimating its response could put nearby communities at risk. Furthermore, it is practically impossible to conduct small-scale experiments for determining the anticipated behavior of dams under strong seismic motions.
USBR asked Noble to simulate the seismic response of Morrow Point Dam, which was constructed from 1963 to 1968 in a 750-meter-deep gorge of the Gunnison River’s Black Canyon in southwest Colorado. The Cimarron Fault is located about 1 kilometer from the dam. Morrow Point Dam impounds approximately 144 million cubic meters of water in the Morrow Point Reservoir, which extends about 7 kilometers upstream. The dam structure is 143 meters high with a crest (top of the dam) length of 221 meters. The dam ranges in thickness from 3.7 meters at the crest to 16 meters at its base.
Morrow Point Dam is a relatively thin, double curvature arch dam. An arch dam is curved upstream to transmit the major water load to the dam’s abutments (the part of a dam that supports the ends) and to keep the structure in compression. A double curvature arch dam is curved vertically as well as horizontally.
LivermoreFamilyofCodesNoble was tasked with modeling the general area of the dam as
realistically as possible and computing as accurately as possible the response of the dam to seismic forces. To accomplish the detailed seismic analysis, he turned to a family of codes developed at Livermore and now widely used by academia, private industry,
Morrow Point Dam in southwest Colorado. (Image courtesy of the U.S.
Bureau of Reclamation.)
Virtual Dams Subjected to Strong Earthquakes
and other government laboratories. These codes are the mechanical deformation codes NIKE3D and DYNA3D (and its variant for massively parallel supercomputers, PARADYN), as well as the thermal code TOPAZ3D. Noble previously used these codes in blast-effect analyses for homeland security applications, biomechanical applications, and a nonlinear seismic analysis of the Bixby Creek Bridge in northern California. The bridge analysis was part of a continuing Livermore effort to simulate the effects of destructive earthquakes. (See S&TR, September 2006, pp. 4–12.)
The Livermore codes use finite-element analysis, a method for analyzing engineering problems. In this approach, a solid object is divided into an assemblage of simple elements for which the

S&TR June 200718
Lawrence Livermore National Laboratory
Simulating Seismic Safety of Dams
computer calculates structural behavior. Visually, the collection of elements resembles a wire mesh. The element boundaries are defined by lines that intersect at junctions called nodes. The nodes at each corner define the movement and deformation of the elements. Each corner can move in any direction, depending on the stresses and strains it experiences. Finite-element analysis has been used to simulate car crashes, train accidents, nuclear waste containers falling off transportation vehicles, blade failures on aircraft, and biomedical interactions. (See S&TR, May 1998, pp. 12–19.)
For the Morrow Point Dam study, Noble simulated a 2.6-kilometer area that included the dam and its foundation, part of the reservoir, and the surrounding canyon. An accurate representation of the region’s geology and topography were required to study the effects of seismic waves traveling through the canyon.
Noble transformed the area into a mesh of 1 million brick-shaped elements of different sizes that extended 520 meters underground. A three-dimensional (3D) mesh of fluid elements
was developed to represent the water in the reservoir and permit hydrodynamic interaction, which is the interaction between the reservoir and the dam during an earthquake. Hydrodynamic interaction can have a significant effect on the dam’s response and must be considered in any dynamic analysis. In particular, hydrodynamic interaction has a larger influence on thinner, less massive dams such as Morrow Point. The simulated dam was composed of a much finer mesh of 30,000 elements. An increased mesh density produces results that are more accurate but requires additional computer time.
In addition, the simulation included the movement of the dam’s 17 vertical contraction joints, which were incorporated in the dam’s design to help relieve stress under different loading environments such as thermal changes and earthquakes. Livermore engineer Jerome Solberg developed a contraction-joint-contact algorithm that allowed simulated movement of the dam’s contraction joints. These concrete contraction joints have shear keys, similar to beveled teeth, that allow contraction joints to open 0.25 centimeters during the simulated earthquake response.
A regional simulation of the Morrow Point Dam region, including the dam,
part of the reservoir, and the surrounding canyon, was transformed into a
mesh of 1 million brick-shaped elements of different sizes that extended
520 meters underground. The dam itself was composed of a fine mesh of
30,000 elements.
This simulation shows a fringe plot of the principal tensile stresses on the
downstream side of the dam structure at 6.55 seconds in the earthquake
simulation. The time of 6.55 seconds correlates with a peak upstream
dam displacement of approximately 6 centimeters. Blue correlates with a
stress value of 0, and green correlates with a stress value of approximately
2,400 kilopascals.

19
Lawrence Livermore National Laboratory
S&TR June 2007 Simulating Seismic Safety of Dams
required 32 processors and two days to complete. An animation showed the structure moving up and down, side to side, and back and forth as the water in the reservoir sloshed against the dam and the sides of the canyon. The greatest displacement occurred in the middle top as it moved back and forth in the upstream–downstream direction, covering a distance of nearly 6 centimeters. The simulation showed no significant damage occurring from the earthquake. Only minor cracking of the dam was observed. “This structure is very robust,” says Noble.
Building on experience gained in the Morrow Point Dam study, Noble plans to study the seismic integrity of levees in northern California’s Sacramento–San Joaquin River Delta region. “We can use many of the same techniques to study levees,” says Noble. Livermore’s Energy and Environment Directorate is providing the geologic modeling required to accurately study levee damage. Noble is also hoping to study the seismic vulnerability of structures in the Midwest, an area that could be devastated by an earthquake on the New Madrid Fault. As long as Earth keeps shaking, advanced finite-element analysis seems certain to play an important role in analyzing the likely response of structures.
—Arnie Heller
KeyWords:dam,DYNA3D, earthquake, finite-element analysis, Multiprogrammatic Capability Resource, NIKE3D, PARADYN, TOPAZ3D, U.S. Bureau of Reclamation (USBR).
For further information contact Chad Noble (925) 422-3057
Noble used TOPAZ3D to perform thermal analysis. “It is important to account for temperature differences between the dam and the water as well as temperature differences throughout the dam,” he says. For example, temperature is a factor in the movement of the contraction joints.
Noble subjected the 3D mesh to realistic ground motion generated from the Cimarron Fault. The ground motion data were supplied by USBR’s Seismotectonics and Geophysics Group. The motion, which lasted about 25 seconds, was equivalent to a 6.5-magnitude earthquake. The seismic forces were applied to the dam’s foundation, and simulated seismic waves propagated upward through the dam.
The seismic analysis was nonlinear, meaning it modeled nonlinearities in materials and geometries. Nonlinearities in the dam included those from contraction joints and concrete cracking. They also included those from the extensive contact surfaces between the dam, reservoir, foundation, and abutment. In contrast, most USBR concrete dams have been analyzed using linear dynamic finite-element analysis. Linear analyses can determine levels of stress and movement that indicate potential damage in a structure. However, they cannot predict failure. High stresses computed in linear analyses do not take into account the redistribution of stress when cracks form or when contraction joints open and close.
AnimationShowsDamMotionOne of Noble’s simulations was performed on Livermore’s
Multiprogrammatic Capability Resource supercomputer. This simulation, which obtained the greatest amount of detail,

ResearchHighlights S&TR June 200720
Lawrence Livermore National Laboratory
is the principal investigator of the project. Before working at Doheny, Humayan was at Johns Hopkins University. In the early 1990s, a team he led discovered that patients with retinal disease could still receive light signals through electrical stimulation of the remaining neural wiring in the retina. Work then began on an implantable microelectrode array that could communicate with the remaining functional cells and stimulate visual perceptions. In 2005, R&D Magazine named Humayan as Innovator of the Year.
DOE established its Artificial Retina Project in 1999, and Livermore has been involved from the beginning. (See S&TR, November 2003, pp. 11–13.) Other participants include Second Sight Medical Products, Inc.; Argonne, Brookhaven, Los Alamos, Oak Ridge, and Sandia national laboratories; North Carolina State University; and the University of California at Santa Cruz. Second Sight created the first 16-electrode models. It will also be responsible for clinical trials and eventual commercial distribution of the retinal prosthesis to patients.
InsidetheDelicateEye
The technologies that produced the heart pacemaker and the cochlear implant to aid the deaf formed the foundation for the development of the retinal prosthesis. Because the artificial retina must function in the eye, a very delicate environment that is constantly bathed by bodily fluids, advanced technologies are needed.
The prosthesis consists of a tiny camera and microprocessor mounted in eyeglasses, a receiver implanted behind the ear, and an
L IVERmoRE is bringing its expertise in micro- and nanomaterials development
and systems integration to a Department of Energy (DOE) project that is creating a new artificial retina. Six national laboratories, three universities, and private industry are combining their resources to create a retinal prosthetic device to restore sight to the blind.
To implant DOE’s retinal prosthesis, doctors thread an electrode-studded array through an incision in the eye and attach it to retinal tissue. In 2002, the first such operation was performed on a 77-year-old patient who had been blind for 50 years. Within weeks, he could see patterns of light and dark that allowed him to detect motion and locate and differentiate simple objects. Since then, five more volunteers have had the 16-electrode device inserted in an eye.
This spring, a patient received the first prosthesis with a 60-electrode array. An even newer laboratory version contains more than 200 electrodes, yet it is thinner and conforms better to the shape of an eye than earlier models. Work is also under way on a prosthesis with over 1,000 electrodes. As shown in the figure on p. 21, at least 1,000 electrodes are needed for a person to be able to recognize faces.
Vision loss because of retinal disease affects about 6 million Americans and 25 million people worldwide. Retinitis pigmentosa and age-related macular degeneration are the primary causes of retinal disease. Both ailments destroy the light-sensing cells (photoreceptors) in the retina, a multilayered membrane located at the back of the eye. These cells do a poor job of repairing themselves. Because no effective treatments exist, those blinded by the diseases must accept their condition and adapt to life in a sightless world. Blindness takes a toll not only on the blind individuals and their families but also on national economies, adding to health-care spending burdens because patients often require significant aid. An additional spur for finding a solution to retinal disease is our aging population. The number of those affected by retinal disease will continue to grow and, according to some estimates, may even triple by 2025, creating an epidemic of vision loss.
The Doheny Eye Institute at the University of Southern California is leading DOE’s Artificial Retina Project. Mark Humayan, a retinal surgeon and biomedical engineer at Doheny,
A Second Chance at Sight
A retinal prosthetic device with a 240-electrode array is biocompatible,
conforms to retinal tissue, and is mechanically robust.

21
Lawrence Livermore National Laboratory
S&TR June 2007 Retinal Prosthesis
electrode-studded array attached to the retina. The camera captures an image and sends the information to the microprocessor, which converts the data to electronic signals. These signals are then transmitted to the receiver. The receiver sends the signals to the electrode array, stimulating it to emit electrical pulses. The pulses travel through the optic nerve to the brain, which perceives patterns of light and dark spots corresponding to the electrodes stimulated. Patients learn to interpret the visual patterns produced.
At the heart of the artificial retina is the electrode array, which was designed, fabricated, and initially tested at Livermore. The first designs for the electrode array used a silicone-based substrate, which the Laboratory had successfully applied to other biocompatible devices. “However, silicone is stretchy,” says Satinderpall Pannu, who leads the Livermore team, “and the metal electrodes attached to the substrate tended to break.” In the latest designs, the electrodes are mounted on a proprietary substrate material developed by Second Sight.
To fit in a patient’s eye, the array can be no larger than 5 millimeters wide. The electrodes must be very small yet large enough to receive sufficient energy for stimulation. Because of these space constraints, a retinal prosthesis containing more than 1,000 electrodes will require the development of new electrode materials.
The electrode array also incorporates the electronics that allow communication between the receiver behind the ear and the electrodes in the eye. Sandia is responsible for the electronics, while Livermore is designing the package that contains them. Livermore is also responsible for the interconnects between the electronics and the electrode array. Earlier designs of the prosthesis used a tiny cable between the receiver and the electronics on the array. Communications are now wireless.
The electrode array is embedded in a high-density polymer thin film. Livermore experts in nano- and microelectromechanical systems design created the tiny electrodes and methods for attaching them to the substrate. Livermore’s expertise in the design and fabrication of novel materials was thoroughly tested in this project. “Improving the adhesion forces between layers of polymers and metals was a challenge,” says Pannu.
On the array, the electronics package and electrodes are mounted at opposite ends. The package must be biocompatible, and no gas can be exchanged between any of the materials and the eye. Pannu calls this work “a very challenging part of the project” for the team.
At Doheny Eye Institute, the prostheses are tested on dogs to ensure all materials are biocompatible and fully functional in the eye. For example, water from the eye may cause a short circuit in the device. For these tests, a prototype prosthesis is inserted in one eye of a blind dog. After 6 months in the dog’s eye, the prosthesis is removed and tested by Doheny and Second Sight. Testing of the electronics package reveals whether the case is hermetically sealed.
SurgicalUpdatesMore effective prostheses are becoming available, and patients
who received the earlier models may want an update. However, because the 16-electrode array is attached directly to the retina, it cannot be removed. Pannu’s team is now developing a new surgical tool and technique that will allow electrode arrays to be replaced as newer versions become available.
The Council on Competitiveness, a nonprofit, nonpartisan policy action group that sets an action agenda to drive U.S. competitiveness and economic leadership, featured DOE’s Artificial Retina Project at its 20th anniversary celebration in November 2006. The council considers the ability to restore lost sight a premier example of this country’s competitive edge. Restoring sight is also the right thing to do.
—Katie Walter
KeyWords: artificial retina, electrode array, microfabrication, retinal prosthesis.
For further information contact Satinderpall (Sat) Pannu at
(925) 422-5095 ([email protected]).
For more information on DOE’s Artificial Retina Project, see
http://artificialretina.energy.gov.
These images approximate what patients with
a retinal prosthesis see with (a) 16 electrodes,
(b) 256 electrodes, and (c) 1,000+ electrodes.
(Images generated by the Artificial Retinal
Implant Vision Simulator devised and developed
by Wolfgang Fink at the Visual and Autonomous
Exploration Systems Research Laboratory,
California Institute of Technology.)
(a) (b) (c)

S&TR June 200722
Lawrence Livermore National Laboratory
Highlight Descriptor
key results in theoretical physics. He also helped Gamow conduct a groundbreaking annual conference on theoretical physics. The discovery of fission was first announced at this meeting in 1939.
By summer 1941, the Manhattan Project was secretly under way at Columbia University, and Teller accepted an invitation to teach there even as he helped develop the first nuclear weapon. At Columbia and later at Los Alamos National Laboratory, he mentored students and younger colleagues on applied physics.
After World War II, Teller became a professor of physics at the University of Chicago. Several of his students went on to play leading roles in the heyday of postwar science. Among his students from Chicago were C. N. Yang (Nobel Prize 1957), Marshall Rosenbluth, Marvin Goldberger, Lincoln Wolfenstein, and Walter Selove. Earlier students at Columbia included Arthur Kantrowitz and Julius Ashkin, and at GWU, Charles Critchfield and Stephen Brunauer. During Teller’s time at Berkeley, Balazs Rozsnyai, now a physicist at Lawrence Livermore, was one of his students.
With the 1952 founding of Lawrence Livermore as a peer to Los Alamos, Teller continued to teach at seminars and conferences. Simultaneously, at the University of California (UC) at Berkeley,
January 15, 2008, marks the 100th anniversary of Edward Teller’s birth. This highlight is the fourth in a series of 10 honoring his life and contributions to science.
Had theoretical and applied physics not laid first claim to his talents, Edward Teller’s gift for teaching would be his enduring
legacy. No question from a student was too basic, no new idea too exotic to engage his interest and command a thoughtful response. Teller advised doctoral students in prewar Germany and later in the U.S., many of whom became leading scientists. He taught college physics for nonmajors and chatted about science with fourth graders. In each case, he capitalized on the opportunity to teach at a level his students could grasp.
On one point he was emphatic: Science and mathematics are systematic studies that can be taught appropriately to any age group. Teller argued that educators should teach current theories in ways appropriate to the students’ level of learning well before such an approach was popular.
Certain in his vision for better science education, Teller complemented a passion for the classroom with research activities for more than three decades. As a refugee from Germany in 1934, he first worked with Niels Bohr at the Institute of Theoretical Physics in Copenhagen, where he was a Rockefeller Fellow. Teller
then went to University College London, where he taught quantum mechanics while simultaneously researching molecular and solid-state structure. When he was offered a full professorship at
George Washington University (GWU) in Washington, DC,
Teller sailed as soon as his visa was in order. From fall 1935 through spring 1941, in addition
to teaching, he worked closely with George Gamow and others, producing
A Gifted Teacher of Applied and Fundamental PhysicsHighlights of Teller’s Contributions to Education
S&TR June 200722 TellerCentennialHighlight
Edward Teller, who loved to teach, talks to rapt fourth graders from Lodi,
California, in June 1990.

23
Lawrence Livermore National Laboratory
S&TR June 2007 Highlight Descriptor
A Gifted Teacher of Applied and Fundamental PhysicsHighlights of Teller’s Contributions to Education
schools. Laboratory scientists identify projects that integrate well with the state standards, and STEP administers the programs.
Perhaps Stan Hitomi, former ETEC director, said it best when he observed, “Dr. Teller never turned down an offer to meet and engage with students or teachers. He will always have a connection to education through ETEC and the Edward Teller Science and Technology Education Symposium.”
—Alane L. Alchorn
KeyWords: Department of Applied Science (DAS), Edward Teller Education Center (ETEC), George Gamow, Niels Bohr, Science and Technology Education Program (STEP).
For further information contact Stephen B. Libby (925) 422-9785
S&TR June 2007 23
he taught the basic course Physics 10, filling the cavernous Wheeler Auditorium for his class lectures.
In 1960, Teller proposed a Laboratory-linked educational institution that would make advanced scientific and engineering degrees accessible to working researchers. That proposal culminated in the creation of the UC Davis Department of Applied Science (DAS) in 1963. DAS was launched as a pioneering attempt to bridge the gap between new discoveries in basic science and the practical application of those discoveries.
That effort continues today. DAS draws faculty from the UC Davis Engineering Department and numerous Laboratory disciplines. Candidates for M.S. and Ph.D. degrees in engineering and multidisciplinary science apply through the Laboratory. Accepted students combine academic class work with applied science assignments on site. Teller nurtured DAS in its early years, chairing it through 1966. To date, more than 1,500 scientists have graduated from DAS.
In 1999, the Fannie and John Hertz Foundation gave $1 million to UC to endow a chair in Teller’s name at DAS. Visibly moved by this investment in science education, Teller told the press that the honor meant more to him than any other he had received. “There’s absolutely no award, there’s nothing in the world that could be as valuable to me as a plan to better educate our next generation of applied scientists.”
Two other contributions to ongoing education added to Teller’s educational legacy. In 1975, he accepted an appointment as a Senior Research Fellow at the Hoover Institution on War, Revolution, and Peace. Located at Stanford University, the Hoover Institution provided Teller with a forum in one of the world’s best-known think tanks and the opportunity to give an occasional lecture.
Concurrently, Livermore boosted its education outreach by instituting the Science and Technology Education Program (STEP) for science teachers. In March 2000, STEP and DAS began offering joint continuing scientific education for K–12 teachers, and exactly one year later, Teller endorsed the concept by lending his name. The Edward Teller Education Center (ETEC) was created to offer teacher-enrichment programs that align with the science content and teaching standards for California public
Teller Centennial Highlight
In the 1950s, Teller’s Physics 10
class in Wheeler Auditorium at the
University of California at Berkeley
had almost 1,000 students. The
basic physics course is still taught
today.
Edward Teller (wearing his trademark cowboy boots) throws out the first
shovel of dirt at the groundbreaking of the Edward Teller Education Center.
The center was formally dedicated September 9, 2003, the day coincidently
also of Teller’s death.

S&TR June 200724
Lawrence Livermore National Laboratory
PatentsandAwardsEach month in this space, we report on the patents issued to and/or the awards received by Laboratory employees. Our goal is to showcase the distinguished scientific and technical achievements of our employees as well as to indicate the scale and scope of the work done at the Laboratory.
Patents
Characterizing,Synthesizing,and/orCancelingOutAcousticSignalsfromSoundSourcesJohnF.Holzrichter,LawrenceC.NgU.S. Patent 7,191,105 B2March 13, 2007This system can characterize, synthesize, or cancel acoustic signals from inanimate and animate sound sources. Electromagnetic sensors monitor excitation sources in sound-producing systems such as the human voice, machines, and musical instruments. Acoustic output from these systems is monitored to generate a transfer function that characterizes the sound-producing system. The transfer function can then be used to synthesize acoustic output from the sound-producing system or to cancel it. The transfer functions calculated by this system relate specific excitations to acoustic outputs. Knowledge of such signals and functions can be used in various applications to replicate or cancel sounds and to identify sources.
StorageofH2byAbsorptionand/orMixturewithinaFluidMediumGeneDavidBerry,SalvadorMartinAcevesU.S. Patent 7,191,602 B2March 20, 2007 For the first time, a hydrogen-storage method, apparatus, and system having a fluid mixture is provided. At predetermined pressures or temperatures within a contained, substantially fixed volume, the fluid mixture can store a high density of hydrogen molecules. A predetermined phase of the fluid mixture can be withdrawn from the substantially fixed volume for use as a vehicle fuel or energy storage and has reduced or no evaporative losses, which benefits storage weight, vessel cost, vessel shape, safety, and energy efficiency.
Awards
MicrofluidicSystemswithEmbeddedMaterialsandStructuresandMethodThereofJeffreyD.Morse,KlintA.Rose,MariamMaghribi,WilliamBenett,PeterKrulevitch,JulieHamilton,RobertT.Graff,AlanJankowskiU.S. Patent 7,186,352 B2March 6, 2007In this process for fabricating microfluidic systems with embedded components, micrometer-scale features are molded into the polymeric material polydimethylsiloxane (PDMS). Micromachining is used to create a master mold, and the liquid precursors for PDMS are poured over the mold. The precursors are allowed to cure, and the PDMS is removed from the mold. After a simple surface preparation step to form sealed microchannels, the PDMS is then bonded to another material such as PDMS, glass, or silicon.
VariableFlexure-BasedFluidFilterSteveB.Brown,BillyW.Colston,Jr.,GrahamMarshall,DuaneWolcottU.S. Patent 7,188,731, B2March 13, 2007This apparatus for filtering particles from a fluid comprises a fluid inlet, a fluid outlet, a variable-size passage between the inlet and outlets, and a means for adjusting the size of the passage for filtering particles from the fluid. An inlet fluid-flow stream is introduced to a fixture with a variable-size passage. The size of the passage is adjusted so that the fluid passes through the passage but the particles do not.
DylanRood of the Laboratory’s Center for Accelerator Mass Spectrometry (CAMS) won honorable mention in the 2007AmericanAssociationfortheAdvancementofScience’sStudentPosterCompetition. He was recognized in the April 20, 2007, issue of Science and on the annual meeting’s Web site for his poster entitled “Changing Rates and Styles of Crustal Deformation at Timescales of 10 My to 10 Ky.”
Rood is a Student Employee Graduate Research Fellowship participant at the Laboratory. He uses geology and terrestrial cosmogenic nuclide dating methods at CAMS to research the question of whether earthquake fault slip rates are constant over different timescales. These rates provide a valuable context for assessing seismic hazards and will be used to test fundamental models of the earthquake cycle.
PatriceTurchi of the Chemistry, Materials, and Life Sciences Directorate won the 2007AlSonntagAward from the SocietyofTribologistsandLubricationEngineers (STLE). Turchi was selected for his paper “Atomic-Scale Sliding Friction of Amorphous and Nanostructured SiC and Diamond Surfaces.”
The Al Sonntag Award was established in 1983 to honor the STLE member or members authoring the best paper on solid
lubricants published by the society during the year preceding the annual meeting. STLE is the premier technical society representing 3,500 individuals and 150 companies and organizations that comprise the tribology and lubrication engineering business sector. Members are employed by leading corporations and academic institutions and by governmental agencies dealing with science and technology.
Livermore computer scientist MayaGokhale has been named a Fellow by the InstituteofElectricalandElectronicsEngineers (IEEE) for her contributions to reconfigurable computing technology, a discipline of growing importance for deployable systems such as those used for homeland security and other defense applications.
Gokhale, who came to the Laboratory from Los Alamos National Laboratory in January 2007, has been working in the reconfigurable computing field since its inception in the late 1980s and has been instrumental in its development. The total number of IEEE fellows selected in any one year does not exceed one-tenth of one percent of the worldwide IEEE voting membership.

Abstracts
U.S. Government Printing Office: 2007/670-074-10029
Co
mi
ng
N
ex
t
Mo
nt
h
DoingaStretchofTimeDeveloping ways to measure fast-moving, transient signals has
been a trademark of Lawrence Livermore since the early days of nuclear weapons testing. In the 1960s, oscilloscopes and streak cameras captured and recorded signals with detail in 1 billionth of a second. Although testing ceased in 1992, the need for recording single-shot data continued. Experiments planned for the National Ignition Facility—the world’s largest laser—will require instrumentation that can capture details orders of magnitude smaller and in 1 trillionth of a second. In a technical leap that combines old and new technologies, engineer Corey V. Bennett designed a fiber-optic-based “time microscope” that can be attached to the front end of an oscilloscope or streak camera. The time microscope increases both the time resolution and dynamic range of these instruments by two orders of magnitude. Just as a scanning electron microscope reveals nanometer-size details of an object’s structure not viewable with an ordinary desktop microscope, the time microscope reveals picosecond-length signal peaks and valleys not detected by a stand-alone oscilloscope or streak camera.Contact:
Corey V. Bennett (925) 422-9394 ([email protected]).
SettingaWorldDrivingRecordwithHydrogen
A Livermore group has developed a superinsulated, compact high-pressure storage system that can hold both liquid hydrogen and compressed room-temperature hydrogen gas for use in a hydrogen-powered vehicle. The Livermore hydrogen-storage system consists of an inner pressure vessel insulated with reflective sheets of aluminum and plastic and enclosed within an outer vacuum jacket. The storage system was recently tested on a Toyota Prius hybrid car, which has a combined electric motor and small internal combustion engine. In a record-setting run, the group drove the Prius 1,050 kilometers (653 miles) on one tank of liquid hydrogen (150 liters or almost 40 gallons). The hydrogen weighed about 10 kilograms. The overall fuel economy was about 105 kilometers per kilogram of hydrogen (equivalent to about 65 miles per gallon of gasoline) when driven at 40 to 56 kilometers (25 to 35 miles) per hour. The Livermore design allows a driver to refuel with liquid hydrogen for long trips or compressed hydrogen gas for shorter trips and typical commutes.Contact: Salvador Aceves (925) 422-0864 ([email protected]).
The X-Games of Science
Basic science experiments on the National Ignition Facility (NIF) will advance our understanding of the universe.
Also in July/August• Novel materials and innovative fabrication techniques will be used to design targets for the basic science research on NIF..• NIF will provide a laboratory setting for examining how stars create the elements.
• With NIF, researchers can refine their understanding of physics at extremely high pressures and better model the formation of planets and exoplanets.

University of CaliforniaScience & Technology ReviewLawrence Livermore National LaboratoryP.O. Box 808, L-664Livermore, California 94551
Printed on recycled paper.
NONPROFIT ORG. U.S. POSTAGE
PAID LIVERMORE, CAPERMIT NO. 154