Embed Size (px)
Citation preview
June 2008 KeyBanc Conference
Brady Investor Presentation
1
Forward-Looking Statements
We believe that certain statements in this presentation are “forward-looking statements” within the meaning of the Private Securities Litigation Reform Act of 1995. All statements related to future, not past, events included in this presentation, including, without limitation, statements regarding our future financial position, business strategy, targets, projected sales, costs, earnings, capital expenditures, debt levels and cash flows, and plans and objectives of management for future operations are forward-looking statements. When used in this presentation, words such as “may,” “will,” “expect,” “intend,” “estimate,” “anticipate,” “believe,” “should,” “project” or “plan” or similar terminology are generally intended to identify forward-looking statements. These forward-looking statements by their nature address matters that are, to different degrees, uncertain and are subject to risks, assumptions and other factors, some of which are beyond our control, that could cause actual results to differ materially from those expressed or implied by such forward-looking statements. For us, uncertainties arise from future financial performance of major markets we serve, which include, without limitation, telecommunications, manufacturing, electrical, construction, laboratory, education, governmental, public utility, computer, transportation; difficulties in making and integrating acquisitions; risks associated with newly acquired businesses; our ability to retain significant contracts and customers; future competition; our ability to develop and successfully market new products; changes in the supply of, or price for, parts and components; increased price pressure from suppliers and customers; interruptions to sources of supply; environmental, health and safety compliance costs and liabilities; our ability to realize cost savings from operating initiatives; our ability to attract and retain key talent; difficulties associated with exports; risks associated with international operations; fluctuations in currency rates versus the US dollar; technology changes; potential write-offs of our substantial intangible assets; risks associated with obtaining governmental approvals and maintaining regulatory compliance for new and existing products; business interruptions due to implementing business systems; and numerous other matters of national, regional and global scale, including those of a political, economic, business, competitive and regulatory nature contained from time to time in our U.S. Securities and Exchange Commission filings, including, but not limited to, those factors listed in the "Risk Factors" section located in Item 1A of Part II of our Form 10-K for the period ended July 31, 2007. These uncertainties may cause our actual future results to be materially different than those expressed in our forward-looking statements. We do not undertake to update our forward-looking statements.
We refer to certain non-GAAP financial measures in this presentation. Reconciliations of these non-GAAP financial measures to the most directly comparable GAAP financial measures can be found within this presentation.
2
Brady’s Mission
We identify and protect premises, products and people
3
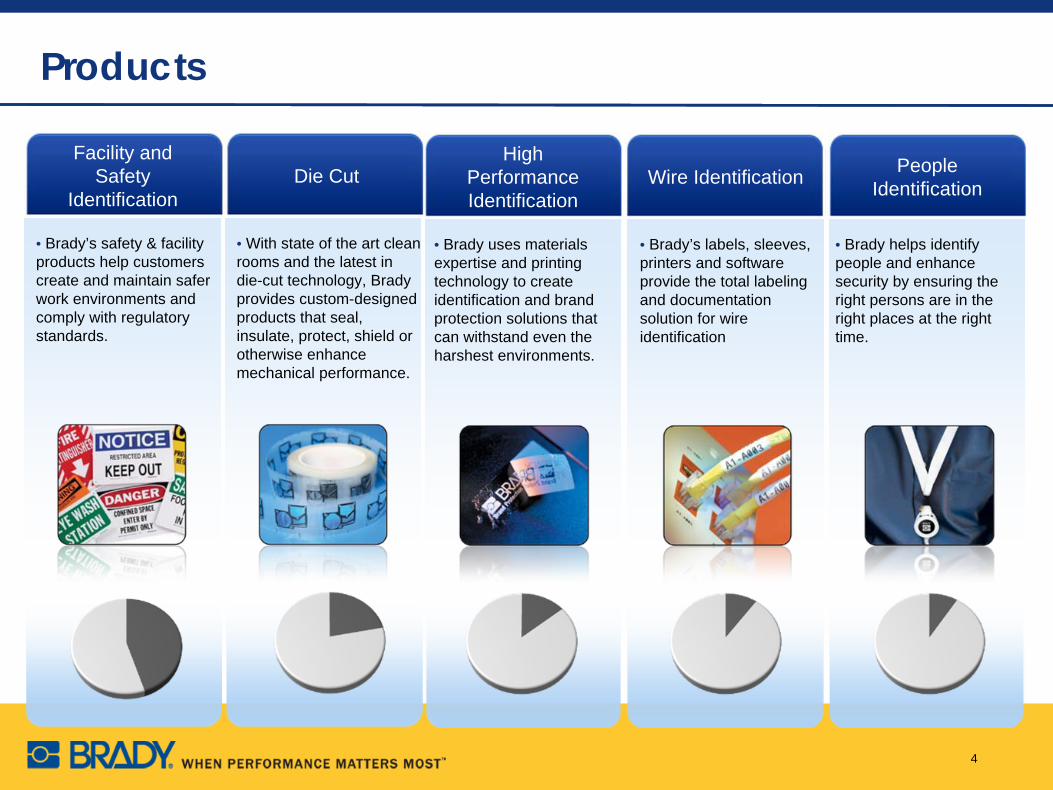
Products
• With state of the art clean rooms and the latest in die-cut technology, Brady provides custom-designed products that seal, insulate, protect, shield or otherwise enhance mechanical performance.
Die Cut Wire Identification
• Brady’s labels, sleeves, printers and software provide the total labeling and documentation solution for wire identification
• Brady’s safety & facility products help customers create and maintain safer work environments and comply with regulatory standards.
Facility and Safety
Identification
High Performance Identification
• Brady uses materials expertise and printing technology to create identification and brand protection solutions that can withstand even the harshest environments.
People Identification
• Brady helps identify people and enhance security by ensuring the right persons are in the right places at the right time.
4
Markets
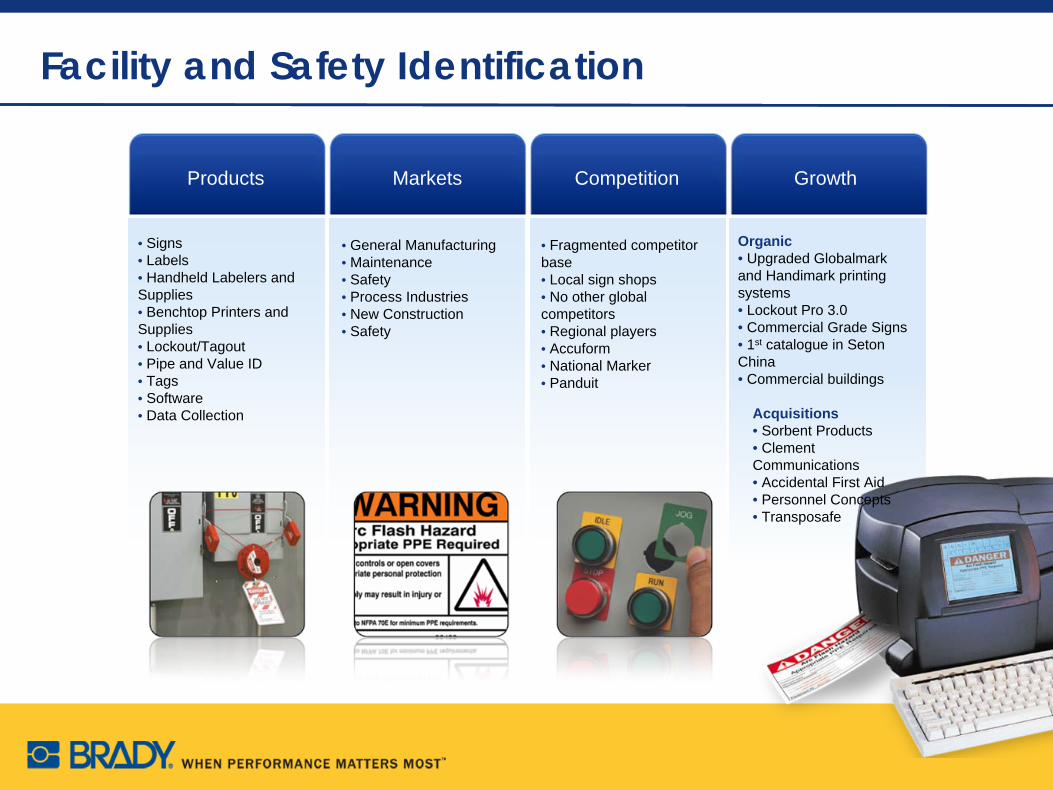
• General Manufacturing• Maintenance• Safety• Process Industries• New Construction• Safety
Competition
• Fragmented competitor base• Local sign shops• No other global competitors• Regional players• Accuform• National Marker• Panduit
Growth
• Signs• Labels• Handheld Labelers and Supplies• Benchtop Printers and Supplies• Lockout/Tagout• Pipe and Value ID• Tags• Software• Data Collection
Products
Facility and Safety Identification
Organic• Upgraded Globalmark and Handimark printing systems• Lockout Pro 3.0• Commercial Grade Signs• 1st catalogue in Seton China• Commercial buildings
Acquisitions• Sorbent Products• Clement Communications• Accidental First Aid• Personnel Concepts• Transposafe
Markets
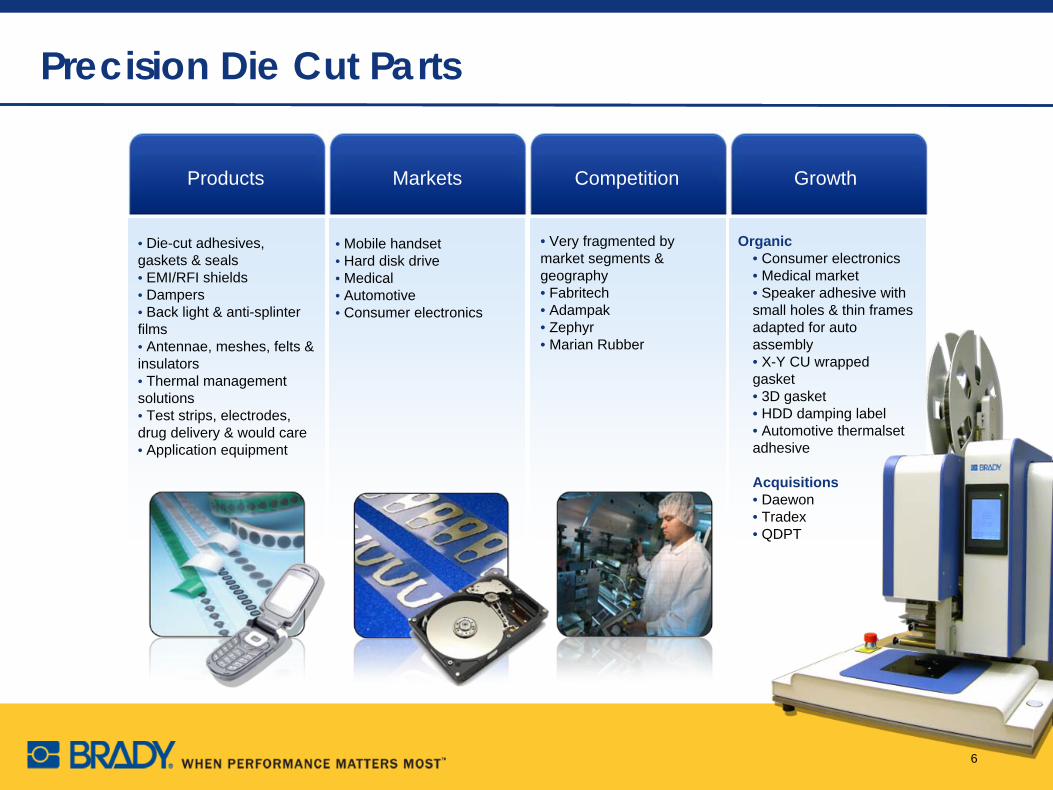
• Mobile handset• Hard disk drive• Medical• Automotive• Consumer electronics
Competition Growth
• Die-cut adhesives, gaskets & seals• EMI/RFI shields• Dampers• Back light & anti-splinter films• Antennae, meshes, felts & insulators• Thermal management solutions• Test strips, electrodes, drug delivery & would care• Application equipment
Products
Precision Die Cut Parts
Organic• Consumer electronics• Medical market• Speaker adhesive with small holes & thin frames adapted for auto assembly• X-Y CU wrapped gasket• 3D gasket• HDD damping label• Automotive thermalset adhesive
Acquisitions• Daewon• Tradex• QDPT
• Very fragmented by market segments & geography• Fabritech• Adampak• Zephyr• Marian Rubber
6
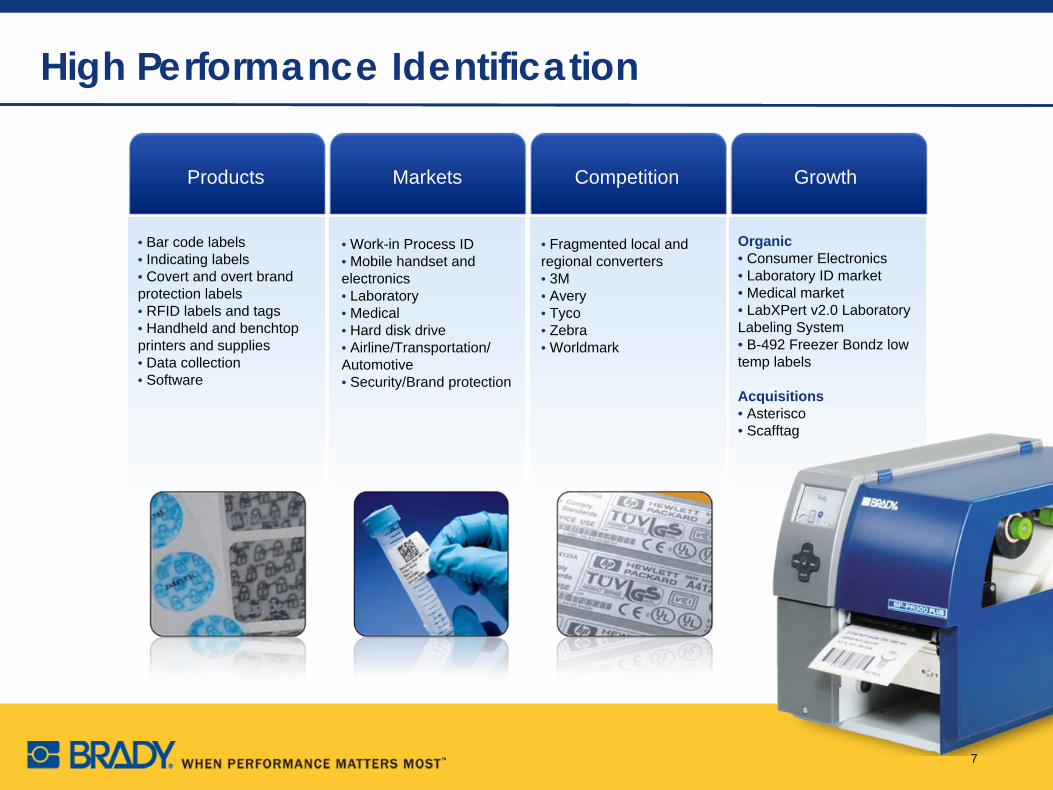
Markets
• Work-in Process ID• Mobile handset and electronics• Laboratory• Medical• Hard disk drive• Airline/Transportation/Automotive• Security/Brand protection
Competition
• Fragmented local and regional converters• 3M• Avery• Tyco• Zebra• Worldmark
Growth
• Bar code labels• Indicating labels• Covert and overt brand protection labels• RFID labels and tags• Handheld and benchtop printers and supplies• Data collection• Software
Products
High Performance Identification
Organic• Consumer Electronics• Laboratory ID market• Medical market• LabXPert v2.0 Laboratory Labeling System• B-492 Freezer Bondz low temp labels
Acquisitions• Asterisco• Scafftag
7
Markets
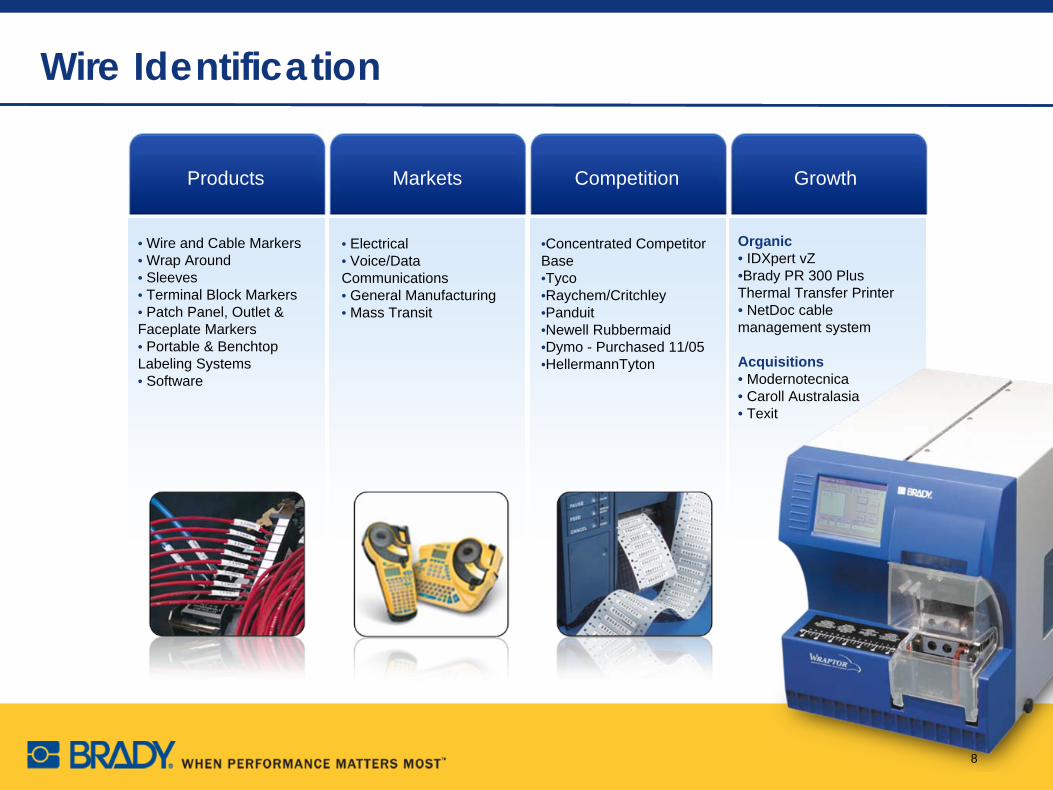
• Electrical• Voice/Data Communications• General Manufacturing• Mass Transit
Competition
•Concentrated Competitor Base•Tyco•Raychem/Critchley•Panduit•Newell Rubbermaid•Dymo - Purchased 11/05•HellermannTyton
Growth
• Wire and Cable Markers• Wrap Around• Sleeves• Terminal Block Markers• Patch Panel, Outlet & Faceplate Markers• Portable & Benchtop Labeling Systems• Software
Products
Wire Identification
Organic• IDXpert vZ•Brady PR 300 Plus Thermal Transfer Printer• NetDoc cable management system
Acquisitions• Modernotecnica• Caroll Australasia• Texit
8
Markets
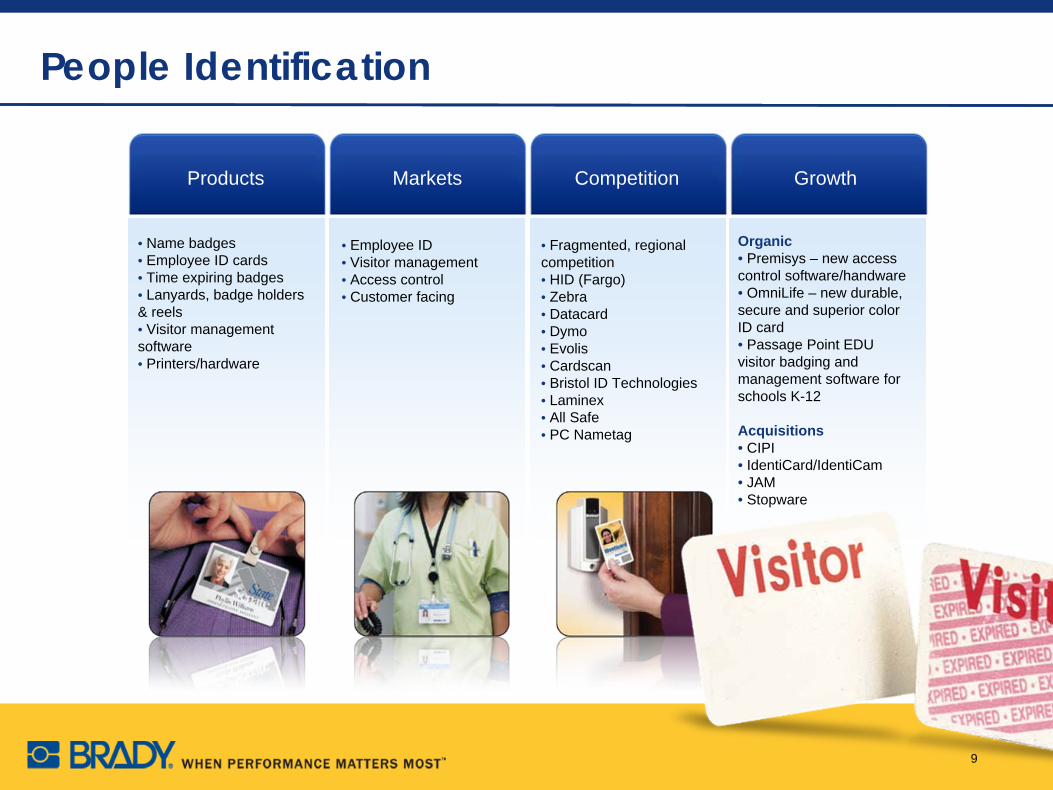
• Employee ID• Visitor management• Access control• Customer facing
Competition
• Fragmented, regional competition• HID (Fargo)• Zebra• Datacard• Dymo• Evolis• Cardscan• Bristol ID Technologies• Laminex• All Safe• PC Nametag
Growth
• Name badges• Employee ID cards• Time expiring badges• Lanyards, badge holders & reels• Visitor management software• Printers/hardware
Products
People Identification
Organic• Premisys – new access control software/handware• OmniLife – new durable, secure and superior color ID card• Passage Point EDU visitor badging and management software for schools K-12
Acquisitions• CIPI• IdentiCard/IdentiCam• JAM• Stopware
9
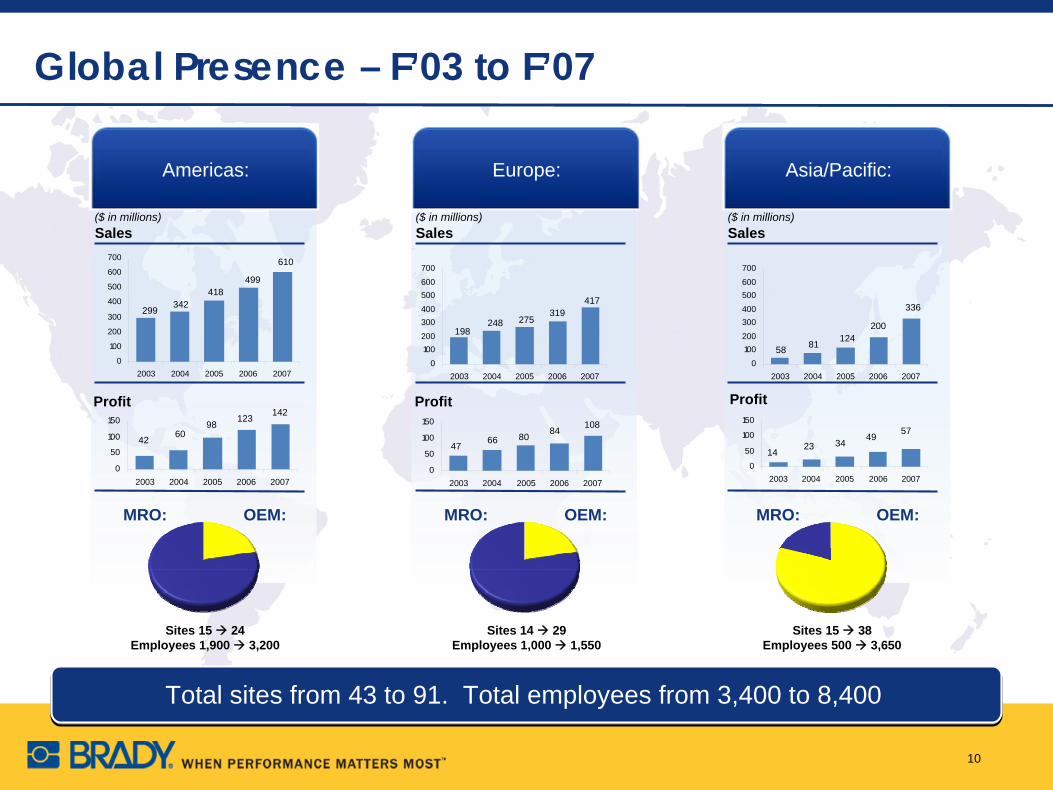
Global Presence – F’03 to F’07
Total sites from 43 to 91. Total employees from 3,400 to 8,400
Americas:
Sales($ in millions)
MRO: OEM:
Europe:
Sales($ in millions)
MRO: OEM:
Asia/Pacific:
Sales($ in millions)
MRO: OEM:
Sites 15 24Employees 1,900 3,200
Sites 14 29Employees 1,000 1,550
Sites 15 38Employees 500 3,650
10
0
100
200
300
400
500
600
700
2003 2004 2005 2006 2007
299 342418
499
610
0100200
300400500600
700
2003 2004 2005 2006 2007
198248 275
319417
0100200
300400500600
700
2003 2004 2005 2006 2007
58 81 124200
336
0
50
100
150
2003 2004 2005 2006 2007
Profit
1423 34
49 57
0
50
100
150
2003 2004 2005 2006 2007
Profit
47 66 80 84 108
0
50
100
150
2003 2004 2005 2006 2007
Profit
42 6098
123 142
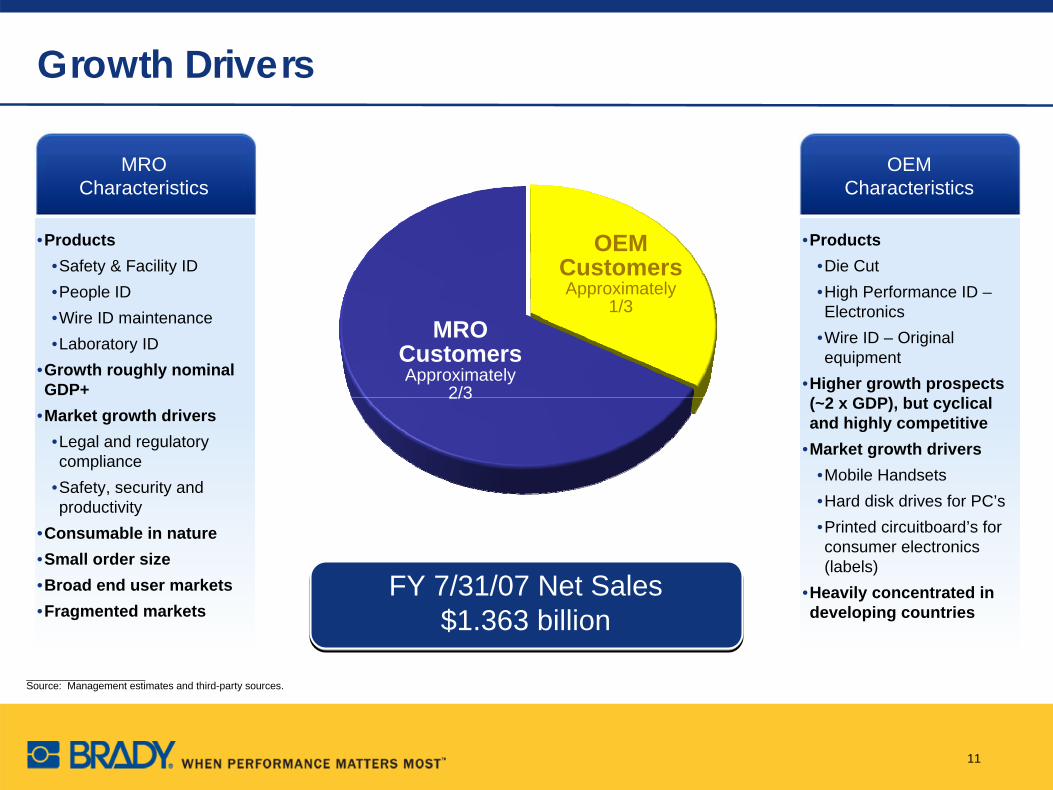
Growth Drivers
OEM Customers Approximately
1/3MRO
Customers Approximately
2/3
_____________________Source: Management estimates and third-party sources.
•Products•Safety & Facility ID•People ID•Wire ID maintenance•Laboratory ID
•Growth roughly nominal GDP+
•Market growth drivers•Legal and regulatory compliance
•Safety, security and productivity
•Consumable in nature•Small order size•Broad end user markets•Fragmented markets
MRO Characteristics
•Products•Die Cut•High Performance ID – Electronics
•Wire ID – Original equipment
•Higher growth prospects (~2 x GDP), but cyclical and highly competitive
•Market growth drivers•Mobile Handsets•Hard disk drives for PC’s•Printed circuitboard’s for consumer electronics (labels)
•Heavily concentrated in developing countries
OEMCharacteristics
FY 7/31/07 Net Sales $1.363 billion
11
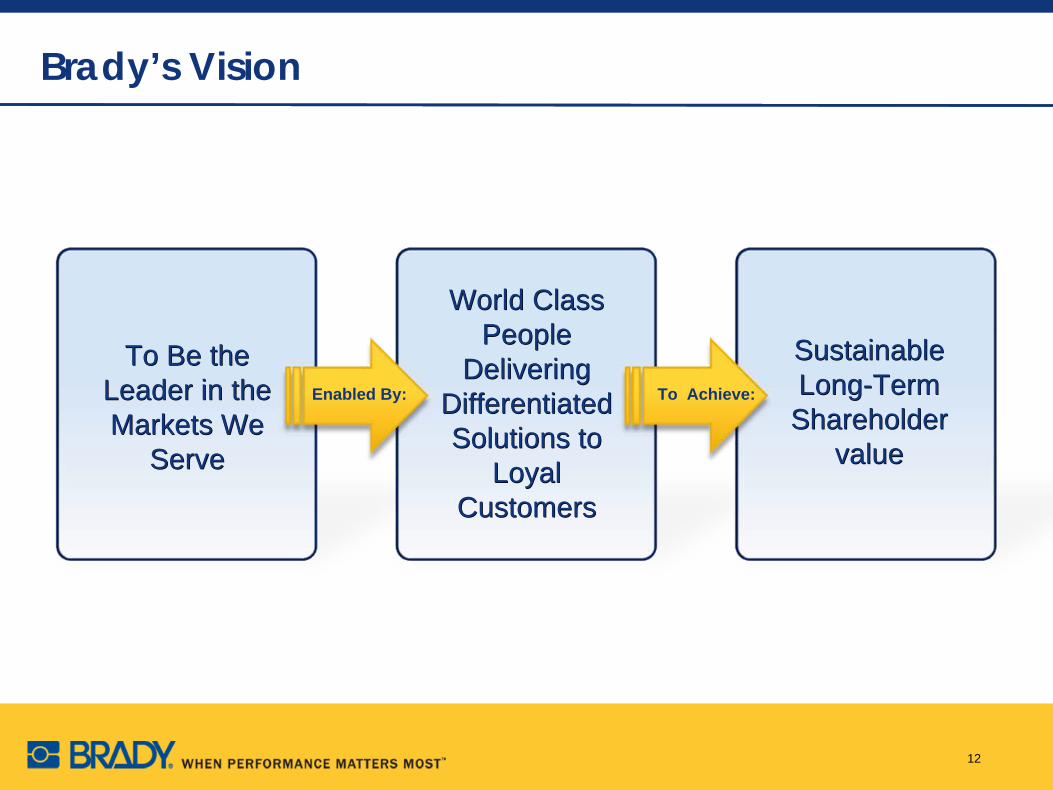
Brady’s Vision
Enabled By: To Achieve:
To Be the Leader in the Markets We
Serve
To Be the Leader in the Markets We
Serve
World Class People
Delivering Differentiated Solutions to
Loyal Customers
World Class People
Delivering Differentiated Solutions to
Loyal Customers
Sustainable Long-Term
Shareholder value
Sustainable Long-Term
Shareholder value
12
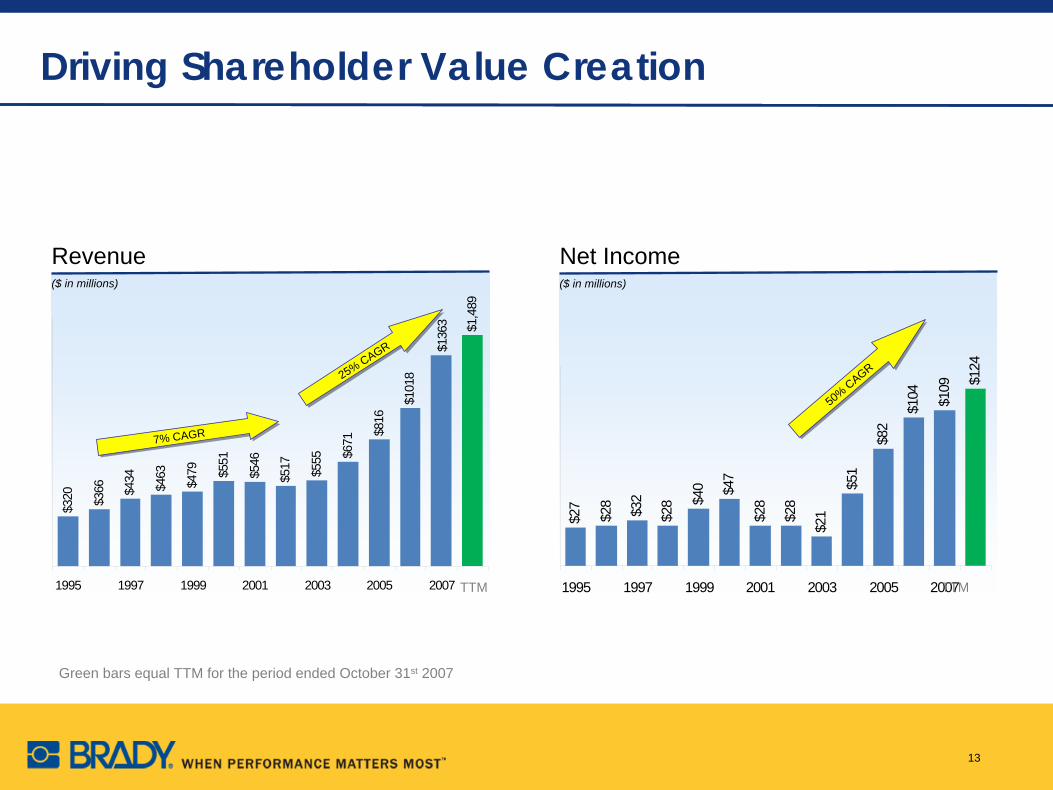
Driving Shareholder Value Creation$3
20 $366 $4
34
$463
$479 $5
51
$546
$517 $555 $6
71
$816
$1,4
89
$101
8
$136
3
1995 1997 1999 2001 2003 2005 2007
Revenue($ in millions)
Net Income($ in millions)
$27
$28 $32
$28 $4
0 $47
$28
$28
$21
$51
$82
$124
$104 $109
1995 1997 1999 2001 2003 2005 2007
13
7% CAGR7% CAGR
25% CAGR
25% CAGR
50% CAGR
50% CAGR
Green bars equal TTM for the period ended October 31st 2007
TTM TTM
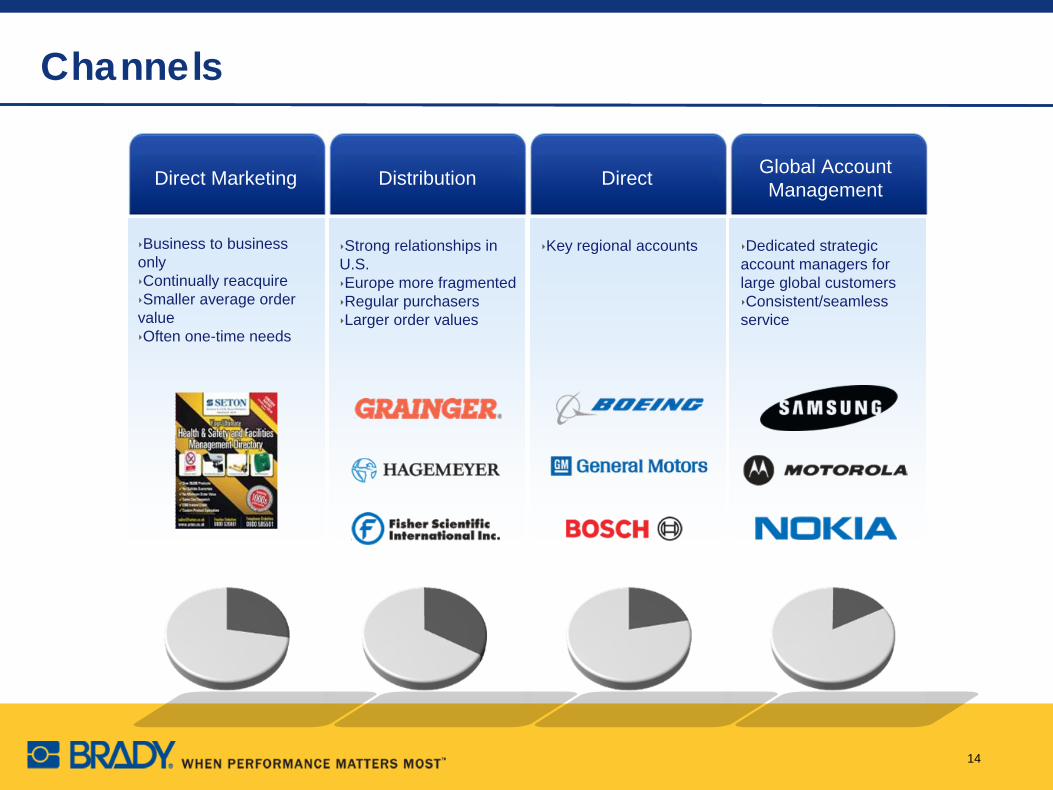
Direct Marketing
‣Business to business only‣Continually reacquire‣Smaller average order value‣Often one-time needs
Distribution
‣Strong relationships in U.S.‣Europe more fragmented‣Regular purchasers‣Larger order values
Direct
‣Key regional accounts
Global Account Management
‣Dedicated strategic account managers for large global customers‣Consistent/seamless service
Channels
14
Shareholder Value Creation
15

Leadership Position in
Niche Markets
Leadership Position in
Niche Markets
How We Drive Shareholder Value
Differentiated Solutions &
Commitment to Innovation
Differentiated Solutions &
Commitment to Innovation
Geographic, Customer &
Channel Diversity
Geographic, Customer &
Channel Diversity
OperationalExcellenceOperationalExcellence
World Class PeopleWorld Class People
Disciplined Acquisition &
Integration Strategy
Disciplined Acquisition &
Integration Strategy
FOCUSDISCIPLINE
16
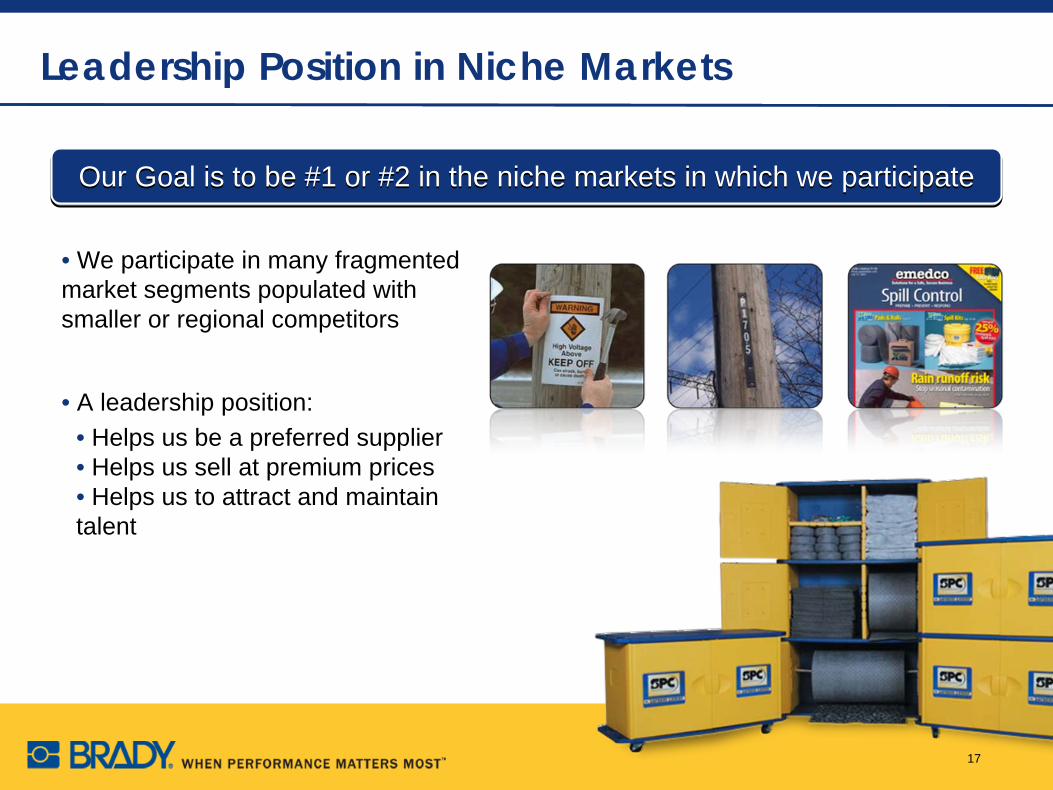
Leadership Position in Niche Markets
• We participate in many fragmented market segments populated with smaller or regional competitors
• A leadership position:• Helps us be a preferred supplier• Helps us sell at premium prices• Helps us to attract and maintain talent
Our Goal is to be #1 or #2 in the niche markets in which we participateOur Goal is to be #1 or #2 in the niche markets in which we participate
17
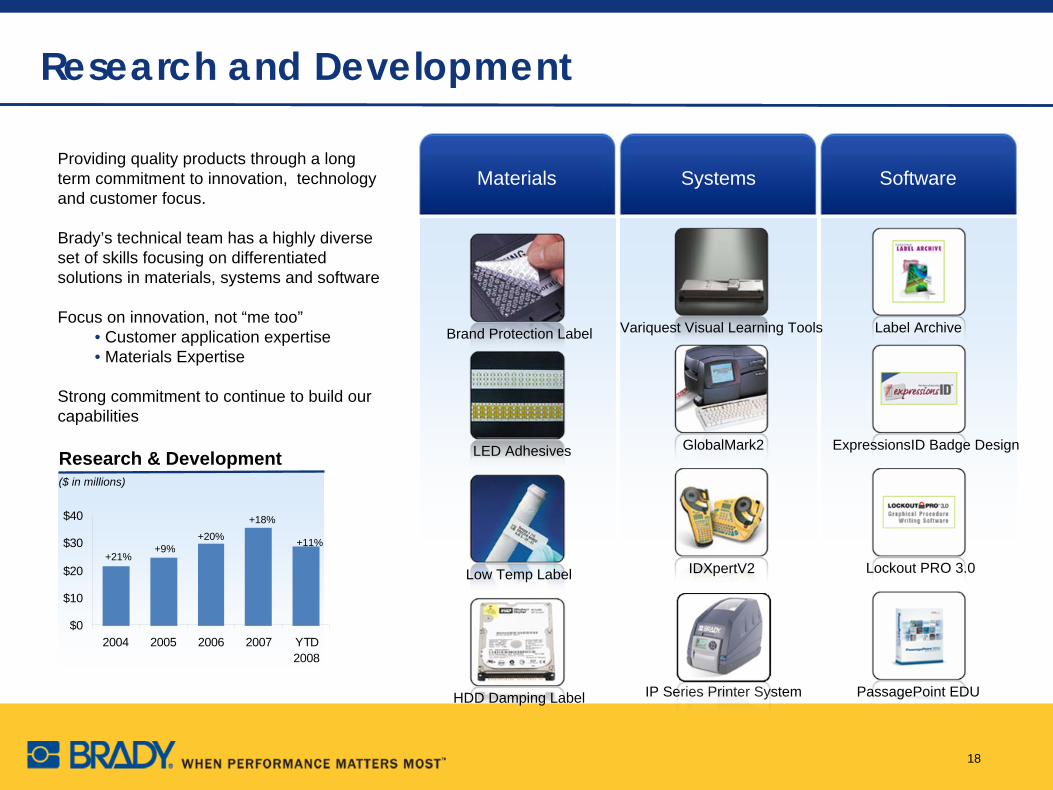
Materials Systems Software
Research and Development
Providing quality products through a long term commitment to innovation, technology and customer focus.
Brady’s technical team has a highly diverse set of skills focusing on differentiated solutions in materials, systems and software
Focus on innovation, not “me too”• Customer application expertise• Materials Expertise
Strong commitment to continue to build our capabilities
Research & Development($ in millions)
GlobalMark2
IDXpertV2
Variquest Visual Learning ToolsBrand Protection Label
LED Adhesives
Low Temp Label
HDD Damping Label
Label Archive
ExpressionsID Badge Design
Lockout PRO 3.0
PassagePoint EDU
18
$0
$10
$20
$30
$40
2004 2005 2006 2007 YTD2008
+21%+9%
+20%+18%
IP Series Printer System
+11%
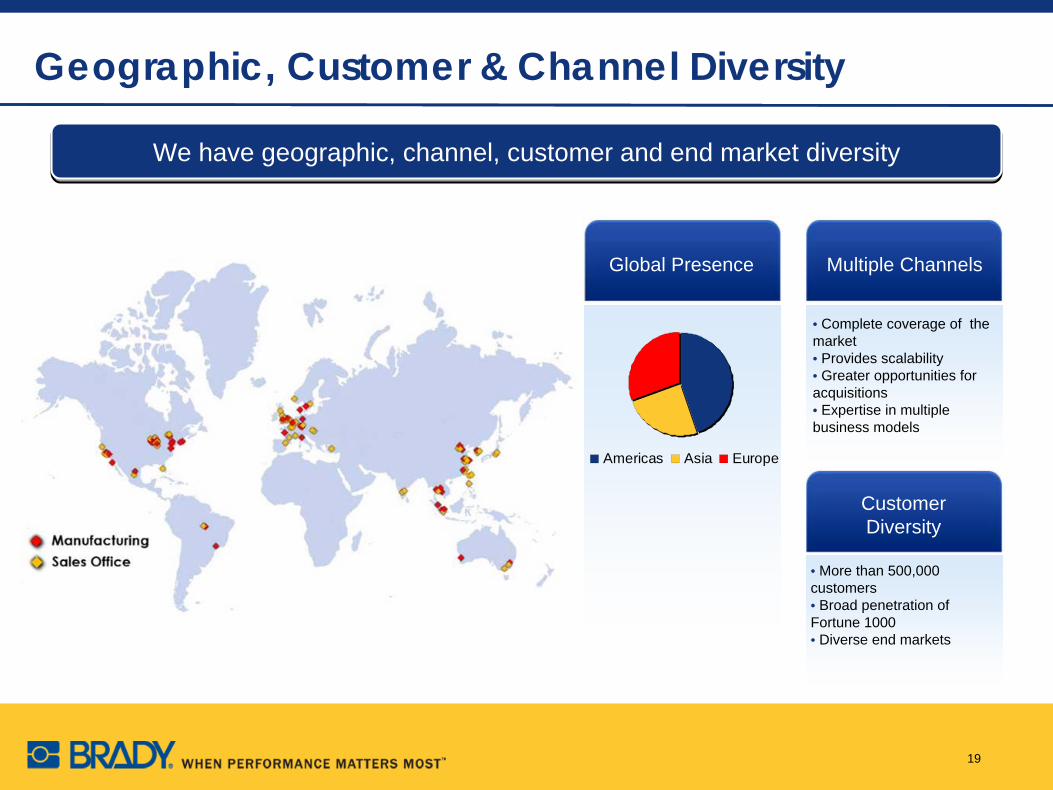
Geographic, Customer & Channel Diversity
Multiple Channels
• Complete coverage of the market• Provides scalability• Greater opportunities for acquisitions• Expertise in multiple business models
Global Presence
• More than 500,000 customers• Broad penetration of Fortune 1000• Diverse end markets
Customer Diversity
Americas Asia Europe
We have geographic, channel, customer and end market diversity
19
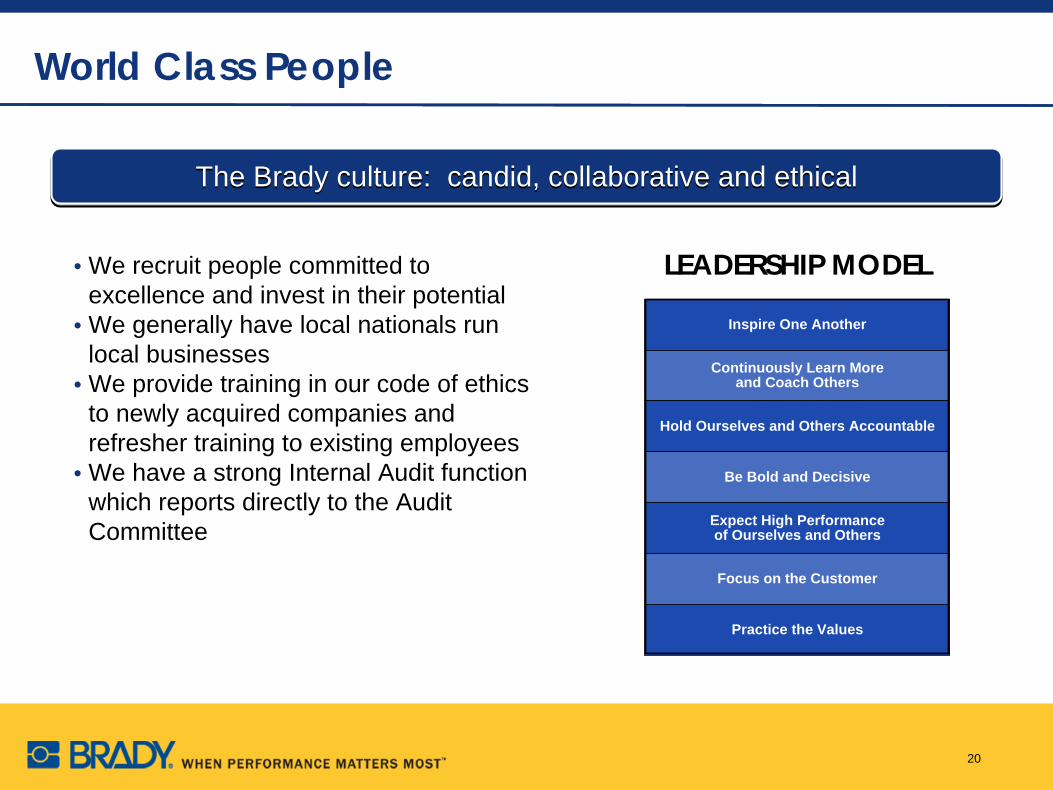
World Class People
• We recruit people committed to excellence and invest in their potential
• We generally have local nationals run local businesses
• We provide training in our code of ethics to newly acquired companies and refresher training to existing employees
• We have a strong Internal Audit function which reports directly to the Audit Committee
LEADERSHIP MODEL
Inspire One Another
Continuously Learn More and Coach Others
Hold Ourselves and Others Accountable
Be Bold and Decisive
Expect High Performance of Ourselves and Others
Focus on the Customer
Practice the Values
The Brady culture: candid, collaborative and ethicalThe Brady culture: candid, collaborative and ethical
20
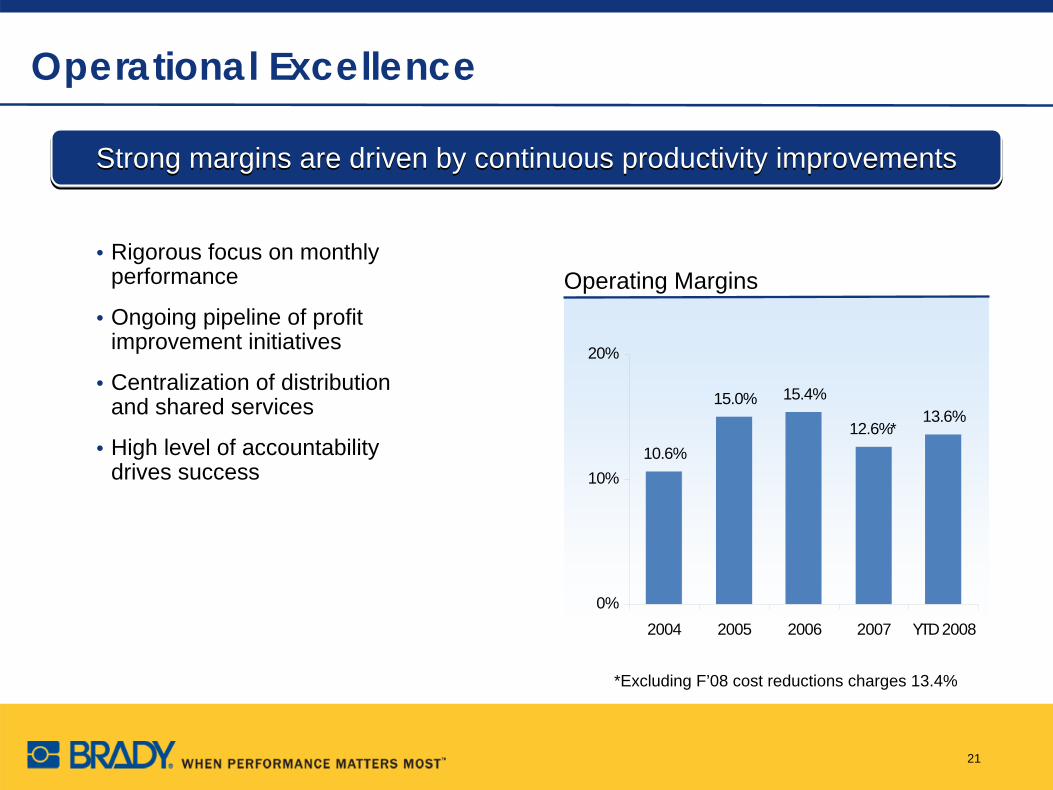
Operational Excellence
• Rigorous focus on monthly performance
• Ongoing pipeline of profit improvement initiatives
• Centralization of distribution and shared services
• High level of accountability drives success
10.6%
15.0% 15.4%
12.6%*13.6%
0%
10%
20%
2004 2005 2006 2007 YTD 2008
Strong margins are driven by continuous productivity improvementsStrong margins are driven by continuous productivity improvements
Operating Margins
21
*Excluding F’08 cost reductions charges 13.4%
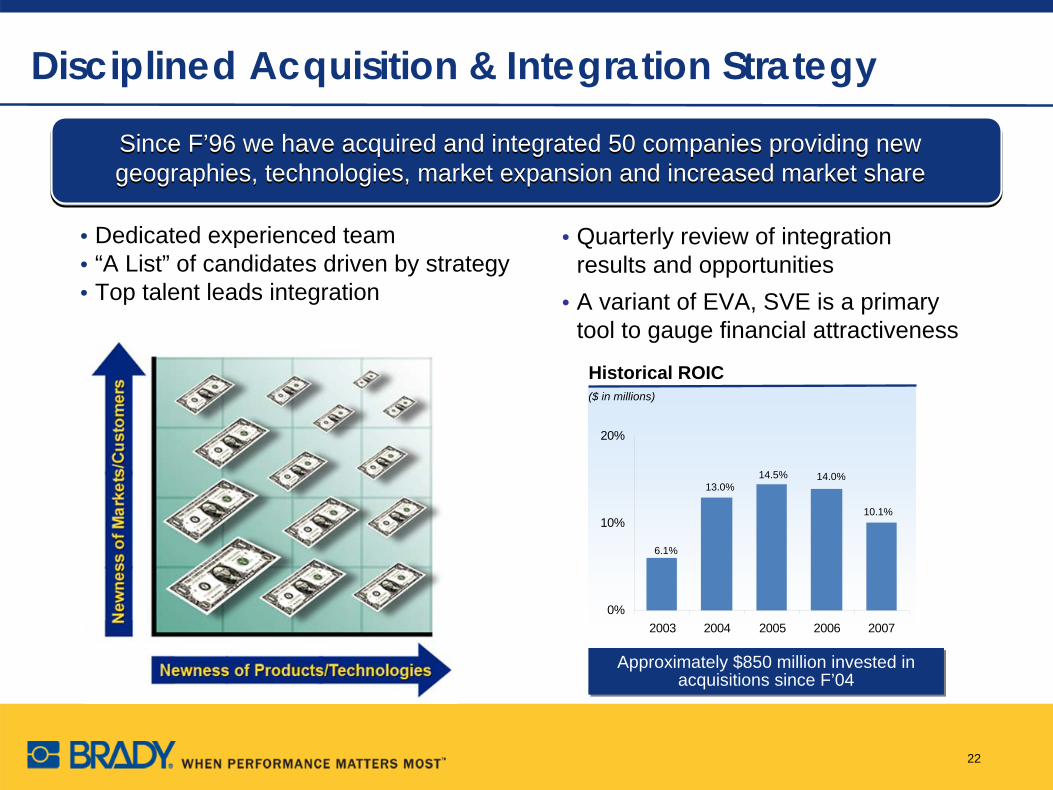
Disciplined Acquisition & Integration Strategy
• Dedicated experienced team• “A List” of candidates driven by strategy • Top talent leads integration
• Quarterly review of integration results and opportunities
• A variant of EVA, SVE is a primary tool to gauge financial attractiveness
Approximately $850 million invested in acquisitions since F’04
Approximately $850 million invested in acquisitions since F’04
Since F’96 we have acquired and integrated 50 companies providing new geographies, technologies, market expansion and increased market share Since F’96 we have acquired and integrated 50 companies providing new geographies, technologies, market expansion and increased market share
Historical ROIC($ in millions)
22
0%
10%
20%
2003 2004 2005 2006 2007
13.0%14.5% 14.0%
10.1%
6.1%

Long-term, Sustainable Growth Strategy
23
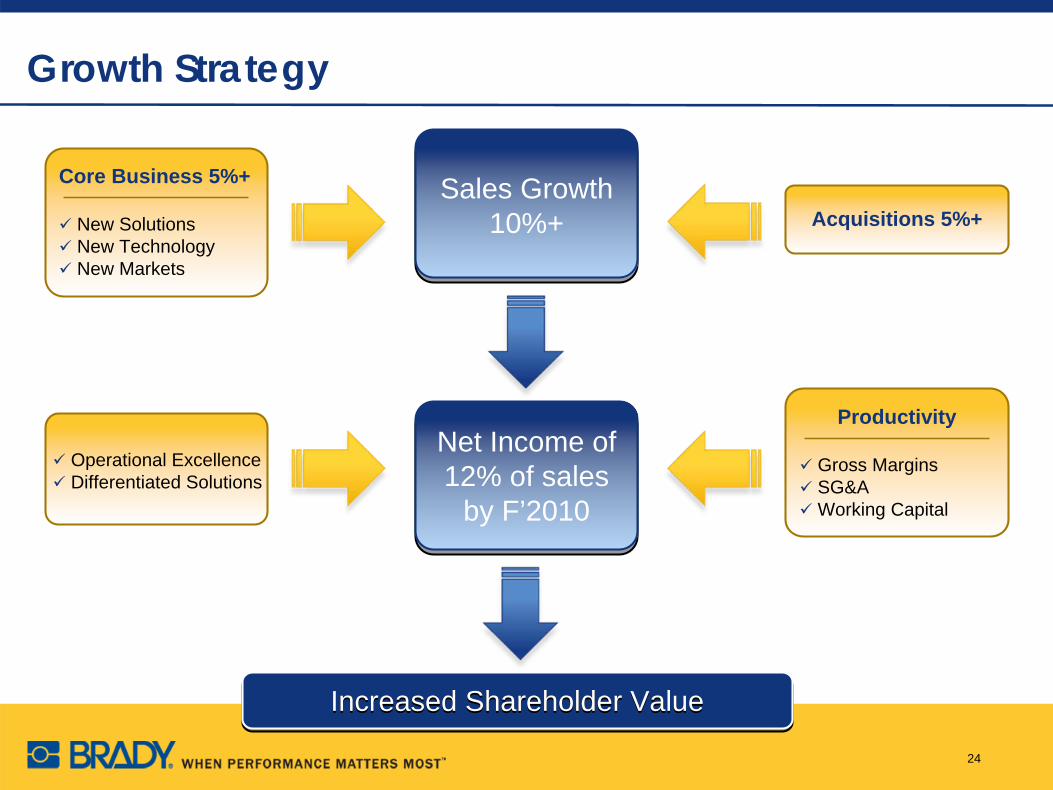
Growth Strategy
Core Business 5%+
New SolutionsNew TechnologyNew Markets
Operational ExcellenceDifferentiated Solutions
Acquisitions 5%+
Productivity
Gross MarginsSG&AWorking Capital
Sales Growth 10%+
Net Income of 12% of sales
by F’2010
Increased Shareholder ValueIncreased Shareholder Value
24
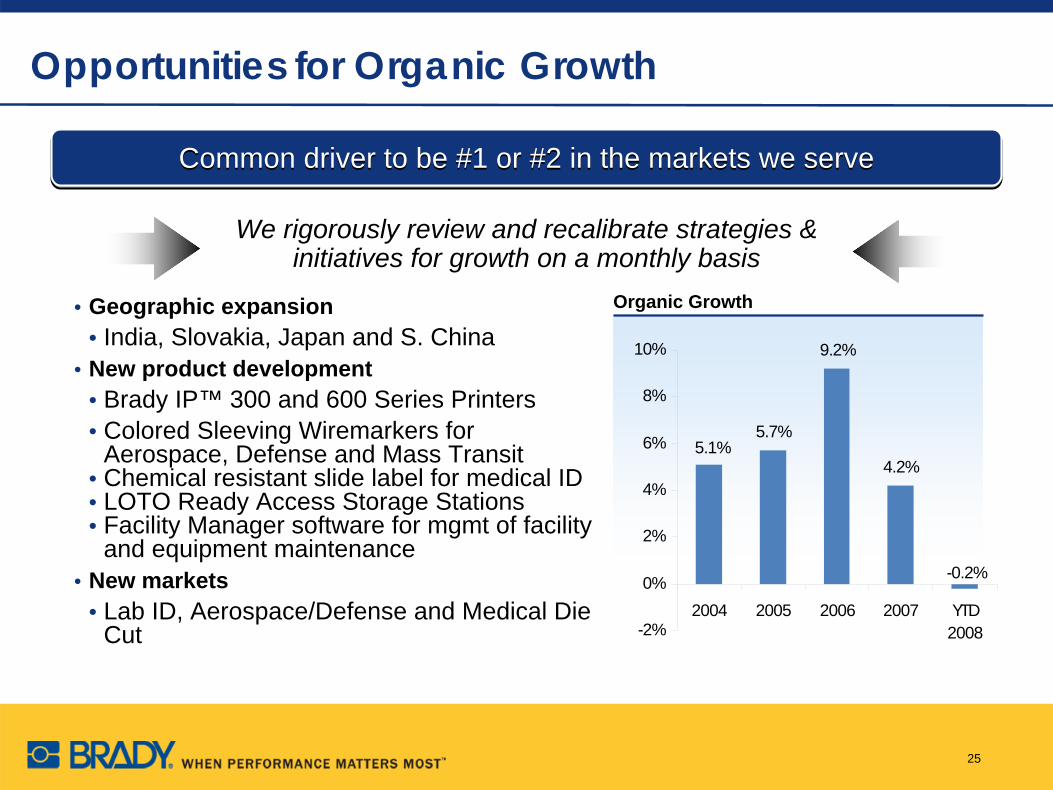
We rigorously review and recalibrate strategies & initiatives for growth on a monthly basis
Common driver to be #1 or #2 in the markets we serveCommon driver to be #1 or #2 in the markets we serve
Organic Growth
5.7%
9.2%
4.2%
-0.2%
5.1%
-2%
0%
2%
4%
6%
8%
10%
2004 2005 2006 2007 YTD2008
Opportunities for Organic Growth
• Geographic expansion• India, Slovakia, Japan and S. China
• New product development• Brady IP™ 300 and 600 Series Printers• Colored Sleeving Wiremarkers for
Aerospace, Defense and Mass Transit • Chemical resistant slide label for medical ID• LOTO Ready Access Storage Stations• Facility Manager software for mgmt of facility
and equipment maintenance• New markets
• Lab ID, Aerospace/Defense and Medical Die Cut
25
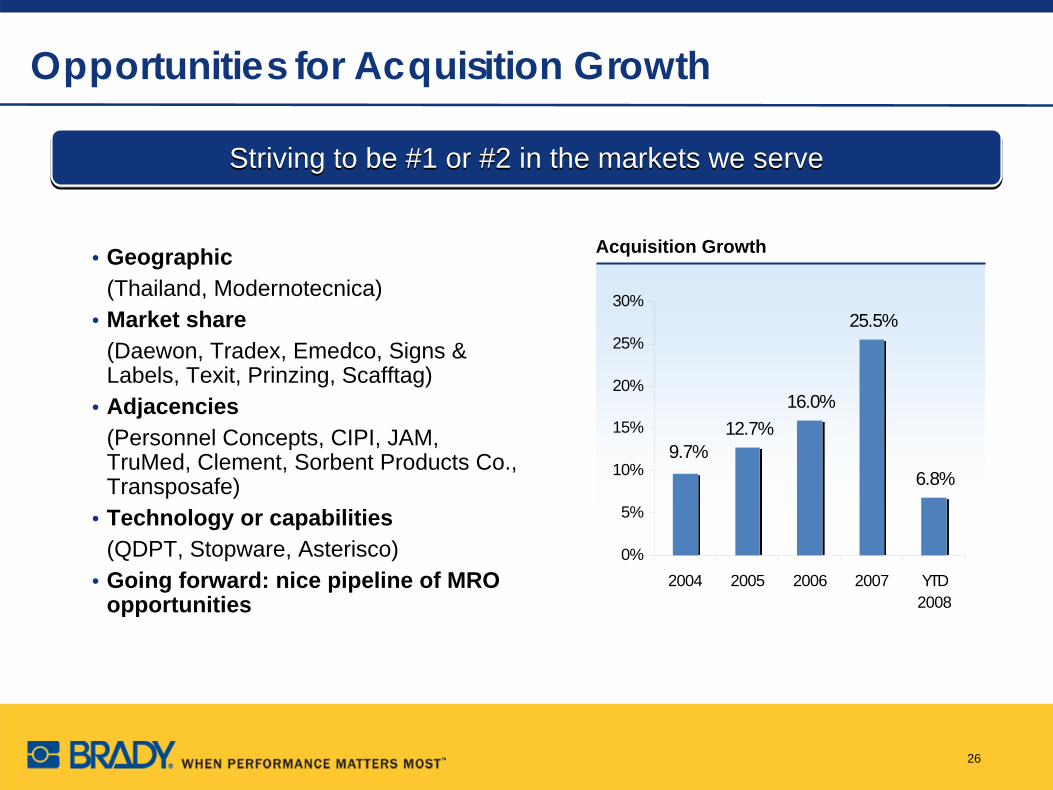
Opportunities for Acquisition Growth
• Geographic(Thailand, Modernotecnica)
• Market share(Daewon, Tradex, Emedco, Signs & Labels, Texit, Prinzing, Scafftag)
• Adjacencies(Personnel Concepts, CIPI, JAM, TruMed, Clement, Sorbent Products Co., Transposafe)
• Technology or capabilities(QDPT, Stopware, Asterisco)
• Going forward: nice pipeline of MRO opportunities
12.7%16.0%
25.5%
6.8%9.7%
0%
5%
10%
15%
20%
25%
30%
2004 2005 2006 2007 YTD2008
Acquisition Growth
Striving to be #1 or #2 in the markets we serveStriving to be #1 or #2 in the markets we serve
26
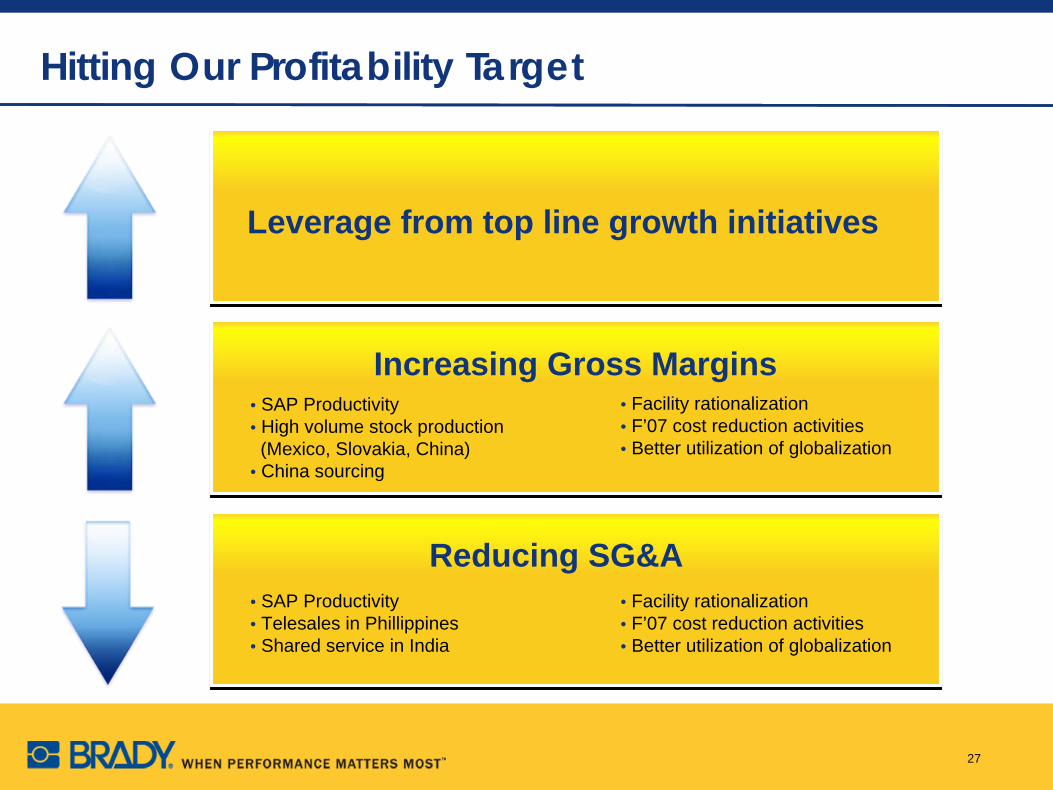
Hitting Our Profitability Target
Leverage from top line growth initiatives
Increasing Gross Margins• Facility rationalization• F’07 cost reduction activities• Better utilization of globalization
• SAP Productivity• High volume stock production (Mexico, Slovakia, China)
• China sourcing
Reducing SG&A• SAP Productivity• Telesales in Phillippines• Shared service in India
• Facility rationalization• F’07 cost reduction activities• Better utilization of globalization
27
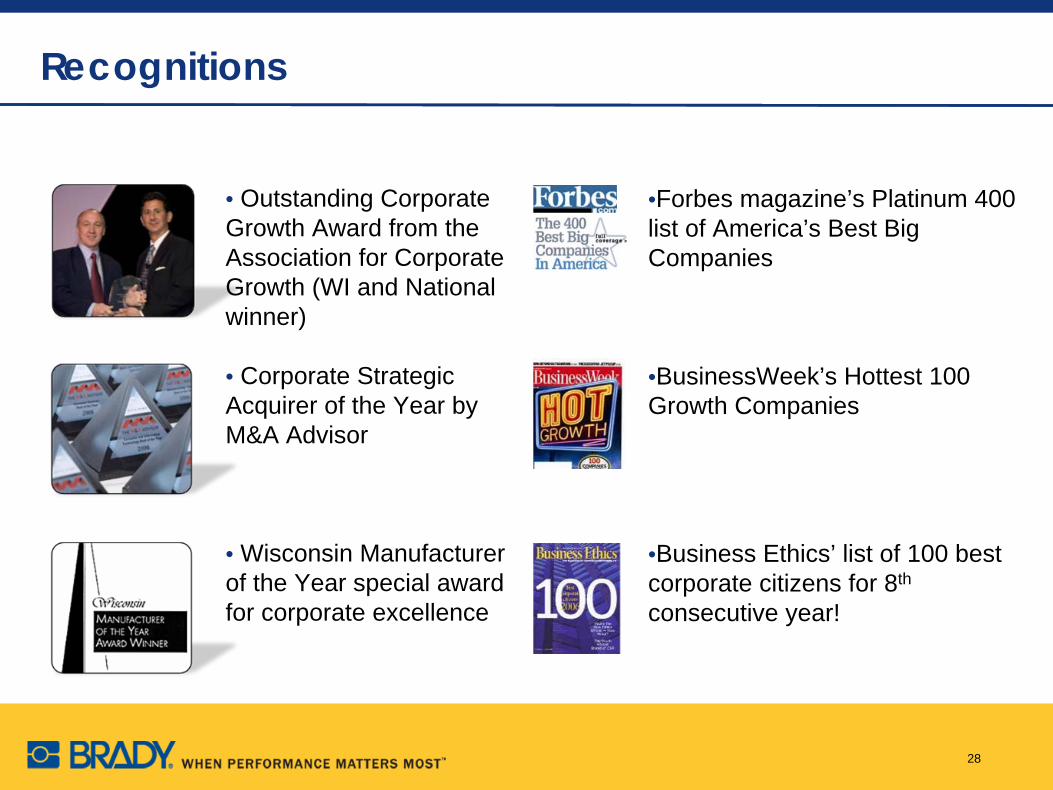
Recognitions
•Forbes magazine’s Platinum 400 list of America’s Best Big Companies
•BusinessWeek’s Hottest 100 Growth Companies
•Business Ethics’ list of 100 best corporate citizens for 8th
consecutive year!
• Outstanding Corporate Growth Award from the Association for Corporate Growth (WI and National winner)
• Corporate Strategic Acquirer of the Year by M&A Advisor
• Wisconsin Manufacturer of the Year special award for corporate excellence
28
Financial Overview
29
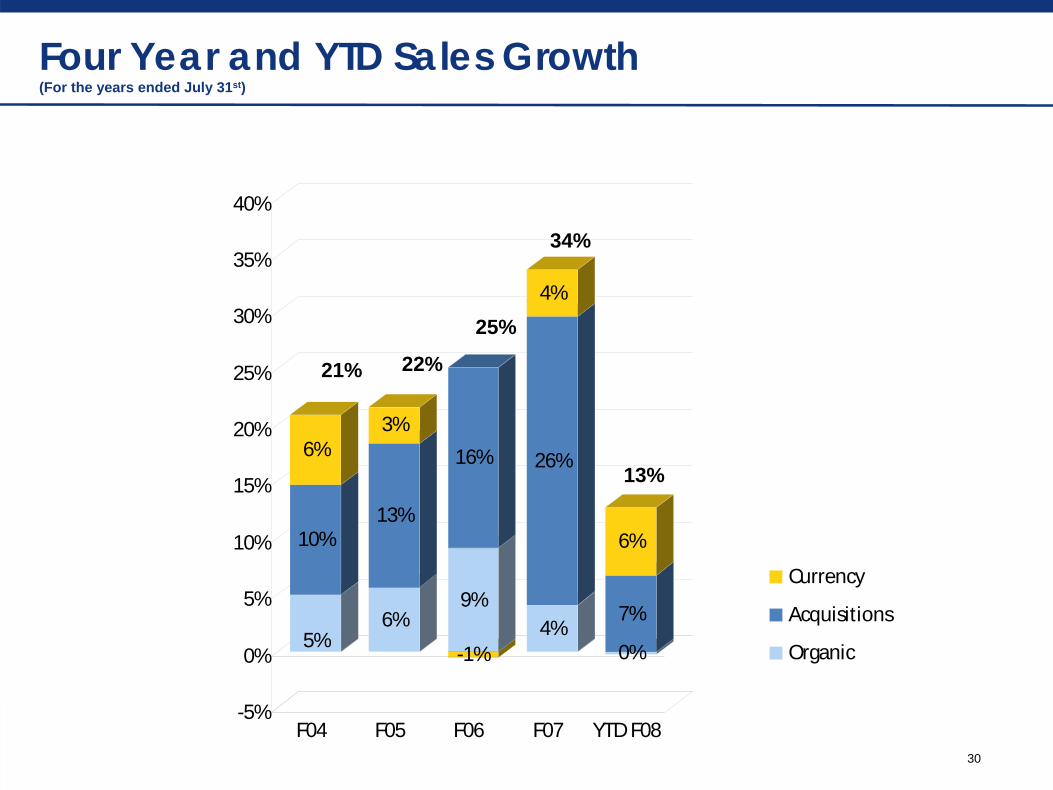
5%
10%
6%
6%
13%
3%
9%
16%
-1%4%
26%
4%
0%
7%
6%
-5%
0%
5%
10%
15%
20%
25%
30%
35%
40%
F04 F05 F06 F07 YTD F08
Currency
Acquisitions
Organic
Four Year and YTD Sales Growth (For the years ended July 31st)
13%
21% 22%
25%
34%
30
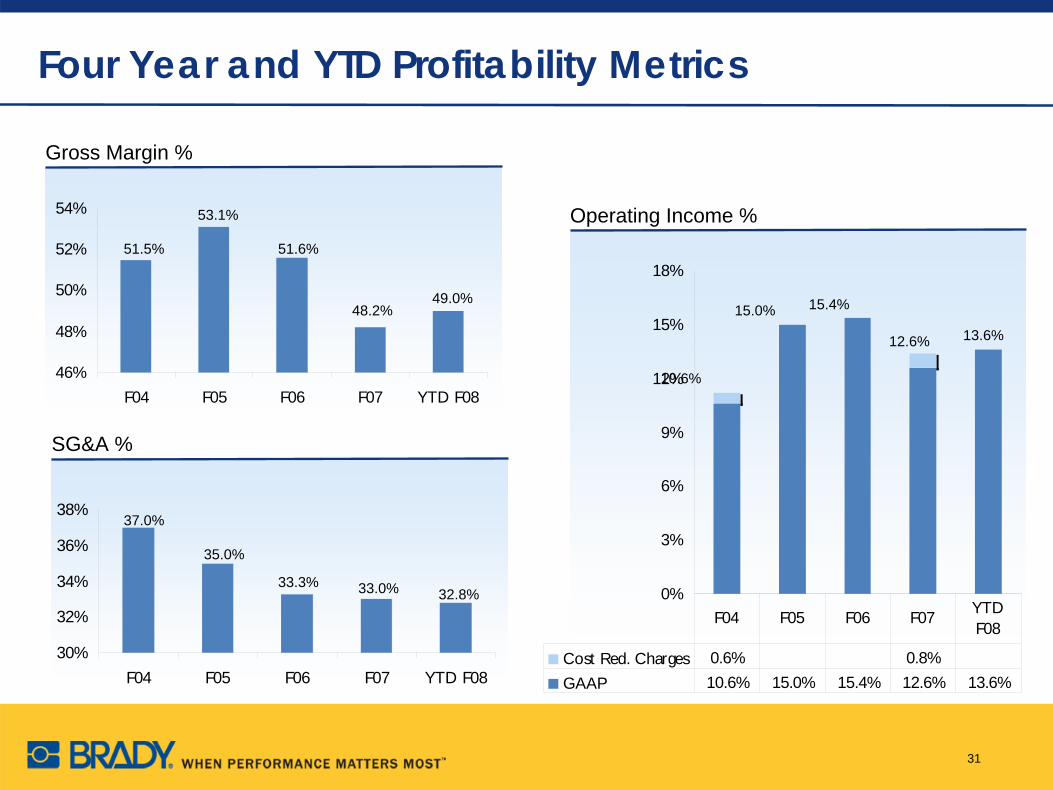
SG&A %
30%
32%
34%
36%
38%
F04 F05 F06 F07 YTD F08
Operating Income %
Gross Margin %
Four Year and YTD Profitability Metrics
46%
48%
50%
52%
54%
F04 F05 F06 F07 YTD F08
0%
3%
6%
9%
12%
15%
18%
Cost Red. Charges 0.6% 0.8%GAAP 10.6% 15.0% 15.4% 12.6% 13.6%
F04 F05 F06 F07 YTD F08
48.2%
51.5%
53.1%
32.8%
37.0%
35.0%
13.6%
10.6%
15.0%
51.6%
33.3%
15.4%49.0%
33.0%
12.6%
31
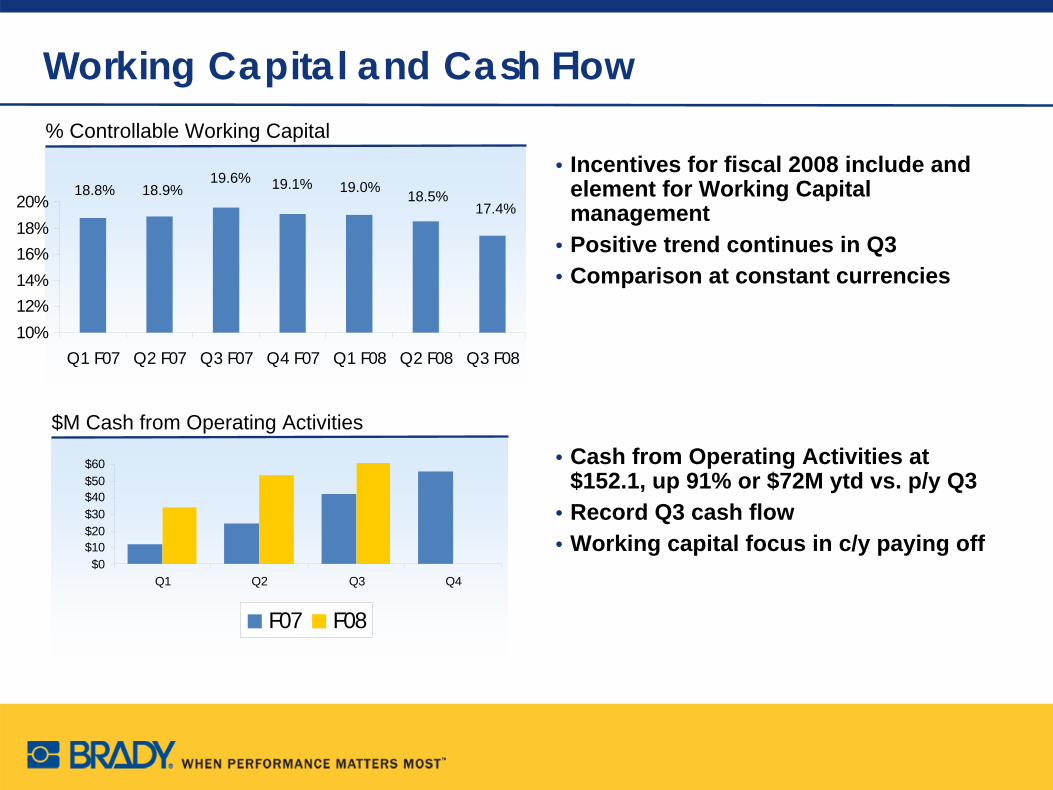
Working Capital and Cash Flow
$M Cash from Operating Activities
% Controllable Working Capital
10%12%14%16%18%20%
Q1 F07 Q2 F07 Q3 F07 Q4 F07 Q1 F08 Q2 F08 Q3 F08
19.1%18.8% 18.9%19.6% 19.0%
• Incentives for fiscal 2008 include and element for Working Capital management
• Positive trend continues in Q3• Comparison at constant currencies
• Cash from Operating Activities at $152.1, up 91% or $72M ytd vs. p/y Q3
• Record Q3 cash flow• Working capital focus in c/y paying off
$0$10$20$30$40$50$60
Q1 Q2 Q3 Q4
F07 F08
18.5%17.4%
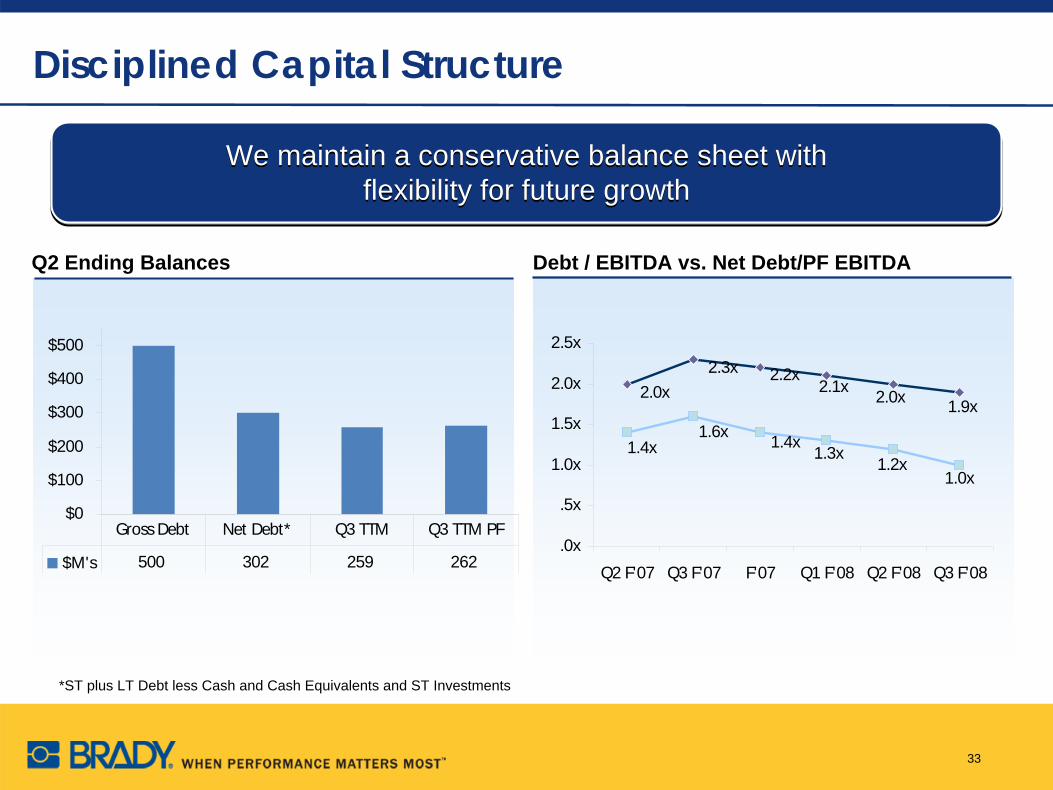
Disciplined Capital Structure
Debt / EBITDA vs. Net Debt/PF EBITDAQ2 Ending Balances
We maintain a conservative balance sheet with flexibility for future growth
We maintain a conservative balance sheet with flexibility for future growth
33
*ST plus LT Debt less Cash and Cash Equivalents and ST Investments
$0
$100
$200
$300
$400
$500
$M's 500 302 259 262
Gross Debt Net Debt* Q3 TTM Q3 TTM PF
1.9x2.0x2.1x2.0x2.3x 2.2x
1.0x1.2x
1.3x1.4x1.6x 1.4x
.0x
.5x
1.0x
1.5x
2.0x
2.5x
Q2 F'07 Q3 F'07 F'07 Q1 F'08 Q2 F'08 Q3 F'08

Q4 Outlook and Fiscal 2008 priorities
Q4 Outlook and PrioritiesContinue to be cautious about economy and currencyContinued focus on cost structure, profitability and working capital managementOrganic growth
Continue investment and improvements in new product development
Acquisition growthSubstantively complete with integrationsExecute our current pipeline
Continue roll out of SAP
For More Information
Contact:
Barbara BolensDirector, Investor Relations414-438-6940
And see our Web site at www.investor.bradycorp.com
35
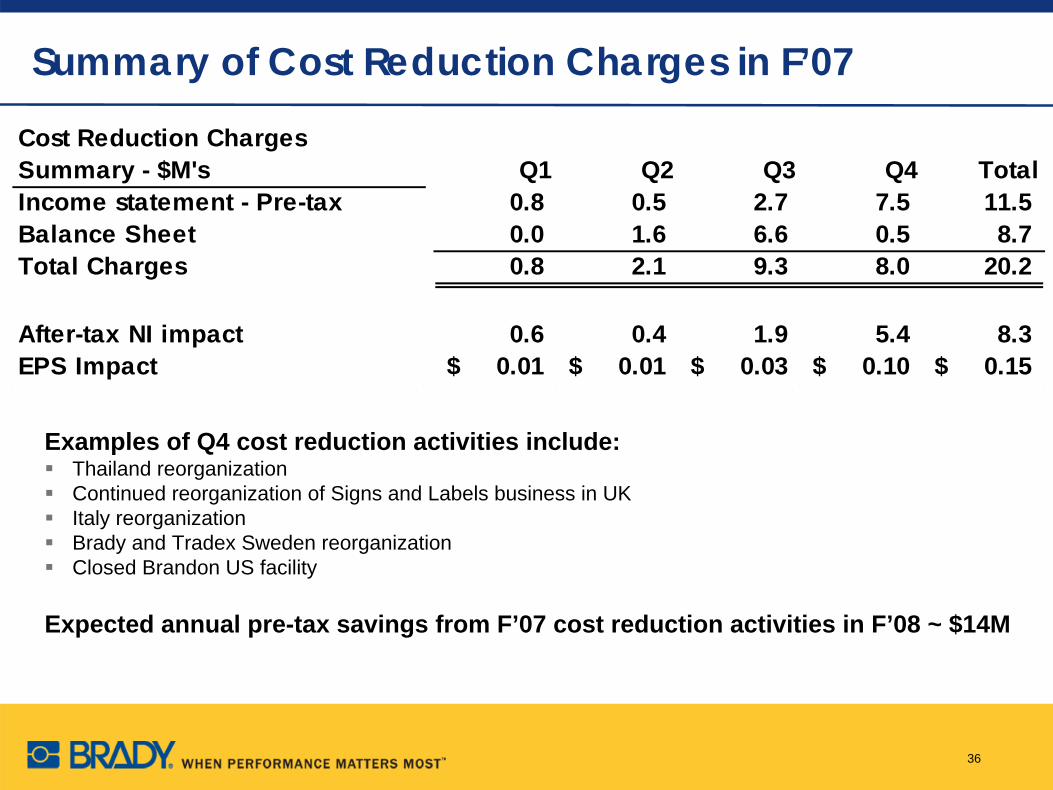
Summary of Cost Reduction Charges in F’07
Cost Reduction Charges Summary - $M's Q1 Q2 Q3 Q4 TotalIncome statement - Pre-tax 0.8 0.5 2.7 7.5 11.5Balance Sheet 0.0 1.6 6.6 0.5 8.7Total Charges 0.8 2.1 9.3 8.0 20.2
After-tax NI impact 0.6 0.4 1.9 5.4 8.3EPS Impact 0.01$ 0.01$ 0.03$ 0.10$ 0.15$
Examples of Q4 cost reduction activities include:Thailand reorganizationContinued reorganization of Signs and Labels business in UKItaly reorganizationBrady and Tradex Sweden reorganizationClosed Brandon US facility
Expected annual pre-tax savings from F’07 cost reduction activities in F’08 ~ $14M
36
Reconciliations
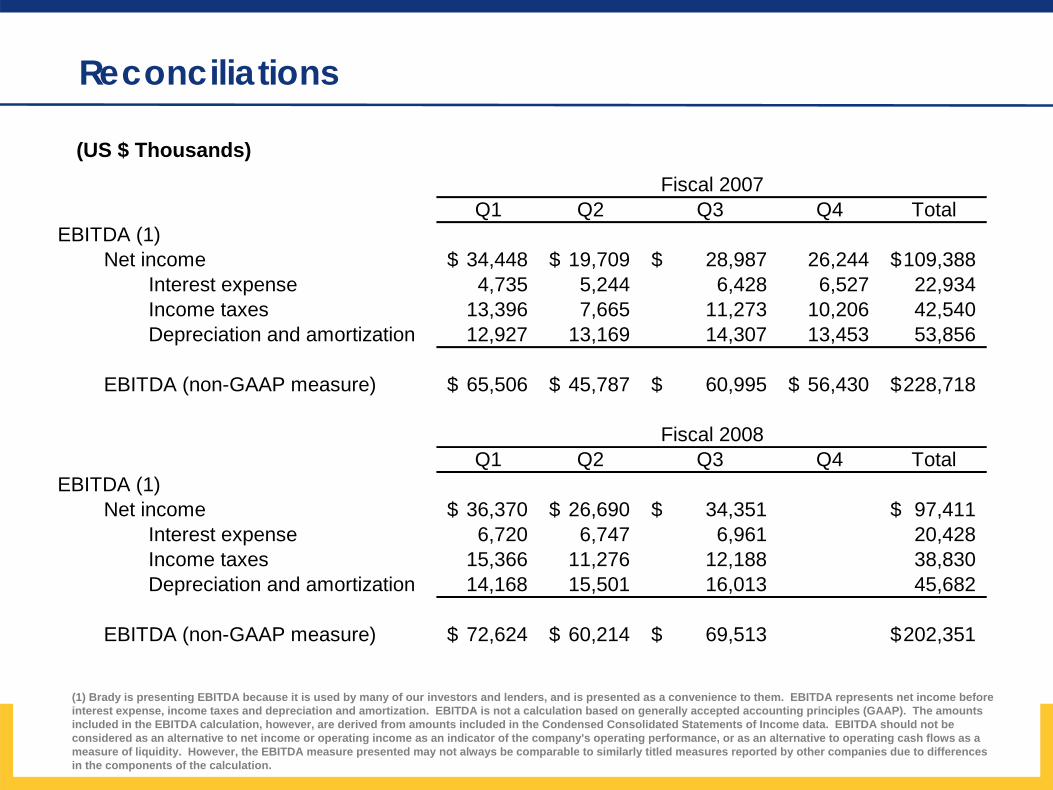
(1) Brady is presenting EBITDA because it is used by many of our investors and lenders, and is presented as a convenience to them. EBITDA represents net income before interest expense, income taxes and depreciation and amortization. EBITDA is not a calculation based on generally accepted accounting principles (GAAP). The amounts included in the EBITDA calculation, however, are derived from amounts included in the Condensed Consolidated Statements of Income data. EBITDA should not be considered as an alternative to net income or operating income as an indicator of the company's operating performance, or as an alternative to operating cash flows as a measure of liquidity. However, the EBITDA measure presented may not always be comparable to similarly titled measures reported by other companies due to differences in the components of the calculation.
(US $ Thousands)
Q1 Q2 Q3 Q4 TotalEBITDA (1)
Net income 34,448$ 19,709$ 28,987$ 26,244 109,388$ Interest expense 4,735 5,244 6,428 6,527 22,934 Income taxes 13,396 7,665 11,273 10,206 42,540 Depreciation and amortization 12,927 13,169 14,307 13,453 53,856
EBITDA (non-GAAP measure) 65,506$ 45,787$ 60,995$ 56,430$ 228,718$
Q1 Q2 Q3 Q4 TotalEBITDA (1)
Net income 36,370$ 26,690$ 34,351$ 97,411$ Interest expense 6,720 6,747 6,961 20,428 Income taxes 15,366 11,276 12,188 38,830 Depreciation and amortization 14,168 15,501 16,013 45,682
EBITDA (non-GAAP measure) 72,624$ 60,214$ 69,513$ 202,351$
Fiscal 2008
Fiscal 2007
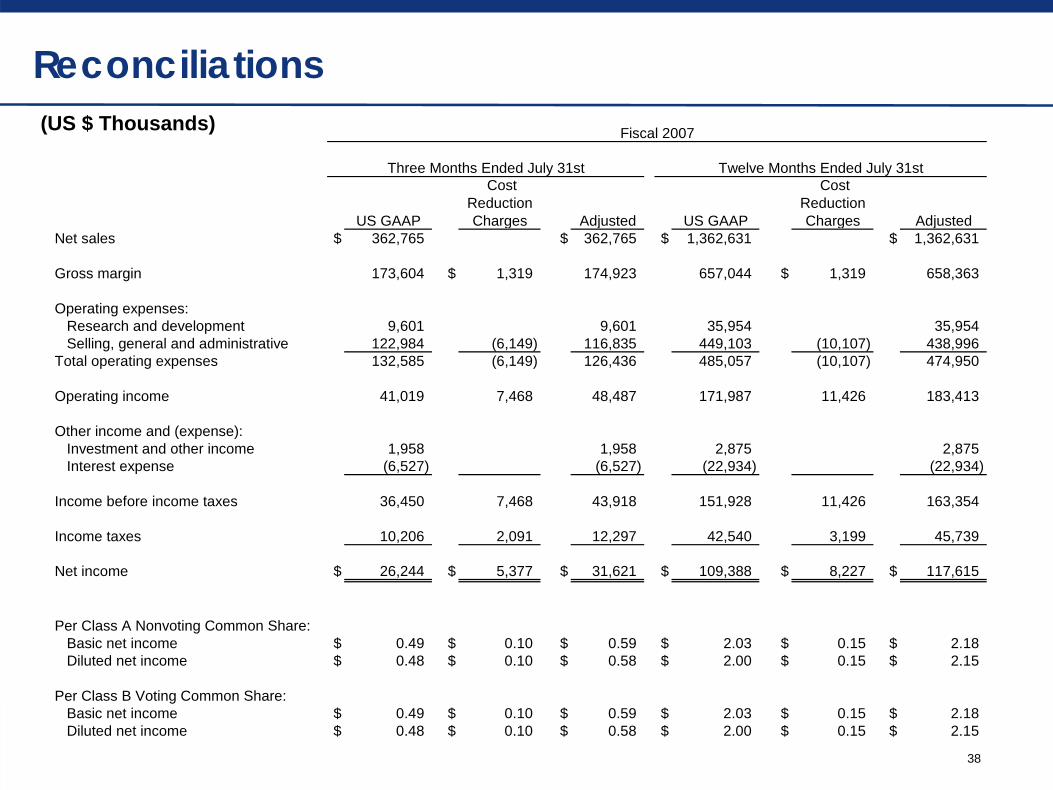
Reconciliations(US $ Thousands)
38
Fiscal 2007
US GAAP
Cost Reduction Charges Adjusted US GAAP
Cost Reduction Charges Adjusted
Net sales $ 362,765 $ 362,765 $ 1,362,631 $ 1,362,631
Gross margin 173,604 $ 1,319 174,923 657,044 $ 1,319 658,363
Operating expenses: Research and development 9,601 9,601 35,954 35,954 Selling, general and administrative 122,984 (6,149) 116,835 449,103 (10,107) 438,996 Total operating expenses 132,585 (6,149) 126,436 485,057 (10,107) 474,950
Operating income 41,019 7,468 48,487 171,987 11,426 183,413
Other income and (expense): Investment and other income 1,958 1,958 2,875 2,875 Interest expense (6,527) (6,527) (22,934) (22,934)
Income before income taxes 36,450 7,468 43,918 151,928 11,426 163,354
Income taxes 10,206 2,091 12,297 42,540 3,199 45,739
Net income $ 26,244 $ 5,377 $ 31,621 $ 109,388 $ 8,227 $ 117,615
Per Class A Nonvoting Common Share: Basic net income $ 0.49 $ 0.10 $ 0.59 $ 2.03 $ 0.15 $ 2.18 Diluted net income $ 0.48 $ 0.10 $ 0.58 $ 2.00 $ 0.15 $ 2.15
Per Class B Voting Common Share: Basic net income $ 0.49 $ 0.10 $ 0.59 $ 2.03 $ 0.15 $ 2.18 Diluted net income $ 0.48 $ 0.10 $ 0.58 $ 2.00 $ 0.15 $ 2.15
Three Months Ended July 31st Twelve Months Ended July 31st