Embed Size (px)
Citation preview

ADVANCED GCE
MATHEMATICS (MEI) 4767Statistics 2
QUESTION PAPER
Candidates answer on the printed answer book.
OCR supplied materials:
• Printed answer book 4767• MEI Examination Formulae and Tables (MF2)
Other materials required:
• Scientific or graphical calculator
Wednesday 22 June 2011
Morning
Duration: 1 hour 30 minutes
INSTRUCTIONS TO CANDIDATES
These instructions are the same on the printed answer book and the question paper.
• The question paper will be found in the centre of the printed answer book.
• Write your name, centre number and candidate number in the spaces provided on the printedanswer book. Please write clearly and in capital letters.
• Write your answer to each question in the space provided in the printed answer book.Additional paper may be used if necessary but you must clearly show your candidate number,
centre number and question number(s).
• Use black ink. Pencil may be used for graphs and diagrams only.• Read each question carefully. Make sure you know what you have to do before starting your
answer.
• Answer all the questions.• Do not write in the bar codes.
• You are permitted to use a scientific or graphical calculator in this paper.• Final answers should be given to a degree of accuracy appropriate to the context.
INFORMATION FOR CANDIDATES
This information is the same on the printed answer book and the question paper.
• The number of marks is given in brackets [ ] at the end of each question or part question on the
question paper.• You are advised that an answer may receive no marks unless you show sufficient detail of the
working to indicate that a correct method is being used.
• The total number of marks for this paper is 72.• The printed answer book consists of 12 pages. The question paper consists of 4 pages. Any blank
pages are indicated.
INSTRUCTION TO EXAMS OFFICER / INVIGILATOR
• Do not send this question paper for marking; it should be retained in the centre or destroyed.
© OCR 2011 [L/102/2657] OCR is an exempt Charity
2R–0I23 Turn over

2
1 An experiment is performed to determine the response of maize to nitrogen fertilizer. Data for the
amount of nitrogen fertilizer applied, x kg/hectare, and the average yield of maize, y tonnes/hectare,
in 5 experimental plots are given in the table below.
x 0 30 60 90 120
y 0.5 2.5 4.7 6.2 7.4
(i) Draw a scatter diagram to illustrate these data. [3]
(ii) Calculate the equation of the regression line of y on x. [5]
(iii) Draw your regression line on your scatter diagram and comment briefly on its fit. [3]
(iv) Calculate the value of the residual for the data point where x = 30 and y = 2.5. [3]
(v) Use the equation of the regression line to calculate estimates of average yield with nitrogen
fertilizer applications of
(A) 45 kg/hectare,
(B) 150 kg/hectare. [2]
(vi) In a plot where 150 kg/hectare of nitrogen fertilizer is applied, the average yield of maize is
8.7 tonnes/hectare. Comment on this result. [2]
2 At a drive-through fast food takeaway, cars arrive independently, randomly and at a uniform average
rate. The numbers of cars arriving per minute may be modelled by a Poisson distribution with
mean 0.62.
(i) Briefly explain the meaning of each of the three terms ‘independently’, ‘randomly’ and ‘at a
uniform average rate’, in the context of cars arriving at a fast food takeaway. [3]
(ii) Find the probability of at most 1 car arriving in a period of 1 minute. [3]
(iii) Find the probability of more than 5 cars arriving in a period of 10 minutes. [3]
(iv) State the exact distribution of the number of cars arriving in a period of 1 hour. [2]
(v) Use a suitable approximating distribution to find the probability that at least 40 cars arrive in a
period of 1 hour. [5]
© OCR 2011 4767 Jun11

3
3 The weights of Braeburn apples on display in a supermarket, measured in grams, are Normally
distributed with mean 210.5 and standard deviation 15.2.
(i) Find the probability that a randomly selected apple weighs at least 220 grams. [3]
(ii) These apples are sold in packs of 3. You may assume that the weights of apples in each pack are
independent. Find the probability that all 3 of the apples in a randomly selected pack weigh at
least 220 grams. [2]
(iii) 100 packs are selected at random.
(A) State the exact distribution of the number of these 100 packs in which all 3 apples weigh at
least 220 grams. [2]
(B) Use a suitable approximating distribution to find the probability that in at most one of these
packs all 3 apples weigh at least 220 grams. [5]
(C) Explain why this approximating distribution is suitable. [1]
(iv) The supermarket also sells Cox’s Orange Pippin apples. The weights of these apples, measured
in grams, are Normally distributed with mean 185 and standard deviation σ.
(A) Given that 10% of randomly selected Cox’s Orange Pippin apples weigh less than 170 grams,
calculate the value of σ. [3]
(B) Sketch the distributions of the weights of both types of apple on a single diagram. [4]
[Question 4 is printed overleaf.]
© OCR 2011 4767 Jun11 Turn over

4
4 (a) In a survey on internet usage, a random sample of 200 people is selected. The people are
asked how much they have spent on internet shopping during the last three months. The results,
classified by amount spent and sex, are shown in the table.
SexRow totals
Male Female
Nothing 28 34 62
Less than £50 17 21 38Amount
£50 up to £200 22 26 48spent
£200 up to £1000 23 16 39
£1000 or more 8 5 13
Column totals 98 102 200
(i) Write down null and alternative hypotheses for a test to examine whether there is any
association between amount spent and sex of person. [1]
The contributions to the test statistic for the usual χ2 test are shown in the table below.
Sex
Male Female
Nothing 0.1865 0.1791
Less than £50 0.1409 0.1354Amount
£50 up to £200 0.0982 0.0944spent
£200 up to £1000 0.7918 0.7608
£1000 or more 0.4171 0.4007
The sum of these contributions, correct to 3 decimal places, is 3.205.
(ii) Calculate the expected frequency for females spending nothing. Verify the corresponding
contribution, 0.1791, to the test statistic. [3]
(iii) Carry out the test at the 5% level of significance, stating your conclusion clearly. [5]
(b) A bakery sells loaves specified as having a mean weight of 400 grams. It is known that the
weights of these loaves are Normally distributed and that the standard deviation is 5.7 grams.
An inspector suspects that the true mean weight may be less than 400 grams. In order to test
this, the inspector takes a random sample of 6 loaves. Carry out a suitable test at the 5% level,
given that the weights, in grams, of the 6 loaves are as follows. [9]
392.1 405.8 401.3 387.4 391.8 400.6
Copyright Information
OCR is committed to seeking permission to reproduce all third-party content that it uses in its assessment materials. OCR has attempted to identify and contact all copyright holders
whose work is used in this paper. To avoid the issue of disclosure of answer-related information to candidates, all copyright acknowledgements are reproduced in the OCR Copyright
Acknowledgements Booklet. This is produced for each series of examinations and is freely available to download from our public website (www.ocr.org.uk) after the live examination series.
If OCR has unwittingly failed to correctly acknowledge or clear any third-party content in this assessment material, OCR will be happy to correct its mistake at the earliest possible opportunity.
For queries or further information please contact the Copyright Team, First Floor, 9 Hills Road, Cambridge CB2 1GE.
OCR is part of the Cambridge Assessment Group; Cambridge Assessment is the brand name of University of Cambridge Local Examinations Syndicate (UCLES), which is itself a department
of the University of Cambridge.
© OCR 2011 4767 Jun11

ADVANCED GCE
MATHEMATICS (MEI) 4767Statistics 2
PRINTED ANSWER BOOK
Candidates answer on this printed answer book.
OCR supplied materials:
• Question paper 4767 (inserted)• MEI Examination Formulae and Tables (MF2)
Other materials required:
• Scientific or graphical calculator
Wednesday 22 June 2011
Morning
Duration: 1 hour 30 minutes
**
44
77
66
77
**
Candidateforename
Candidatesurname
Centre number Candidate number
INSTRUCTIONS TO CANDIDATES
These instructions are the same on the printed answer book and the question paper.
• The question paper will be found in the centre of the printed answer book.
• Write your name, centre number and candidate number in the spaces provided on the printedanswer book. Please write clearly and in capital letters.
• Write your answer to each question in the space provided in the printed answer book.Additional paper may be used if necessary but you must clearly show your candidate number,
centre number and question number(s).
• Use black ink. Pencil may be used for graphs and diagrams only.• Read each question carefully. Make sure you know what you have to do before starting your
answer.
• Answer all the questions.• Do not write in the bar codes.
• You are permitted to use a scientific or graphical calculator in this paper.• Final answers should be given to a degree of accuracy appropriate to the context.
INFORMATION FOR CANDIDATES
This information is the same on the printed answer book and the question paper.
• The number of marks is given in brackets [ ] at the end of each question or part question on the
question paper.• You are advised that an answer may receive no marks unless you show sufficient detail of the
working to indicate that a correct method is being used.
• The total number of marks for this paper is 72.• The printed answer book consists of 12 pages. The question paper consists of 4 pages. Any blank
pages are indicated.
© OCR 2011 [L/102/2657] OCR is an exempt Charity
2R–0I23 Turn over

2
1 (i)
1 (ii)
© OCR 2011

3
1 (iii)
1 (iv)
1(v)(A)
1(v)(B)
1 (vi)
© OCR 2011 Turn over

4
2 (i)
2 (ii)
© OCR 2011

5
2 (iii)
2 (iv)
2 (v)
© OCR 2011 Turn over

6
3 (i)
3 (ii)
© OCR 2011

7
3(iii)(A)
3(iii)(B)
3(iii)(C)
© OCR 2011 Turn over

8
3(iv)(A)
3(iv)(B)
© OCR 2011

9
4(a)(i)
4(a)(ii)
4(a)(iii)
© OCR 2011 Turn over

10
4 (b)
© OCR 2011

11
4 (b) (continued)
© OCR 2011

12
PLEASE DO NOT WRITE ON THIS PAGE
Copyright Information
OCR is committed to seeking permission to reproduce all third-party content that it uses in its assessment materials. OCR has attempted to identify and contact all copyright holders
whose work is used in this paper. To avoid the issue of disclosure of answer-related information to candidates, all copyright acknowledgements are reproduced in the OCR Copyright
Acknowledgements Booklet. This is produced for each series of examinations and is freely available to download from our public website (www.ocr.org.uk) after the live examination series.
If OCR has unwittingly failed to correctly acknowledge or clear any third-party content in this assessment material, OCR will be happy to correct its mistake at the earliest possible
opportunity.
For queries or further information please contact the Copyright Team, First Floor, 9 Hills Road, Cambridge CB2 1GE.
OCR is part of the Cambridge Assessment Group; Cambridge Assessment is the brand name of University of Cambridge Local Examinations Syndicate (UCLES), which is itself a
department of the University of Cambridge.
© OCR 2011

Oxford Cambridge and RSA Examinations
GCE
Unit 4767: Statistics 2
Advanced GCE
Mathematics (MEI)
Mark Scheme for June 2011

OCR (Oxford Cambridge and RSA) is a leading UK awarding body, providing a wide range of qualifications to meet the needs of pupils of all ages and abilities. OCR qualifications include AS/A Levels, Diplomas, GCSEs, OCR Nationals, Functional Skills, Key Skills, Entry Level qualifications, NVQs and vocational qualifications in areas such as IT, business, languages, teaching/training, administration and secretarial skills. It is also responsible for developing new specifications to meet national requirements and the needs of students and teachers. OCR is a not-for-profit organisation; any surplus made is invested back into the establishment to help towards the development of qualifications and support which keep pace with the changing needs of today’s society. This mark scheme is published as an aid to teachers and students, to indicate the requirements of the examination. It shows the basis on which marks were awarded by Examiners. It does not indicate the details of the discussions which took place at an Examiners’ meeting before marking commenced. All Examiners are instructed that alternative correct answers and unexpected approaches in candidates’ scripts must be given marks that fairly reflect the relevant knowledge and skills demonstrated. Mark schemes should be read in conjunction with the published question papers and the Report on the Examination. OCR will not enter into any discussion or correspondence in connection with this mark scheme. © OCR 2011 Any enquiries about publications should be addressed to: OCR Publications PO Box 5050 Annesley NOTTINGHAM NG15 0DL Telephone: 0870 770 6622 Facsimile: 01223 552610 E-mail: [email protected]

4767 Mark Scheme June 2011
Subject-specific Marking Instructions for GCE Mathematics (MEI) Statistics strand a Annotations should be used whenever appropriate during your marking.
The A, M and B annotations must be used on your standardisation scripts for responses that are not awarded either 0 or full marks. It is vital that you annotate standardisation scripts fully to show how the marks have been awarded. For subsequent marking you must make it clear how you have arrived at the mark you have awarded.
b An element of professional judgement is required in the marking of any written paper. Remember that the mark scheme is designed to assist in marking incorrect solutions. Correct solutions leading to correct answers are awarded full marks but work must not be judged on the answer alone, and answers that are given in the question, especially, must be validly obtained; key steps in the working must always be looked at and anything unfamiliar must be investigated thoroughly. Correct but unfamiliar or unexpected methods are often signalled by a correct result following an apparently incorrect method. Such work must be carefully assessed. When a candidate adopts a method which does not correspond to the mark scheme, award marks according to the spirit of the basic scheme; if you are in any doubt whatsoever (especially if several marks or candidates are involved) you should contact your Team Leader.
c The following types of marks are available. M A suitable method has been selected and applied in a manner which shows that the method is essentially understood. Method marks are not usually lost for numerical errors, algebraic slips or errors in units. However, it is not usually sufficient for a candidate just to indicate an intention of using some method or just to quote a formula; the formula or idea must be applied to the specific problem in hand, eg by substituting the relevant quantities into the formula. In some cases the nature of the errors allowed for the award of an M mark may be specified. A Accuracy mark, awarded for a correct answer or intermediate step correctly obtained. Accuracy marks cannot be given unless the associated Method mark is earned (or implied). Therefore M0 A1 cannot ever be awarded. B Mark for a correct result or statement independent of Method marks. E A given result is to be established or a result has to be explained. This usually requires more working or explanation than the establishment of an unknown result.
1

4767 Mark Scheme June 2011
Unless otherwise indicated, marks once gained cannot subsequently be lost, eg wrong working following a correct form of answer is ignored. Sometimes this is reinforced in the mark scheme by the abbreviation isw. However, this would not apply to a case where a candidate passes through the correct answer as part of a wrong argument.
d When a part of a question has two or more ‘method’ steps, the M marks are in principle independent unless the scheme specifically says otherwise; and similarly where there are several B marks allocated. (The notation ‘dep *’ is used to indicate that a particular mark is dependent on an earlier, asterisked, mark in the scheme.) Of course, in practice it may happen that when a candidate has once gone wrong in a part of a question, the work from there on is worthless so that no more marks can sensibly be given. On the other hand, when two or more steps are successfully run together by the candidate, the earlier marks are implied and full credit must be given.
e The abbreviation ft implies that the A or B mark indicated is allowed for work correctly following on from previously incorrect results. Otherwise, A and B marks are given for correct work only — differences in notation are of course permitted. A (accuracy) marks are not given for answers obtained from incorrect working. When A or B marks are awarded for work at an intermediate stage of a solution, there may be various alternatives that are equally acceptable. In such cases, exactly what is acceptable will be detailed in the mark scheme rationale. If this is not the case please consult your Team Leader. Sometimes the answer to one part of a question is used in a later part of the same question. In this case, A marks will often be ‘follow through’. In such cases you must ensure that you refer back to the answer of the previous part question even if this is not shown within the image zone. You may find it easier to mark follow through questions candidate-by-candidate rather than question-by-question.
f Wrong or missing units in an answer should not lead to the loss of a mark unless the scheme specifically indicates otherwise. Candidates are expected to give numerical answers to an appropriate degree of accuracy. 3 significant figures may often be the norm for this, but this always needs to be considered in the context of the problem in hand. For example, in quoting probabilities from Normal tables, we generally expect some evidence of interpolation and so quotation to 4 decimal places will often be appropriate. But even this does not always apply – quotations of the standard critical points for significance tests such as 1.96, 1.645, 2.576 (maybe even 2.58 – but not 2.57) will commonly suffice, especially if the calculated value of a test statistic is nowhere near any of these values. Sensible discretion must be exercised in such cases. Discretion must also be exercised in the case of small variations in the degree of accuracy to which an answer is given. For example, if 3 significant figures are expected (either because of an explicit instruction or because the general context of a problem demands it) but only 2 are given, loss of an accuracy ("A") mark is likely to be appropriate; but if 4 significant figures are given, this should not normally be penalised. Likewise, answers which are slightly deviant from what is expected in a very minor manner (for example a Normal probability given, after an attempt at interpolation, as 0.6418 whereas 0.6417 was expected) should not be penalised. However, answers which are grossly over- or under-specified should normally result in the loss of a mark. This includes cases such as, for example, insistence that the value of a test statistic is (say) 2.128888446667 merely because that is the value that happened to come off the candidate's calculator. Note that this applies to answers that are given as final stages of calculations; intermediate working should usually be carried out, and quoted, to a greater degree of accuracy to avoid the danger of premature approximation.
2

4767 Mark Scheme June 2011
The situation regarding any particular cases where the accuracy of the answer may be a marking issue should be detailed in the mark scheme rationale. If in doubt, contact your Team Leader.
g Rules for replaced work If a candidate attempts a question more than once, and indicates which attempt he/she wishes to be marked, then examiners should do as the candidate requests. If there are two or more attempts at a question which have not been crossed out, examiners should mark what appears to be the last (complete) attempt and ignore the others. NB Follow these maths-specific instructions rather than those in the assessor handbook.
h Genuine misreading (of numbers or symbols, occasionally even of text) occurs. If this results in the object and/or difficulty of the question being considerably changed, it is likely that all the marks for that question, or section of the question, will be lost. However, misreads are often such that the object and/or difficulty remain substantially unaltered; these cases are considered below. The simple rule is that all method ("M") marks [and of course all independent ("B") marks] remain accessible but at least some accuracy ("A") marks do not. It is difficult to legislate in an overall sense beyond this global statement because misreads, even when the object and/or difficulty remains unchanged, can vary greatly in their effects. For example, a misread of 1.02 as 10.2 (perhaps as a quoted value of a sample mean) may well be catastrophic; whereas a misread of 1.6748 as 1.6746 may have so slight an effect as to be almost unnoticeable in the candidate's work. A misread should normally attract some penalty, though this would often be only 1 mark and should rarely if ever be more than 2. Commonly in sections of questions where there is a numerical answer either at the end of the section or to be obtained and commented on (eg the value of a test statistic), this answer will have an "A" mark that may actually be designated as "cao" [correct answer only]. This should be interpreted strictly – if the misread has led to failure to obtain this value, then this "A" mark must be withheld even if all method marks have been earned. It will also often be the case that such a mark is implicitly "cao" even if not explicitly designated as such. On the other hand, we commonly allow "fresh starts" within a question or part of question. For example, a follow-through of the candidate's value of a test statistic is generally allowed (and often explicitly stated as such within the marking scheme), so that the candidate may exhibit knowledge of how to compare it with a critical value and draw conclusions. Such "fresh starts" are not affected by any earlier misreads. A misread may be of a symbol rather than a number – for example, an algebraic symbol in a mathematical expression. Such misreads are more likely to bring about a considerable change in the object and/or difficulty of the question; but, if they do not, they should be treated as far as possible in the same way as numerical misreads, mutatis mutandis. This also applied to misreads of text, which are fairly rare but can cause major problems in fair marking.
3

4767 Mark Scheme June 2011
4
The situation regarding any particular cases that arise while you are marking for which you feel you need detailed guidance should be discussed with your Team Leader. Note that a miscopy of the candidate’s own working is not a misread but an accuracy error.

4767 Mark Scheme June 2011
1 (i)
G1 for axes G1 For values of x G1 for values of y
3
Condone axes drawn either way. Axes should show some indication of scale. If not then Max G1 if points ‘visibly correct’. If axes are scaled and only one point is incorrectly plotted, allow max G2/3.
1 (ii) x = 60, y = 4.26
b = xy
xx
S
S=
2
1803 300 21.3 / 5
27000 300 / 5
= 525
9000 = 0.0583
OR b = 2
1803/ 5 60 4.26
27000 / 5 60
= 105
1800 = 0.0583
hence least squares regression line is: y y = b(x x ) y – 4.26 = 0.0583 (x – 60) y = 0.0583x + 0.76
B1 for x and y used appropriately (SOI)
M1 for attempt at gradient
(b) A1 for 0.0583 cao M1 for equation of line A1 FT for complete
equation
5
B1 for means can be implied by a correct value of b using either method. Allow y = 4.3 Attempt should be correct – e.g. evidence of either of the two suggested methods should be seen.
Allow 0.058 Condone 0.058 and 3 7
120
Dependent on first M1. Values must be substituted to earn M1. Condone use of their b for FT provided b>0. Final equation must be simplified. b = 0.058 leads to y = 0.058x + 0.78
1 (iii) Regression line plotted on graph The fit is good
G1 G1 E1 for good fit
3
Line must pass through their ( x , y ) and y-
intercept. E0 for notably inaccurate graphs/lines
5
4767 Mark Scheme June 2011
6
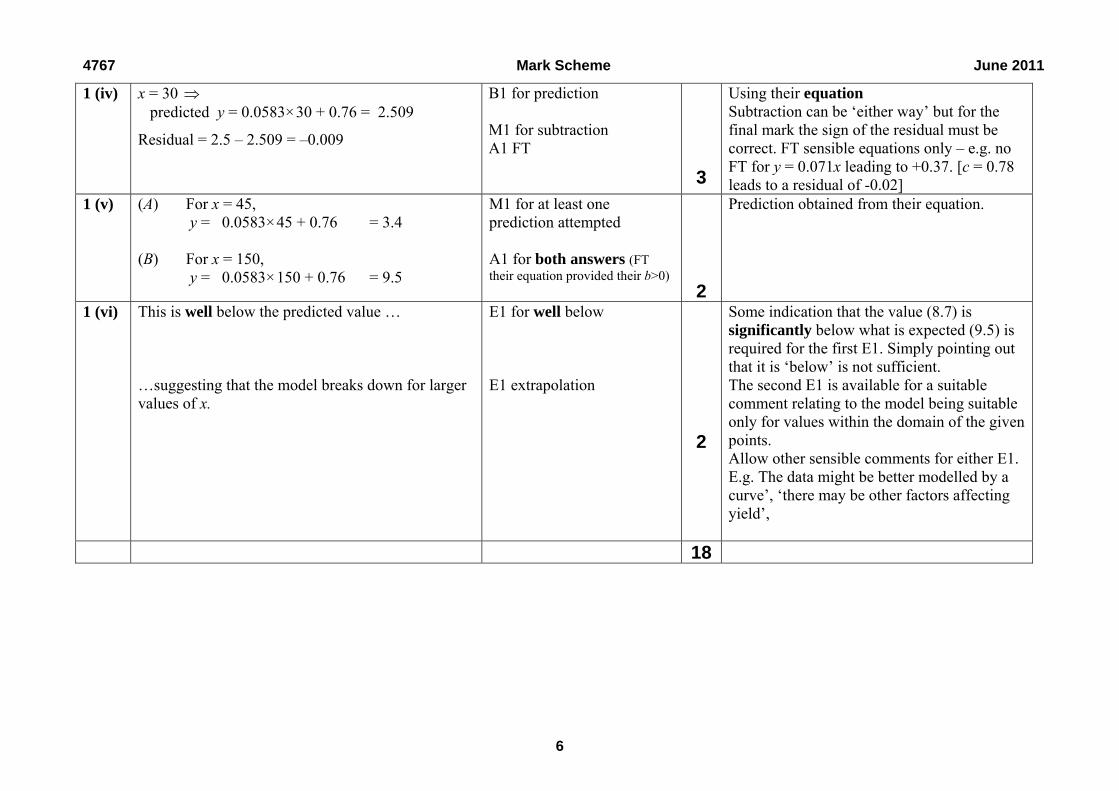
1 (iv) x = 30 predicted y = 0.0583×30 + 0.76 = 2.509
Residual = 2.5 – 2.509 = –0.009
B1 for prediction M1 for subtraction A1 FT
3
Using their equation Subtraction can be ‘either way’ but for the final mark the sign of the residual must be correct. FT sensible equations only – e.g. no FT for y = 0.071x leading to +0.37. [c = 0.78 leads to a residual of -0.02]
1 (v) (A) For x = 45, y = 0.0583×45 + 0.76 = 3.4 (B) For x = 150, y = 0.0583×150 + 0.76 = 9.5
M1 for at least one prediction attempted A1 for both answers (FT their equation provided their b>0)
2
Prediction obtained from their equation.
1 (vi) This is well below the predicted value … …suggesting that the model breaks down for larger values of x.
E1 for well below E1 extrapolation
2
Some indication that the value (8.7) is significantly below what is expected (9.5) is required for the first E1. Simply pointing out that it is ‘below’ is not sufficient. The second E1 is available for a suitable comment relating to the model being suitable only for values within the domain of the given points. Allow other sensible comments for either E1. E.g. The data might be better modelled by a curve’, ‘there may be other factors affecting yield’,
18

4767 Mark Scheme June 2011
2 (i) Independently means that the arrival time of each car is unrelated to the arrival time of any other car. Randomly means that the arrival times of cars are not predictable. At a uniform average rate means that the average rate of car arrivals does not vary over time.
E1 E1 E1
3
NOTE Each answer must be ‘in context’ and ‘clear’ Allow sensible alternative wording. SC1 For ALL answers not in context but otherwise correct.
2 (ii) P(At most 1 car) = e
00.62
0! + e
10.62
1!
= 0.5379… + 0.3335… = 0.871
M1 for either M1 for sum of both A1 CAO
3
1.62e-0.62
Allow 0.8715 not 0.872 or 0.8714 Allow 0.87 without wrong working seen
2 (iii) New λ = 10 0.62 = 6.2 P(more than 5 in 10 mins) = 1 – 0.4141 = 0.5859
B1 for mean (SOI) M1 for probability A1 CAO
3
Use of 1 – P(X ≤ 5) with any λ Allow 0.586
2 (iv) Poisson with mean 37.2 B1 for Poisson B1 for mean 37.2
2
Dependent on first B1 Condone P(37.2, 37.2)
2 (v) Use Normal approx with μ = σ2 = λ = 37.2
P(X ≥ 40) = P39.5 37.2
37.2Z
= P(Z > 0.377) = 1 – Φ(0.377) = 1 – 0.6469 = 0.3531
B1 for Normal (SOI) B1 for parameters B1 for 39.5 M1 for correct use of Normal approximation using correct tail A1 cao
5
Allow 0.353
16
7

4767 Mark Scheme June 2011
3 (i)
P(Apple weighs at least 220g)
= P 220 210.5
15.2Z
= P( Z > 0.625) = 1– Φ(0.625) = 1 – 0.7340
= 0.2660
M1 for standardising M1 for correct structure A1 CAO inc use of diff tables
3
Condone numerator reversed but penalise continuity corrections i.e. 1 – Φ(positive z value) Allow 0.266 but not 0.27
3 (ii) P(All 3 weigh at least 220g) = 0.26603 = 0.0188 M1 A1 FT 2 M1 for their answer to part (i) cubed
Allow 0.019 and 0.01882 3 (iii) (A) Binomial (100, 0.0188)
(B) Use a Poisson distribution with λ = 100×0.0188 = 1.88
P(At most one) = e01.88
0! + e
11.88
1!
= 0.1525 + 0.2869 = 0.4394 (C) n is large and p is small
B1 for binomial B1 for parameters B1 for Poisson SOI B1 for Poisson mean M1 for either probability M1 for sum of both A1 CAO For 0.44 or better
B1
2
5 1
Second B1 dependent on first B1 FT their answer to part (ii) for second B1 Consistent with p < 0.1 from part (iii) (A) FT answer to part (ii) with p < 0.1 Dependent on both previous B1 marks Allow 0.4395 but not 0.4337 Dependent on use of Poisson in part (iii) B Allow n is large and np <10 & n is large and
npqnp
3(iv)(A) Φ-1 ( 0.1 ) = – 1.282 170 185
1.282
1.282 σ = 15
σ = 11.70
B1 for ±1.282 M1 for correct equation as written o.e. A1 CAO
3
Do not allow 1 – 1.282 Allow M1 if different z-value used Without incorrect working seen. Allow 11.7
8

4767 Mark Scheme June 2011
9
3(iv)(B)
G1 for shape G1 for means, shown explicitly or by scale G1 for lower max height for Braeburns G1 for greater width (variance) for Braeburns
4
Ignore labelling of vertical axis. Two intersecting, adjacent Normal curves Means at 185 and 210.5
TOTAL 20
4(a)(i) H0: no association between amount spent and sex H1: some association between amount spent and sex
B1 for both 1
Hypotheses must be the right way round, in context and must not mention ‘correlation’.
4(a)(ii) Expected frequency = 62102÷200 = 31.62 Contribution = (34 – 31.62)2 / 31.62 = 0.1791
B1 M1 A1 for valid attempt at (O-E)2/E NB Answer given
3
Do not allow 31.6
Cox’s Braeburns

4767 Mark Scheme June 2011
4(a)(iii) Refer to X42
Critical value at 5% level = 9.488 3.205 < 9.488 Result is not significant There is insufficient evidence to suggest any association between amount spent and sex. .
B1 for 4 deg of freedom B1 CAO for cv M1 A1 for not significant E1
5
Allow p = 0.524 0.524 > 0.05 Conclusion must be stated to earn A1 here. Allow ‘do not reject H0’ and condone ‘accept H0’ or ‘reject H1’. FT if cv consistent with their d.o.f. Dependent on previous A1 and final comment must be in context and not mention correlation. SC1 for correct final conclusion where previous A1 omitted but M1 awarded.
4 (b) H0: μ = 400; H1: μ < 400 Where μ denotes the population mean (weight of the loaves). x = 396.5
Test statistic =396.5 400 3.5
1.5042.3275.7 / 6
5% level 1 tailed critical value of z = –1.645 –1.504 > –1.645 so not significant. There is insufficient evidence to reject H0 There is insufficient evidence to suggest that the true mean weight of the loaves is lower than the minimum specified value of 400 grams.
B1 for H0 B1 for H1 B1 for definition of μ B1 for sample mean M1 must include √6 A1FT their sample mean
B1 for ±1.645
M1 for sensible comparison leading to a conclusion A1 for conclusion in context
9
Hypotheses in words must refer to population mean. Condone numerator reversed for M1 but award A1 only if test statistic of 1.504 is compared with a positive z-value. Dependent on previous M1 FT their sample mean only if hypotheses are correct.
TOTAL 18
10

4767 Mark Scheme June 2011
Additional notes re Q1 parts (ii), (iv) and (v) Part (ii) ‘x on y’ max B1 Part (iv) x = 16.9y – 12.02 leads to a prediction of x = 30.23 and a residual of -0.23 B1 M1 A1 available. Part (v) ‘x on y’ not appropriate here so award 0 if ‘x on y’ used. Additional notes re Q2 parts (i) & (v) Part (i) Independent – Allow ‘not linked to’ or ‘no association’ or ‘unrelated’ ‘not affected by’, ‘not connected to’, ‘not influenced by’ DO NOT ACCEPT ‘not together’ or ‘not dependent’ Random – Allow ‘not predictable’ or ‘no pattern’ or ‘could happen at any time’ or ‘not specific time’ Uniform average rate – Allow ‘average (rate) is constant over time’ DO NOT ACCEPT ‘average constant’ or ‘average rate and uniform’ – be generous over defining ‘average’ and/or ‘rate’. Part (v) If Binomial distribution stated in part (iv), allow B1 B0 B1 M0 A0 max Additional notes re Q3 part (iii) where p > 0.1 (iii) B – as scheme unless a Normal approximation is more suitable (p > 0.1). If so, award B1 B1 for Normal and correct parameters. The remaining marks are dependent on both these B1 marks being awarded. M1 for the correct continuity correction (P(X < 1.5) ) and depM1 for the correct tail but award A0. (iii) C – ‘n is large and p is not too small’ or ‘np > 10’
11

4767 Mark Scheme June 2011
12
Additional notes re Q4(b) σ estimated sample mean, 7.079… used in place of 5.7, the given value of the population mean, leads to a test statistic of -1.212… This gets M1A0 & the remaining marks are still available. Critical Value Method 400 – 1.645 × 5.7 ÷ √6… gets M1B1 …= 396.17…gets A1 400 + 1.645 × 5.7 ÷ √6 gets M1B1A0. 396.5 > 396.2 gets M1for sensible comparison (and B1 for 396.5) A1 still available for correct conclusion in words & context 90% Confidence Interval Method CI centred on 396.5 (gets B1 for 396.5) + or – 1.645 × 5.7 ÷ √6 gets M1 B1 = (392.67, 400.33) A1 contains 400 gets M1 A1 still available for correct conclusion in words & context Probability Method Finding P(sample mean < 396.5) = 0.0663 gets M1 A1 (and B1 for 396.5) 0.0663 > 0.05 gets M1 for a sensible comparison if a conclusion is made and also gets the B1 for 0.0663 (to replace the B1 for cv = 1.645). A1 still available for correct conclusion in words & context. Condone P(sample mean >396.5) = 0.9337 for M1 and B1 for 0.9337 but only allow A1 if later compared with 0.95 at which point the final M1and A1 are still available Two-tailed test Max B1 B0 B1 B1 M1 A1 B1 (for cv = -1.96) M1 A0

OCR (Oxford Cambridge and RSA Examinations) 1 Hills Road Cambridge CB1 2EU OCR Customer Contact Centre 14 – 19 Qualifications (General) Telephone: 01223 553998 Facsimile: 01223 552627 Email: [email protected] www.ocr.org.uk For staff training purposes and as part of our quality assurance programme your call may be recorded or monitored
Oxford Cambridge and RSA Examinations is a Company Limited by Guarantee Registered in England Registered Office; 1 Hills Road, Cambridge, CB1 2EU Registered Company Number: 3484466 OCR is an exempt Charity OCR (Oxford Cambridge and RSA Examinations) Head office Telephone: 01223 552552 Facsimile: 01223 552553 © OCR 2011

Examiners’ Reports – June 2011
4767: Statistics 2
General Comments
Once again, the overall performance of the majority of candidates was very good. There was no evidence that candidates found it difficult to complete the paper in the time available. With the majority of candidates able to handle the numerical side of statistical tests accurately it was the questions, or parts thereof, requiring comments and interpretation that discriminated between candidates. Comments on Individual Questions 1 (i) This was well-answered as expected.
1 (ii) Well-answered, but mistakes such as using ΣxΣy for Σxy were fairly common. A
few candidates slipped up when rearranging the equation into the form y = mx + c.
1 (iii) Well done, but there was little evidence of candidates with clearly inaccurate equations going back to correct their work in part (ii).
1 (iv) Most candidates managed to use their equation to predict a value for y but many slipped up with the sign of their residual.
1 (v) Well done, although many gave their answers to 5 or more significant figures. In this question, this was deemed to be ‘over-specification’.
1 (vi) Most managed to make a sensible comment relating to extrapolation, but additional, acceptable comments were few in number.
2 (i) Candidates of all abilities found it difficult to provide clear explanations to differentiate between independence, randomness and uniform average rate.
2 (ii) Well answered, though a small proportion of candidates lost accuracy through premature rounding.
2 (iii) Well done on the whole. Some candidates found P(X ≥ 5) instead of P(X > 5) either by misinterpreting the question or by misunderstanding the method.
2 (iv) Some candidates stated the parameter, λ = 37.2, rather than specifying the correct distribution, Poisson(37.2), as requested. Several candidates also stated what was probably intended as the approximating distribution required in part (v), thus making it unclear if they had actually understood the question posed in part (iv).
2 (v) Well answered. Some candidates seemed unsure how to apply a continuity correction but otherwise handled the Normal calculation appropriately. There was some confusion over variance and standard deviation shown by a minority of candidates.
3 (i) Well answered, but spurious continuity corrections were seen frequently.
3 (ii) Well answered.
42

Examiners’ Reports – June 2011
3(iii) A The majority of candidates correctly identified the Binomial distribution with a correct follow through from their value in part (ii). However some candidates lost marks by identifying parameters only. Several candidates identified either the Normal or Poisson distributions in error.
3(iii) B Most candidates who had the correct answer in part (A) answered this part correctly using a suitable Poisson approximation, though some candidates lost marks by ignoring the need for a “suitable approximating” distribution and continued to use the Binomial from part (A). Other candidates either used the Normal distribution inappropriately or failed to use the Normal distribution when their value of np was greater than 10.
3(iii) C This was poorly answered revealing a poor understanding of the conditions required to apply a Poisson approximation. Many candidates appeared to think that ‘n is large and p is small’ was justification to use a Normal approximation to the Binomial distribution.
3(iv) A This was usually correct with the odd sign error leading to an incorrect equation, though most candidates managed to use the correct z value.
3(iv) B Marks were frequently lost by candidates failing to appreciate that normal curves should be asymptotic to the horizontal axis and symmetrical about the mean. Many candidates failed to show the ‘Cox’ curve with a higher vertex than the ‘Braeburn’ curve.
4 (a)(i) This was well answered with few candidates failing to provide context in their hypotheses and with few using the word ‘correlation’.
4(a) (ii) Well answered.
4(a) (iii) Well answered. A minority of candidates failed to provide context in their conclusions and/or failed to provide acceptable conclusions.
4(b) Well answered. Notably, many candidates failed to define μ as the population mean. Most managed to carry out the test correctly, with the preferred method being the one outlined in the main body of the mark scheme.
43

For a description of how UMS marks are calculated see:www.ocr.org.uk/learners/ums_results.html
GCE Mathematics (MEI)Max Mark a b c d e u
4751/01 (C1) MEI Introduction to Advanced Mathematics Raw 72 55 49 43 37 32 0UMS 100 80 70 60 50 40 0
4752/01 (C2) MEI Concepts for Advanced Mathematics Raw 72 53 46 39 33 27 0UMS 100 80 70 60 50 40 0
4753/01 (C3) MEI Methods for Advanced Mathematics with Coursework: Written Paper Raw 72 54 48 42 36 29 04753/02 (C3) MEI Methods for Advanced Mathematics with Coursework: Coursework Raw 18 15 13 11 9 8 04753/82 (C3) MEI Methods for Advanced Mathematics with Coursework: Carried Forward Coursework Mark Raw 18 15 13 11 9 8 04753 (C3) MEI Methods for Advanced Mathematics with Coursework UMS 100 80 70 60 50 40 04754/01 (C4) MEI Applications of Advanced Mathematics Raw 90 63 56 50 44 38 0
UMS 100 80 70 60 50 40 04755/01 (FP1) MEI Further Concepts for Advanced Mathematics Raw 72 59 52 45 39 33 0
UMS 100 80 70 60 50 40 04756/01 (FP2) MEI Further Methods for Advanced Mathematics Raw 72 55 48 41 34 27 0
UMS 100 80 70 60 50 40 04757/01 (FP3) MEI Further Applications of Advanced Mathematics Raw 72 55 48 42 36 30 0
UMS 100 80 70 60 50 40 04758/01 (DE) MEI Differential Equations with Coursework: Written Paper Raw 72 63 57 51 45 39 04758/02 (DE) MEI Differential Equations with Coursework: Coursework Raw 18 15 13 11 9 8 04758/82 (DE) MEI Differential Equations with Coursework: Carried Forward Coursework Mark Raw 18 15 13 11 9 8 04758 (DE) MEI Differential Equations with Coursework UMS 100 80 70 60 50 40 04761/01 (M1) MEI Mechanics 1 Raw 72 60 52 44 36 28 0
UMS 100 80 70 60 50 40 04762/01 (M2) MEI Mechanics 2 Raw 72 64 57 51 45 39 0
UMS 100 80 70 60 50 40 04763/01 (M3) MEI Mechanics 3 Raw 72 59 51 43 35 27 0
UMS 100 80 70 60 50 40 04764/01 (M4) MEI Mechanics 4 Raw 72 54 47 40 33 26 0
UMS 100 80 70 60 50 40 04766/01 (S1) MEI Statistics 1 Raw 72 53 45 38 31 24 0
UMS 100 80 70 60 50 40 04767/01 (S2) MEI Statistics 2 Raw 72 60 53 46 39 33 0
UMS 100 80 70 60 50 40 04768/01 (S3) MEI Statistics 3 Raw 72 56 49 42 35 28 0
UMS 100 80 70 60 50 40 04769/01 (S4) MEI Statistics 4 Raw 72 56 49 42 35 28 0
UMS 100 80 70 60 50 40 04771/01 (D1) MEI Decision Mathematics 1 Raw 72 51 45 39 33 27 0
UMS 100 80 70 60 50 40 04772/01 (D2) MEI Decision Mathematics 2 Raw 72 58 53 48 43 39 0
UMS 100 80 70 60 50 40 04773/01 (DC) MEI Decision Mathematics Computation Raw 72 46 40 34 29 24 0
UMS 100 80 70 60 50 40 04776/01 (NM) MEI Numerical Methods with Coursework: Written Paper Raw 72 62 55 49 43 36 04776/02 (NM) MEI Numerical Methods with Coursework: Coursework Raw 18 14 12 10 8 7 04776/82 (NM) MEI Numerical Methods with Coursework: Carried Forward Coursework Mark Raw 18 14 12 10 8 7 04776 (NM) MEI Numerical Methods with Coursework UMS 100 80 70 60 50 40 04777/01 (NC) MEI Numerical Computation Raw 72 55 47 39 32 25 0
UMS 100 80 70 60 50 40 0
Unit level raw mark and UMS grade boundaries June 2011 series: GCE 19


![Version 2 - June 2016 · Basics Basic requirements for awarding the environmental label RAL-U2 178, Para .3.6.3 DatedJuly2014 Criteria for awarding the EU environmenta] label, criterion](https://img.pdfslide.net/doc/110x75/5f1faf760919df7d1e7471ee/version-2-june-2016-basics-basic-requirements-for-awarding-the-environmental-label.jpg)