Embed Size (px)
Citation preview
June 2012
Teaching about Teaching about COCO22, Temperature, and Climate Change, Temperature, and Climate Change
Beth Caissie Beth Caissie 1, 21, 2
with collaboration from Julie Brigham-Grettewith collaboration from Julie Brigham-Grette11, Laura Schofield, Laura Schofield33, , Christina CiarametaroChristina Ciarametaro33, and Mort Sternheim, and Mort Sternheim11
11 UMass Amherst Geosciences and STEM Ed Institute; UMass Amherst Geosciences and STEM Ed Institute; 22 Iowa State University; Iowa State University; 33 Ipswich Middle SchoolIpswich Middle School
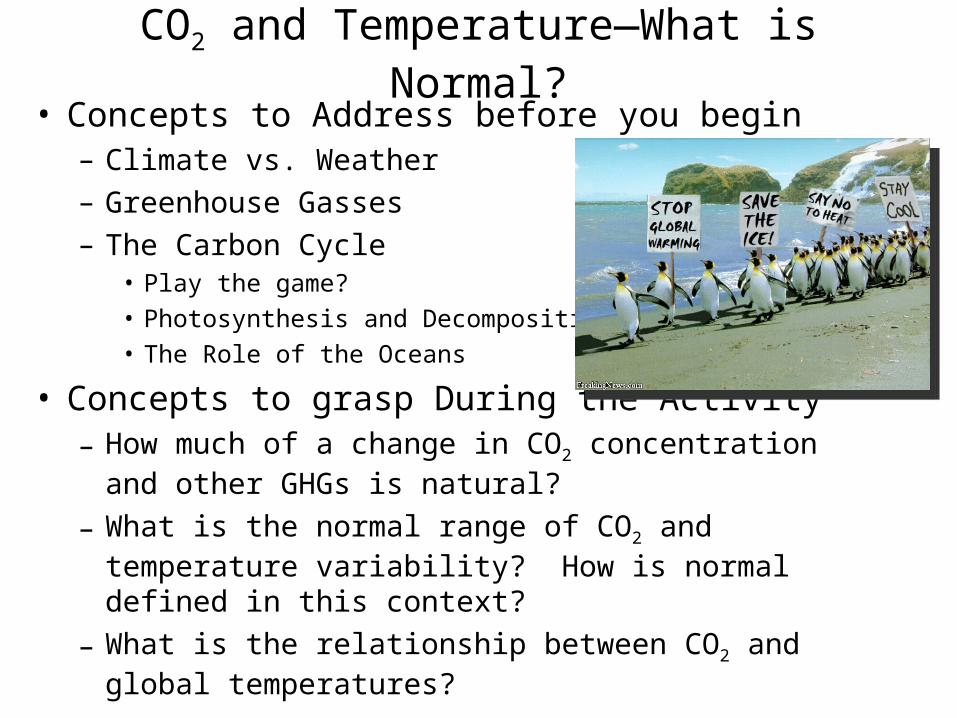
CO2 and Temperature—What is Normal?• Concepts to Address before you begin
– Climate vs. Weather– Greenhouse Gasses– The Carbon Cycle
• Play the game?• Photosynthesis and Decomposition• The Role of the Oceans
• Concepts to grasp During the Activity– How much of a change in CO2 concentration and other
GHGs is natural?
– What is the normal range of CO2 and temperature variability? How is normal defined in this context?
– What is the relationship between CO2 and global temperatures?
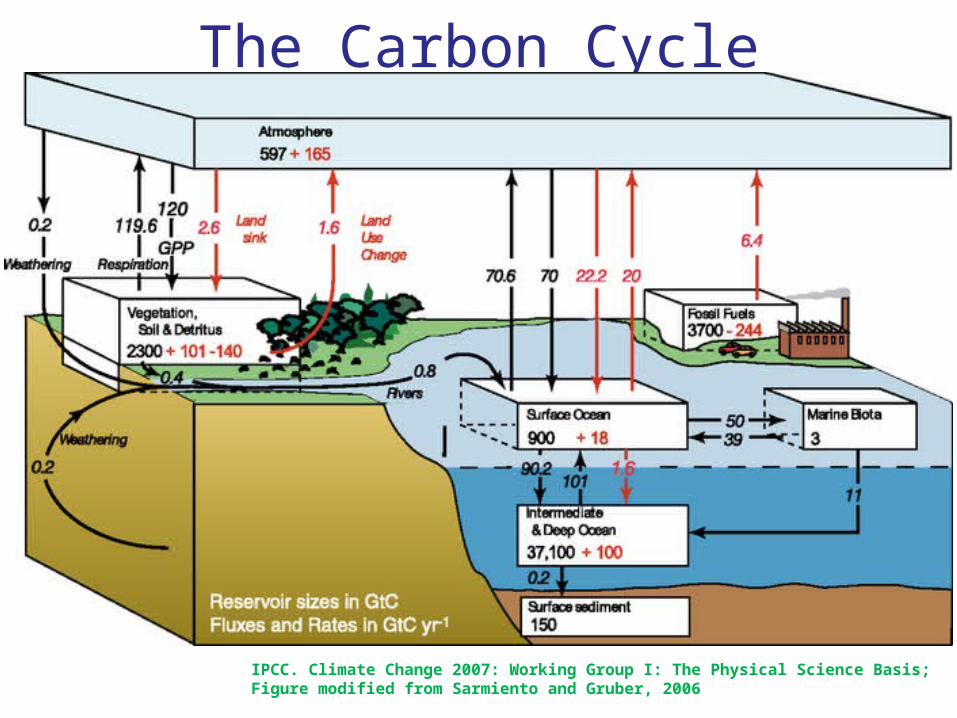
The Carbon Cycle
IPCC. Climate Change 2007: Working Group I: The Physical Science Basis; Figure modified from Sarmiento and Gruber, 2006
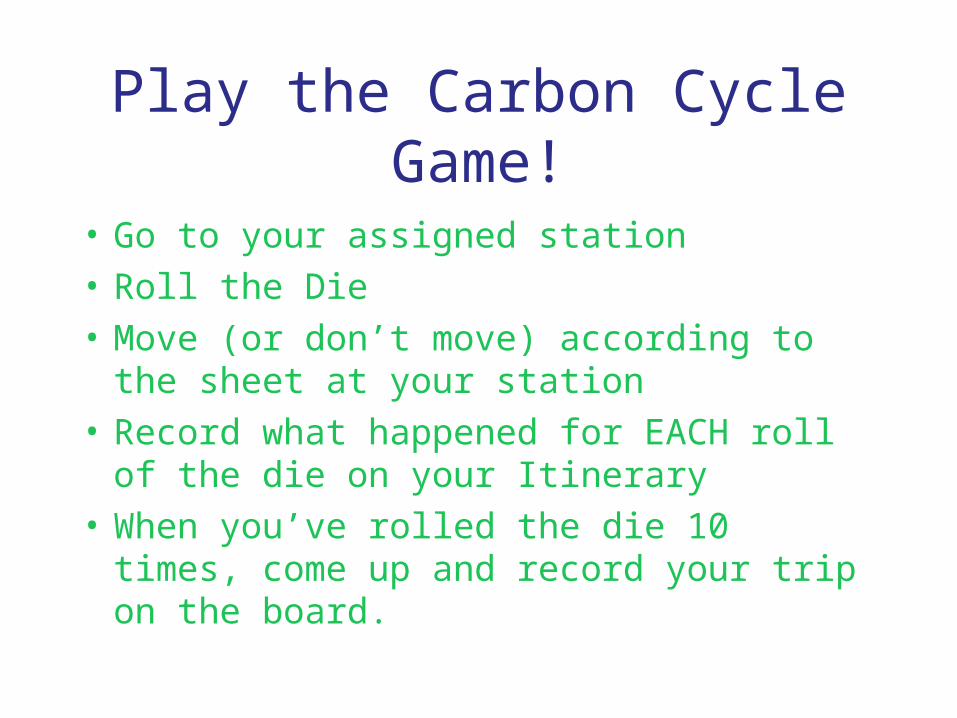
Play the Carbon Cycle Game!
• Go to your assigned station• Roll the Die• Move (or don’t move) according to the sheet
at your station• Record what happened for EACH roll of the
die on your Itinerary• When you’ve rolled the die 10 times, come
up and record your trip on the board.

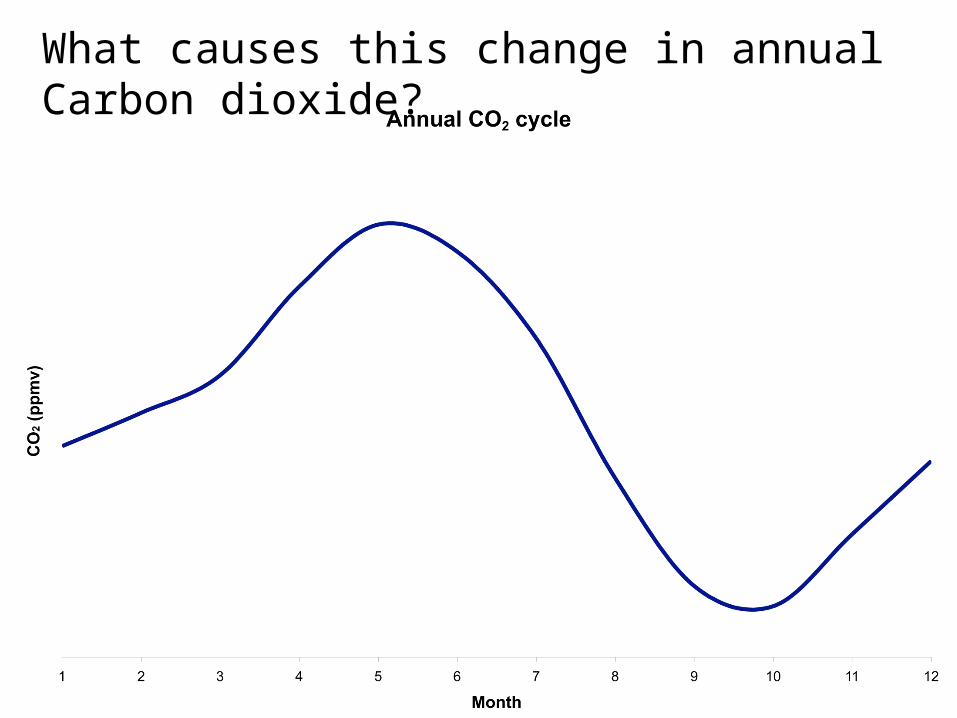
What causes this change in annual Carbon dioxide?
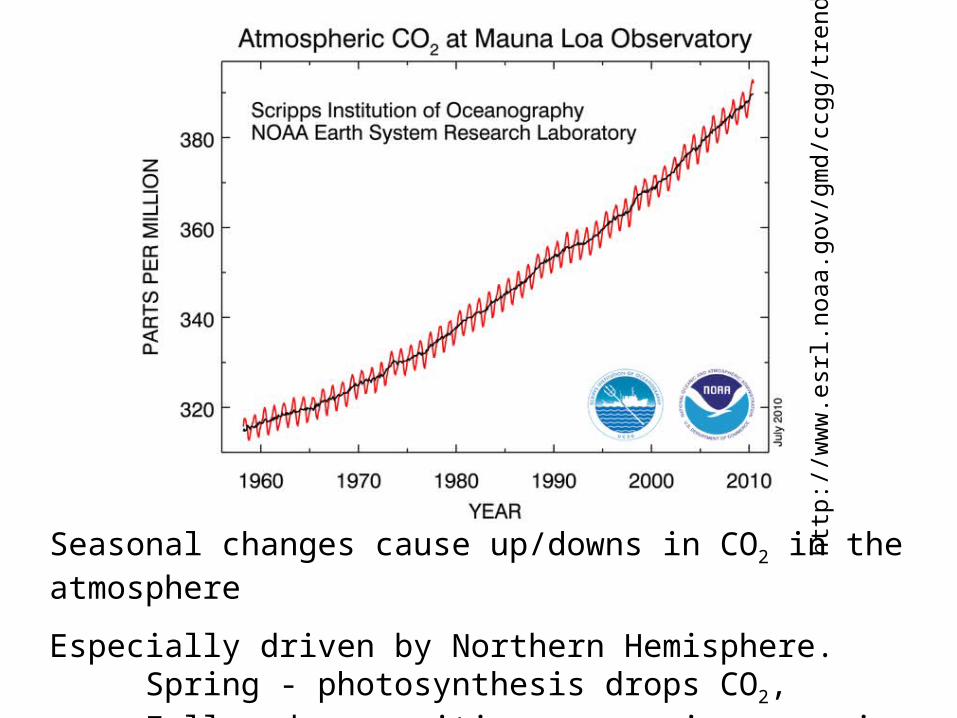
Seasonal changes cause up/downs in CO2 in the atmosphere
Especially driven by Northern Hemisphere. Spring - photosynthesis drops CO2, Fall - decomposition causes increase in CO2
htt
p:/
/ww
w.e
srl.noaa.g
ov/g
md/c
cgg/t
rends/
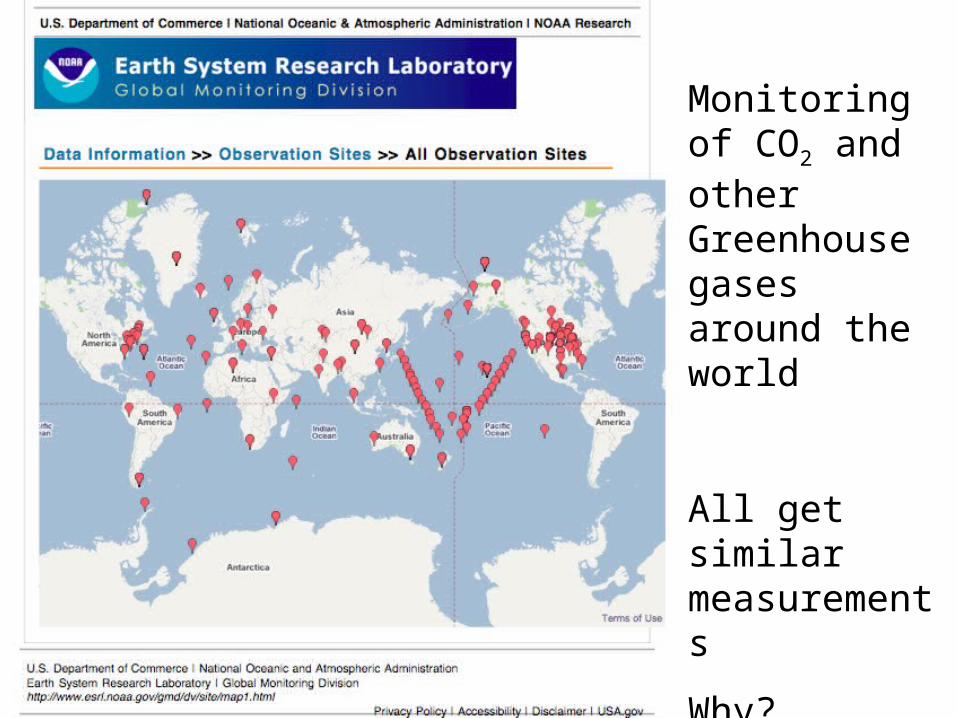
Monitoring of CO2 and other Greenhouse gases around the world
All get similar measurements
Why?
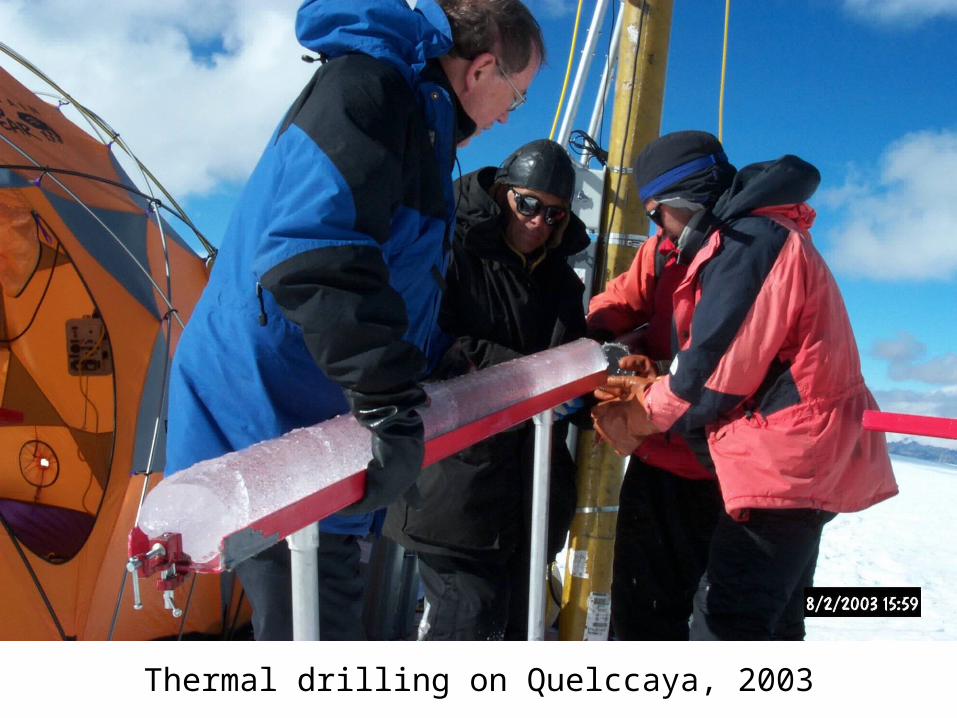
Thermal drilling on Quelccaya, 2003
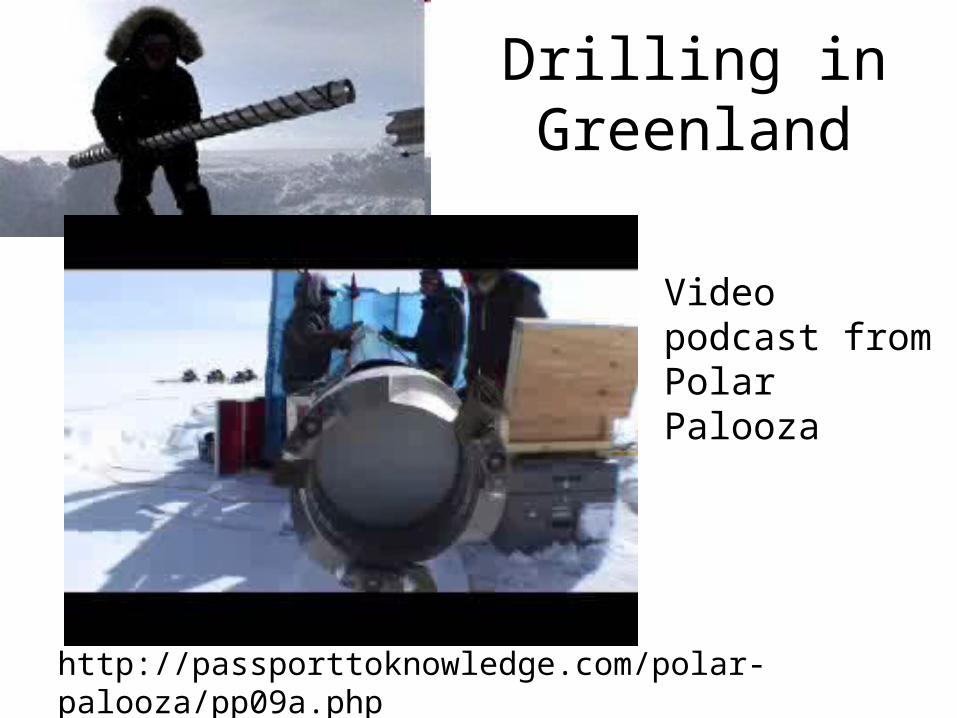
Drilling in Greenland
http://passporttoknowledge.com/polar-palooza/pp09a.php
Video podcast from Polar Palooza
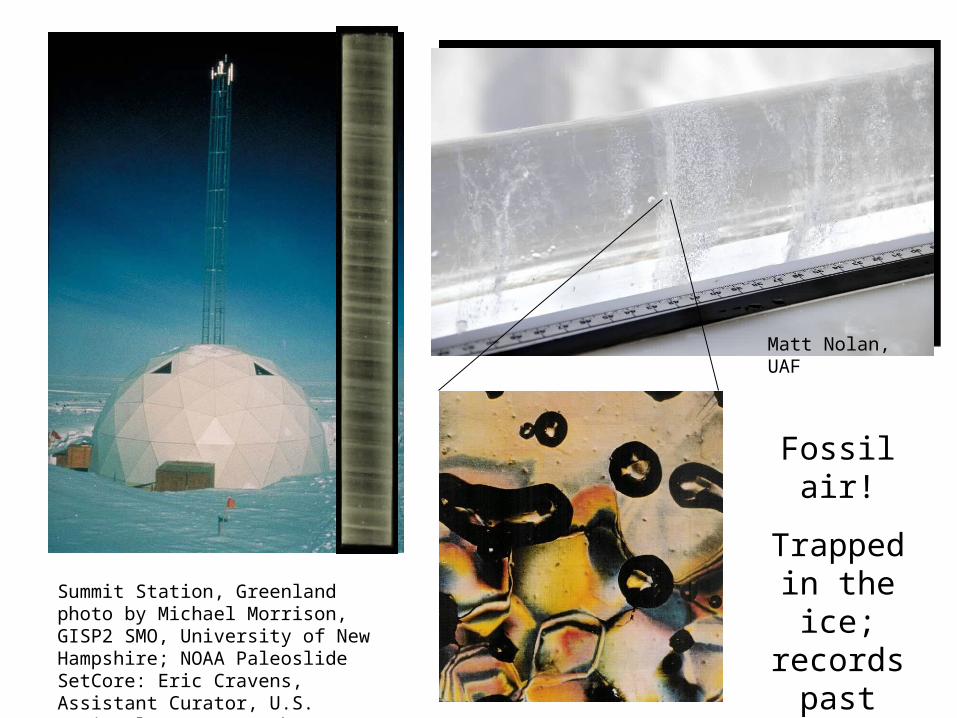
Summit Station, Greenland photo by Michael Morrison, GISP2 SMO, University of New Hampshire; NOAA Paleoslide SetCore: Eric Cravens, Assistant Curator, U.S. National Ice Core Laboratory;
Matt Nolan, UAF
Fossil air!
Trapped in the ice;
records past atmosphere
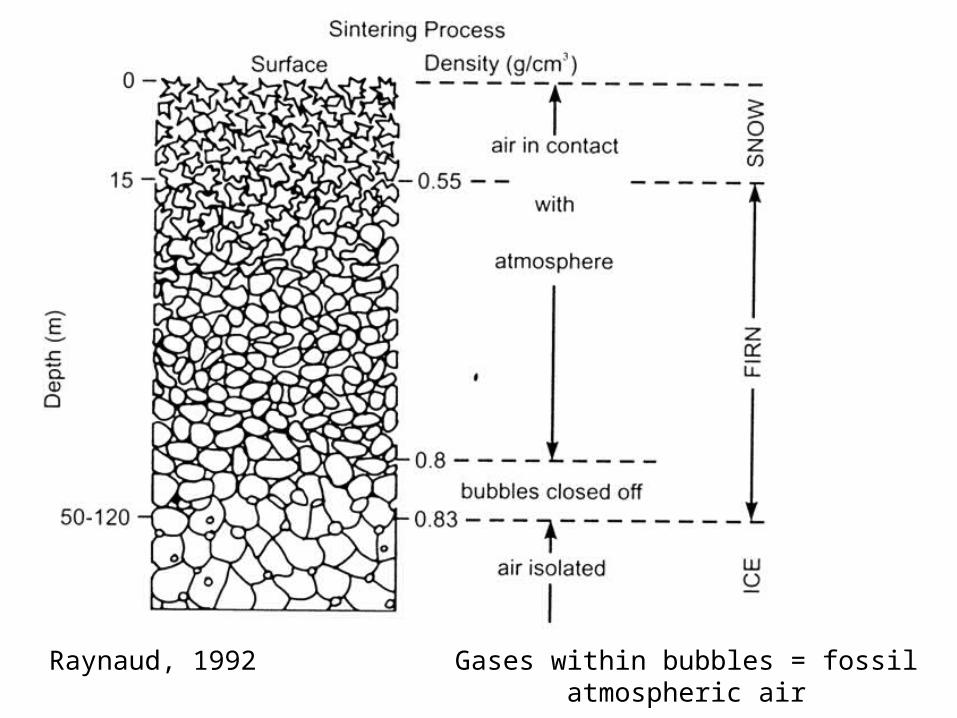
Raynaud, 1992 Gases within bubbles = fossil atmospheric air
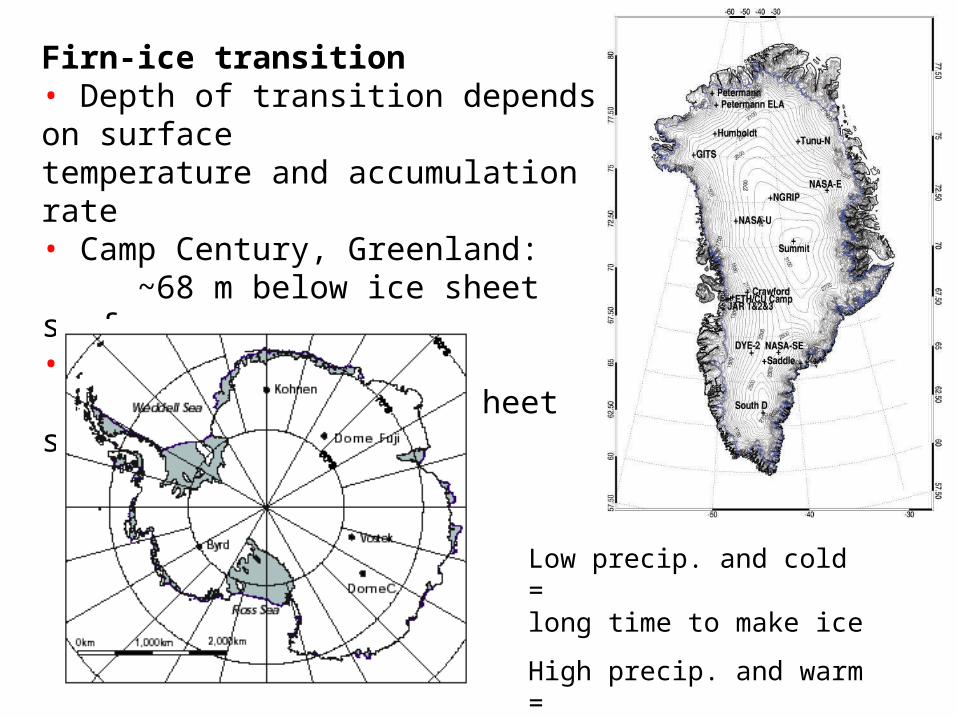
Firn-ice transition• Depth of transition depends on surfacetemperature and accumulation rate• Camp Century, Greenland:
~68 m below ice sheet surface• Vostok, Antarctica:
~100 m below ice sheet surface
Low precip. and cold = long time to make ice
High precip. and warm =short time to make ice
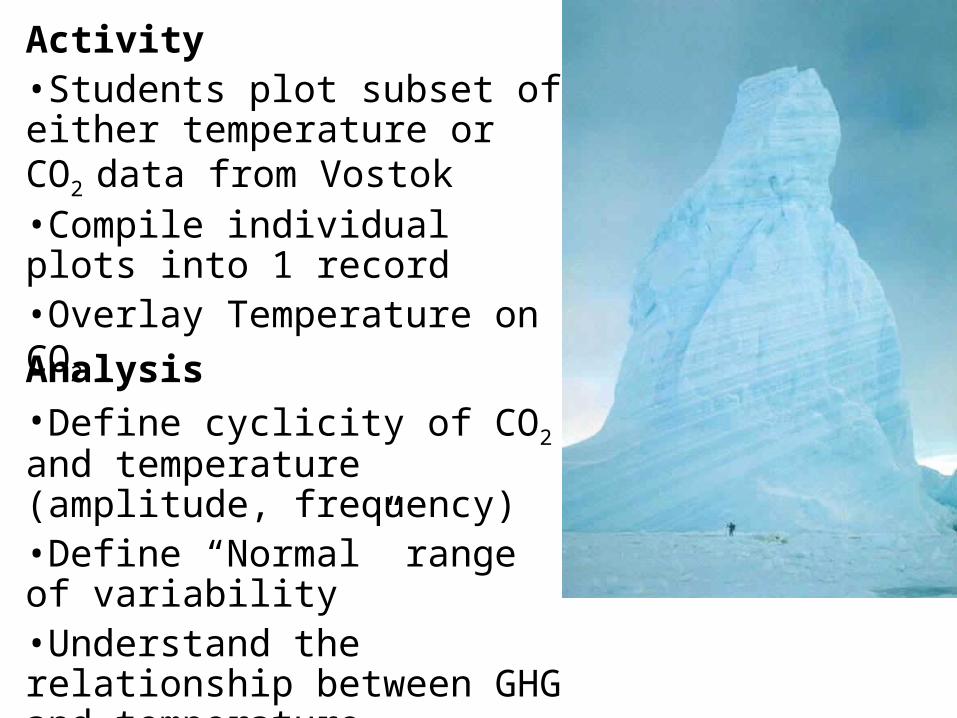
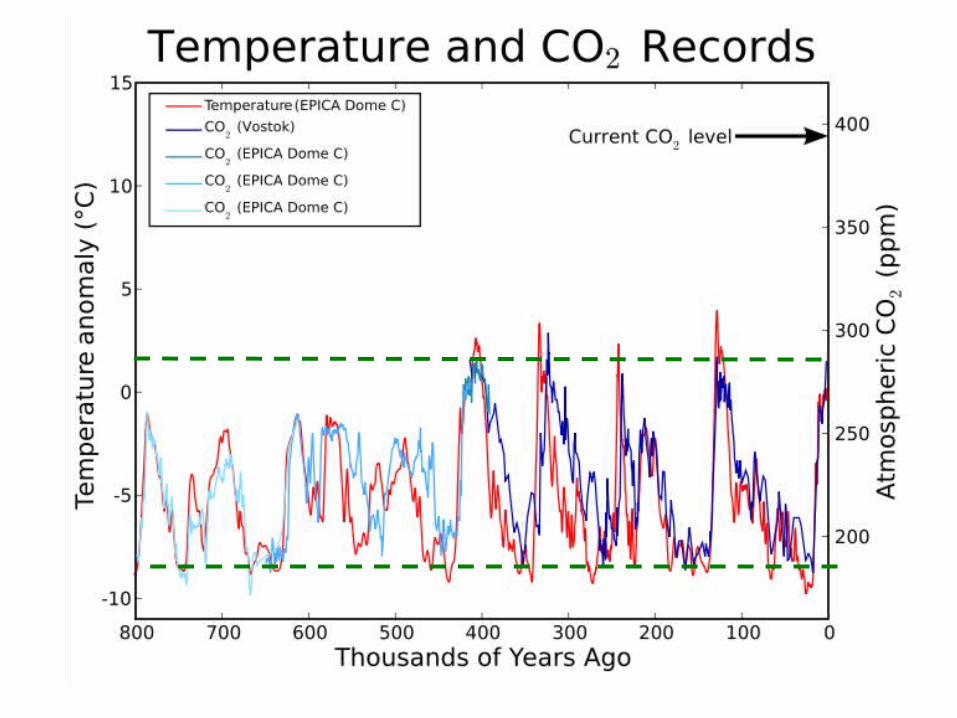
Activity•Students plot subset of either temperature or CO2 data from Vostok•Compile individual plots into 1 record•Overlay Temperature on CO2
Analysis•Define cyclicity of CO2 and temperature (amplitude, frequency)•Define “Normal” range of variability •Understand the relationship between GHG and temperature.
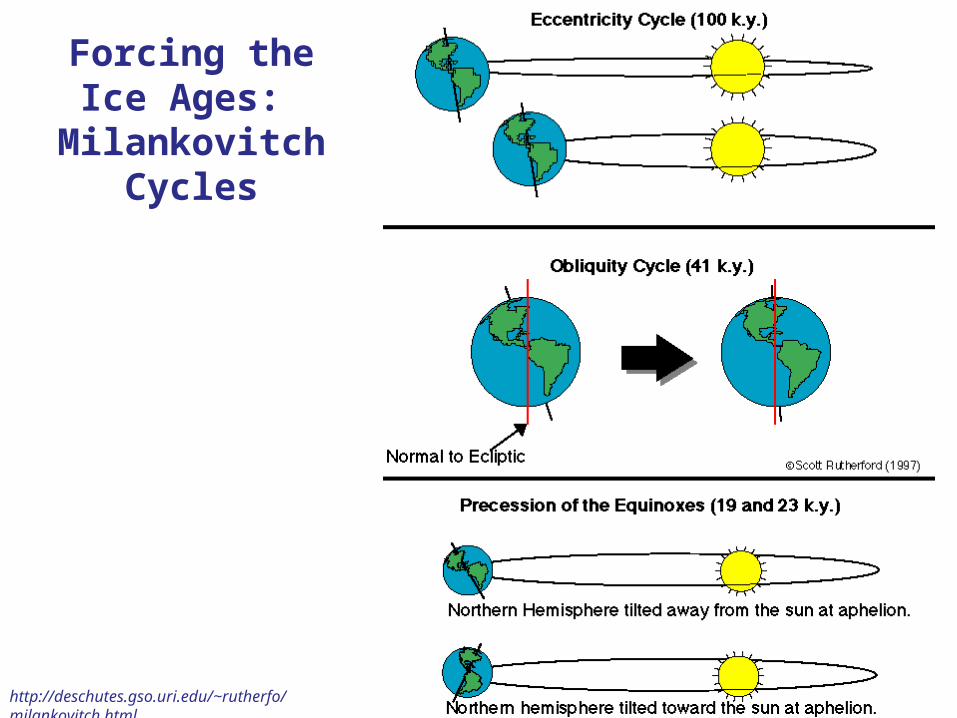
Forcing the Ice Ages: Milankovitch Cycles
http://deschutes.gso.uri.edu/~rutherfo/milankovitch.html
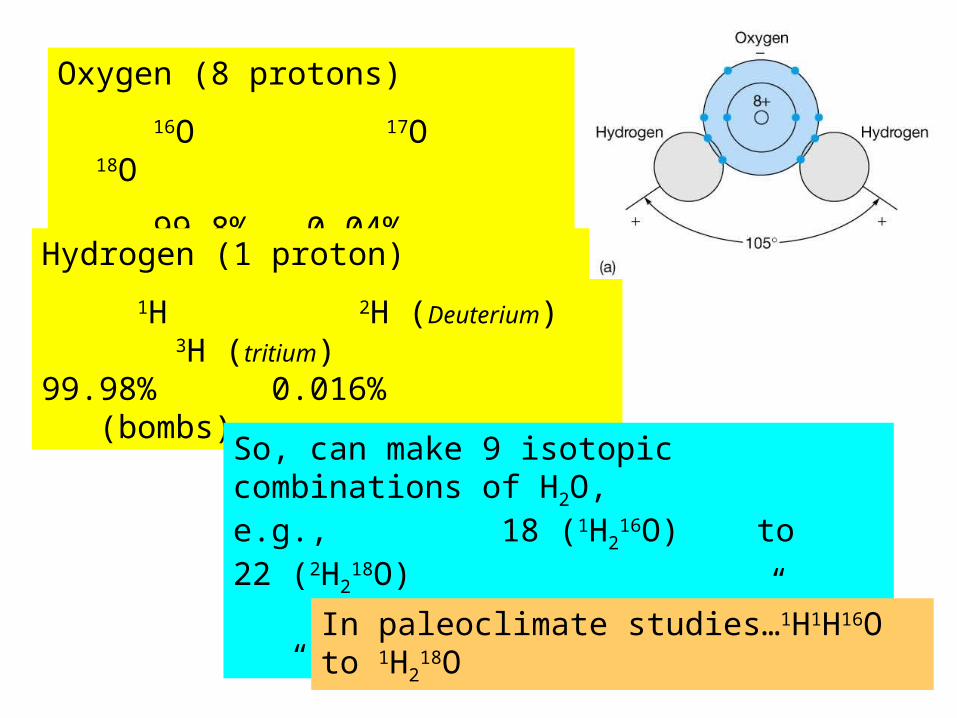
Oxygen (8 protons)16O 17O 18O
99.8% 0.04% 0.2%
Hydrogen (1 proton)1H 2H (Deuterium) 3H (tritium)
99.98% 0.016% (bombs)
So, can make 9 isotopic combinations of H2O,e.g., 18 (1H2
16O) to 22 (2H218O)
“light water” “heavy water”
In paleoclimate studies…1H1H16O to 1H218O
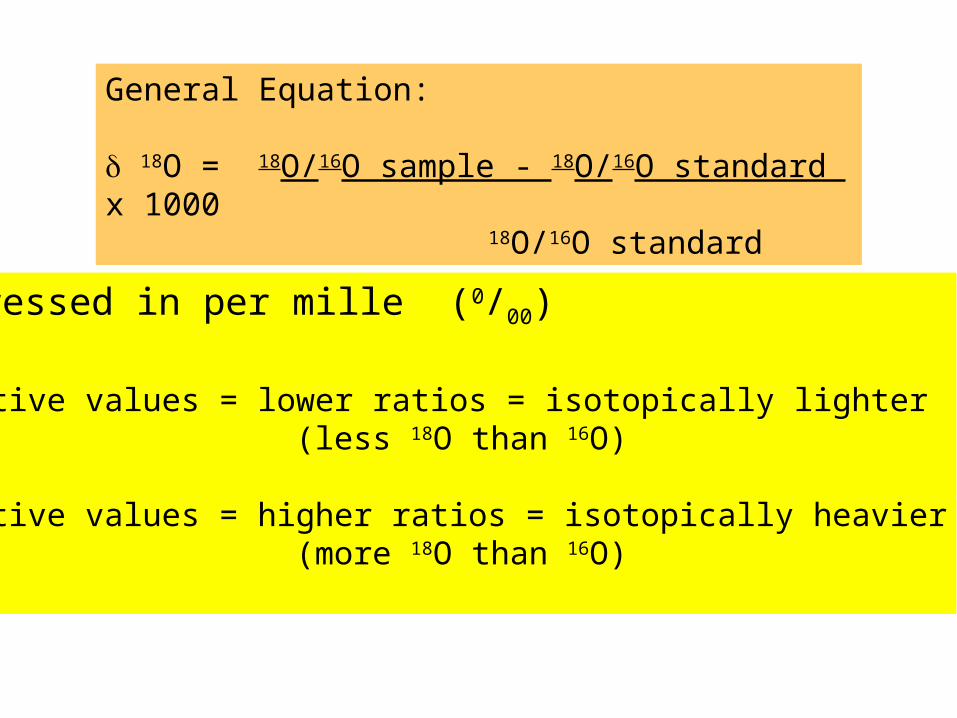
General Equation:
18O = 18O/16O sample - 18O/16O standard x 1000 18O/16O standard
Expressed in per mille (0/00)
Negative values = lower ratios = isotopically lighter(less 18O than 16O)
Positive values = higher ratios = isotopically heavier(more 18O than 16O)
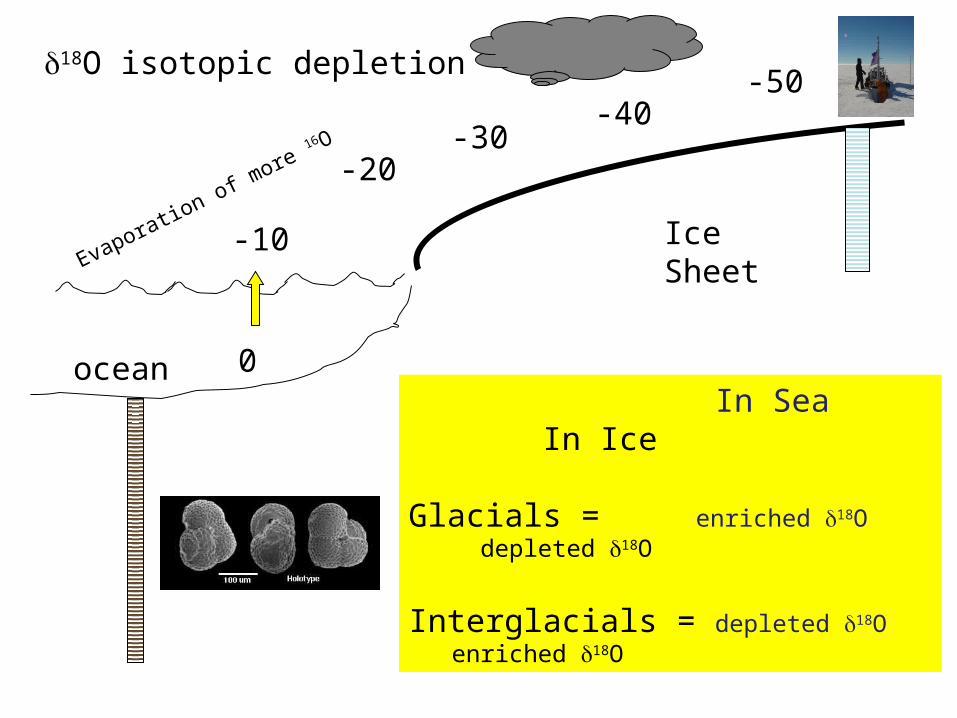
Ice Sheet
ocean 0
-10
-20-30
-40-5018O isotopic depletion
In Sea In Ice
Glacials = enriched 18O depleted 18O
Interglacials = depleted 18O enriched 18O
Evaporation of more 16 O
Ice Sheet
ocean
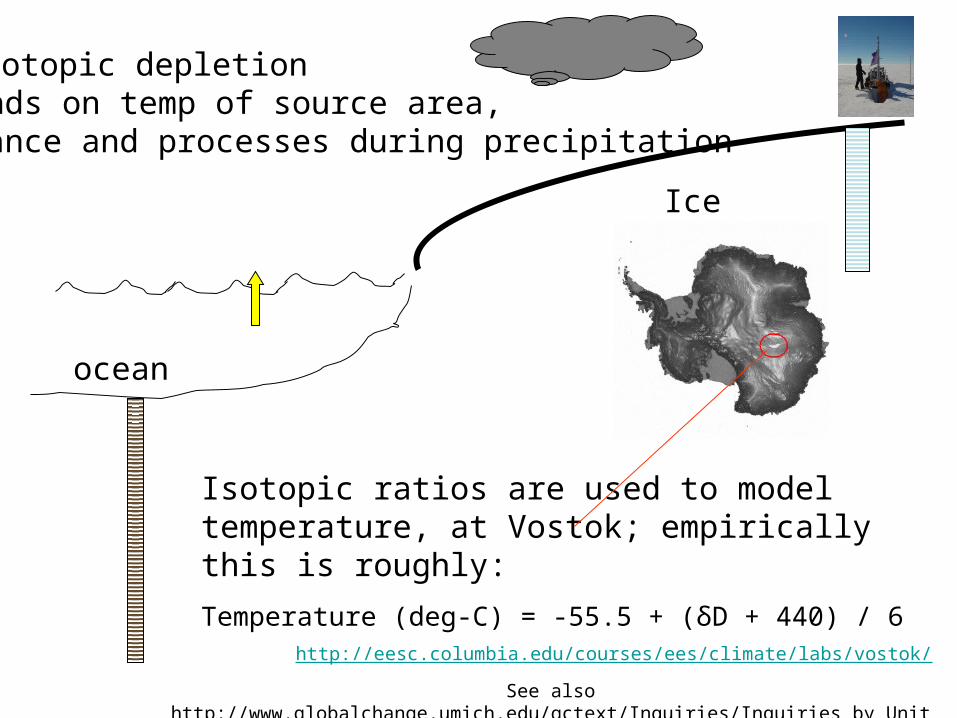
D isotopic depletiondepends on temp of source area,Distance and processes during precipitation
Isotopic ratios are used to model temperature, at Vostok; empirically this is roughly:
Temperature (deg-C) = -55.5 + (δD + 440) / 6
http://eesc.columbia.edu/courses/ees/climate/labs/vostok/
See also http://www.globalchange.umich.edu/gctext/Inquiries/Inquiries_by_Unit/Unit_8a.htm