Embed Size (px)
Citation preview
IOCCP-JAMSTEC 2015 Inter calibration exercise
ISBN 978-4-901833-23-3
+
IOCCP-JAMSTEC 2015 Inter-laboratory Calibration Exercise of a Certified Reference Material for Nutrients in
Seawater
Michio Aoyama, Mara Abad, Carol Anstey, Muhamed Ashraf P, Adil Bakir, Susan Becker, Steven Bell, Elisa Berdalet, Marguerite Blum, Rebecca Briggs, Florian Caradec, Thierry Cariou,
Matt Church, Laurent Coppola, Mike Crump, Susan Curless, Minhan Dai, Anne Daniel, Clare Davis, Elisabete de Santis Braga, Miriam E. Solis, Lindsey Ekern, David Faber,
Tamara Fraser, Kjell Gundersen, Sólvá Jacobsen, Marc Knockaert, Taketoshi Komada, Martina Kralj, Rita Kramer, Nurit Kress, Silvie Lainela, Jesús Ledesma, Xinxin Li,
Jae-Hyun Lim, Martina Lohmann, Christian Lønborg, Kai-Uwe Ludwichowski, Claire Mahaffey, Frank Malien, Francesca Margiotta, Trevor McCormack,
Iban Murillo, Hema Naik, Günther Nausch, Sólveig Rósa Ólafsdóttir, Jan van Ooijen, Rodolfo Paranhos, Chris Payne, Olivier Pierre-Duplessix, Gary Prove, Emilie Rabiller,
Patrick Raimbault, Laura Reed, Christine Rees, TaeKeun Rho, Raymond Roman, E. Malcolm S. Woodward, Jun Sun, Beata Szymczycha, Sukeyoshi Takatani, Alison Taylor, Peter Thamer, Sinhué Torres-Valdés, Katherine Trahanovsky, Howard Waldron, Pamela Walsham, Lifang Wang, Tao Wang, Linda White,
Takeshi Yoshimura, Jia-Zhong Zhang
Japan Agency for Marine-Earth Science and Technology
(JAMSTEC)
IOCCP Report Number 1/2016
June 2016

IOCCP-JAMSTEC 2015 Inter calibration exercise
Publisher
Japan Agency for Marine-Earth Science and Technology Yokosuka, 237-0061 Japan
June 2016
International Standard Book Number -13:
978-4-901833-23-3
3rd June 2016 Ver.0.0
13th July 2016 Ver.1.0
14th July 2016 Ver.1.1
IOCCP-JAMSTEC 2015 Inter calibration exercise
IOCCP-JAMSTEC 2015 Inter-laboratory Calibration Exercise of a Certified Reference Material for Nutrients in
Seawater
Michio Aoyama1*, Mara Abad2, Carol Anstey3, Muhamed Ashraf P4, Adil Bakir5, Susan Becker6, Steven Bell7, Elisa Berdalet2, Marguerite Blum8, Rebecca Briggs9,
Florian Caradec10, Thierry Cariou11, Matt Church12, Laurent Coppola13, Mike Crump14, Susan Curless12, Minhan Dai15, Anne Daniel10, Clare Davis16,
Elisabete de Santis Braga17, Miriam E. Solis18, Lindsey Ekern19, David Faber19, Tamara Fraser20, Kjell Gundersen21, Sólvá Jacobsen22, Marc Knockaert23, Taketoshi Komada24, Martina Kralj25, Rita Kramer26, Nurit Kress27, Silvie Lainela28, Jesús Ledesma29, Xinxin Li30,
Jae-Hyun Lim31, Martina Lohmann32, Christian Lønborg33, Kai-Uwe Ludwichowski34, Claire Mahaffey16, Frank Malien32, Francesca Margiotta35, Trevor McCormack36,
Iban Murillo37, Hema Naik38, Günther Nausch39, Sólveig Rósa Ólafsdóttir40, Jan van Ooijen41, Rodolfo Paranhos42, Chris Payne43, Olivier Pierre-Duplessix44,
Gary Prove45, Emilie Rabiller44, Patrick Raimbault46, Laura Reed47, Christine Rees3, TaeKeun Rho48, Raymond Roman49, E. Malcolm S. Woodward50, Jun Sun51, Beata Szymczycha52, Sukeyoshi Takatani53, Alison Taylor54, Peter Thamer55, Sinhué Torres-Valdés56, Katherine Trahanovsky57, Howard Waldron49, Pamela Walsham54, Lifang Wang15, Tao Wang15, Linda White58,
Takeshi Yoshimura59, Jia-Zhong Zhang60
1 RCGC,JAMSTEC/IOCCP SSG/Co-chair of the SCOR WG#147/IER, Fukushima Univ., Japan, Japan
2 Institut de Ciències del Mar (ICM-CSIC), Barcelona, Spain 3 R/V INVESTIGATOR, CSIRO Marine and Atmospheric Research, Australia 4 Central Institute of Fisheries Technology, India 5 School of Earth and Environmental Science,University of Portsmouth, UK 6 Scripps Institution of Oceanography, USA 7 Bermuda Institute of Ocean Sciences, Bermuda 8 Monterey Bay Aquarium Research Institute, USA 9 University of Hawaii, SOEST Laboratory for Analytical Biogeochemistry (S-
LAB), USA
10 Ifremer, DYNECO/PELAGOS, Plouzané, France 11 Station Biologique de Roscoff, Centre national de la recherche scientifique
(CNRS) / Université Pierre et Marie Curie, France
12 Hawaii Ocean Time-series, USA 13 Observatoire oceanologique de Villefranche-sur-Mer (CNRS-UPMC), France 14 National Institute of Water and Atmospheric Research (NIWA), New Zealand
IOCCP-JAMSTEC 2015 Inter calibration exercise
15 State Key laboratory of Marine Environmental Science, Xiamen University, China16 Department of Earth, Ocean and Ecological Sciences, SOES, University of
Liverpool, UK
17 Laboratório de Nutrientes, Micronutrientes e Traços nos Oceanos (LABNUT-IOUSP), Instituto Oceanográfico da Universidade de São Paulo, Brazil
18 LOQyCA - Centro Nacional Patagonico (CONICET), Argentina 19 Scripps Institution of Oceanography, CalCOFI Group, UC San Diego, USA 20 Department of Fisheries and Oceans Canada, Institute of Ocean Sciences, Canada 21 Kjemilaboratoriet / Chemistry Laboratory, Havforskningsinstituttet / Institute of
Marine Research, Norway
22 Faroe Marine Research Institute, Faroe Islands 23 OD NATURE – ECOCHEM, Belgium 24 Japan Sea National Fisheries Research Institute, Japan Fisheries Research and
Education Agency, Japan
25 Istituto Nazionale di Oceanografia e Geofisica Sperimentale, Italy 26 Bundesamt für Seeschifffahrt und Hydrographie (BSH), Laboratorium Sülldorf,
Germany
27 Israel Oceanographic & Limnological Res, National Institute of Oceanography, Israel
28 University of Tartu, Estonian Marine Institute, Estonia 29 Instituto del Mar del Perú, Peru 30 Geochemical & Environmental Research Group, Texas A&M University, USA 31 Marine Environment Research Division, National Institute of Fisheries Science,
Republic of Korea
32 GEOMAR Helmholtz Center for Ocean Research, Kiel, Germany 33 Australian Institute of Marine Science, Australia 34 Alfred-Wegener-Institute; Helmholtz Centre for Polar and Marine Research,
Germany
35 Stazione Zoologica Anton Dohrn, Italy 36 Scottish Environment Protection Agency, UK 37 Centro de Investigaciones Biológicas del, Noroeste SC., Mexico 38 National Institute of Oceanography, India 39 Leibniz-Institute for Baltic Sea Research Warnemünde (IOW), Germany 40 Marine Research Institute, Iceland 41 Royal NIOZ, Netherlands 42 Institute of Biology, Rio de Janeiro Federal University, Brazil 43 University of British Columbia, Department of Earth, Ocean & Atmospheric
Sciences, Canada
44 Ifremer, LERN, Port en Bessin, France 45 Queensland Health Forensic and Scientific Services, Australia 46 Mediterranean Institute of Oceanology (MIO) Campus de Luminy, France 47 URI/Grad. School of Oceanography, USA
IOCCP-JAMSTEC 2015 Inter calibration exercise
48 Oceanographic Measurement & Instrument Calibration Service Center (OMICS)/Korea Institute of Ocean Science & Technology, Republic of Korea
49 University of Cape town, Dept of Oceanography, South Africa 50 Plymouth Marine Laboratory, UK 51 College of Marine and Environmental Sciences, Tianjin University of Science and
Technology, China
52 Institute of Oceanology Polish Academy of Sciences, Marine Chemistry and Biochemistry Department, Poland
53 Japan Meteorological Agency, Japan 54 Marine Scotland - Science, UK 55 Department of Fisheries and Oceans Canada, Canada 56 National Oceanography Centre, Southampton, UK 57 School of Fisheries and Ocean Sciences (SFOS)
University of Alaska Fairbanks (UAF), USA
58 Department of Fisheries and Oceans Canada, Institute of Ocean Sciences, Canada 59 Environmental Science Research Laboratory, Central Research Institute of Electric
Power Industry, Japan
60 NOAA Atlantic Oceanographic and Meteorological Laboratory (AOML), Miami, Florida, USA
*The coordinator
IOCCP-JAMSTEC 2015 Inter calibration exercise
Dummy
IOCCP-JAMSTEC 2015 Inter calibration exercise
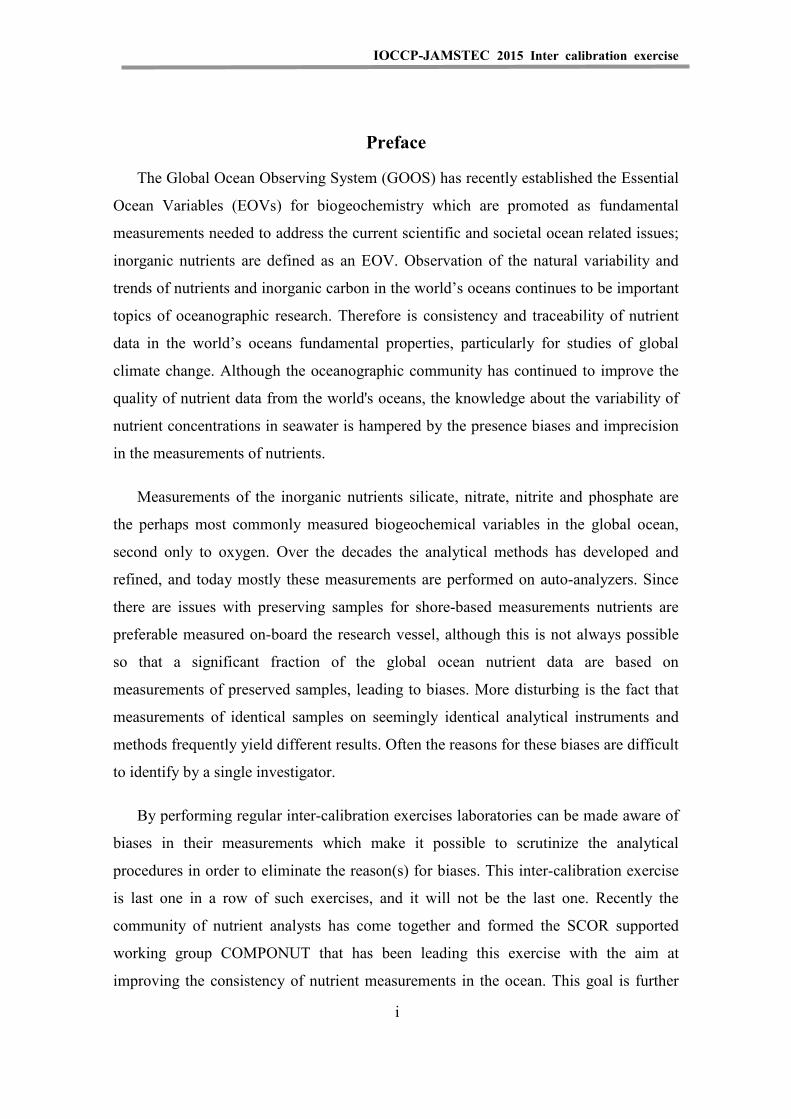
Preface
The Global Ocean Observing System (GOOS) has recently established the Essential
Ocean Variables (EOVs) for biogeochemistry which are promoted as fundamental
measurements needed to address the current scientific and societal ocean related issues;
inorganic nutrients are defined as an EOV. Observation of the natural variability and
trends of nutrients and inorganic carbon in the world’s oceans continues to be important
topics of oceanographic research. Therefore is consistency and traceability of nutrient
data in the world’s oceans fundamental properties, particularly for studies of global
climate change. Although the oceanographic community has continued to improve the
quality of nutrient data from the world's oceans, the knowledge about the variability of
nutrient concentrations in seawater is hampered by the presence biases and imprecision
in the measurements of nutrients.
Measurements of the inorganic nutrients silicate, nitrate, nitrite and phosphate are
the perhaps most commonly measured biogeochemical variables in the global ocean,
second only to oxygen. Over the decades the analytical methods has developed and
refined, and today mostly these measurements are performed on auto-analyzers. Since
there are issues with preserving samples for shore-based measurements nutrients are
preferable measured on-board the research vessel, although this is not always possible
so that a significant fraction of the global ocean nutrient data are based on
measurements of preserved samples, leading to biases. More disturbing is the fact that
measurements of identical samples on seemingly identical analytical instruments and
methods frequently yield different results. Often the reasons for these biases are difficult
to identify by a single investigator.
By performing regular inter-calibration exercises laboratories can be made aware of
biases in their measurements which make it possible to scrutinize the analytical
procedures in order to eliminate the reason(s) for biases. This inter-calibration exercise
is last one in a row of such exercises, and it will not be the last one. Recently the
community of nutrient analysts has come together and formed the SCOR supported
working group COMPONUT that has been leading this exercise with the aim at
improving the consistency of nutrient measurements in the ocean. This goal is further
i

IOCCP-JAMSTEC 2015 Inter calibration exercise
supported by the International Ocean Carbon Coordination Project (IOCCP) that,
although historically focused on ocean carbon, realize that consistent nutrient data is
key to understand changes in ocean biogeochemistry in the Anthropocene. We hope that
the results of this inter-calibration exercise will be one step toward increased
consistency in ocean nutrient data.
Toste Tanhua Chair of IOCCP GEOMAR Helmholtz Centre for Ocean Research Kiel Marine Biogeochemistry Düsternbrooker Weg 20, D-24105 Kiel, Germany
ii
IOCCP-JAMSTEC 2015 Inter calibration exercise
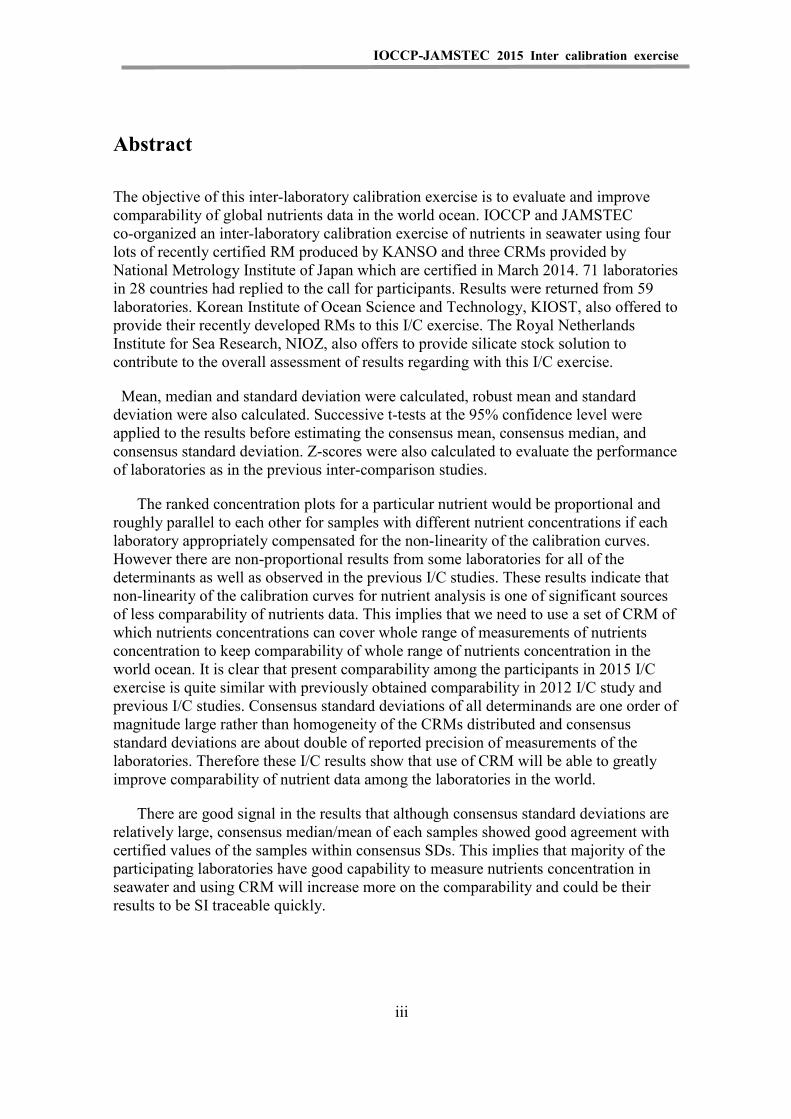
Abstract
The objective of this inter-laboratory calibration exercise is to evaluate and improve comparability of global nutrients data in the world ocean. IOCCP and JAMSTEC co-organized an inter-laboratory calibration exercise of nutrients in seawater using four lots of recently certified RM produced by KANSO and three CRMs provided by National Metrology Institute of Japan which are certified in March 2014. 71 laboratories in 28 countries had replied to the call for participants. Results were returned from 59 laboratories. Korean Institute of Ocean Science and Technology, KIOST, also offered to provide their recently developed RMs to this I/C exercise. The Royal Netherlands Institute for Sea Research, NIOZ, also offers to provide silicate stock solution to contribute to the overall assessment of results regarding with this I/C exercise.
Mean, median and standard deviation were calculated, robust mean and standard deviation were also calculated. Successive t-tests at the 95% confidence level were applied to the results before estimating the consensus mean, consensus median, and consensus standard deviation. Z-scores were also calculated to evaluate the performance of laboratories as in the previous inter-comparison studies.
The ranked concentration plots for a particular nutrient would be proportional and roughly parallel to each other for samples with different nutrient concentrations if each laboratory appropriately compensated for the non-linearity of the calibration curves. However there are non-proportional results from some laboratories for all of the determinants as well as observed in the previous I/C studies. These results indicate that non-linearity of the calibration curves for nutrient analysis is one of significant sources of less comparability of nutrients data. This implies that we need to use a set of CRM of which nutrients concentrations can cover whole range of measurements of nutrients concentration to keep comparability of whole range of nutrients concentration in the world ocean. It is clear that present comparability among the participants in 2015 I/C exercise is quite similar with previously obtained comparability in 2012 I/C study and previous I/C studies. Consensus standard deviations of all determinands are one order of magnitude large rather than homogeneity of the CRMs distributed and consensus standard deviations are about double of reported precision of measurements of the laboratories. Therefore these I/C results show that use of CRM will be able to greatly improve comparability of nutrient data among the laboratories in the world.
There are good signal in the results that although consensus standard deviations are relatively large, consensus median/mean of each samples showed good agreement with certified values of the samples within consensus SDs. This implies that majority of the participating laboratories have good capability to measure nutrients concentration in seawater and using CRM will increase more on the comparability and could be their results to be SI traceable quickly.
iii
IOCCP-JAMSTEC 2015 Inter calibration exercise
Contents
1. Introduction ................................................................................................................... 12. Preparation and samples ................................................................................................ 33. Participants and response............................................................................................... 64. Statistical treatment ....................................................................................................... 8
4.1 Raw mean, median, and standard deviation .......................................................... 8
4.2 Robust statistics ..................................................................................................... 8
4.3 Consensus mean, median, and standard deviation ................................................. 8
4.4 Calculation of Z-scores .......................................................................................... 8
5. Results 135.1 Ranked scatter-plots of the results ....................................................................... 13
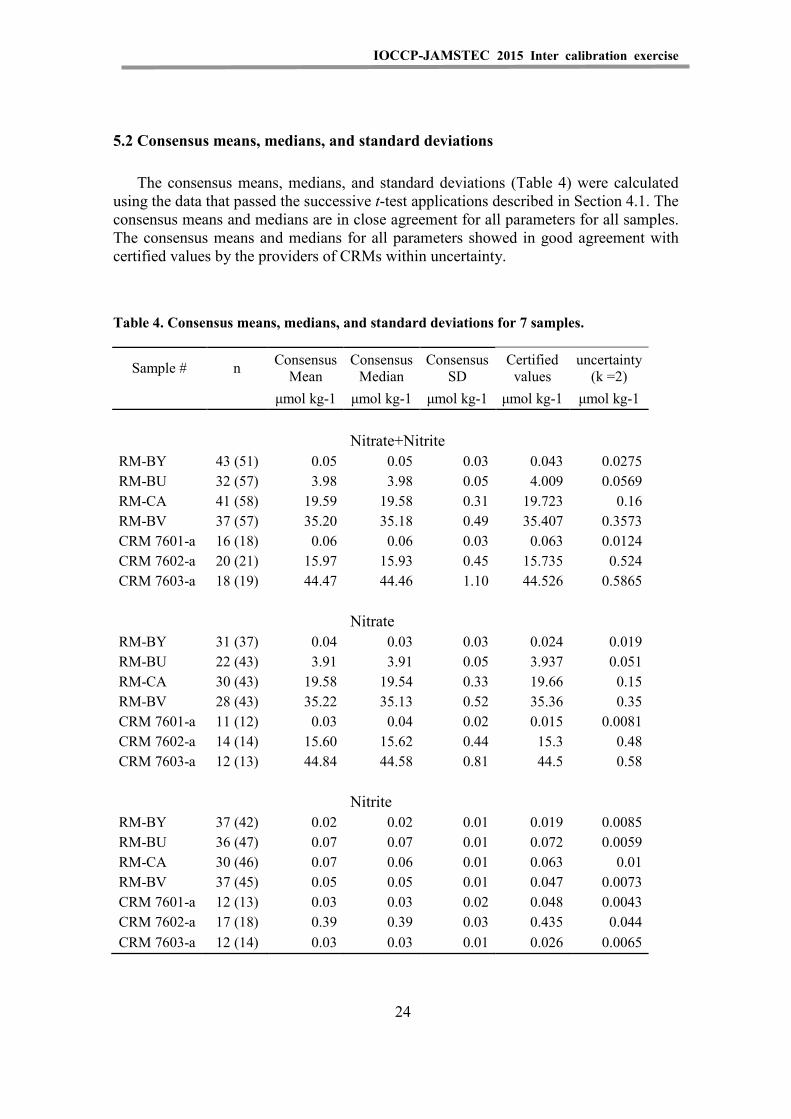
5.2 Consensus means, medians, and standard deviations .......................................... 24
5.3 Summary of analytical precision of participating laboratories and consensus standard deviation ............................................................................................... 26
5.4 Z-scores ................................................................................................................ 29
5.5 Normalized Cumulative distribution of reported nitrate, phosphate and silicate concentrations in 2008, 2012 and 2015 I/C studies ............................... 44
6. Comparison with certified values ................................................................................ 467. Discussion and conclusions ......................................................................................... 46Acknowledgements ......................................................................................................... 46 References ....................................................................................................................... 47
Appendix I List of participants
Appendix II Results reported from participants
Appendix III Cross reference table of ranked order and Lab #
Appendix IV Invitation letter to 2015 I/C exercise
Appendix V Results of KIOST RMs
Appendix VI History of Inter-comparison studies
iv

IOCCP-JAMSTEC 2015 Inter calibration exercise
List of Tables and Figures
Tables
Table1. Certified values of four lots of CRM provided by KANSO, RM-BY, -BU, Ca and BV and three lots of CRM provided by NMIJ, CRM 7601-a, 7602-a and 7603-a, respectively. .......................................................... 4
Table 2. Summary of responses from participants. ........................................................... 6 Table 3. Raw and robust statistics for nutrient concentrations calculated using all
reported values. ................................................................................................ 10 Table 4. Consensus means, medians, and standard deviations for 7 samples. ................ 24 Table 5-1.Median and range of analytical precision of participating laboratories,
and consensus coefficient of variation for analyses of nutrients in RM-BY. ........................................................................................................... 26
Table 5-2.Median and range of analytical precision of participating laboratories, and consensus coefficient of variation for analyses of nutrients in RM-BU. ........................................................................................................... 26
Table 5-3.Median and range of analytical precision of participating laboratories, and consensus coefficient of variation for analyses of nutrients in RM-CA. ........................................................................................................... 27
Table 5-4.Median and range of analytical precision of participating laboratories, and consensus coefficient of variation for analyses of nutrients in RM-BV. ........................................................................................................... 27
Table 5-5.Median and range of analytical precision of participating laboratories, and consensus coefficient of variation for analyses of nutrients in CRM 7601-a. ................................................................................................... 27
Table 5-6. Median and range of analytical precision of participating laboratories, and consensus coefficient of variation for analyses of nutrients in CRM 7602-a. ................................................................................................... 28
Table 5-7. Median and range of analytical precision of participating laboratories, and consensus coefficient of variation for analyses of nutrients in CRM 7603-a. ................................................................................................... 28
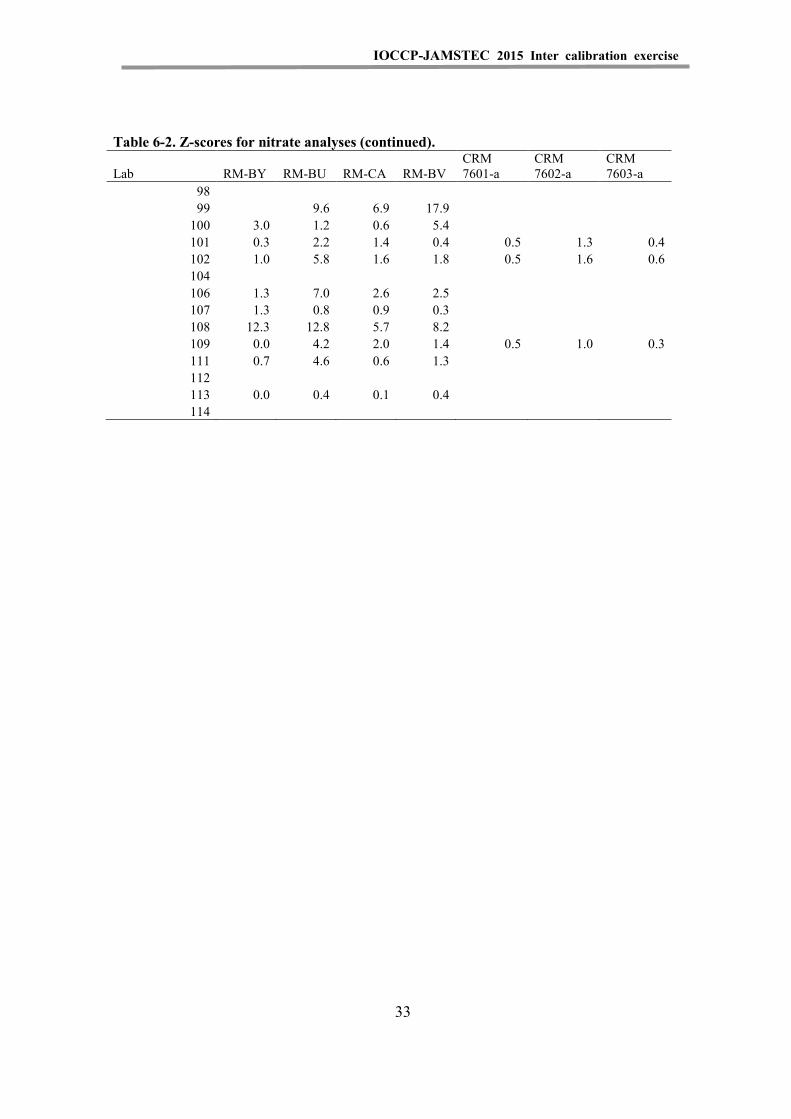
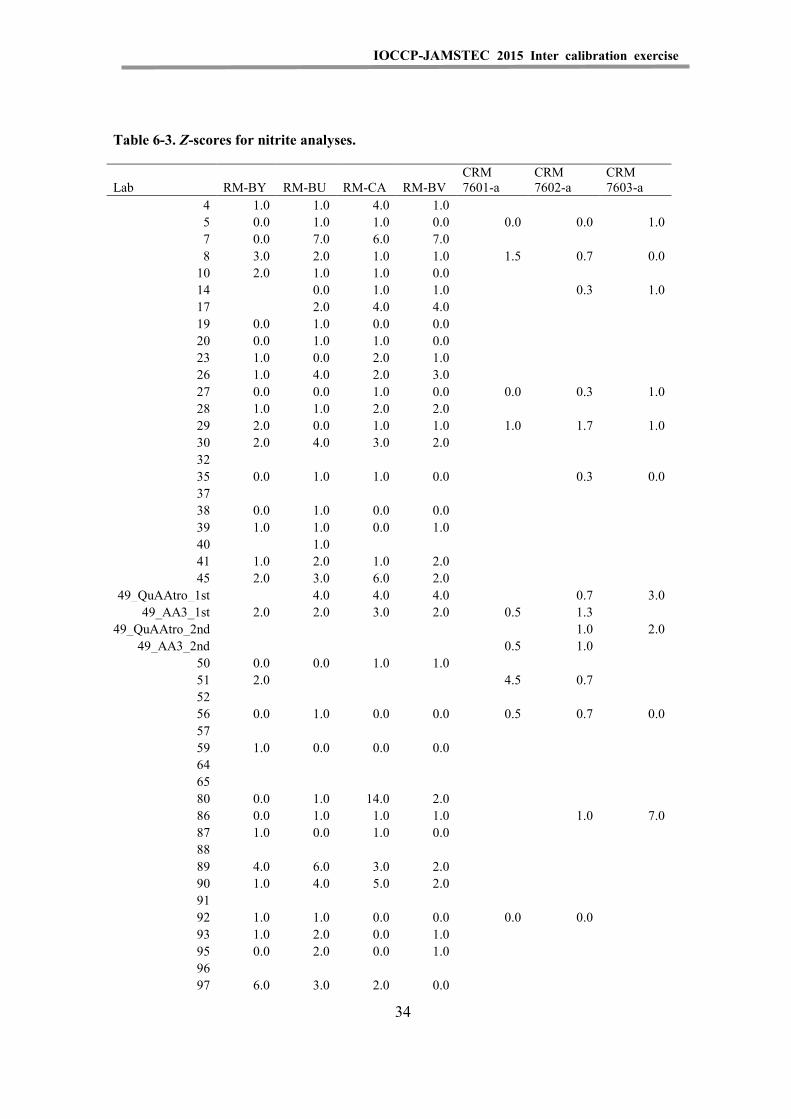
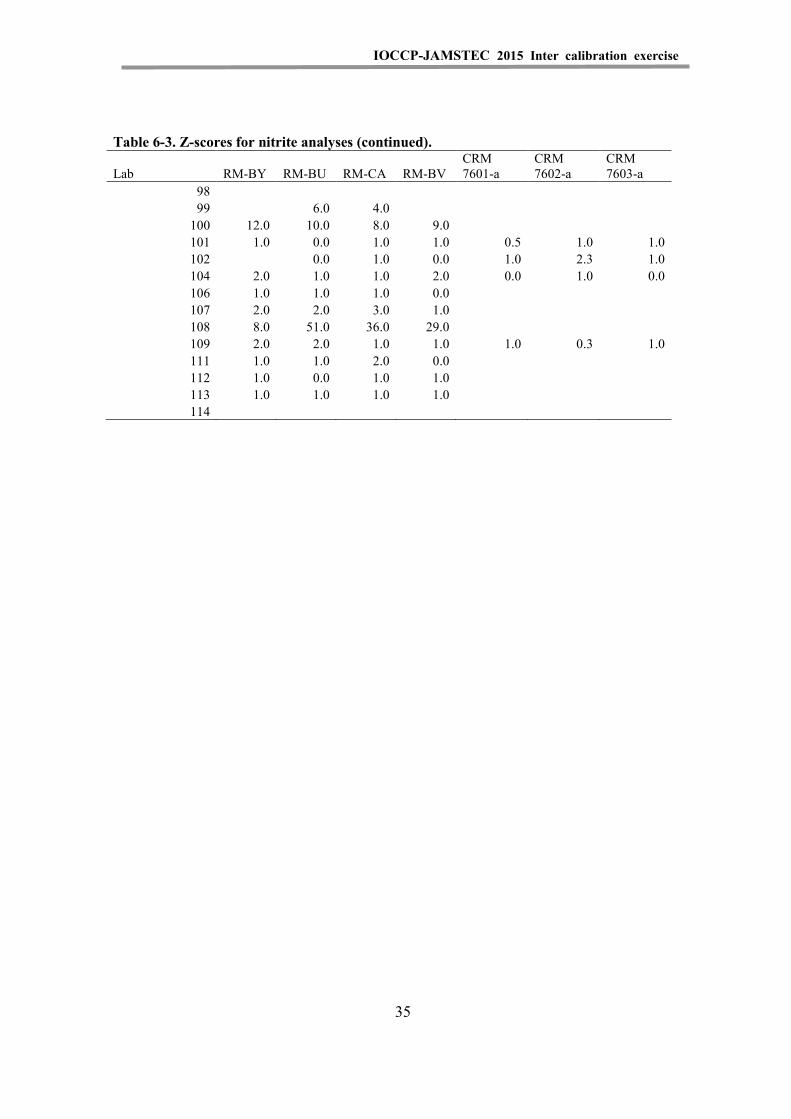
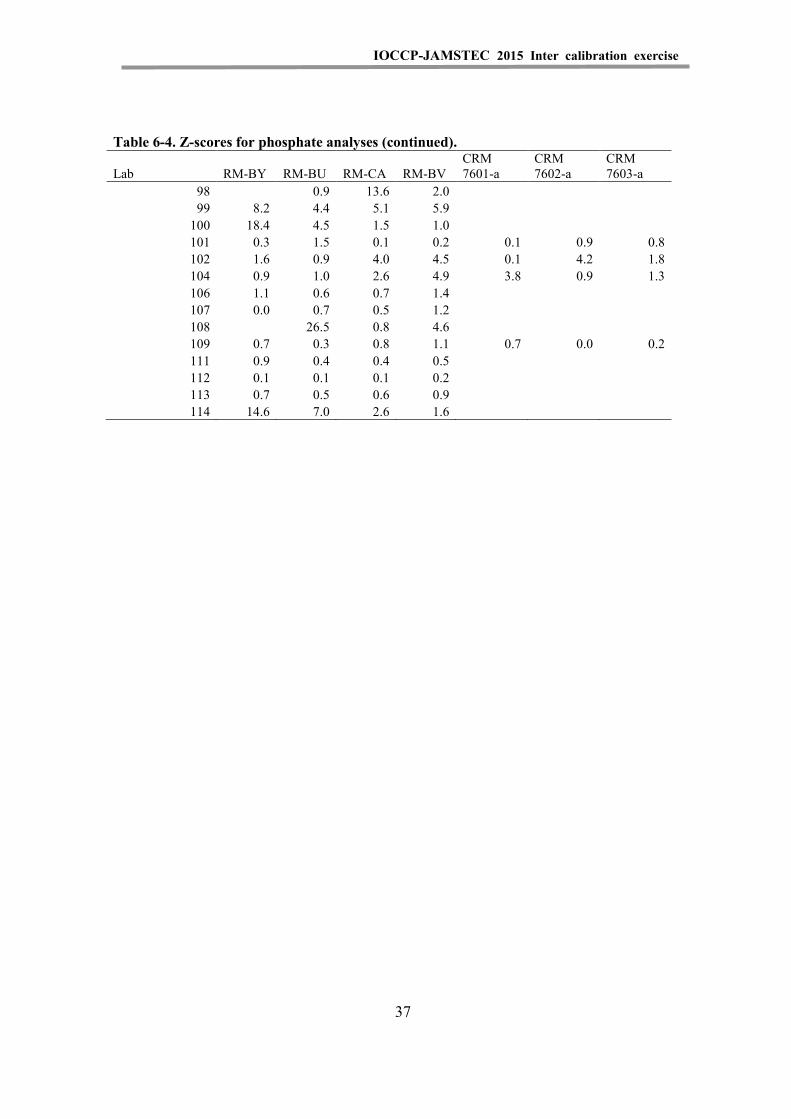
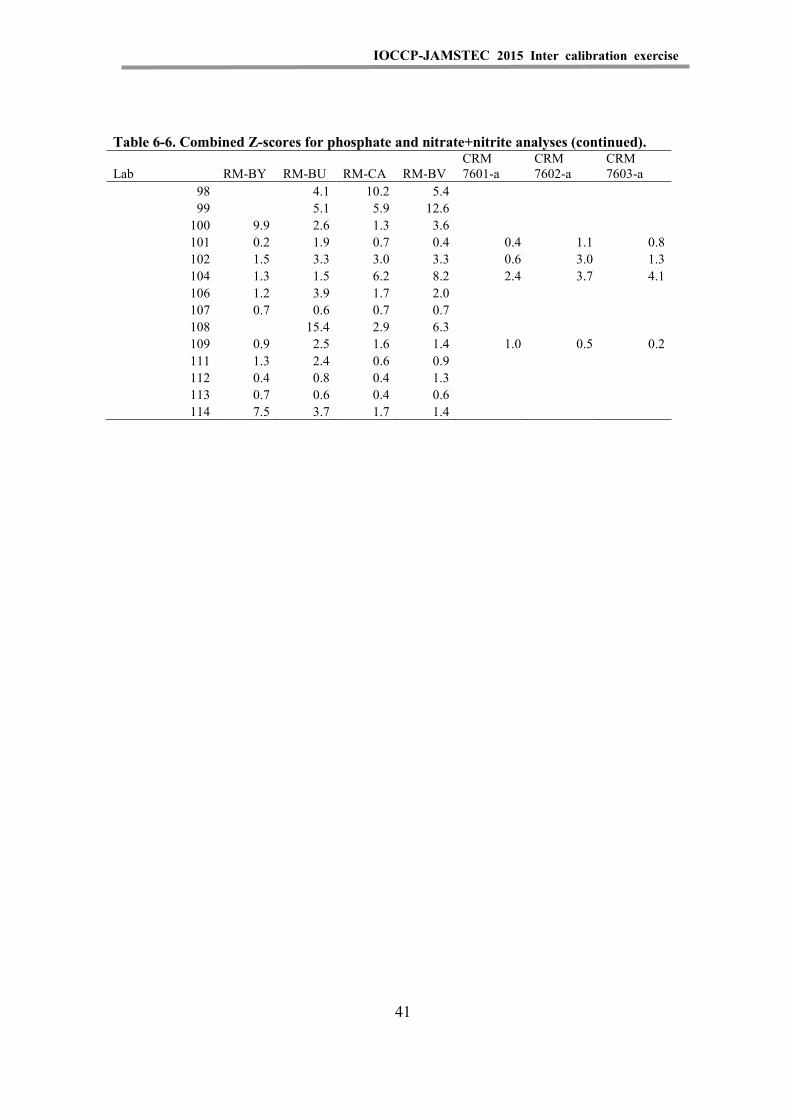
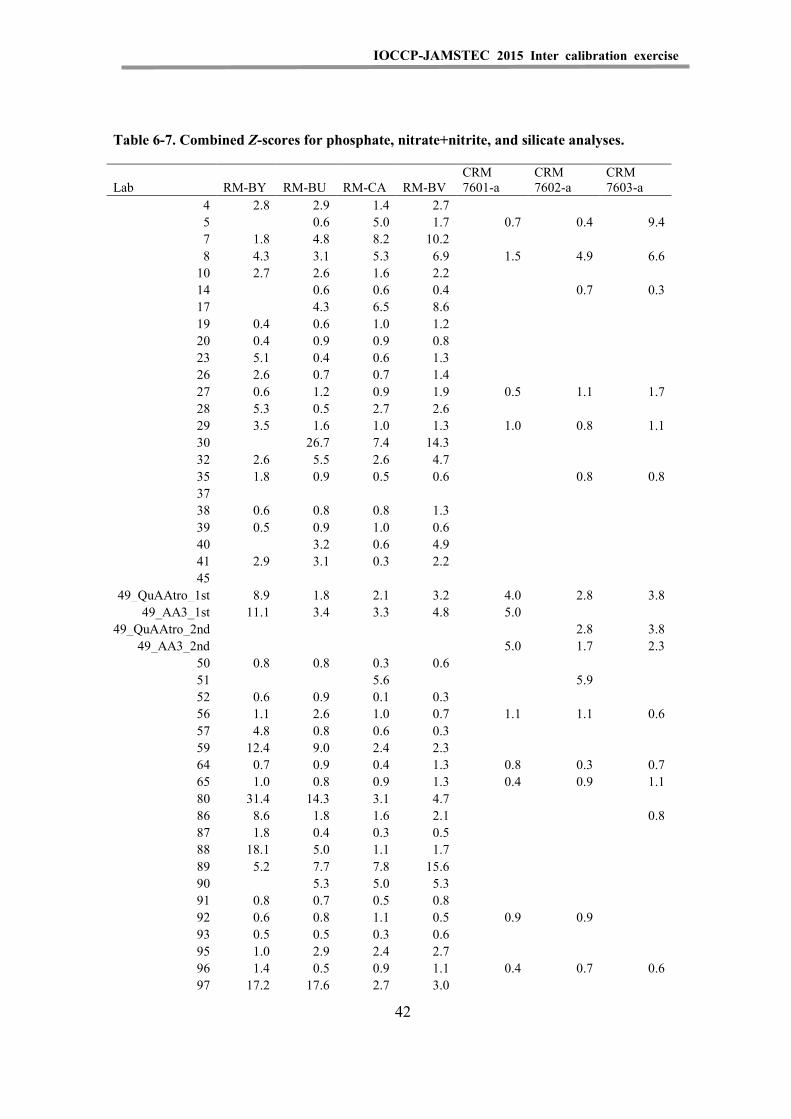
Table 6-1. Z-scores for nitrate+nitrite analyses. .............................................................. 30 Table 6-2. Z-scores for nitrate analyses. .......................................................................... 32 Table 6-3. Z-scores for nitrite analyses. .......................................................................... 34 Table 6-4. Z-scores for phosphate analyses. .................................................................... 36 Table 6-5. Z-scores for silicate analyses. ......................................................................... 38 Table 6-6. Combined Z-scores for phosphate and nitrate+nitrite analyses. .................... 40 Table 6-7. Combined Z-scores for phosphate, nitrate+nitrite, and silicate
analyses. ........................................................................................................... 42
v
IOCCP-JAMSTEC 2015 Inter calibration exercise
Figures
Figure 1-1. Nitrate+Nitrite results for KANSO CRMs. Laboratories are ranked in order of concentrations reported for RM-BV. ............................................. 14
Figure 1-2. Nitrate+Nitrite results for NMIJ CRMs. Laboratories are ranked in order of concentrations reported for CRM 7603-a. ......................................... 15
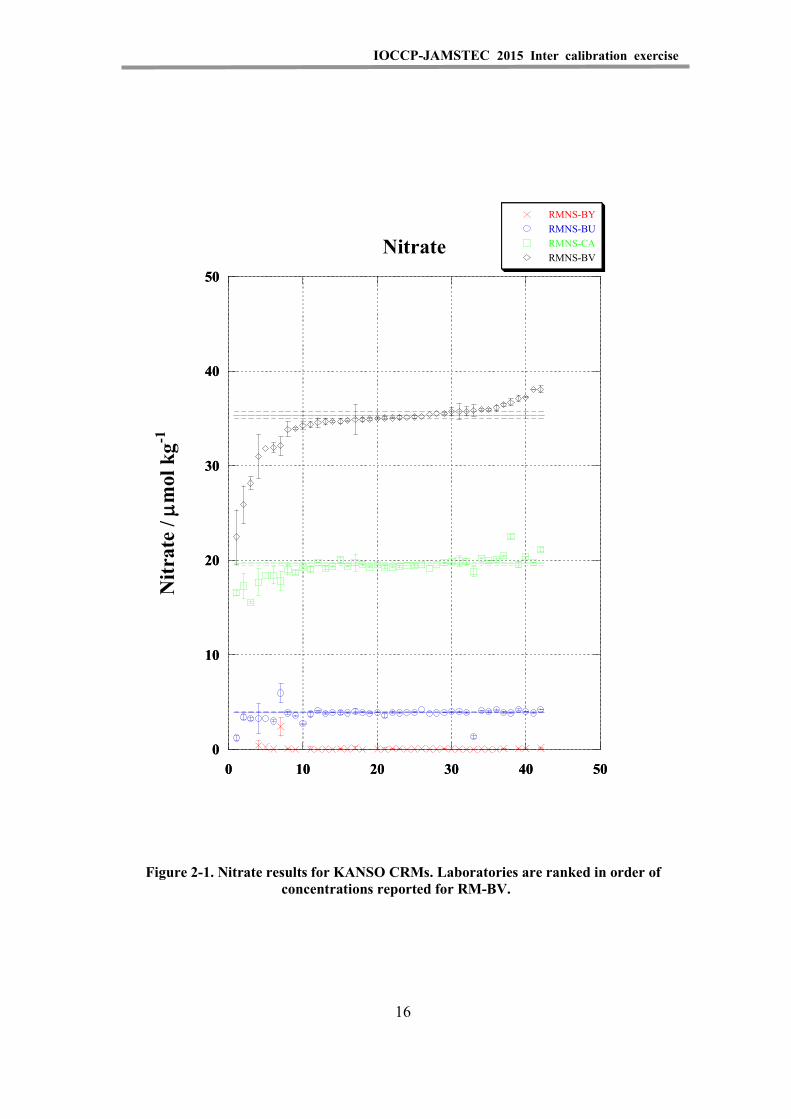
Figure 2-1. Nitrate results for KANSO CRMs. Laboratories are ranked in order of concentrations reported for RM-BV. .......................................................... 16
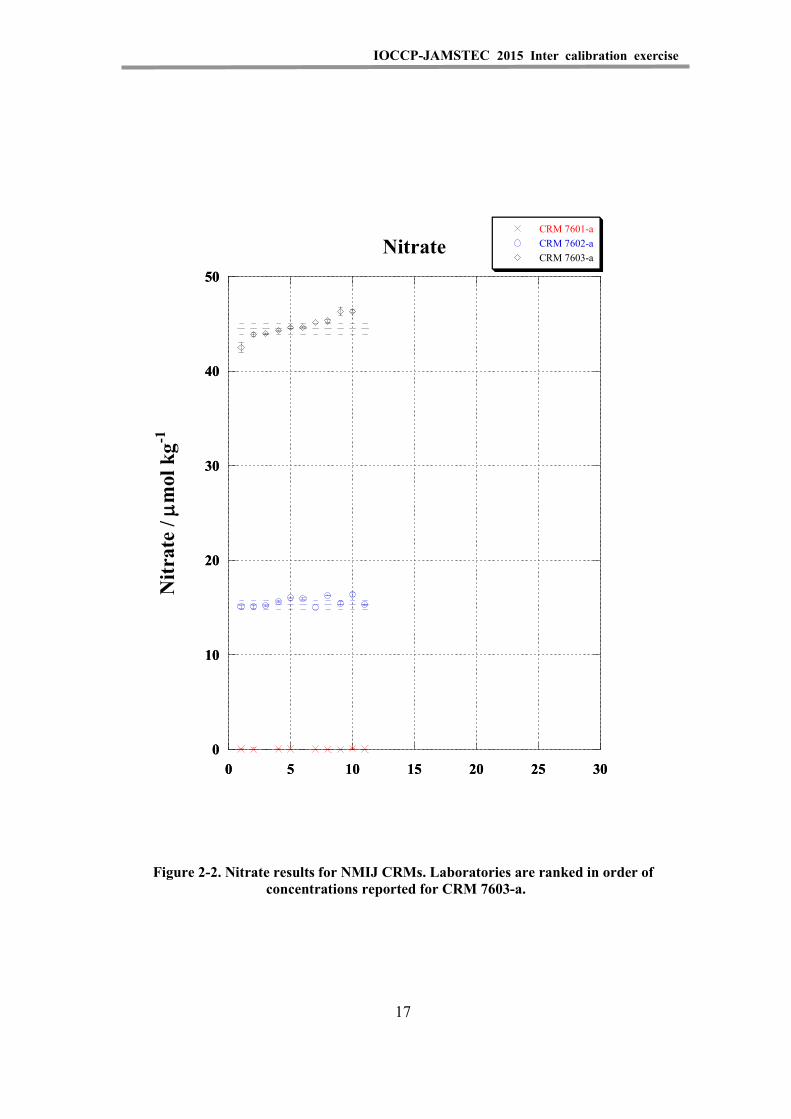
Figure 2-2. Nitrate results for NMIJ CRMs. Laboratories are ranked in order of concentrations reported for CRM 7603-a. ....................................................... 17
Figure 3-1. Nitrite results for KANSO CRMs. Laboratories are ranked in order of concentrations reported for RM-BU. .......................................................... 18
Figure 3-2. Nitrite results for NMIJ CRMs. Laboratories are ranked in order of concentrations reported for CRM 7602-a. ....................................................... 19
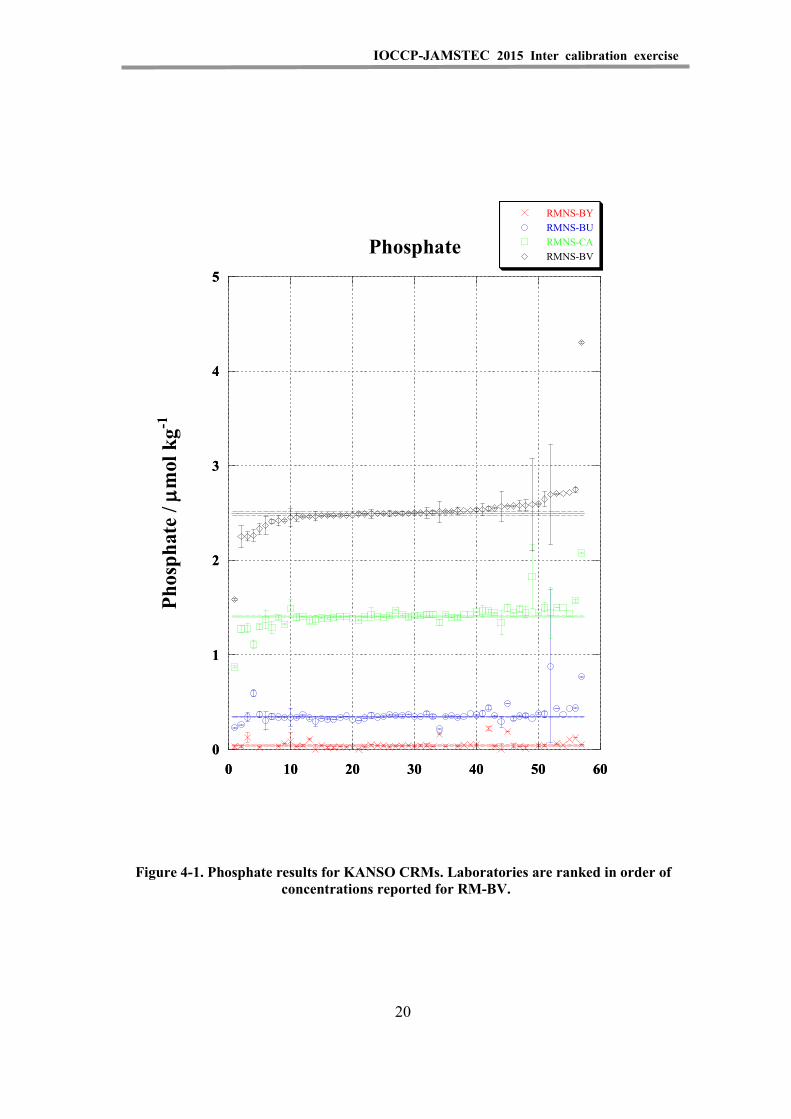
Figure 4-1. Phosphate results for KANSO CRMs. Laboratories are ranked in order of concentrations reported for RM-BV. ................................................. 20
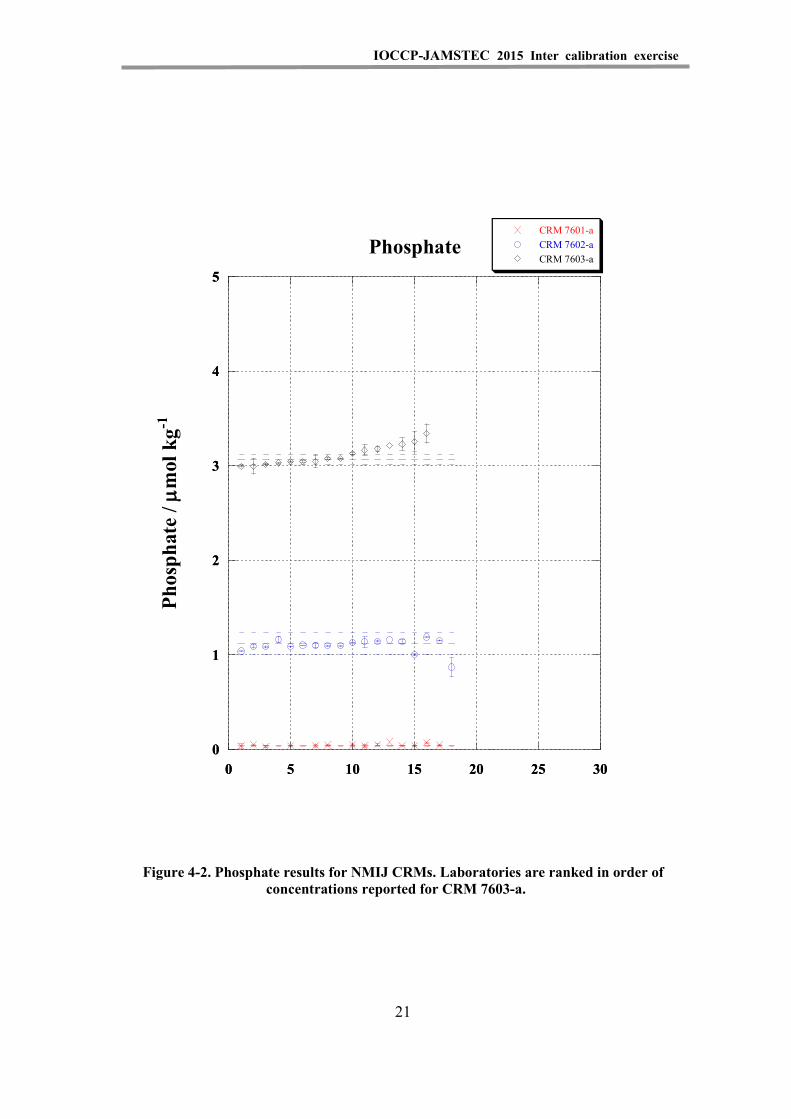
Figure 4-2. Phosphate results for NMIJ CRMs. Laboratories are ranked in order of concentrations reported for CRM 7603-a. .................................................. 21
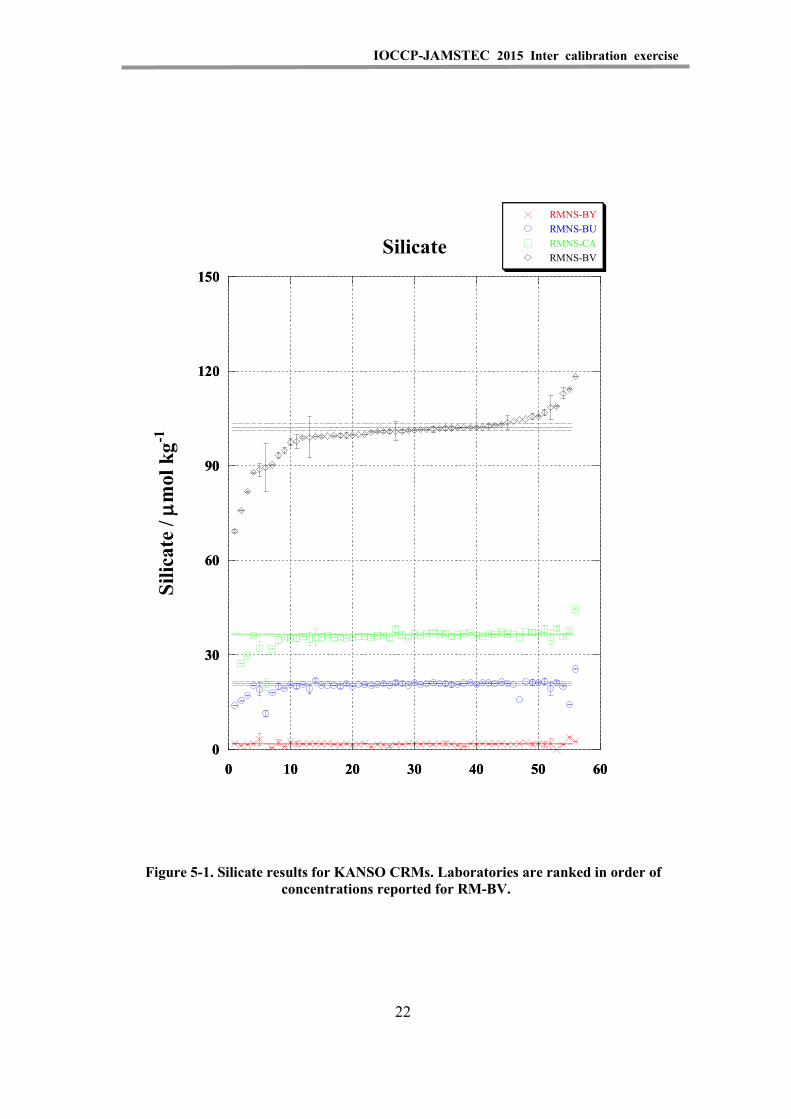
Figure 5-1. Silicate results for KANSO CRMs. Laboratories are ranked in order of concentrations reported for RM-BV. .......................................................... 22
Figure 5-2. Silicate results for NMIJ CRMs. Laboratories are ranked in order of concentrations reported for CRM 7603-a. ....................................................... 23
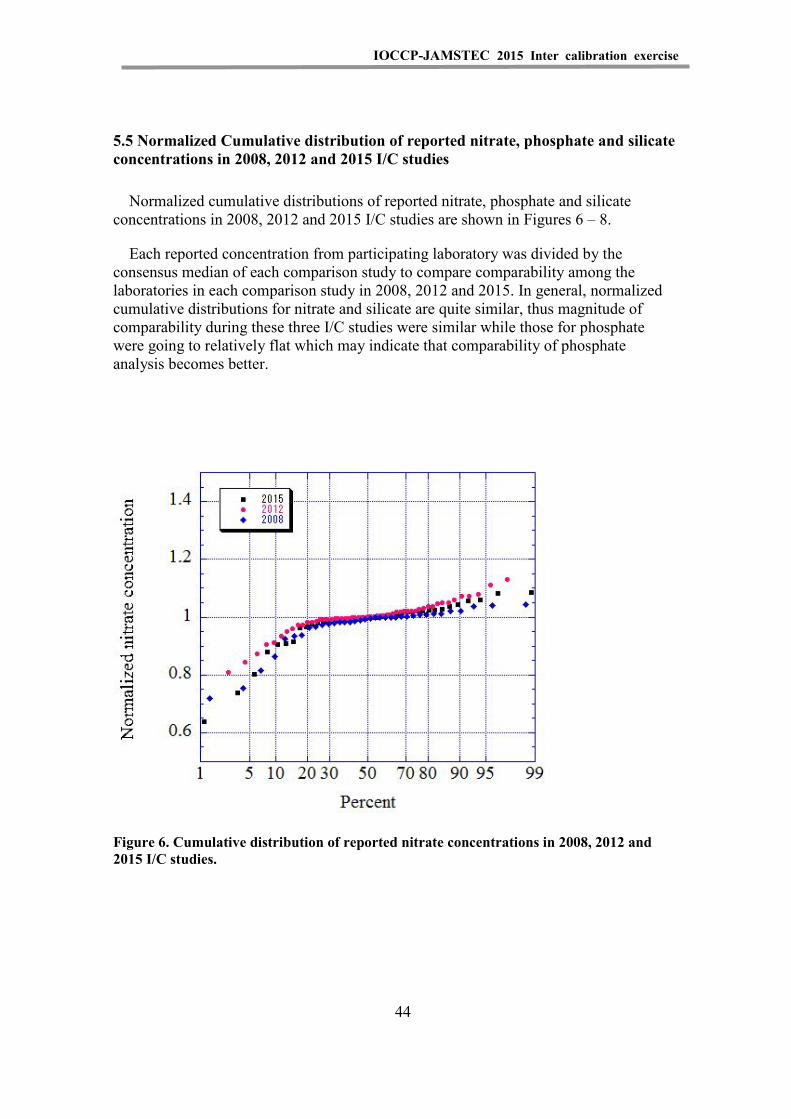
Figure 6. Cumulative distribution of reported nitrate concentrations in 2008, 2012 and 2015 I/C studies. .............................................................................. 44
Figure 7. Cumulative distribution of reported phosphate concentrations in 2008, 2012 and 2015 I/C studies. .............................................................................. 45
Figure 8. Cumulative distribution of reported silicate concentrations in 2008, 2012 and 2015 I/C studies. .............................................................................. 45
ⅵ
IOCCP-JAMSTEC 2015 Inter calibration exercise
1. Introduction
The objective of this inter-laboratory calibration exercise is to evaluate and improve comparability of global nutrients data in the world ocean.
In 2003, 2006, 2008 and 2012, inter-laboratory comparison studies of Reference Material of Nutrients in Seawater, RMNS, were conducted by M. Aoyama at Meteorological Research Institute, Japan and collaborators (Aoyama, 2006, Aoyama et al., 2007, 2008, 2012 in preparation). Firstly, nutrient concentrations of the distributed samples were set to cover the concentration range of nutrients in the Pacific Ocean, which has the highest nutrient concentrations among the open oceans of the world. Second, the distributed samples were prepared in a natural seawater matrix in a single bottle so that four determinands (nitrate, nitrite, phosphate, and silicate) could be simultaneously analyzed.
Results obtained in several previous inter-laboratory comparison studies indicated that variability in in-house standards of the participating laboratories and handling of non-linearity of the instruments of the participating laboratories are the primary sources of inter-laboratory discrepancy. Therefore it is obvious that the use of a certified reference material for nutrients in seawater, CRMs, and the common use of the methodology of nutrients measurements are essential to improve and establish global comparability and traceability of nutrient data in the world ocean.
In 2014, the SCOR WG 147 “Towards comparability of global oceanic nutrient data (COMPONUT)”, co-chaired by Michio Aoyama (Japan) and Malcolm Woodward (UK), started to establish mechanisms to ensure comparability of oceanic nutrient data. It will assess the homogeneity and stability of currently available reference materials (RMs) for nutrients. Standardized data-handling procedures will be developed, with common data vocabularies and formats, across producers and users, linking national and international data archives. The group will also promote the wider global use of RMs by convening workshops to actively encourage their use and to provide training in analytical protocols and best practices, particularly targeted towards developing countries. One of the important tasks of this working group is to continue regular global inter-comparison studies, following on from the previous exercises in 2003, 2006, 2008 and 2012.
1

IOCCP-JAMSTEC 2015 Inter calibration exercise
This page left intentionally blank
2
IOCCP-JAMSTEC 2015 Inter calibration exercise
2. Preparation and samples
In 2014, IOCCP and JAMSTEC co-organized an inter-laboratory calibration exercise of nutrients in seawater collaborating with the SCOR WG #147. A list of candidate of participants was prepared based on the laboratories which participated previous inter-laboratory calibration exercise and some candidates were newly added by the information of the SCOR WG147 members and IOCCP SSG members. Finally the invitation letter (Appendix IV) was sent to 92 laboratories.
In this inter-laboratory calibration exercise we use four lots of recently certified RM produced by KANSO, former RMNS produced by KANSO which already shows excellent homogeneity of 0.2 % and the concentrations of nitrate, phosphate and silicate did not change more than 1.0 % during 6.4 years and by the criterion of the ISO Guide 35:2006 there were no instability of the RMs nutrients concentration (Aoyama et al., 2012), and three CRMs provided by National Metrology Institute of Japan which are certified in March 2014.
Certified values of seven CRMs as samples of this inter-laboratory calibration exercise are shown in Table 1.
Korean Institute of Ocean Science and Technology, KIOST, also offered to provide their recently developed RMs to this I/C exercise. The Royal Netherlands Institute for Sea Research, NIOZ, also offers to provide silicate stock solution to contribute to the overall assessment of results regarding with this I/C exercise.
Therefore a set of four samples of CRMs was distributed to all 71 participating laboratories around the globe (28 countries) in charge of free, and some combination of three lots of NMIJ CRM were distributed to 21 laboratories who agree to pay for them. Korean RMs were also distributed to 24 voluntary laboratories who agreed to analyses them. NIOZ stock solutions were sent to selected laboratories who are working on deep water samples and agree to analyses this silicate stock solution.
3
IOCCP-JAMSTEC 2015 Inter calibration exercise
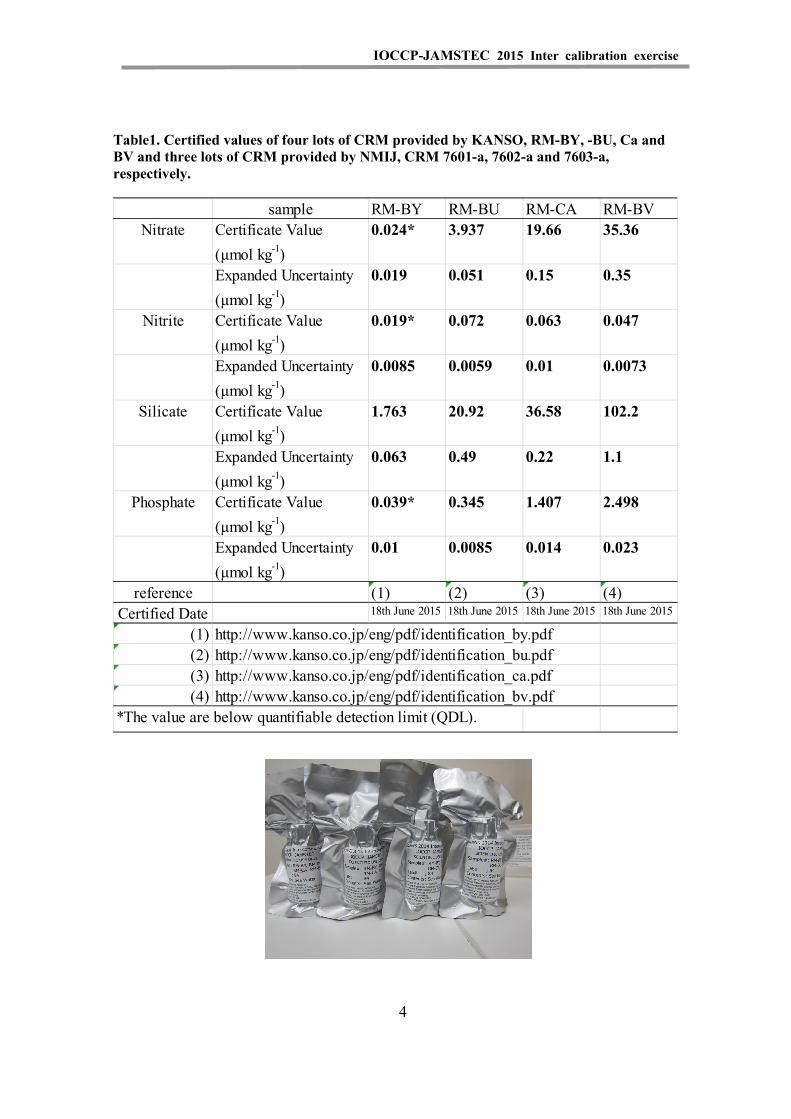
Table1. Certified values of four lots of CRM provided by KANSO, RM-BY, -BU, Ca and BV and three lots of CRM provided by NMIJ, CRM 7601-a, 7602-a and 7603-a, respectively.
sample RM-BY RM-BU RM-CA RM-BVNitrate Certificate Value
(μmol kg-1)0.024* 3.937 19.66 35.36
Expanded Uncertainty(μmol kg-1)
0.019 0.051 0.15 0.35
Nitrite Certificate Value(μmol kg-1)
0.019* 0.072 0.063 0.047
Expanded Uncertainty(μmol kg-1)
0.0085 0.0059 0.01 0.0073
Silicate Certificate Value(μmol kg-1)
1.763 20.92 36.58 102.2
Expanded Uncertainty(μmol kg-1)
0.063 0.49 0.22 1.1
Phosphate Certificate Value(μmol kg-1)
0.039* 0.345 1.407 2.498
Expanded Uncertainty(μmol kg-1)
0.01 0.0085 0.014 0.023
reference (1) (2) (3) (4)Certified Date 18th June 2015 18th June 2015 18th June 2015 18th June 2015
(1) http://www.kanso.co.jp/eng/pdf/identification_by.pdf(2) http://www.kanso.co.jp/eng/pdf/identification_bu.pdf(3) http://www.kanso.co.jp/eng/pdf/identification_ca.pdf(4) http://www.kanso.co.jp/eng/pdf/identification_bv.pdf
*The value are below quantifiable detection limit (QDL).
4
IOCCP-JAMSTEC 2015 Inter calibration exercise
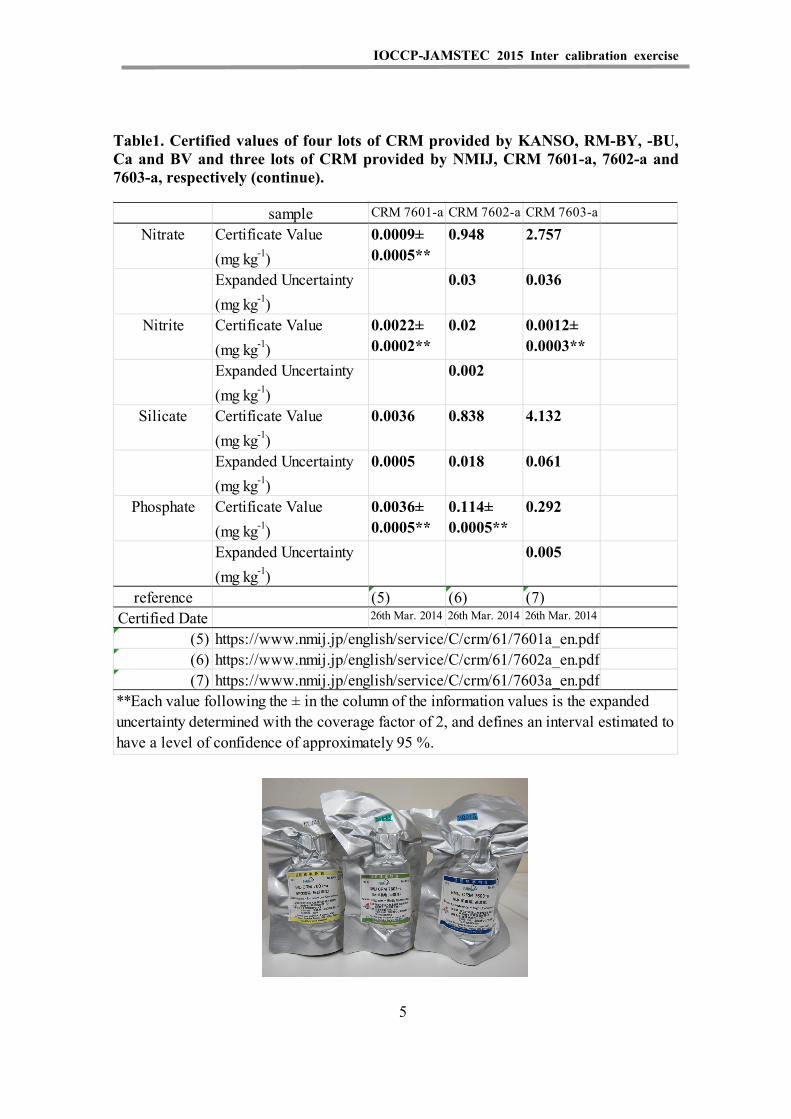
Table1. Certified values of four lots of CRM provided by KANSO, RM-BY, -BU, Ca and BV and three lots of CRM provided by NMIJ, CRM 7601-a, 7602-a and 7603-a, respectively (continue).
sample CRM 7601-a CRM 7602-a CRM 7603-a
Nitrate Certificate Value(mg kg-1)
0.0009±0.0005**
0.948 2.757
Expanded Uncertainty(mg kg-1)
0.03 0.036
Nitrite Certificate Value(mg kg-1)
0.0022±0.0002**
0.02 0.0012±0.0003**
Expanded Uncertainty(mg kg-1)
0.002
Silicate Certificate Value(mg kg-1)
0.0036 0.838 4.132
Expanded Uncertainty(mg kg-1)
0.0005 0.018 0.061
Phosphate Certificate Value(mg kg-1)
0.0036±0.0005**
0.114±0.0005**
0.292
Expanded Uncertainty(mg kg-1)
0.005
reference (5) (6) (7)Certified Date 26th Mar. 2014 26th Mar. 2014 26th Mar. 2014
(5) https://www.nmij.jp/english/service/C/crm/61/7601a_en.pdf(6) https://www.nmij.jp/english/service/C/crm/61/7602a_en.pdf(7) https://www.nmij.jp/english/service/C/crm/61/7603a_en.pdf
**Each value following the ± in the column of the information values is the expandeduncertainty determined with the coverage factor of 2, and defines an interval estimated tohave a level of confidence of approximately 95 %.
5
IOCCP-JAMSTEC 2015 Inter calibration exercise
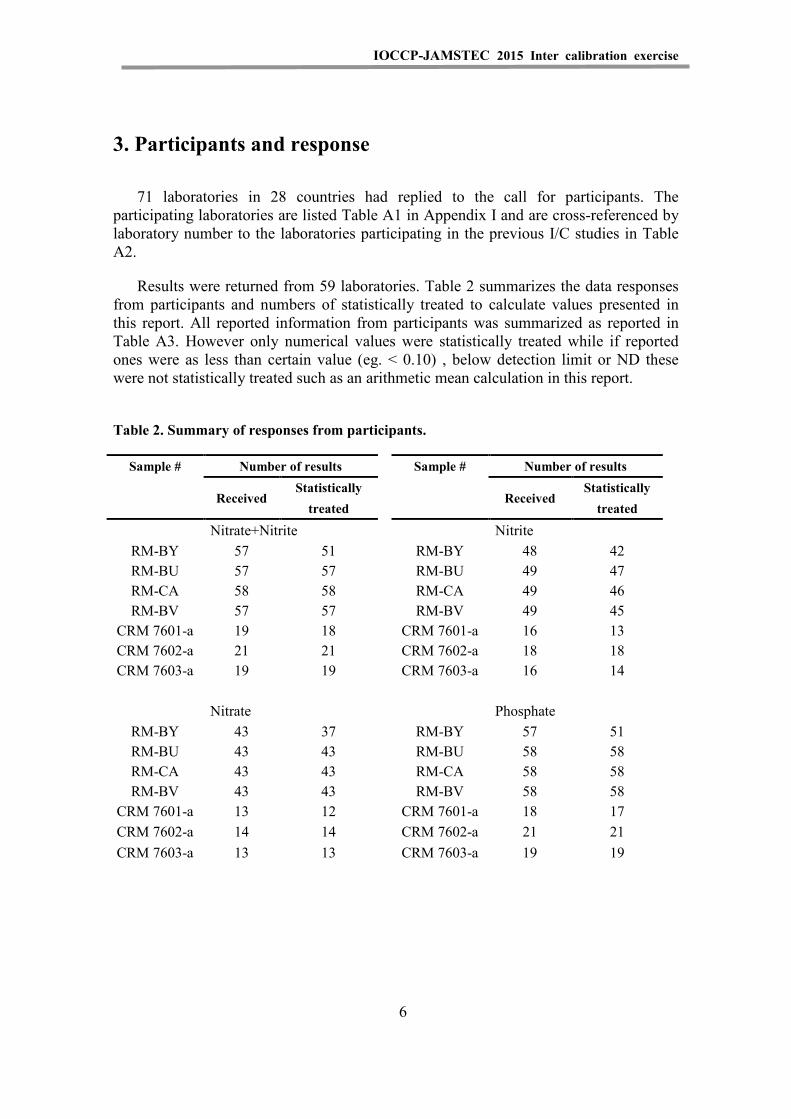
3. Participants and response
71 laboratories in 28 countries had replied to the call for participants. The participating laboratories are listed Table A1 in Appendix I and are cross-referenced by laboratory number to the laboratories participating in the previous I/C studies in Table A2.
Results were returned from 59 laboratories. Table 2 summarizes the data responses from participants and numbers of statistically treated to calculate values presented in this report. All reported information from participants was summarized as reported in Table A3. However only numerical values were statistically treated while if reported ones were as less than certain value (eg. < 0.10) , below detection limit or ND these were not statistically treated such as an arithmetic mean calculation in this report.
Table 2. Summary of responses from participants.
Sample # Number of results Sample # Number of results
Received Statistically
Received Statistically
treated treated
Nitrate+Nitrite Nitrite RM-BY 57 51 RM-BY 48 42 RM-BU 57 57 RM-BU 49 47 RM-CA 58 58 RM-CA 49 46 RM-BV 57 57 RM-BV 49 45
CRM 7601-a 19 18 CRM 7601-a 16 13 CRM 7602-a 21 21 CRM 7602-a 18 18 CRM 7603-a 19 19 CRM 7603-a 16 14
Nitrate Phosphate RM-BY 43 37 RM-BY 57 51 RM-BU 43 43 RM-BU 58 58 RM-CA 43 43 RM-CA 58 58 RM-BV 43 43 RM-BV 58 58
CRM 7601-a 13 12 CRM 7601-a 18 17 CRM 7602-a 14 14 CRM 7602-a 21 21 CRM 7603-a 13 13 CRM 7603-a 19 19
6
IOCCP-JAMSTEC 2015 Inter calibration exercise
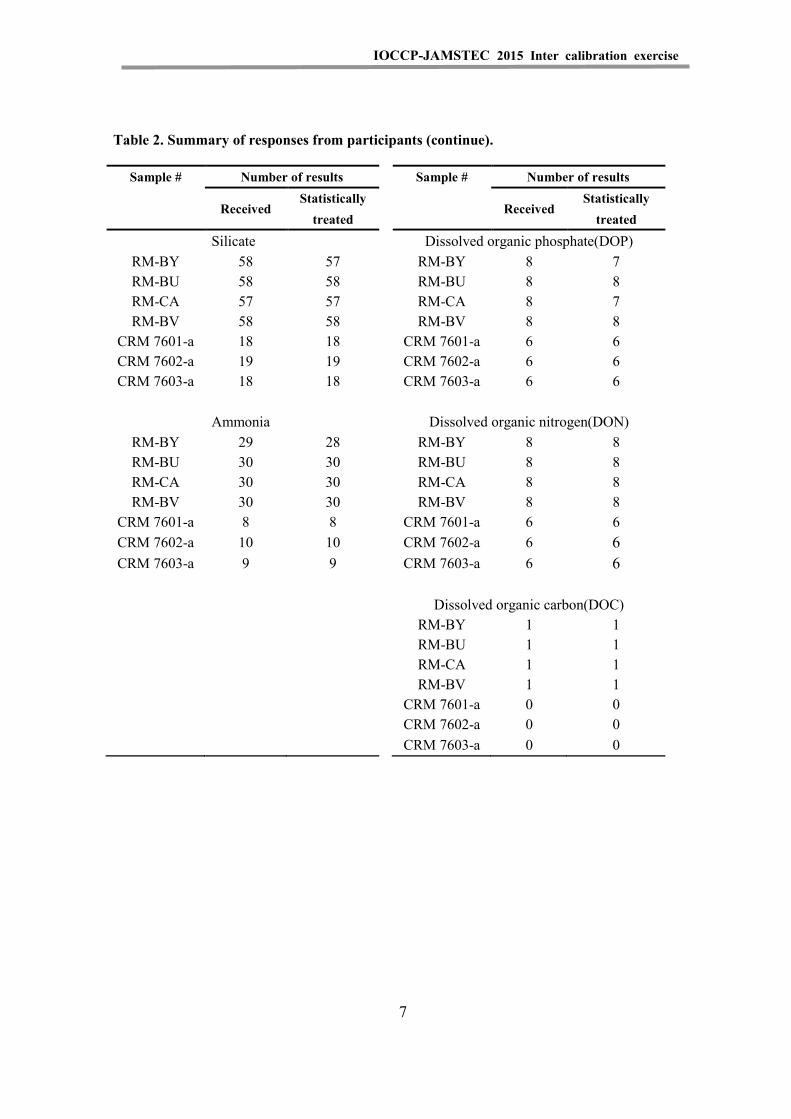
Table 2. Summary of responses from participants (continue).
Sample # Number of results Sample # Number of results
Received Statistically
Received Statistically
treated treated
Silicate Dissolved organic phosphate(DOP) RM-BY 58 57 RM-BY 8 7 RM-BU 58 58 RM-BU 8 8 RM-CA 57 57 RM-CA 8 7 RM-BV 58 58 RM-BV 8 8
CRM 7601-a 18 18 CRM 7601-a 6 6 CRM 7602-a 19 19 CRM 7602-a 6 6 CRM 7603-a 18 18 CRM 7603-a 6 6
Ammonia Dissolved organic nitrogen(DON) RM-BY 29 28 RM-BY 8 8 RM-BU 30 30 RM-BU 8 8 RM-CA 30 30 RM-CA 8 8 RM-BV 30 30 RM-BV 8 8
CRM 7601-a 8 8 CRM 7601-a 6 6 CRM 7602-a 10 10 CRM 7602-a 6 6 CRM 7603-a 9 9 CRM 7603-a 6 6
Dissolved organic carbon(DOC) RM-BY 1 1 RM-BU 1 1 RM-CA 1 1 RM-BV 1 1
CRM 7601-a 0 0 CRM 7602-a 0 0 CRM 7603-a 0 0
7

IOCCP-JAMSTEC 2015 Inter calibration exercise
4. Statistical treatment
4.1 Raw mean, median, and standard deviation
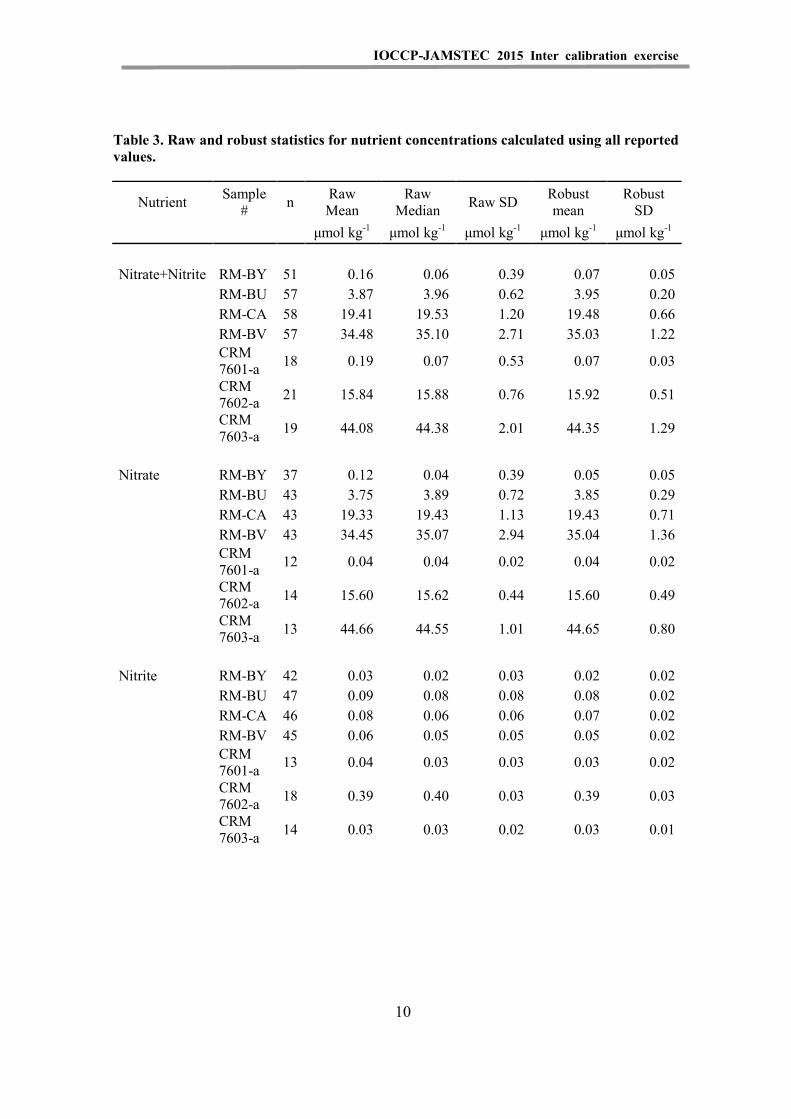
Mean, median and standard deviation were calculated using reported values except reported as below detection limit, less than xx etc. Results are shown in Table 3.
4.2 Robust statistics
Robust statistics is a convenient modern way of summarizing results when we suspect that they include a small proportion of outliers. Most estimates of central tendency ( e.g., the arithmetic mean, in this report raw mean in Table 3) and dispersion ( e.g ., standard deviation, in this report Raw SD in Table 3) depend for their interpretation on an implicit assumption that the data comprise a random sample from a normal distribution. But it is actually that analytical data we treated in this report may depart from that model. They are often heavy tailed (contain a higher or lower than expected proportion of results far from the mean) and may contain outliers as we can see ranked plots as shown in Figure 1-1 to 5-2. Robust mean (H15 mean) and standard deviation (H15 Sd) were calculated based on the AMC method (AMC, 2001). Results are shown in Table 3.
4.3 Consensus mean, median, and standard deviation
Successive t-tests at the 95% confidence level were applied to the results before estimating the consensus mean, consensus median, and consensus standard deviation as in the previous inter-comparison studies (Aminot and Kirkwood, 1995; Aoyama, 2006; 2008). Tests were applied until a stable mean was reached, and stable means were obtained at the 5th to 9th test for sets of results. This means that data within estimated consensus mean +- 3 times of consensus standard deviation were remained and the consensus mean, consensus median, and consensus standard deviation were obtained..
4.4 Calculation of Z-scores
Z-scores were used to evaluate the performance of laboratories as in the previous inter-comparison studies (Aminot and Kirkwood, 1995; Aoyama, 2006; 2008).
The Z-score for each analysis is defined as
Zpar = ABS((Cpar – Cconsensus)/Ppar) (1)
8

IOCCP-JAMSTEC 2015 Inter calibration exercise
Where Zpar is the Z-score for an analysis; Cpar is the concentration of an RMNS sample measured by a laboratory for the parameter of interest (nitrate, phosphate, or silicate); Cconsensus is the consensus sample concentration for the parameter of interest, described in section 4.1; and Ppar is the standard deviation at the sample concentration for the parameter of interest.
The Z-score for all determinants, nitrate+nitrite, nitrate, nitrite, phosphate and silicate, were calculated and shown in tables 6-1 – 6-5. We calculate combined Z-scores for phosphate and nitrate+nitrite to look at performance to estimate an important biogeochemical parameter, N/P ratio, and shown in table 6-6. We also calculated combined Z-scores for phosphate, nitrate+nitrite, and silicate and shown in table 6-7 to look at overall performance of nutrients measurements of each laboratory.
9
IOCCP-JAMSTEC 2015 Inter calibration exercise
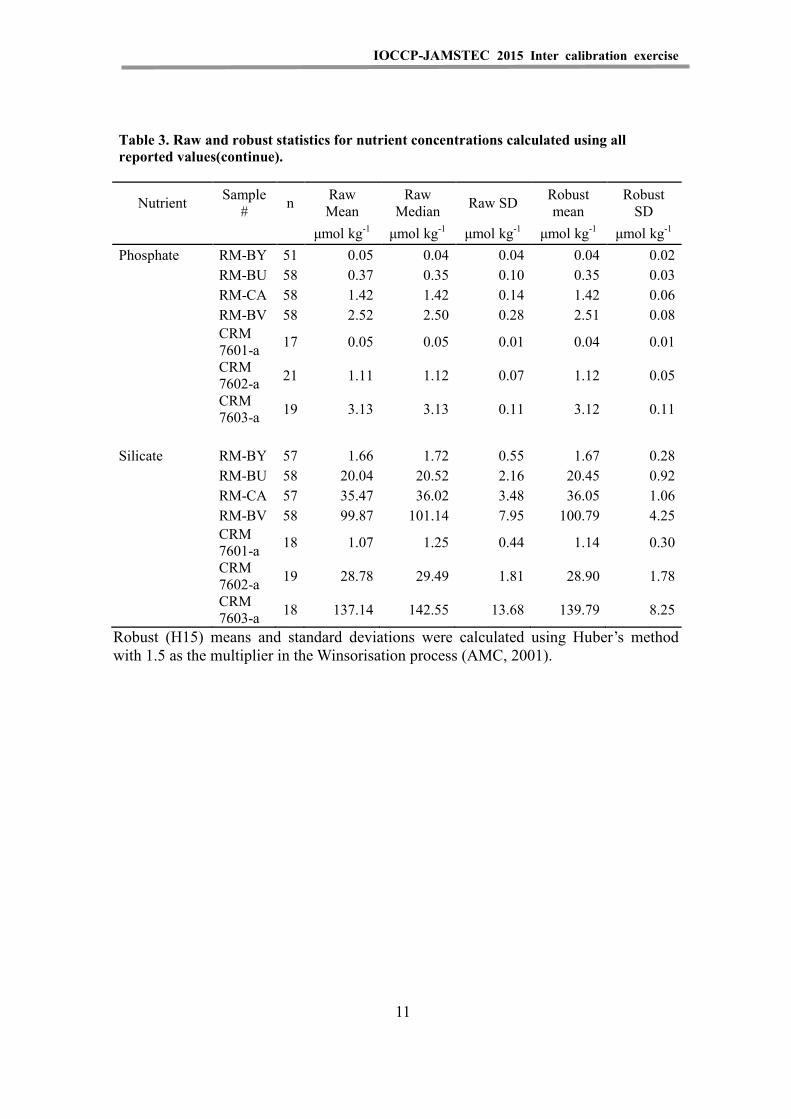
Table 3. Raw and robust statistics for nutrient concentrations calculated using all reported values.
Nutrient Sample # n Raw
Mean Raw
Median Raw SD Robust mean
Robust SD
μmol kg-1 μmol kg-1 μmol kg-1 μmol kg-1 μmol kg-1
Nitrate+Nitrite RM-BY 51 0.16 0.06 0.39 0.07 0.05
RM-BU 57 3.87 3.96 0.62 3.95 0.20
RM-CA 58 19.41 19.53 1.20 19.48 0.66
RM-BV 57 34.48 35.10 2.71 35.03 1.22
CRM 7601-a 18 0.19 0.07 0.53 0.07 0.03
CRM 7602-a 21 15.84 15.88 0.76 15.92 0.51
CRM 7603-a 19 44.08 44.38 2.01 44.35 1.29
Nitrate RM-BY 37 0.12 0.04 0.39 0.05 0.05
RM-BU 43 3.75 3.89 0.72 3.85 0.29
RM-CA 43 19.33 19.43 1.13 19.43 0.71
RM-BV 43 34.45 35.07 2.94 35.04 1.36
CRM 7601-a 12 0.04 0.04 0.02 0.04 0.02
CRM 7602-a 14 15.60 15.62 0.44 15.60 0.49
CRM 7603-a 13 44.66 44.55 1.01 44.65 0.80
Nitrite RM-BY 42 0.03 0.02 0.03 0.02 0.02
RM-BU 47 0.09 0.08 0.08 0.08 0.02
RM-CA 46 0.08 0.06 0.06 0.07 0.02
RM-BV 45 0.06 0.05 0.05 0.05 0.02
CRM 7601-a 13 0.04 0.03 0.03 0.03 0.02
CRM 7602-a 18 0.39 0.40 0.03 0.39 0.03
CRM 7603-a 14 0.03 0.03 0.02 0.03 0.01
10
IOCCP-JAMSTEC 2015 Inter calibration exercise
Table 3. Raw and robust statistics for nutrient concentrations calculated using all reported values(continue).
Nutrient Sample # n Raw
Mean Raw
Median Raw SD Robust mean
Robust SD
μmol kg-1 μmol kg-1 μmol kg-1 μmol kg-1 μmol kg-1 Phosphate RM-BY 51 0.05 0.04 0.04 0.04 0.02
RM-BU 58 0.37 0.35 0.10 0.35 0.03
RM-CA 58 1.42 1.42 0.14 1.42 0.06
RM-BV 58 2.52 2.50 0.28 2.51 0.08
CRM 7601-a 17 0.05 0.05 0.01 0.04 0.01
CRM 7602-a 21 1.11 1.12 0.07 1.12 0.05
CRM 7603-a 19 3.13 3.13 0.11 3.12 0.11
Silicate RM-BY 57 1.66 1.72 0.55 1.67 0.28
RM-BU 58 20.04 20.52 2.16 20.45 0.92
RM-CA 57 35.47 36.02 3.48 36.05 1.06
RM-BV 58 99.87 101.14 7.95 100.79 4.25
CRM 7601-a 18 1.07 1.25 0.44 1.14 0.30
CRM 7602-a 19 28.78 29.49 1.81 28.90 1.78
CRM 7603-a 18 137.14 142.55 13.68 139.79 8.25
Robust (H15) means and standard deviations were calculated using Huber’s method with 1.5 as the multiplier in the Winsorisation process (AMC, 2001).
11

IOCCP-JAMSTEC 2015 Inter calibration exercise
This page left intentionally blank
12
IOCCP-JAMSTEC 2015 Inter calibration exercise
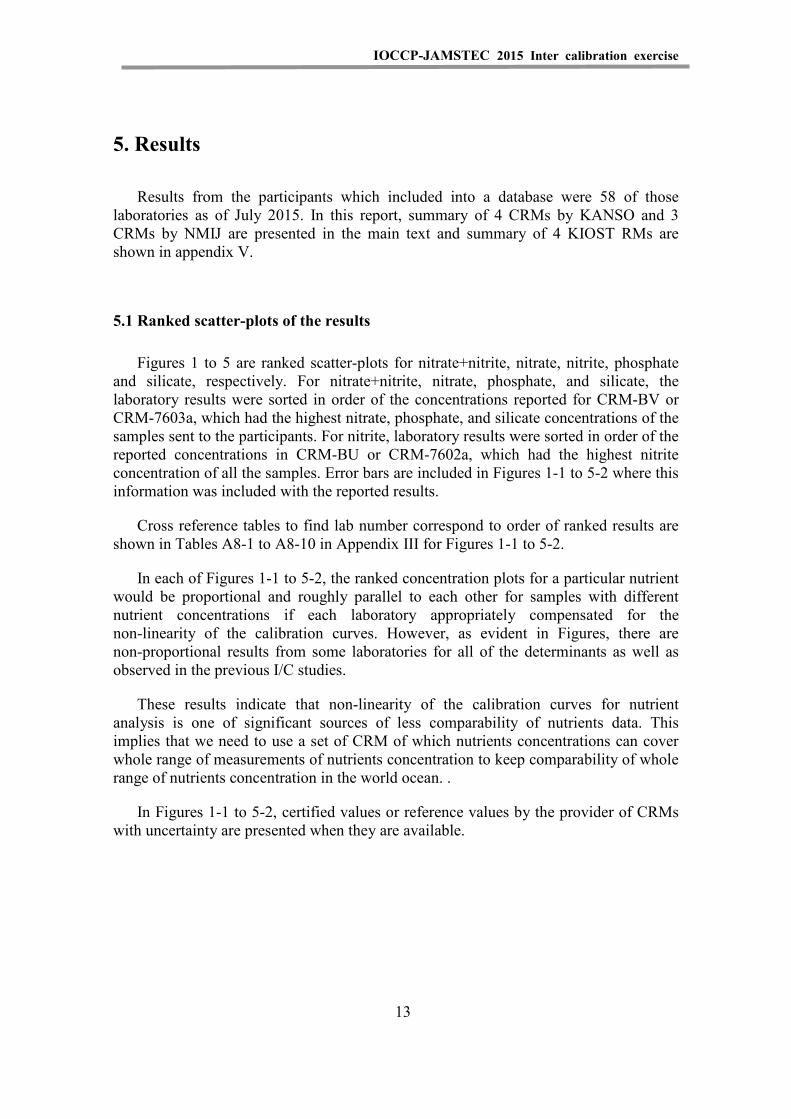
5. Results
Results from the participants which included into a database were 58 of those laboratories as of July 2015. In this report, summary of 4 CRMs by KANSO and 3 CRMs by NMIJ are presented in the main text and summary of 4 KIOST RMs are shown in appendix V.
5.1 Ranked scatter-plots of the results
Figures 1 to 5 are ranked scatter-plots for nitrate+nitrite, nitrate, nitrite, phosphate and silicate, respectively. For nitrate+nitrite, nitrate, phosphate, and silicate, the laboratory results were sorted in order of the concentrations reported for CRM-BV or CRM-7603a, which had the highest nitrate, phosphate, and silicate concentrations of the samples sent to the participants. For nitrite, laboratory results were sorted in order of the reported concentrations in CRM-BU or CRM-7602a, which had the highest nitrite concentration of all the samples. Error bars are included in Figures 1-1 to 5-2 where this information was included with the reported results.
Cross reference tables to find lab number correspond to order of ranked results are shown in Tables A8-1 to A8-10 in Appendix III for Figures 1-1 to 5-2.
In each of Figures 1-1 to 5-2, the ranked concentration plots for a particular nutrient would be proportional and roughly parallel to each other for samples with different nutrient concentrations if each laboratory appropriately compensated for the non-linearity of the calibration curves. However, as evident in Figures, there are non-proportional results from some laboratories for all of the determinants as well as observed in the previous I/C studies.
These results indicate that non-linearity of the calibration curves for nutrient analysis is one of significant sources of less comparability of nutrients data. This implies that we need to use a set of CRM of which nutrients concentrations can cover whole range of measurements of nutrients concentration to keep comparability of whole range of nutrients concentration in the world ocean. .
In Figures 1-1 to 5-2, certified values or reference values by the provider of CRMs with uncertainty are presented when they are available.
13

IOCCP-JAMSTEC 2015 Inter calibration exercise
Figure 1-1. Nitrate+Nitrite results for KANSO CRMs. Laboratories are ranked in order of concentrations reported for RM-BV.
0
10
20
30
40
50
0 10 20 30 40 50 60
Nitrate + Nitrite
RMNS-BYRMNS-BURMNS-CARMNS-BV
Nitr
ate
+ N
itrite
/ µm
ol k
g-1
14

IOCCP-JAMSTEC 2015 Inter calibration exercise
Figure 1-2. Nitrate+Nitrite results for NMIJ CRMs. Laboratories are ranked in order of concentrations reported for CRM 7603-a.
0
10
20
30
40
50
0 5 10 15 20 25 30
Nitrate + NitriteCRM 7601-aCRM 7602-aCRM 7603-a
Nitr
ate
+ N
itrite
/ µm
ol k
g-1
15
IOCCP-JAMSTEC 2015 Inter calibration exercise
Figure 2-1. Nitrate results for KANSO CRMs. Laboratories are ranked in order of concentrations reported for RM-BV.
0
10
20
30
40
50
0 10 20 30 40 500
10
20
30
40
50
0 10 20 30 40 50
Nitrate
RMNS-BYRMNS-BURMNS-CARMNS-BV
Nitr
ate
/ µm
ol k
g-1
16
IOCCP-JAMSTEC 2015 Inter calibration exercise
Figure 2-2. Nitrate results for NMIJ CRMs. Laboratories are ranked in order of concentrations reported for CRM 7603-a.
0
10
20
30
40
50
0 5 10 15 20 25 300
10
20
30
40
50
0 5 10 15 20 25 30
NitrateCRM 7601-aCRM 7602-aCRM 7603-a
Nitr
ate
/ µm
ol k
g-1
17

IOCCP-JAMSTEC 2015 Inter calibration exercise
Figure 3-1. Nitrite results for KANSO CRMs. Laboratories are ranked in order of concentrations reported for RM-BU.
-0.2
0
0.2
0.4
0.6
0.8
1
0 10 20 30 40 50
Num
-0.2
0
0.2
0.4
0.6
0.8
1
0 10 20 30 40 50
Nitrite
RMNS-BYRMNS-BURMNS-CARMNS-BV
Nitr
ite /
µmol
kg-1
18

IOCCP-JAMSTEC 2015 Inter calibration exercise
Figure 3-2. Nitrite results for NMIJ CRMs. Laboratories are ranked in order of concentrations reported for CRM 7602-a.
-0.2
0
0.2
0.4
0.6
0.8
1
0 5 10 15 20 25 30-0.2
0
0.2
0.4
0.6
0.8
1
0 5 10 15 20 25 30
NitriteCRM 7601-aCRM 7602-aCRM 7603-a
Nitr
ite /
µmol
kg-1
19
IOCCP-JAMSTEC 2015 Inter calibration exercise
Figure 4-1. Phosphate results for KANSO CRMs. Laboratories are ranked in order of concentrations reported for RM-BV.
0
1
2
3
4
5
0 10 20 30 40 50 600
1
2
3
4
5
0 10 20 30 40 50 60
Phosphate
RMNS-BYRMNS-BURMNS-CARMNS-BV
Phos
phat
e / µ
mol
kg-1
20
IOCCP-JAMSTEC 2015 Inter calibration exercise
Figure 4-2. Phosphate results for NMIJ CRMs. Laboratories are ranked in order of concentrations reported for CRM 7603-a.
0
1
2
3
4
5
0 5 10 15 20 25 300
1
2
3
4
5
0 5 10 15 20 25 30
PhosphateCRM 7601-aCRM 7602-aCRM 7603-a
Phos
phat
e / µ
mol
kg-1
21
IOCCP-JAMSTEC 2015 Inter calibration exercise
Figure 5-1. Silicate results for KANSO CRMs. Laboratories are ranked in order of concentrations reported for RM-BV.
0
30
60
90
120
150
0 10 20 30 40 50 60
Silicate
RMNS-BYRMNS-BURMNS-CARMNS-BV
Silic
ate
/ µm
ol k
g-1
0
30
60
90
120
150
0 10 20 30 40 50 60
22

IOCCP-JAMSTEC 2015 Inter calibration exercise
Figure 5-2. Silicate results for NMIJ CRMs. Laboratories are ranked in order of concentrations reported for CRM 7603-a.
0
50
100
150
0 5 10 15 20 25 300
50
100
150
0 5 10 15 20 25 30
SilicateCRM 7601-aCRM 7602-aCRM 7603-a
Silic
ate
/ µm
ol k
g-1
23
IOCCP-JAMSTEC 2015 Inter calibration exercise
5.2 Consensus means, medians, and standard deviations
The consensus means, medians, and standard deviations (Table 4) were calculated using the data that passed the successive t-test applications described in Section 4.1. The consensus means and medians are in close agreement for all parameters for all samples. The consensus means and medians for all parameters showed in good agreement with certified values by the providers of CRMs within uncertainty.
Table 4. Consensus means, medians, and standard deviations for 7 samples.
Sample # n Consensus Mean
Consensus Median
Consensus SD
Certified values
uncertainty (k =2)
μmol kg-1 μmol kg-1 μmol kg-1 μmol kg-1 μmol kg-1
Nitrate+Nitrite RM-BY 43 (51) 0.05 0.05 0.03 0.043 0.0275 RM-BU 32 (57) 3.98 3.98 0.05 4.009 0.0569 RM-CA 41 (58) 19.59 19.58 0.31 19.723 0.16 RM-BV 37 (57) 35.20 35.18 0.49 35.407 0.3573 CRM 7601-a 16 (18) 0.06 0.06 0.03 0.063 0.0124 CRM 7602-a 20 (21) 15.97 15.93 0.45 15.735 0.524 CRM 7603-a 18 (19) 44.47 44.46 1.10 44.526 0.5865
Nitrate RM-BY 31 (37) 0.04 0.03 0.03 0.024 0.019 RM-BU 22 (43) 3.91 3.91 0.05 3.937 0.051 RM-CA 30 (43) 19.58 19.54 0.33 19.66 0.15 RM-BV 28 (43) 35.22 35.13 0.52 35.36 0.35 CRM 7601-a 11 (12) 0.03 0.04 0.02 0.015 0.0081 CRM 7602-a 14 (14) 15.60 15.62 0.44 15.3 0.48 CRM 7603-a 12 (13) 44.84 44.58 0.81 44.5 0.58
Nitrite
RM-BY 37 (42) 0.02 0.02 0.01 0.019 0.0085 RM-BU 36 (47) 0.07 0.07 0.01 0.072 0.0059 RM-CA 30 (46) 0.07 0.06 0.01 0.063 0.01 RM-BV 37 (45) 0.05 0.05 0.01 0.047 0.0073 CRM 7601-a 12 (13) 0.03 0.03 0.02 0.048 0.0043 CRM 7602-a 17 (18) 0.39 0.39 0.03 0.435 0.044 CRM 7603-a 12 (14) 0.03 0.03 0.01 0.026 0.0065
24

IOCCP-JAMSTEC 2015 Inter calibration exercise
Table 4. Consensus means, medians, and standard deviations for 7 samples(continued).
Sample # n Consensus Mean
Consensus Median
Consensus SD
Certified values
uncertainty (k =2)
μmol kg-1 μmol kg-1 μmol kg-1 μmol kg-1 μmol kg-1
Phosphate RM-BY 37 (51) 0.04 0.03 0.01 0.039 0.01 RM-BU 41 (58) 0.35 0.35 0.02 0.345 0.0085 RM-CA 38 (58) 1.42 1.42 0.03 1.407 0.014 RM-BV 41 (58) 2.51 2.50 0.04 2.498 0.023 CRM 7601-a 14 (17) 0.04 0.04 0.01 0.038 0.0053 CRM 7602-a 18 (21) 1.13 1.13 0.03 1.12 0.12 CRM 7603-a 17 (19) 3.11 3.08 0.08 3.07 0.053
Silicate RM-BY 25 (57) 1.75 1.75 0.04 1.763 0.063 RM-BU 44 (58) 20.75 20.75 0.45 20.92 0.49 RM-CA 45 (57) 36.06 36.02 0.66 36.58 0.22 RM-BV 34 (58) 101.00 101.14 1.22 102.2 1.1 CRM 7601-a 13 (18) 1.24 1.27 0.09 1.28 0.11 CRM 7602-a 13 (19) 29.86 29.78 0.54 29.8 0.64 CRM 7603-a 12 (18) 144.39 144.41 1.94 147.1 2.17
*Numbers in parentheses are the initial numbers of values before successive t-tests reduced the sample size to n (see text).
25

IOCCP-JAMSTEC 2015 Inter calibration exercise
5.3 Summary of analytical precision of participating laboratories and consensus standard deviation
In tables 5-1 to 5-7, we compare median and range of analytical precision reported by participants (Analytical precision of participating laboratory in Tables) and the consensus standard deviation in terms of CV relative to consensus median shown in Table 4.
Table 5-1.Median and range of analytical precision of participating laboratories, and consensus coefficient of variation for analyses of nutrients in RM-BY.
Nutrient Analytical precision of participating laboratories
Consensus coefficient of variation
N Median% (range) N CV%
Nitrate+Nitrite 41 20 (0-900) 43 60
Phosphate 43 9.1 (0-142.9) 37 33.3
Silicate 51 2.1 (0-102.3) 25 2.3
Table 5-2.Median and range of analytical precision of participating laboratories, and consensus coefficient of variation for analyses of nutrients in RM-BU.
Nutrients Analytical precision of participating laboratories
Consensus CV
n Median (range) %
n CV %
Nitrate+Nitrite 52 1.4 (0-89.3) 32 1.3
Phosphate 52 2.2 (0-92.2) 41 5.7
Silicate 53 0.6 (0-10.7) 44 2.2
26

IOCCP-JAMSTEC 2015 Inter calibration exercise
Table 5-3.Median and range of analytical precision of participating laboratories, and consensus coefficient of variation for analyses of nutrients in RM-CA.
Nutrients Analytical precision of participating laboratories
Consensus CV
n Median (range) %
n CV %
Nitrate+Nitrite 53 0.7 (0-18.2) 41 1.6
Phosphate 53 1.3 (0-18.9) 38 2.1
Silicate 52 0.5 (0-10.5) 45 1.8
Table 5-4.Median and range of analytical precision of participating laboratories, and consensus coefficient of variation for analyses of nutrients in RM-BV.
Nutrients Analytical precision of participating laboratories
Consensus CV
n Median (range) %
n CV %
Nitrate+Nitrite 52 0.7 (0-12.7) 37 1.4
Phosphate 53 0.6 (0-19.6) 41 1.6
Silicate 53 0.3 (0-8.4) 34 1.2
Table 5-5.Median and range of analytical precision of participating laboratories, and consensus coefficient of variation for analyses of nutrients in CRM 7601-a.
Nutrients Analytical precision of participating laboratories
Consensus CV
n Median (range) %
n CV %
Nitrate+Nitrite 17 20 (0-360) 16 50
Phosphate 16 7.2 (0-70.3) 14 25
Silicate 17 3.9 (0-163.3) 13 7.1
27

IOCCP-JAMSTEC 2015 Inter calibration exercise
Table 5-6. Median and range of analytical precision of participating laboratories, and consensus coefficient of variation for analyses of nutrients in CRM 7602-a.
Nutrients Analytical precision of participating laboratories
Consensus CV
n Median (range) %
n CV %
Nitrate+Nitrite 20 0.4 (0.1-5.9) 20 2.8
Phosphate 20 0.5 (0-11.2) 18 2.7
Silicate 18 0.2 (0-3.8) 13 1.8
Table 5-7. Median and range of analytical precision of participating laboratories, and consensus coefficient of variation for analyses of nutrients in CRM 7603-a.
Nutrients Analytical precision of participating laboratories
Consensus CV
n Median (range) %
n CV %
Nitrate+Nitrite 18 0.3 (0-2.2) 18 2.5
Phosphate 18 0.3 (0.1-3.2) 17 2.6
Silicate 17 0.5 (0-3) 12 1.3
28
IOCCP-JAMSTEC 2015 Inter calibration exercise
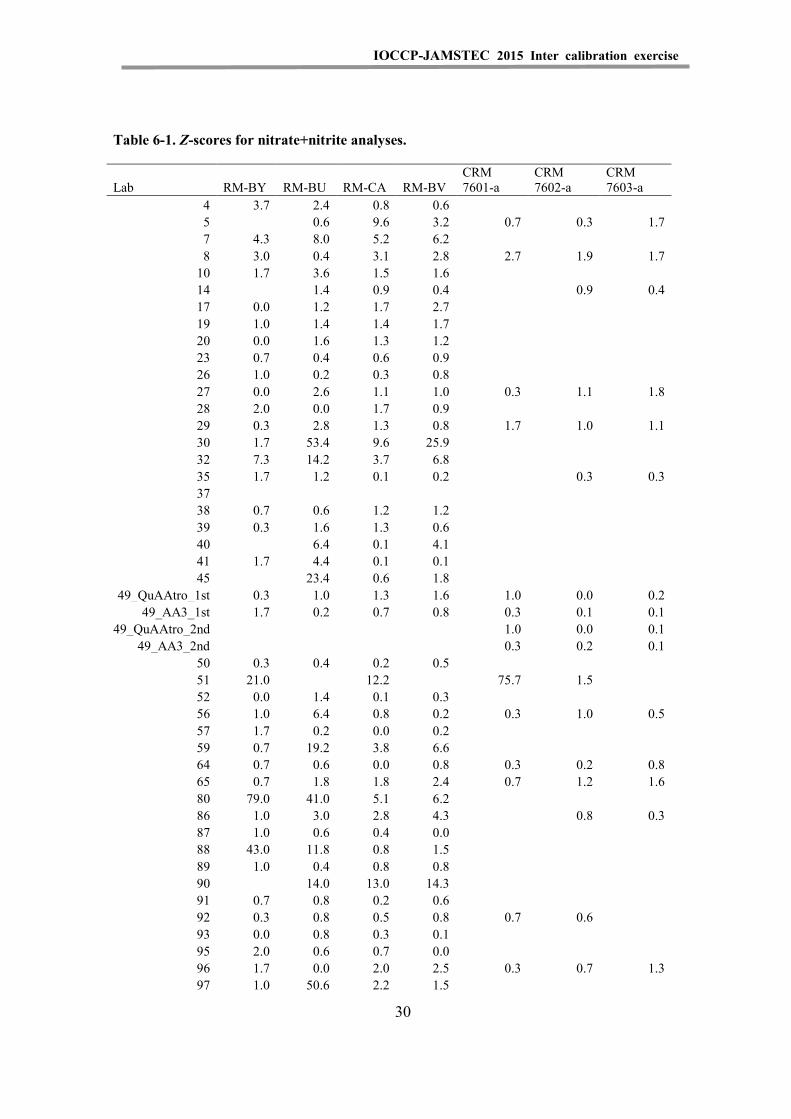
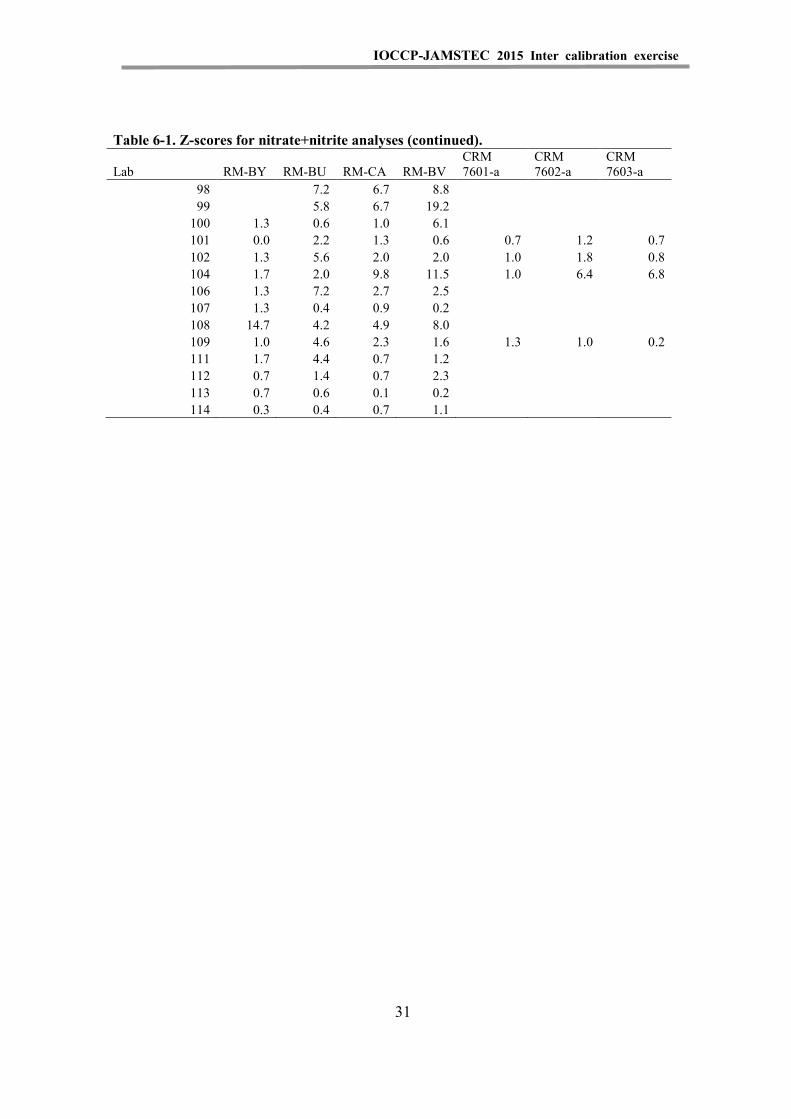
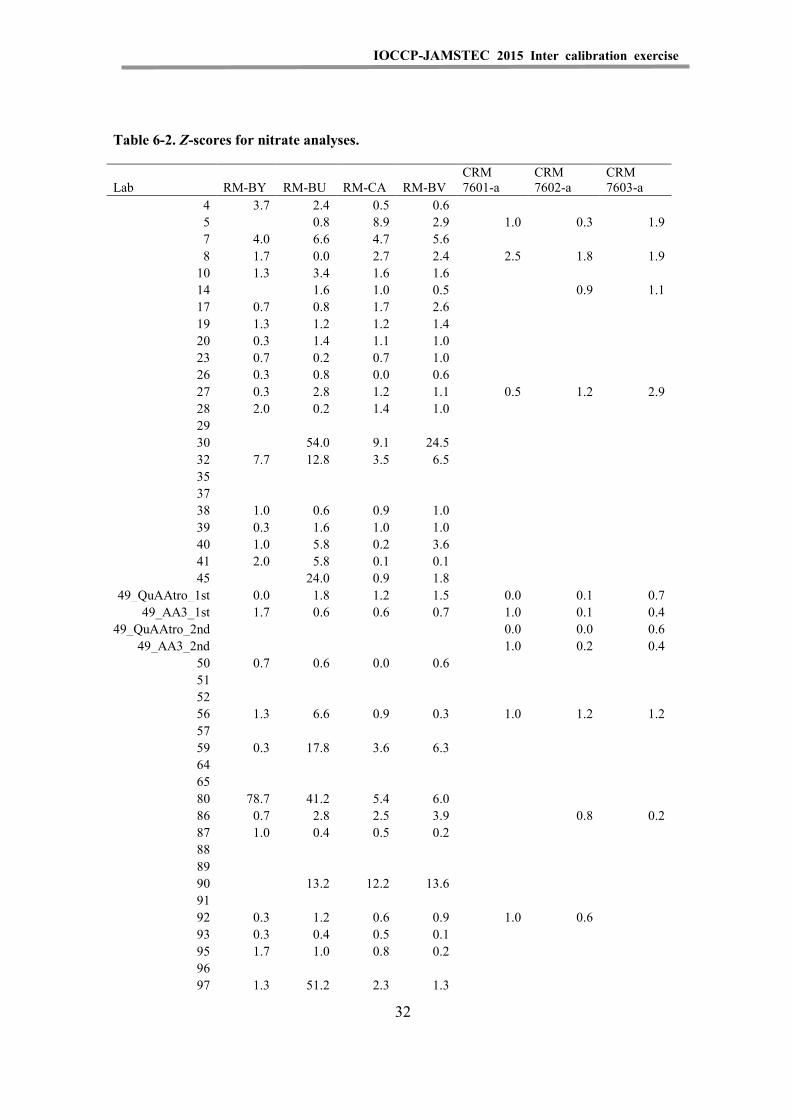
5.4 Z-scores
Tables 6-1 to 6-7 present Z-scores for participating laboratories computed as described in section 4.4. Z-scores indicate how the measurement of a particular determinant in a sample by an individual laboratory compares to the consensus value for that determinant in that sample as determined by all participating laboratories. Z-values are proportional to the consensus standard deviation, with a Z-value less than 1.0 indicating a measurement within ±1 SD of the consensus median value.
29
IOCCP-JAMSTEC 2015 Inter calibration exercise
Table 6-1. Z-scores for nitrate+nitrite analyses.
Lab RM-BY RM-BU RM-CA RM-BV CRM 7601-a
CRM 7602-a
CRM 7603-a
4 3.7 2.4 0.8 0.6 5 0.6 9.6 3.2 0.7 0.3 1.7 7 4.3 8.0 5.2 6.2 8 3.0 0.4 3.1 2.8 2.7 1.9 1.7
10 1.7 3.6 1.5 1.6 14 1.4 0.9 0.4 0.9 0.4 17 0.0 1.2 1.7 2.7 19 1.0 1.4 1.4 1.7 20 0.0 1.6 1.3 1.2 23 0.7 0.4 0.6 0.9 26 1.0 0.2 0.3 0.8 27 0.0 2.6 1.1 1.0 0.3 1.1 1.8 28 2.0 0.0 1.7 0.9 29 0.3 2.8 1.3 0.8 1.7 1.0 1.1 30 1.7 53.4 9.6 25.9 32 7.3 14.2 3.7 6.8 35 1.7 1.2 0.1 0.2 0.3 0.3 37 38 0.7 0.6 1.2 1.2 39 0.3 1.6 1.3 0.6 40 6.4 0.1 4.1 41 1.7 4.4 0.1 0.1 45 23.4 0.6 1.8
49_QuAAtro_1st 0.3 1.0 1.3 1.6 1.0 0.0 0.2 49_AA3_1st 1.7 0.2 0.7 0.8 0.3 0.1 0.1
49_QuAAtro_2nd 1.0 0.0 0.1 49_AA3_2nd 0.3 0.2 0.1
50 0.3 0.4 0.2 0.5 51 21.0 12.2 75.7 1.5 52 0.0 1.4 0.1 0.3 56 1.0 6.4 0.8 0.2 0.3 1.0 0.5 57 1.7 0.2 0.0 0.2 59 0.7 19.2 3.8 6.6 64 0.7 0.6 0.0 0.8 0.3 0.2 0.8 65 0.7 1.8 1.8 2.4 0.7 1.2 1.6 80 79.0 41.0 5.1 6.2 86 1.0 3.0 2.8 4.3 0.8 0.3 87 1.0 0.6 0.4 0.0 88 43.0 11.8 0.8 1.5 89 1.0 0.4 0.8 0.8 90 14.0 13.0 14.3 91 0.7 0.8 0.2 0.6 92 0.3 0.8 0.5 0.8 0.7 0.6 93 0.0 0.8 0.3 0.1 95 2.0 0.6 0.7 0.0 96 1.7 0.0 2.0 2.5 0.3 0.7 1.3 97 1.0 50.6 2.2 1.5
30
IOCCP-JAMSTEC 2015 Inter calibration exercise
Table 6-1. Z-scores for nitrate+nitrite analyses (continued).
Lab RM-BY RM-BU RM-CA RM-BV CRM 7601-a
CRM 7602-a
CRM 7603-a
98
7.2 6.7 8.8 99
5.8 6.7 19.2
100 1.3 0.6 1.0 6.1 101 0.0 2.2 1.3 0.6 0.7 1.2 0.7
102 1.3 5.6 2.0 2.0 1.0 1.8 0.8 104 1.7 2.0 9.8 11.5 1.0 6.4 6.8 106 1.3 7.2 2.7 2.5
107 1.3 0.4 0.9 0.2 108 14.7 4.2 4.9 8.0 109 1.0 4.6 2.3 1.6 1.3 1.0 0.2
111 1.7 4.4 0.7 1.2 112 0.7 1.4 0.7 2.3 113 0.7 0.6 0.1 0.2 114 0.3 0.4 0.7 1.1
31
IOCCP-JAMSTEC 2015 Inter calibration exercise
Table 6-2. Z-scores for nitrate analyses.
Lab RM-BY RM-BU RM-CA RM-BV CRM 7601-a
CRM 7602-a
CRM 7603-a
4 3.7 2.4 0.5 0.6 5
0.8 8.9 2.9 1.0 0.3 1.9
7 4.0 6.6 4.7 5.6 8 1.7 0.0 2.7 2.4 2.5 1.8 1.9
10 1.3 3.4 1.6 1.6 14
1.6 1.0 0.5
0.9 1.1
17 0.7 0.8 1.7 2.6 19 1.3 1.2 1.2 1.4 20 0.3 1.4 1.1 1.0 23 0.7 0.2 0.7 1.0 26 0.3 0.8 0.0 0.6 27 0.3 2.8 1.2 1.1 0.5 1.2 2.9
28 2.0 0.2 1.4 1.0 29
30
54.0 9.1 24.5 32 7.7 12.8 3.5 6.5 35
37 38 1.0 0.6 0.9 1.0
39 0.3 1.6 1.0 1.0 40 1.0 5.8 0.2 3.6 41 2.0 5.8 0.1 0.1 45
24.0 0.9 1.8
49_QuAAtro_1st 0.0 1.8 1.2 1.5 0.0 0.1 0.7 49_AA3_1st 1.7 0.6 0.6 0.7 1.0 0.1 0.4
49_QuAAtro_2nd
0.0 0.0 0.6 49_AA3_2nd
1.0 0.2 0.4
50 0.7 0.6 0.0 0.6 51
52 56 1.3 6.6 0.9 0.3 1.0 1.2 1.2
57 59 0.3 17.8 3.6 6.3
64 65 80 78.7 41.2 5.4 6.0
86 0.7 2.8 2.5 3.9
0.8 0.2 87 1.0 0.4 0.5 0.2
88 89 90
13.2 12.2 13.6 91
92 0.3 1.2 0.6 0.9 1.0 0.6 93 0.3 0.4 0.5 0.1
95 1.7 1.0 0.8 0.2 96
97 1.3 51.2 2.3 1.3
32
IOCCP-JAMSTEC 2015 Inter calibration exercise
Table 6-2. Z-scores for nitrate analyses (continued).
Lab RM-BY RM-BU RM-CA RM-BV CRM 7601-a
CRM 7602-a
CRM 7603-a
98 99
9.6 6.9 17.9 100 3.0 1.2 0.6 5.4 101 0.3 2.2 1.4 0.4 0.5 1.3 0.4
102 1.0 5.8 1.6 1.8 0.5 1.6 0.6 104
106 1.3 7.0 2.6 2.5 107 1.3 0.8 0.9 0.3 108 12.3 12.8 5.7 8.2 109 0.0 4.2 2.0 1.4 0.5 1.0 0.3
111 0.7 4.6 0.6 1.3 112
113 0.0 0.4 0.1 0.4 114
33
IOCCP-JAMSTEC 2015 Inter calibration exercise
Table 6-3. Z-scores for nitrite analyses.
Lab RM-BY RM-BU RM-CA RM-BV CRM 7601-a
CRM 7602-a
CRM 7603-a
4 1.0 1.0 4.0 1.0 5 0.0 1.0 1.0 0.0 0.0 0.0 1.0
7 0.0 7.0 6.0 7.0 8 3.0 2.0 1.0 1.0 1.5 0.7 0.0
10 2.0 1.0 1.0 0.0 14
0.0 1.0 1.0
0.3 1.0
17
2.0 4.0 4.0 19 0.0 1.0 0.0 0.0 20 0.0 1.0 1.0 0.0 23 1.0 0.0 2.0 1.0 26 1.0 4.0 2.0 3.0 27 0.0 0.0 1.0 0.0 0.0 0.3 1.0
28 1.0 1.0 2.0 2.0 29 2.0 0.0 1.0 1.0 1.0 1.7 1.0
30 2.0 4.0 3.0 2.0 32
35 0.0 1.0 1.0 0.0
0.3 0.0 37
38 0.0 1.0 0.0 0.0 39 1.0 1.0 0.0 1.0 40
1.0
41 1.0 2.0 1.0 2.0 45 2.0 3.0 6.0 2.0 49_QuAAtro_1st
4.0 4.0 4.0
0.7 3.0
49_AA3_1st 2.0 2.0 3.0 2.0 0.5 1.3 49_QuAAtro_2nd
1.0 2.0
49_AA3_2nd
0.5 1.0 50 0.0 0.0 1.0 1.0
51 2.0
4.5 0.7 52
56 0.0 1.0 0.0 0.0 0.5 0.7 0.0 57
59 1.0 0.0 0.0 0.0 64
65 80 0.0 1.0 14.0 2.0
86 0.0 1.0 1.0 1.0
1.0 7.0 87 1.0 0.0 1.0 0.0
88 89 4.0 6.0 3.0 2.0
90 1.0 4.0 5.0 2.0 91
92 1.0 1.0 0.0 0.0 0.0 0.0 93 1.0 2.0 0.0 1.0
95 0.0 2.0 0.0 1.0 96
97 6.0 3.0 2.0 0.0
34
IOCCP-JAMSTEC 2015 Inter calibration exercise
Table 6-3. Z-scores for nitrite analyses (continued).
Lab RM-BY RM-BU RM-CA RM-BV CRM 7601-a
CRM 7602-a
CRM 7603-a
98 99
6.0 4.0 100 12.0 10.0 8.0 9.0
101 1.0 0.0 1.0 1.0 0.5 1.0 1.0 102
0.0 1.0 0.0 1.0 2.3 1.0
104 2.0 1.0 1.0 2.0 0.0 1.0 0.0 106 1.0 1.0 1.0 0.0
107 2.0 2.0 3.0 1.0 108 8.0 51.0 36.0 29.0 109 2.0 2.0 1.0 1.0 1.0 0.3 1.0
111 1.0 1.0 2.0 0.0 112 1.0 0.0 1.0 1.0 113 1.0 1.0 1.0 1.0 114
35

IOCCP-JAMSTEC 2015 Inter calibration exercise
Table 6-4. Z-scores for phosphate analyses.
Lab RM-BY RM-BU RM-CA RM-BV CRM 7601-a
CRM 7602-a
CRM 7603-a
4 4.0 2.9 2.7 1.5 5 0.8 0.2 2.2 1.8 0.6 0.3 1.5
7 1.2 6.1 18.2 23.2 8 2.5 0.6 3.1 2.2 0.3 3.0 1.4
10 4.0 2.7 1.6 1.1 14
0.3 0.8 0.2
1.1 0.4
17
0.0 4.4 2.4 19 0.0 0.0 0.8 0.4 20 1.0 0.2 0.2 0.0 23 0.2 0.4 0.2 0.3 26 2.0 1.9 1.1 0.8 27 0.7 0.4 0.8 2.3 1.0 1.3 1.4
28 8.7 0.4 4.7 6.4 29 2.6 0.3 1.0 1.8 0.3 0.3 0.7
30
12.3 10.4 6.1 32 0.2 1.2 2.9 3.5 35 0.1 0.4 0.4 0.5
0.9 0.8 37 1.1 0.1 0.2 0.1
38 0.3 1.2 1.0 1.0 39 0.8 0.6 0.7 0.4 40
1.6 1.5 0.7
41 6.7 4.0 0.5 5.2 45
49_QuAAtro_1st 2.0 0.1 1.2 1.6 1.1 1.9 2.9 49_AA3_1st 2.2 4.0 2.8 4.8 3.1 0.2 0.4
49_QuAAtro_2nd
1.1 1.9 3.0 49_AA3_2nd
2.8 0.0 0.4
50 0.1 1.0 0.6 0.3 51
2.3 1.5 3.5
8.6
52 1.4 0.8 0.2 0.4 56 2.0 1.4 1.1 1.0 1.1 1.5 1.2
57 4.0 2.0 1.7 0.5 59 12.1 6.7 2.4 0.0 64 0.3 1.4 0.9 2.2 1.2 0.5 0.8
65 1.6 0.2 0.5 0.8 0.1 1.4 0.8 80 4.2 0.6 2.4 1.5
86 2.2 1.6 0.7 1.0
1.1 1.0 87 0.9 0.1 0.2 0.5
88 1.3 1.4 0.2 0.6 89 1.4 20.9 21.9 44.9 90 0.2 1.1 0.8 1.6 91 0.7 0.7 1.1 0.7 92 0.5 0.6 1.8 0.3 0.9 0.7
93 1.0 0.1 0.1 0.2 95 1.1 4.5 4.9 6.4 96 1.4 1.0 0.6 0.5 0.7 1.1 0.4
97 6.9 0.9 2.1 1.1
36
IOCCP-JAMSTEC 2015 Inter calibration exercise
Table 6-4. Z-scores for phosphate analyses (continued).
Lab RM-BY RM-BU RM-CA RM-BV CRM 7601-a
CRM 7602-a
CRM 7603-a
98
0.9 13.6 2.0 99 8.2 4.4 5.1 5.9 100 18.4 4.5 1.5 1.0 101 0.3 1.5 0.1 0.2 0.1 0.9 0.8
102 1.6 0.9 4.0 4.5 0.1 4.2 1.8 104 0.9 1.0 2.6 4.9 3.8 0.9 1.3 106 1.1 0.6 0.7 1.4
107 0.0 0.7 0.5 1.2 108
26.5 0.8 4.6
109 0.7 0.3 0.8 1.1 0.7 0.0 0.2 111 0.9 0.4 0.4 0.5
112 0.1 0.1 0.1 0.2 113 0.7 0.5 0.6 0.9 114 14.6 7.0 2.6 1.6
37

IOCCP-JAMSTEC 2015 Inter calibration exercise
Table 6-5. Z-scores for silicate analyses.
Lab RM-BY RM-BU RM-CA RM-BV CRM 7601-a
CRM 7602-a
CRM 7603-a
4 0.8 3.3 0.6 6.1 5 3.0 0.9 3.1 0.0 0.8 0.7 24.9
7 0.0 0.3 1.3 1.2 8 7.5 8.2 9.7 15.7 1.4 9.8 16.8
10 2.3 1.4 1.8 3.8 14 1.0 0.2 0.1 0.5 1.0 0.2 0.0
17 16.5 11.7 13.4 20.7 19 0.3 0.5 0.8 1.6 20 0.3 0.8 1.1 1.3 23 14.5 0.5 1.0 2.8 26 4.8 0.1 0.7 2.5 27 1.0 0.5 0.9 2.3 0.2 0.8 1.9
28 5.3 1.1 1.7 0.6 29 7.5 1.8 0.8 1.2 1.0 1.2 1.5
30 52.8 14.5 2.3 11.0 32 0.3 1.1 1.2 3.9 35 3.5 1.2 1.0 1.2
1.1 1.2 37
38 0.8 0.5 0.3 1.6 39 0.3 0.4 0.9 0.8 40 4.8 1.6 0.3 9.8 41 0.3 0.8 0.3 1.3 45 16.8 10.6 12.8 14.2 49_QuAAtro_1st 24.5 4.4 3.9 6.4 10.0 6.4 8.3
49_AA3_1st 29.3 6.0 6.3 8.8 11.6 49_QuAAtro_2nd
6.4 8.2
49_AA3_2nd
11.9 4.8 6.4 50 2.0 1.0 0.1 1.1
51 4.3 2.0 3.2 4.8 7.1 7.5 52 0.3 0.5 0.1 0.2
56 0.3 0.1 1.2 0.8 1.9 0.8 0.0 57 8.8 0.1 0.2 0.2
59 24.3 1.1 0.9 0.3 64 1.0 0.6 0.3 0.8 0.9 0.2 0.4
65 0.8 0.5 0.4 0.8 0.4 0.2 0.9 80 11.0 1.4 1.9 6.3
86 22.5 0.7 1.2 0.9
1.0 87 3.5 0.6 0.3 0.9
88 10.0 1.8 2.3 3.1 89 13.3 1.7 0.7 1.0 90 18.0 0.9 1.3 0.1 91 1.0 0.5 0.1 1.0 92 1.0 1.0 1.0 0.3 1.1 1.3
93 0.5 0.6 0.6 1.4 95 0.0 3.5 1.6 1.6 96 1.0 0.6 0.1 0.2 0.1 0.2 0.0
97 43.8 1.3 3.7 6.5
38

IOCCP-JAMSTEC 2015 Inter calibration exercise
Table 6-5. Z-scores for silicate analyses (continued).
Lab RM-BY RM-BU RM-CA RM-BV CRM 7601-a
CRM 7602-a
CRM 7603-a
98 20.8 23.4 9.4 99 20.8 3.1 1.4 5.0
100 2.3 0.6 1.2 0.6 101 0.3 1.4 1.3 2.6 0.3 1.6 2.8 102 3.3 0.4 0.4 0.0 0.6 0.3 0.4 104 4.5 10.8 0.6 3.0 5.7 2.9 0.7 106 3.0 1.0 0.1 10.8 107 1.8 0.7 1.5 0.3 108 34.5 3.8 21.7 10.1 109 1.5 1.4 1.9 1.8 1.3 1.7 1.1 111 0.0 2.6 0.7 1.5 112 11.8 0.3 0.4 0.9 113 1.8 1.1 1.5 1.0 114 5.5 15.0 26.0
39

IOCCP-JAMSTEC 2015 Inter calibration exercise
Table 6-6. Combined Z-scores for phosphate and nitrate+nitrite analyses.
Lab RM-BY RM-BU RM-CA RM-BV CRM 7601-a
CRM 7602-a
CRM 7603-a
4 3.9 2.7 1.8 1.1 5
0.4 5.9 2.5 0.7 0.3 1.6
7 2.8 7.1 11.7 14.7 8 2.8 0.5 3.1 2.5 1.5 2.5 1.6
10 2.9 3.2 1.6 1.4 14
0.9 0.9 0.3
1.0 0.4
17
0.6 3.1 2.6 19 0.5 0.7 1.1 1.1 20 0.5 0.9 0.8 0.6 23 0.5 0.4 0.4 0.6 26 1.5 1.1 0.7 0.8 27 0.4 1.5 1.0 1.7 0.7 1.2 1.6
28 5.4 0.2 3.2 3.7 29 1.5 1.6 1.2 1.3 1.0 0.7 0.9
30
32.9 10.0 16.0 32 3.8 7.7 3.3 5.2 35 0.9 0.8 0.3 0.4
0.6 0.6 37
38 0.5 0.9 1.1 1.1 39 0.6 1.1 1.0 0.5 40
4.0 0.8 2.4
41 4.2 4.2 0.3 2.7 45
49_QuAAtro_1st 1.2 0.6 1.3 1.6 1.1 1.0 1.6 49_AA3_1st 2.0 2.1 1.8 2.8 1.7 0.2 0.3
49_QuAAtro_2nd
1.1 1.0 1.6 49_AA3_2nd
1.6 0.1 0.3
50 0.2 0.7 0.4 0.4 51
6.9
5.1
52 0.7 1.1 0.2 0.4 56 1.5 3.9 1.0 0.6 0.7 1.3 0.9
57 2.9 1.1 0.9 0.4 59 6.4 13.0 3.1 3.3 64 0.5 1.0 0.5 1.5 0.8 0.4 0.8
65 1.2 1.0 1.2 1.6 0.4 1.3 1.2 80 41.6 20.8 3.8 3.9
86 1.6 2.3 1.8 2.7
1.0 0.7 87 1.0 0.4 0.3 0.3
88 22.2 6.6 0.5 1.1 89 1.2 10.7 11.4 22.9 90
7.6 6.9 8.0
91 0.7 0.8 0.7 0.7 92 0.4 0.7 1.2 0.6 0.8 0.7
93 0.5 0.5 0.2 0.2 95 1.6 2.6 2.8 3.2 96 1.6 0.5 1.3 1.5 0.5 0.9 0.9
97 4.0 25.8 2.2 1.3
40
IOCCP-JAMSTEC 2015 Inter calibration exercise
Table 6-6. Combined Z-scores for phosphate and nitrate+nitrite analyses (continued).
Lab RM-BY RM-BU RM-CA RM-BV CRM 7601-a
CRM 7602-a
CRM 7603-a
98
4.1 10.2 5.4 99
5.1 5.9 12.6
100 9.9 2.6 1.3 3.6 101 0.2 1.9 0.7 0.4 0.4 1.1 0.8
102 1.5 3.3 3.0 3.3 0.6 3.0 1.3 104 1.3 1.5 6.2 8.2 2.4 3.7 4.1 106 1.2 3.9 1.7 2.0
107 0.7 0.6 0.7 0.7 108
15.4 2.9 6.3
109 0.9 2.5 1.6 1.4 1.0 0.5 0.2 111 1.3 2.4 0.6 0.9
112 0.4 0.8 0.4 1.3 113 0.7 0.6 0.4 0.6 114 7.5 3.7 1.7 1.4
41
IOCCP-JAMSTEC 2015 Inter calibration exercise
Table 6-7. Combined Z-scores for phosphate, nitrate+nitrite, and silicate analyses.
Lab RM-BY RM-BU RM-CA RM-BV CRM 7601-a
CRM 7602-a
CRM 7603-a
4 2.8 2.9 1.4 2.7 5
0.6 5.0 1.7 0.7 0.4 9.4
7 1.8 4.8 8.2 10.2 8 4.3 3.1 5.3 6.9 1.5 4.9 6.6
10 2.7 2.6 1.6 2.2 14
0.6 0.6 0.4
0.7 0.3
17
4.3 6.5 8.6 19 0.4 0.6 1.0 1.2 20 0.4 0.9 0.9 0.8 23 5.1 0.4 0.6 1.3 26 2.6 0.7 0.7 1.4 27 0.6 1.2 0.9 1.9 0.5 1.1 1.7
28 5.3 0.5 2.7 2.6 29 3.5 1.6 1.0 1.3 1.0 0.8 1.1
30
26.7 7.4 14.3 32 2.6 5.5 2.6 4.7 35 1.8 0.9 0.5 0.6
0.8 0.8 37
38 0.6 0.8 0.8 1.3 39 0.5 0.9 1.0 0.6 40
3.2 0.6 4.9
41 2.9 3.1 0.3 2.2 45
49_QuAAtro_1st 8.9 1.8 2.1 3.2 4.0 2.8 3.8 49_AA3_1st 11.1 3.4 3.3 4.8 5.0
49_QuAAtro_2nd
2.8 3.8 49_AA3_2nd
5.0 1.7 2.3
50 0.8 0.8 0.3 0.6 51
5.6
5.9
52 0.6 0.9 0.1 0.3 56 1.1 2.6 1.0 0.7 1.1 1.1 0.6
57 4.8 0.8 0.6 0.3 59 12.4 9.0 2.4 2.3 64 0.7 0.9 0.4 1.3 0.8 0.3 0.7
65 1.0 0.8 0.9 1.3 0.4 0.9 1.1 80 31.4 14.3 3.1 4.7
86 8.6 1.8 1.6 2.1
0.8 87 1.8 0.4 0.3 0.5
88 18.1 5.0 1.1 1.7 89 5.2 7.7 7.8 15.6 90
5.3 5.0 5.3
91 0.8 0.7 0.5 0.8 92 0.6 0.8 1.1 0.5 0.9 0.9
93 0.5 0.5 0.3 0.6 95 1.0 2.9 2.4 2.7 96 1.4 0.5 0.9 1.1 0.4 0.7 0.6
97 17.2 17.6 2.7 3.0
42

IOCCP-JAMSTEC 2015 Inter calibration exercise
Table 6-7. Combined Z-scores for phosphate, nitrate+nitrite, and silicate analyses (continued).
Lab RM-BY RM-BU RM-CA RM-BV CRM 7601-a
CRM 7602-a
CRM 7603-a
98
9.6 14.6 6.7 99
4.4 4.4 10.0
100 7.3 1.9 1.2 2.6 101 0.2 1.7 0.9 1.1 0.4 1.2 1.4
102 2.1 2.3 2.1 2.2 0.6 2.1 1.0 104 2.4 4.6 4.3 6.5 3.5 3.4 2.9 106 1.8 2.9 1.2 4.9
107 1.0 0.6 1.0 0.6 108
11.5 9.1 7.6
109 1.1 2.1 1.7 1.5 1.1 0.9 0.5 111 0.9 2.5 0.6 1.1
112 4.2 0.6 0.4 1.1 113 1.1 0.7 0.7 0.7 114 6.8 7.5 9.6
43
IOCCP-JAMSTEC 2015 Inter calibration exercise
5.5 Normalized Cumulative distribution of reported nitrate, phosphate and silicate concentrations in 2008, 2012 and 2015 I/C studies
Normalized cumulative distributions of reported nitrate, phosphate and silicate concentrations in 2008, 2012 and 2015 I/C studies are shown in Figures 6 – 8.
Each reported concentration from participating laboratory was divided by the consensus median of each comparison study to compare comparability among the laboratories in each comparison study in 2008, 2012 and 2015. In general, normalized cumulative distributions for nitrate and silicate are quite similar, thus magnitude of comparability during these three I/C studies were similar while those for phosphate were going to relatively flat which may indicate that comparability of phosphate analysis becomes better.
Figure 6. Cumulative distribution of reported nitrate concentrations in 2008, 2012 and 2015 I/C studies.
44

IOCCP-JAMSTEC 2015 Inter calibration exercise
Figure 7. Cumulative distribution of reported phosphate concentrations in 2008, 2012 and 2015 I/C studies.
Figure 8. Cumulative distribution of reported silicate concentrations in 2008, 2012 and 2015 I/C studies.
45

IOCCP-JAMSTEC 2015 Inter calibration exercise
6. Comparison with certified values
KANSO and JAMTEC jointly certified CRMs, lot. BY, BU, CA and BV, which was used in this I/C study. The new certified values were issued on 24 June 2015 and the certified values are summarized in Table 1. The detail of certification processes will be presented elsewhere later. We see excellent agreement between consensus median/mean and certified values as shown in Table 4. It is however small discrepancies between core laboratories who reported close to consensus values and certified values as shown in the Figures 1-1 to 5-2.
7. Discussion and conclusions
When we look at table 3 and 4 and Figures 1-1 to 5-2 and 7-9, it is clear that present comparability among the participants in 2015 I/C exercise is quite similar with previously obtained comparability in 2012 I/C study and previous I/C studies. Consensus standard deviations of all determinands are one order of magnitude large rather than homogeneity of the CRMs distributed and consensus standard deviations are about double of reported precision of measurements of the laboratories. Therefore these I/C results show that use of CRM will be able to greatly improve comparability of nutrient data among the laboratories in the world.
There are good signal in the results that although consensus standard deviations are relatively large, consensus median/mean of each samples showed good agreement with certified values of the samples within consensus SDs. This implies that majority of the participating laboratories have good capability to measure nutrients concentration in seawater and using CRM will increase more on the comparability and could be their results to be SI traceable quickly.
Thus, the use of a common reference material and the adoption of an internationally agreed-upon nutrient scale system and the common use of the methodology of nutrients measurements would increase comparability among laboratories worldwide, and the use of a certified reference material would establish traceability, based on the current high level of analytical performance at participating laboratories.
Acknowledgements
Michio Aoyama as the organizer of this I/C exercise appreciate to all participating laboratories, KIOST and NIOZ for their contribution to this 2014/2015 I/C study. The authors thank a support team of Marine Works Japan for this I/C study especially thanks Yoshiko Ishikawa and Yasuhiro Arii for their help to create database of this I/C study results and preparing tables and figures of this report. The authors also thank for financial support by IOCCP and JAMSTEC to buy 4 lots of CRM produced by KANSO and to ship the CRMs to the participants. With these financial support, we were able to
46

IOCCP-JAMSTEC 2015 Inter calibration exercise
free the participation fee to this I/C exercise. A part of this work was also supported by the SCOR WG#147 (NSF grant number OCE-1546580) .
References
[AMC] Analytical Methods Committee, 2001: Robust Statistics: a method of coping with outliers. Technical Brief No.6 April 2001
Aminot, A. and R. Kerouel, 1991: Autoclaved seawater as a reference material for the determination of nitrate and phosphate in seawater. Anal. Chim. Acta, 248, 277–283.
Aminot, A. and R. Kerouel, 1995: Reference material for nutrients in seawater: stability of nitrate, nitrite, ammonia and phosphate in autoclaved samples. Mar. Chem., 49, 221–232.
Aminot, A. and D. S. Kirkwood, 1995: Report on the results of the fifth ICES Inter-comparison study for Nutrients in Seawater, ICES Cooperative Research Report No. 213, 79 pp.
Aoyama, M., 2006: 2003 Intercomparison Exercise for Reference Material for Nutrients in Seawater in a Seawater Matrix, Technical Reports of the Meteorological Research Institute, No.50, 91 pp, Tsukuba, Japan.DOI:10.11483/mritechrepo.50
Aoyama, M., S. Becker, M. Dai, H. Daimon, L. I. Gordon, H. Kasai, R. Kerouel, N. Kress, D. Masten, A. Murata, N. Nagai, H. Ogawa, H. Ota, H. Saito, K. Saito, T. Shimizu, H. Takano, A. Tsuda, K. Yokouchi, A. Youenou, Analytical Science, 2007, Recent comparability of Oceanographic Nutrients Data: Results of a 2003 Intercomparison Exercise using Reference Materials, Analytical Science, 23, 1151–1154.
Aoyama, M., J. Barwell-Clarke, S. Becker, M. Blum, Braga E. S., S. C. Coverly,E. Czobik, I. Dahllof, M. H. Dai, G. O. Donnell, C. Engelke, G. C. Gong, Gi-Hoon Hong, D. J. Hydes, M. M. Jin, H. Kasai, R. Kerouel, Y. Kiyomono, M. Knockaert, N. Kress, K. A. Krogslund, M. Kumagai, S. Leterme, Yarong Li, S. Masuda, T. Miyao, T. Moutin, A. Murata, N. Nagai, G.Nausch, M. K. Ngirchechol, A. Nybakk, H. Ogawa, J. van Ooijen, H. Ota, J. M. Pan, C. Payne, O. Pierre-Duplessix, M. Pujo-Pay, T. Raabe, K. Saito,K. Sato, C. Schmidt, M. Schuett, T. M. Shammon, J. Sun, T. Tanhua, L. White, E.M.S. Woodward, P. Worsfold, P. Yeats, T. Yoshimura, A.Youenou, J. Z. Zhang, 2008: 2006 Inter-laboratory Comparison Study for Reference Material for Nutrients in Seawater, Technical Reports of the Meteorological Research Institute, No. 58, 104 pp, Tsukuba, Japan.DOI:10.11483/mritechrepo.58
Aoyama, Michio, Carol Anstey, Janet Barwell-Clarke, François Baurand, Susan Becker, Marguerite Blum, Stephen C. Coverly , Edward Czobik, Florence D’amico, Ingela Dahllöf, Minhan Dai, Judy Dobson, Magali Duval, Clemens Engelke, Gwo-Ching Gong, Olivier Grosso, Atsushi Hirayama, Hiroyuki Inoue, Yuzo Ishida, David J. Hydes, Hiromi Kasai, Roger Kerouel, Marc Knockaert, Nurit Kress, Katherine A. Krogslund, Masamitsu Kumagai, Sophie C. Leterme, Claire Mahaffey, Hitoshi Mitsuda, Pascal Morin, Thierry Moutin, Dominique Munaron, Akihiko Murata, Günther Nausch, Hiroshi Ogawa, Jan van Ooijen, Jianming Pan, Georges Paradis, Chris Payne, Olivier Pierre-Duplessix, Gary Prove, Patrick Raimbault,
47

IOCCP-JAMSTEC 2015 Inter calibration exercise
Malcolm Rose, Kazuhiro Saito, Hiroaki Saito, Kenichiro Sato, Cristopher Schmidt, Monika Schütt, Theresa M. Shammon, Solveig Olafsdottir0, Jun Sun, Toste Tanhua, Sieglinde Weigelt-Krenz, Linda White, E. Malcolm S. Woodward, Paul Worsfold, Takeshi Yoshimura, Agnès Youénou, Jia-Zhong Zhang, 2010, 2008 Inter-laboratory Comparison Study for Reference Material for Nutrients in Seawater, Technical Reports of the Meteorological Research Institute, No. 60, 134 pp, Tsukuba, Japan. DOI:10.11483/mritechrepo.60
Bindoff, N.L., J. Willebrand, V. Artale, A, Cazenave, J. Gregory, S. Gulev, K. Hanawa, C. Le Quéré, S. Levitus, Y. Nojiri, C.K. Shum, L.D. Talley and A. Unnikrishnan, 2007: Observations: Oceanic Climate Change and Sea Level. In: Climate Change 2007: The Physical Science Basis. Contribution of Working Group I to the Fourth Assessment Report of the Intergovernmental Panel on Climate Change [Solomon, S., D. Qin, M. Manning, Z. Chen, M. Marquis, K.B. Averyt, M. Tignor and H.L. Miller (eds.)]. Cambridge University Press, Cambridge, United Kingdom and New York, NY, USA.
Clancy, V. and S. Willie, 2003: NOAA/NRC Inter-comparison for Nutrients in Seawater, NOAA Technical Memorandum NOS NCCOS CCMA 158, 32 pp.
Clancy, V. and S. Willie, 2004: Preparation and certification of a reference material for the determination of nutrients in seawater. Anal. Bioanal. Chem., 378 (5), 1239–1242.
[ICES] International Council for the Exploration of the Sea, 1967: Report on the analysis of phosphate at the ICES intercalibration trials of chemical methods held at Copenhagen, 1966. ICES CM 1967/C:20.
[ICES] International Council for the Exploration of the Sea, 1977: The International Intercalibration Exercise for Nutrient Methods, ICES Cooperative Research Report No. 67. 44 pp.
Kirkwood, D. S., A. Aminot, and M. Perttila, 1991: Report on the results of the fourth ICES Inter-comparison study for Nutrients in Seawater, ICES Cooperative Research Report No. 174, 83 pp.
[UNESCO] United Nations Educational, Scientific and Cultural Organization, 1965: Report on the intercalibration measurements in Copenhagen, 9–13 June 1965, UNESCO Technical Papers in Marine Science, No. 3. 14 pp.
[UNESCO] United Nations Educational, Scientific and Cultural Organization, 1967: Report on intercalibration measurements, Leningrad, 24–28 May 1966, Copenhagen, September 1966, UNESCO Technical Papers in Marine Science, No. 9. 114 pp.
[UNESCO] United Nations Educational, Scientific and Cultural Organization, 1991: IOC-IAEA-UNEP Group of Experts on Standards and Reference Materials (GESREM), 2nd session, 12 pp.
[UNESCO] United Nations Educational, Scientific and Cultural Organization, 1992: IOC-IAEA-UNEP Group of Experts on Standards and Reference Materials (GESREM), 3rd session, 16 pp.
Willie, S. and V. Clancy, 2000: NOAA/NRC Inter-comparison for Nutrients in Seawater, NOAA Technical Memorandum NOS NCCOS CCMA 143, 176 pp
48

IOCCP-JAMSTEC 2015 Inter calibration exercise
1
Appendix I
Table A1 List of participants
Table A2 Cross reference for Lab numbers in 2015, 2012, 2008, 2006 and 2003 I/C studies

IOCCP-JAMSTEC 2015 Inter calibration exercise
2
Dummy

IOCCP-JAMSTEC 2015 Inter calibration exercise
3
Table A1 List of participants
Lab# Name Affliation Country 4 Gary Prove Queensland Health Forensic and
Scientific Services Australia
5 Marc Knockaert OD NATURE – ECOCHEM Belgium
6 Steven Bell Bermuda Institute of Ocean Sciences
Bermuda
7 Elisabete de Santis Braga Laboratório de Nutrientes, Micronutrientes e Traços nos Oceanos (LABNUT-IOUSP), Instituto Oceanográfico da Universidade de São Paulo
Brazil
8 Rodolfo Paranhos Institute of Biology, Rio de Janeiro Federal University
Brazil
10 Chris Payne University of British Columbia, Department of Earth, Ocean & Atmospheric Sciences
Canada
14 Lifang Wang Tao Wang Minhan Dai
State Key laboratory of Marine Environmental Science, Xiamen University
China
17 Jun Sun College of Marine and Environmental Sciences, Tianjin University of Science and Technology
China
19 Florian Caradec Anne Daniel
Ifremer, DYNECO/PELAGOS, Plouzané
France
20 Emilie Rabiller Olivier Pierre-Duplessix
Ifremer, LERN, Port en Bessin France
23 Patrick Raimbault Mediterranean Institute of Oceanology (MIO) Campus de Luminy
France
26 Günther Nausch Leibniz-Institute for Baltic Sea Research Warnemünde (IOW)
Germany
27 Rita Kramer Bundesamt für Seeschifffahrt und Hydrographie (BSH), Laboratorium Sülldorf
Germany
28 Kai-Uwe Ludwichowski Alfred-Wegener-Institute; Helmholtz Centre for Polar and Marine Research
Germany

IOCCP-JAMSTEC 2015 Inter calibration exercise
4
Lab# Name Affliation Country 29 Sólveig Rósa Ólafsdóttir Marine Research Institute Iceland
30 Muhamed Ashraf P Central Institute of Fisheries Technology
India
32 Nurit Kress Israel Oceanographic & Limnological Res, National Institute of Oceanography
Israel
35 Sukeyoshi Takatani Japan Meteorological Agency Japan
37 Takeshi Yoshimura Environmental Science Research Laboratory, Central Research Institute of Electric Power Industry
Japan
38 Taketoshi Komada Japan Sea National Fisheries Research Institute, Japan Fisheries Research and Education Agency
Japan
39 Jan van Ooijen Royal NIOZ Netherlands 40 Mike Crump National Institute of Water and
Atmospheric Research (NIWA) New Zealand
41 Kjell Gundersen Kjemilaboratoriet / Chemistry Laboratory, Havforskningsinstituttet / Institute of Marine Research
Norway
45 Howard Waldron Raymond Roman
University of Cape town, Dept of Oceanography
South Africa
49 Sinhué Torres-Valdés National Oceanography Centre, Southampton
UK
50 E. Malcolm S. Woodward Plymouth Marine Laboratory UK
51 Pamela Walsham Alison Taylor
Marine Scotland - Science UK
52 Claire Mahaffey Clare Davis
Department of Earth, Ocean and Ecological Sciences, SOES, University of Liverpool
UK
56 Susan Becker Scripps Institution of Oceanography
USA
57 Jia-Zhong Zhang NOAA Atlantic Oceanographic and Meteorological Laboratory (AOML), Miami, Florida
USA

IOCCP-JAMSTEC 2015 Inter calibration exercise
5
Lab# Name Affliation Country 59 Marguerite Blum Monterey Bay Aquarium
Research Institute USA
64 Rebecca Briggs University of Hawaii, SOEST Laboratory for Analytical Biogeochemistry (S-LAB)
USA
65 Susan Curless Matt Church
Hawaii Ocean Time-series USA
80 Jesús Ledesma Instituto del Mar del Perú Peru
86 Martina Kralj Istituto Nazionale di Oceanografia e Geofisica Sperimentale
Italy
87 Peter Thamer Department of Fisheries and Oceans Canada
Canada
88 Sólvá Jacobsen Faroe Marine Research Institute Faroe Islands
89 Trevor McCormack Scottish Environment Protection Agency
UK
90 Adil Bakir School of Earth and Environmental Science,University of Portsmouth
UK
91 Linda White Department of Fisheries and Oceans Canada, Institute of Ocean Sciences
Canada
92 Thierry Cariou Station Biologique de Roscoff, Centre national de la recherche scientifique (CNRS) / Université Pierre et Marie Curie
France
93 Frank Malien Martina Lohmann
GEOMAR Helmholtz Center for Ocean Research, Kiel
Germany
95 Hema Naik National Institute of Oceanography
India
96 Tamara Fraser Department of Fisheries and Oceans Canada, Institute of Ocean Sciences
Canada
97 Xinxin Li Geochemical & Environmental Research Group, Texas A&M University
USA
98 Silvie Lainela University of Tartu, Estonian Marine Institute
Estonia
99 Iban Murillo Centro de Investigaciones Biológicas del, Noroeste SC.
Mexico
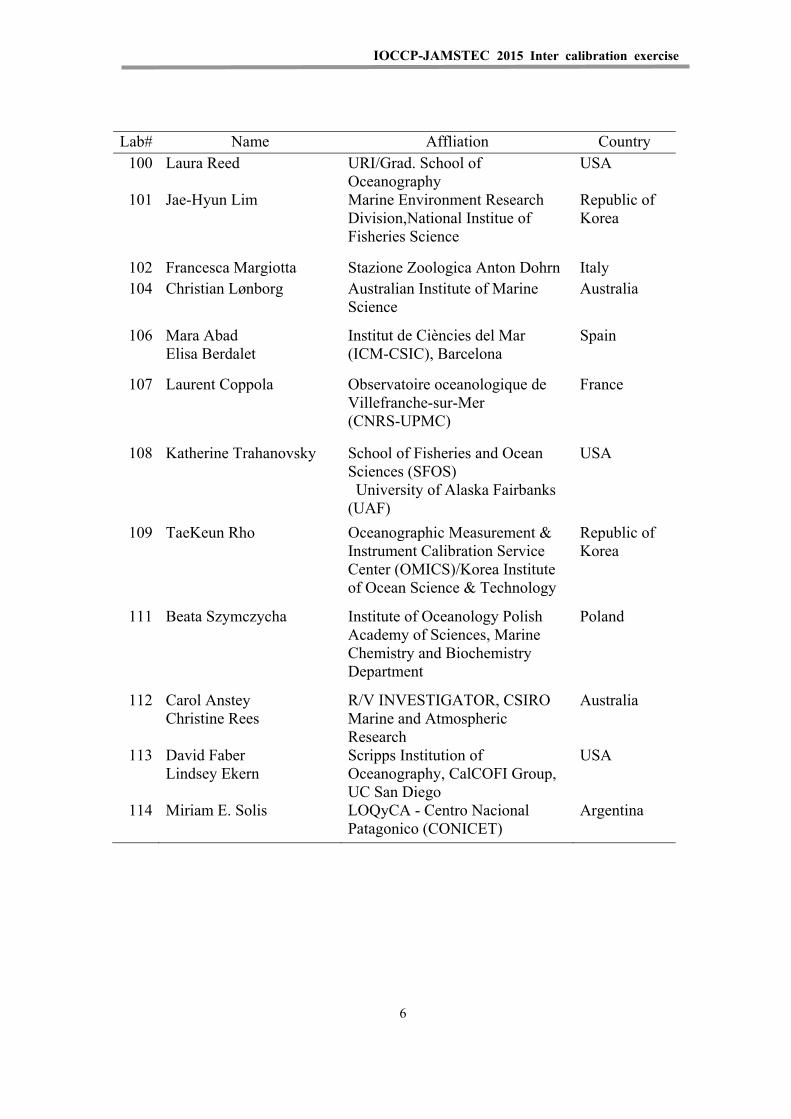
IOCCP-JAMSTEC 2015 Inter calibration exercise
6
Lab# Name Affliation Country 100 Laura Reed URI/Grad. School of
Oceanography USA
101 Jae-Hyun Lim Marine Environment Research Division,National Institue of Fisheries Science
Republic of Korea
102 Francesca Margiotta Stazione Zoologica Anton Dohrn Italy 104 Christian Lønborg Australian Institute of Marine
Science Australia
106 Mara Abad Elisa Berdalet
Institut de Ciències del Mar (ICM-CSIC), Barcelona
Spain
107 Laurent Coppola Observatoire oceanologique de Villefranche-sur-Mer (CNRS-UPMC)
France
108 Katherine Trahanovsky School of Fisheries and Ocean Sciences (SFOS) University of Alaska Fairbanks (UAF)
USA
109 TaeKeun Rho Oceanographic Measurement & Instrument Calibration Service Center (OMICS)/Korea Institute of Ocean Science & Technology
Republic of Korea
111 Beata Szymczycha Institute of Oceanology Polish Academy of Sciences, Marine Chemistry and Biochemistry Department
Poland
112 Carol Anstey Christine Rees
R/V INVESTIGATOR, CSIRO Marine and Atmospheric Research
Australia
113 David Faber Lindsey Ekern
Scripps Institution of Oceanography, CalCOFI Group, UC San Diego
USA
114 Miriam E. Solis LOQyCA - Centro Nacional Patagonico (CONICET)
Argentina
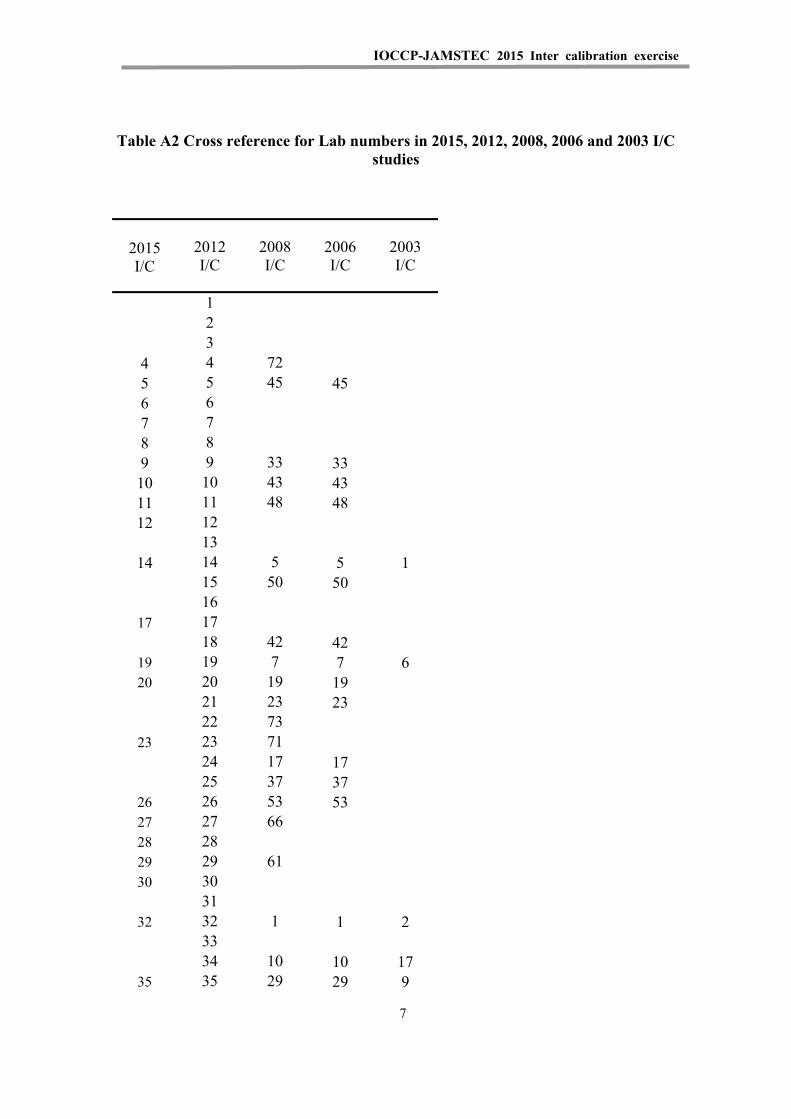
IOCCP-JAMSTEC 2015 Inter calibration exercise
7
Table A2 Cross reference for Lab numbers in 2015, 2012, 2008, 2006 and 2003 I/C studies
2015 I/C
2012 I/C
2008 I/C
2006 I/C
2003 I/C
1 2 3
4 4 72 5 5 45 45 6 6 7 7 8 8 9 9 33 33 10 10 43 43 11 11 48 48 12 12
13 14 14 5 5 1
15 50 50 16
17 17 18 42 42
19 19 7 7 6 20 20 19 19
21 23 23 22 73
23 23 71 24 17 17 25 37 37
26 26 53 53 27 27 66 28 28 29 29 61 30 30
31 32 32 1 1 2
33 34 10 10 17
35 35 29 29 9

IOCCP-JAMSTEC 2015 Inter calibration exercise
8
2015 I/C
2012 I/C
2008 I/C
2006 I/C
2003 I/C
36 38 38 13 37 37 40 40 38 38 65 8 39 39 25 25 40 40 41 41
42 43 44
45 45 46 47
48 48 49 49 6 6 50 50 14 14 51 51 62 52 52 75
53 28-1 28 54 55
56 56 3 3 3 57 57 4 4 58 58 9 9 59 59 34 34 60 60 36 36 61 61
62 63 63 64 64 65 65
66 67 68 63
69 69 72 80 84 86 87 88
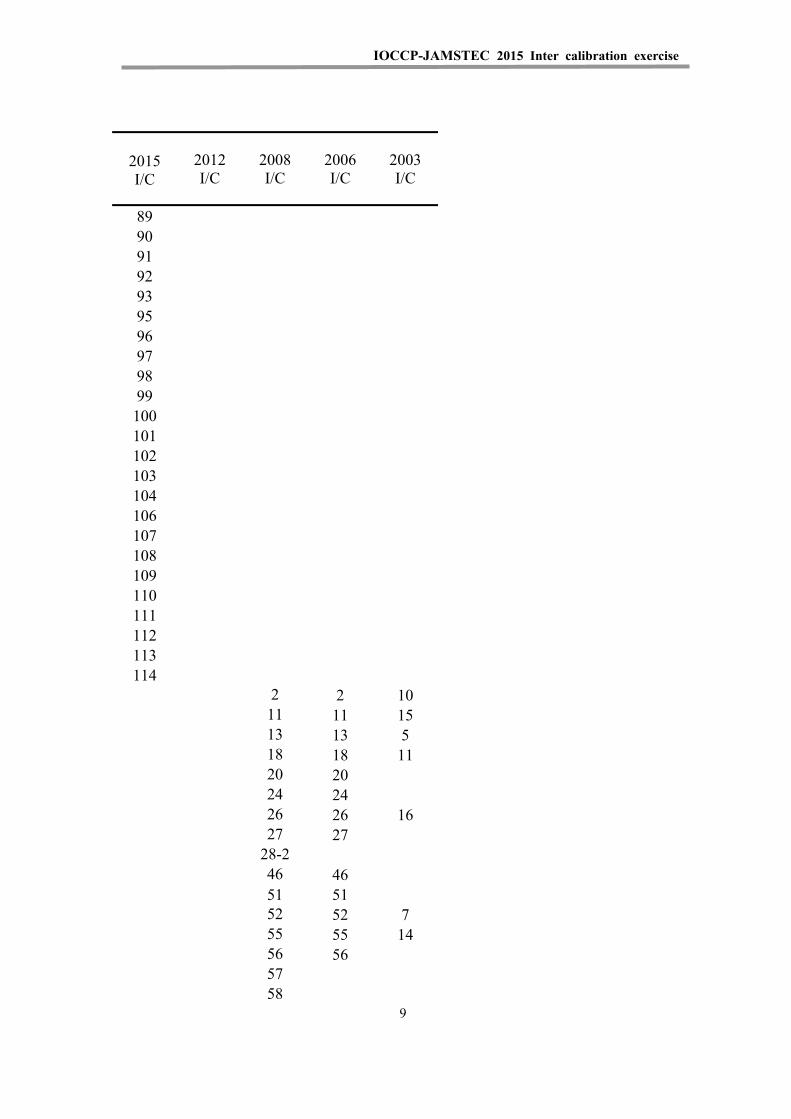
IOCCP-JAMSTEC 2015 Inter calibration exercise
9
2015 I/C
2012 I/C
2008 I/C
2006 I/C
2003 I/C
89 90 91 92 93 95 96 97 98 99 100 101 102 103 104 106 107 108 109 110 111 112 113 114
2 2 10 11 11 15 13 13 5 18 18 11 20 20 24 24 26 26 16 27 27 28-2 46 46 51 51 52 52 7 55 55 14 56 56 57 58

IOCCP-JAMSTEC 2015 Inter calibration exercise
10
2015 I/C
2012 I/C
2008 I/C
2006 I/C
2003 I/C
59 60 64 68 69 70 71-2 74 12 15 18 16 30 31 32 35 39 44 47 49
54
IOCCP-JAMSTEC 2015 Inter calibration exercise
Appendix II
Results reported by participants
Table A3 Nutirient results reported by the participants
Table A4 Ammonia results reported by the participants
Table A5 DOP results reported by the participants
Table A6 DON results reported by the participants
Table A7 DOC results reported by the participants
(Concentrations in Talbes A3-A7 are in units of µmol kg-1)
1
IOCCP-JAMSTEC 2015 Inter calibration exercise
Dummy
2

Lab
Sam
ple
Yea
rM
onth
Day
Tem
per
atu
reP
hosp
hate
ERR
Flag
Nitr
ite
ERR
Flag
Nitr
ate
ERR
Flag
NOX
ERR
Flag
RED
UCT
Sili
cate
ERR
Flag
20
15 I
C re
sult
s re
port
ed b
y th
e p
art
icip
an
tsin
mic
ro m
ole
s per
kil
ogra
m
4
CR
M 7
601
-a
CR
M 7
602-a
CR
M 7
603-a
RM
-BU
20
15
01
19
24
0.2
93
0.0
59
20
.08
0.1
42
4.0
30
.28
24
.10
.28
21
9.2
52
.05
2
RM
-BV
20
15
01
19
24
2.5
70
.15
62
0.0
40
.14
23
4.8
91
.56
23
4.8
91
.56
21
08
.49
3.8
12
RM
-BY
20
15
01
19
24
00
.05
92
0.0
10
.14
20
.15
0.1
42
0.1
60
.14
21
.72
1.7
62
RM
-CA
20
15
01
19
24
1.3
39
0.1
27
20
.03
0.1
42
19
.74
0.9
12
19
.84
0.9
12
35
.67
2.4
42
5
CR
M 7
601
-a2
015
02
15
22
0.0
46
02
0.0
30
.12
0.0
10
20
.04
02
1.1
70
.04
2
CR
M 7
602-a
20
15
02
15
22
1.1
40
.02
20
.39
0.1
21
5.4
60
.16
21
5.8
50
.16
22
9.4
90
.89
2
CR
M 7
603-a
20
15
02
15
22
3.2
29
0.0
68
20
.02
0.1
24
6.3
40
.46
24
6.3
60
.46
29
6.0
82
.88
2
RM
-BU
20
15
02
15
22
0.3
54
0.0
07
20
.08
0.1
23
.87
0.0
42
3.9
50
.04
22
1.1
60
.63
2
RM
-BV
20
15
02
15
22
2.5
80
.04
92
0.0
50
.12
36
.72
0.3
62
36
.76
0.3
62
10
13
.03
2
RM
-BY
20
15
02
15
22
0.0
32
02
0.0
20
.12
<0
.24
5<
0.2
45
1.6
30
.05
2
RM
-CA
20
15
02
15
22
1.4
86
0.0
29
20
.06
0.1
22
2.5
0.2
22
22
.56
0.2
22
38
.13
1.1
42
7
CR
M 7
601-a
CR
M 7
602-a
CR
M 7
603-a
RM
-BU
20
15
03
31
22
0.2
28
0.0
05
20
.14
02
4.2
40
.02
24
.38
0.0
22
20
.89
0.4
72
RM
-BV
20
15
03
31
22
1.5
84
0.0
12
0.1
20
23
8.1
10
.36
23
8.2
30
.36
29
9.5
70
.97
2
RM
-BY
20
15
03
31
22
0.0
28
0.0
13
20
.02
02
0.1
60
.06
20
.18
0.0
62
1.7
50
.17
2
RM
-CA
20
15
03
31
22
0.8
73
0.0
12
0.1
30
22
1.1
20
.22
22
1.2
10
.17
23
5.2
20
.08
2
8
CR
M 7
601-a
20
15
02
24
23
0.0
37
0.0
26
20
.06
02
0.0
80
.01
20
.14
02
1.1
10
.04
2
CR
M 7
602
-a2
015
02
26
23
1.0
40
.00
42
0.4
10
21
6.4
0.1
72
16
.81
0.1
82
24
.56
0.0
62
CR
M 7
603-a
20
15
02
26
23
2.9
95
0.0
05
20
.03
02
46
.34
0.1
42
46
.37
0.1
42
11
1.7
70
.63
2
RM
-BU
20
15
02
26
23
0.3
39
0.0
06
20
.09
02
3.9
10
.08
24
0.0
82
17
.06
0.0
42
RM
-BV
20
15
02
26
23
2.4
21
0.0
06
20
.06
02
36
.48
0.1
72
36
.55
0.2
28
1.8
50
.16
2
RM
-BY
20
15
02
24
23
0.0
65
0.0
03
20
.05
02
0.0
90
.02
20
.14
02
1.4
50
.03
2
RM
-CA
20
15
02
26
23
1.3
26
0.0
06
20
.06
02
20
.47
0.0
52
20
.55
0.0
42
29
.64
0.0
52
IOCCP-JAMSTEC 2015 Inter calibration exercise

Lab
Sam
ple
Yea
rM
onth
Day
Tem
per
atu
reP
hosp
hate
ERR
Flag
Nitr
ite
ERR
Flag
Nitr
ate
ERR
Flag
NOX
ERR
Flag
RED
UCT
Sili
cate
ERR
Flag
20
15 I
C re
sult
s re
port
ed b
y th
e p
art
icip
an
tsin
mic
ro m
ole
s per
kil
ogra
m
10
CR
M 7
601
-a
CR
M 7
602-a
CR
M 7
603-a
RM
-BU
20
15
03
26
21
0.2
97
0.0
49
20
.06
0.0
22
3.7
40
.29
23
.80
.29
22
1.3
70
.98
2
RM
-BV
20
15
03
26
21
2.4
67
0.0
49
20
.05
0.0
22
34
.37
0.2
92
34
.42
0.2
92
10
5.6
90
.98
2
RM
-BY
20
15
03
26
21
00
.04
92
00
.02
20
0.2
92
00
.29
21
.66
0.4
92
RM
-CA
20
15
03
26
21
1.3
71
0.0
49
20
.06
0.0
22
19
.07
0.2
92
19
.13
0.2
92
37
.24
0.9
82
14
CR
M 7
601
-a2
015
01
28
18
.3<
0.0
45
<0
.15
<0
.15
1.3
30
2
CR
M 7
602-a
20
15
01
28
18
.31
.09
60
.00
32
0.4
02
15
.19
0.0
22
15
.58
0.0
22
29
.94
0.0
42
CR
M 7
603-a
20
15
01
28
18
.33
.08
10
.00
32
0.0
20
24
3.9
90
.06
24
4.0
10
.06
21
44
.42
0.0
72
RM
-BU
20
15
01
28
18
.30
.35
50
.00
12
0.0
70
23
.83
0.0
12
3.9
10
.01
22
0.6
50
2
RM
-BV
20
15
01
28
18
.32
.51
70
.00
82
0.0
40
23
4.9
50
.14
23
4.9
90
.15
21
01
.55
0.0
92
RM
-BY
20
15
01
28
18
.3<
0.0
85
<0
.04
5<
0.1
5<
0.1
51
.71
0.0
12
RM
-CA
20
15
01
28
18
.31
.39
60
.00
32
0.0
60
21
9.2
50
.05
21
9.3
10
.05
23
6.1
50
.03
2
17
CR
M 7
601-a
CR
M 7
602-a
CR
M 7
603-a
RM
-BU
20
15
02
03
24
.50
.35
0.0
29
20
.05
02
3.8
70
.15
23
.92
0.1
52
15
.47
0.1
12
RM
-BV
20
15
02
03
24
.52
.41
30
.01
82
0.0
10
23
3.8
90
.79
23
3.9
0.7
92
75
.80
.13
2
RM
-BY
20
15
02
03
24
.5N
AN
A5
NA
NA
50
.06
0.0
12
0.0
50
.01
21
.09
0.0
22
RM
-CA
20
15
02
03
24
.51
.28
90
.06
20
.03
02
19
.03
0.5
72
19
.06
0.5
72
27
.25
0.0
62
19
CR
M 7
601-a
CR
M 7
602
-a
CR
M 7
603-a
RM
-BU
20
15
02
15
19
0.3
50
.01
20
.08
02
3.9
70
.12
4.0
50
.12
20
.98
0.0
52
RM
-BV
20
15
02
15
19
2.4
94
0.0
05
20
.05
02
35
.96
0.1
23
6.0
10
.12
10
2.8
90
.22
RM
-BY
20
15
02
15
19
0.0
40
.00
52
0.0
20
20
0.0
32
0.0
20
.03
21
.76
0.0
52
RM
-CA
20
15
02
15
19
1.3
97
0.0
05
20
.07
02
19
.97
0.0
32
20
.03
0.0
32
36
.59
0.1
2
IOCCP-JAMSTEC 2015 Inter calibration exercise

Lab
Sam
ple
Yea
rM
onth
Day
Tem
per
atu
reP
hosp
hate
ERR
Flag
Nitr
ite
ERR
Flag
Nitr
ate
ERR
Flag
NOX
ERR
Flag
RED
UCT
Sili
cate
ERR
Flag
20
15 I
C re
sult
s re
port
ed b
y th
e p
art
icip
an
tsin
mic
ro m
ole
s per
kil
ogra
m
20
CR
M 7
601
-a
CR
M 7
602-a
CR
M 7
603-a
RM
-BU
20
15
02
06
21
0.3
46
0.0
21
20
.08
02
3.9
80
.08
24
.06
0.0
82
21
.12
0.1
52
RM
-BV
20
15
02
06
21
2.5
10
.02
20
.05
02
35
.74
0.8
22
35
.79
0.8
22
10
2.6
40
.59
2
RM
-BY
20
15
02
06
21
0.0
30
.00
22
0.0
20
20
.03
02
0.0
50
21
.74
0.0
32
RM
-CA
20
15
02
06
21
1.4
26
0.0
29
20
.06
02
19
.93
0.6
21
9.9
90
.62
36
.80
.22
2
23
CR
M 7
601
-a
CR
M 7
602-a
CR
M 7
603-a
RM
-BU
20
15
03
26
19
0.3
57
0.0
12
20
.07
02
3.9
0.0
12
3.9
60
.01
22
0.5
10
.27
2
RM
-BV
20
15
03
26
19
2.4
99
0.0
18
20
.04
0.0
12
34
.70
.12
23
4.7
40
.12
29
7.5
71
.05
2
RM
-BY
20
15
03
26
19
0.0
38
0.0
04
20
.01
02
0.0
20
.02
20
.03
0.0
22
2.3
30
.19
2
RM
-CA
20
15
03
26
19
1.4
26
0.0
12
20
.05
0.0
12
19
.35
0.0
52
19
.40
.05
23
5.4
20
.37
2
26
CR
M 7
601-a
CR
M 7
602-a
CR
M 7
603-a
RM
-BU
20
15
02
25
21
0.3
12
20
.11
23
.87
23
.97
22
0.7
2
RM
-BV
20
15
02
25
21
2.4
82
0.0
82
35
.52
23
5.6
21
04
2
RM
-BY
20
15
02
25
21
0.0
22
0.0
32
0.0
52
0.0
82
1.5
62
RM
-CA
20
15
02
25
21
1.3
87
20
.09
21
9.5
92
19
.68
23
6.5
22
27
CR
M 7
601-a
20
15
02
16
21
.50
.05
0.0
04
20
.03
0.0
12
0.0
40
.02
20
.07
0.0
22
1.2
60
.08
2
CR
M 7
602
-a2
015
02
16
21
.51
.09
20
.01
82
0.3
80
.01
21
5.0
90
.15
21
5.4
70
.15
23
0.3
0.0
12
CR
M 7
603-a
20
15
02
16
21
.52
.99
50
.08
20
.02
02
42
.53
0.5
22
42
.55
0.5
22
14
8.1
20
.78
2
RM
-BU
20
15
02
16
21
.50
.34
30
.00
42
0.0
70
.01
23
.77
0.0
72
3.8
50
.07
22
0.9
70
.12
2
RM
-BV
20
15
02
16
21
.52
.41
90
.05
32
0.0
50
.01
23
4.6
70
.36
23
4.7
20
.36
21
03
.84
2.1
52
RM
-BY
20
15
02
16
21
.50
.03
30
.00
32
0.0
20
.01
20
.03
0.0
22
0.0
50
.02
21
.71
0.0
52
RM
-CA
20
15
02
16
21
.51
.39
70
.02
22
0.0
60
.01
21
9.1
80
.21
21
9.2
40
.21
23
6.6
70
.21
2
IOCCP-JAMSTEC 2015 Inter calibration exercise
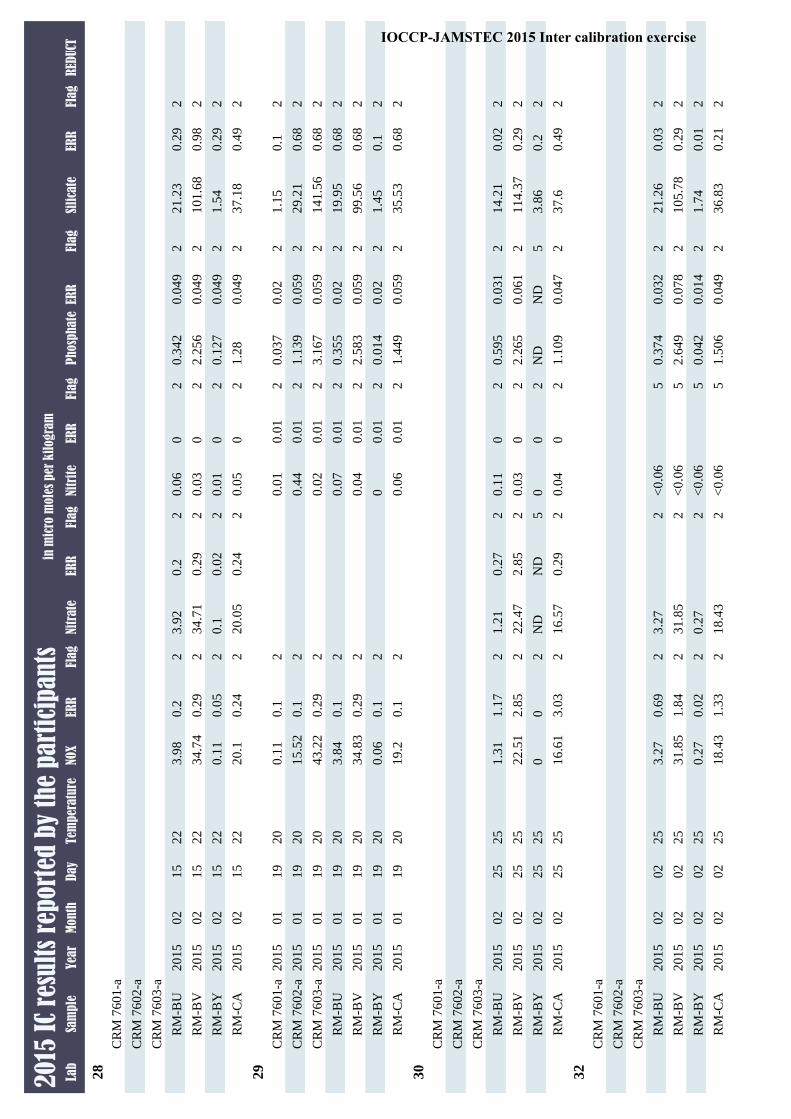
Lab
Sam
ple
Yea
rM
onth
Day
Tem
per
atu
reP
hosp
hate
ERR
Flag
Nitr
ite
ERR
Flag
Nitr
ate
ERR
Flag
NOX
ERR
Flag
RED
UCT
Sili
cate
ERR
Flag
20
15 I
C re
sult
s re
port
ed b
y th
e p
art
icip
an
tsin
mic
ro m
ole
s per
kil
ogra
m
28
CR
M 7
601
-a
CR
M 7
602-a
CR
M 7
603-a
RM
-BU
20
15
02
15
22
0.3
42
0.0
49
20
.06
02
3.9
20
.22
3.9
80
.22
21
.23
0.2
92
RM
-BV
20
15
02
15
22
2.2
56
0.0
49
20
.03
02
34
.71
0.2
92
34
.74
0.2
92
10
1.6
80
.98
2
RM
-BY
20
15
02
15
22
0.1
27
0.0
49
20
.01
02
0.1
0.0
22
0.1
10
.05
21
.54
0.2
92
RM
-CA
20
15
02
15
22
1.2
80
.04
92
0.0
50
22
0.0
50
.24
22
0.1
0.2
42
37
.18
0.4
92
29
CR
M 7
601
-a2
015
01
19
20
0.0
37
0.0
22
0.0
10
.01
20
.11
0.1
21
.15
0.1
2
CR
M 7
602-a
20
15
01
19
20
1.1
39
0.0
59
20
.44
0.0
12
15
.52
0.1
22
9.2
10
.68
2
CR
M 7
603-a
20
15
01
19
20
3.1
67
0.0
59
20
.02
0.0
12
43
.22
0.2
92
14
1.5
60
.68
2
RM
-BU
20
15
01
19
20
0.3
55
0.0
22
0.0
70
.01
23
.84
0.1
21
9.9
50
.68
2
RM
-BV
20
15
01
19
20
2.5
83
0.0
59
20
.04
0.0
12
34
.83
0.2
92
99
.56
0.6
82
RM
-BY
20
15
01
19
20
0.0
14
0.0
22
00
.01
20
.06
0.1
21
.45
0.1
2
RM
-CA
20
15
01
19
20
1.4
49
0.0
59
20
.06
0.0
12
19
.20
.12
35
.53
0.6
82
30
CR
M 7
601-a
CR
M 7
602-a
CR
M 7
603-a
RM
-BU
20
15
02
25
25
0.5
95
0.0
31
20
.11
02
1.2
10
.27
21
.31
1.1
72
14
.21
0.0
22
RM
-BV
20
15
02
25
25
2.2
65
0.0
61
20
.03
02
22
.47
2.8
52
22
.51
2.8
52
11
4.3
70
.29
2
RM
-BY
20
15
02
25
25
ND
ND
50
02
ND
ND
50
02
3.8
60
.22
RM
-CA
20
15
02
25
25
1.1
09
0.0
47
20
.04
02
16
.57
0.2
92
16
.61
3.0
32
37
.60
.49
2
32
CR
M 7
601-a
CR
M 7
602
-a
CR
M 7
603-a
RM
-BU
20
15
02
02
25
0.3
74
0.0
32
2<
0.0
65
3.2
72
3.2
70
.69
22
1.2
60
.03
2
RM
-BV
20
15
02
02
25
2.6
49
0.0
78
2<
0.0
65
31
.85
23
1.8
51
.84
21
05
.78
0.2
92
RM
-BY
20
15
02
02
25
0.0
42
0.0
14
2<
0.0
65
0.2
72
0.2
70
.02
21
.74
0.0
12
RM
-CA
20
15
02
02
25
1.5
06
0.0
49
2<
0.0
65
18
.43
21
8.4
31
.33
23
6.8
30
.21
2
IOCCP-JAMSTEC 2015 Inter calibration exercise

Lab
Sam
ple
Yea
rM
onth
Day
Tem
per
atu
reP
hosp
hate
ERR
Flag
Nitr
ite
ERR
Flag
Nitr
ate
ERR
Flag
NOX
ERR
Flag
RED
UCT
Sili
cate
ERR
Flag
20
15 I
C re
sult
s re
port
ed b
y th
e p
art
icip
an
tsin
mic
ro m
ole
s per
kil
ogra
m
35
CR
M 7
601
-a
CR
M 7
602-a
20
15
02
17
24
.11
.10
40
20
.40
21
5.8
20
.01
22
9.2
60
.04
2
CR
M 7
603-a
20
15
02
17
24
.13
.04
90
.01
20
.03
02
44
.19
0.0
42
14
2.1
60
.21
2
RM
-BU
20
15
02
17
24
.10
.34
20
20
.08
02
3.9
20
22
0.2
0.0
32
RM
-BV
20
15
02
17
24
.12
.49
20
20
.05
02
35
.30
.03
29
9.5
40
.14
2
RM
-BY
20
15
02
17
24
.10
.03
90
20
.02
02
00
21
.61
02
RM
-CA
20
15
02
17
24
.11
.40
70
20
.06
02
19
.56
0.0
22
35
.43
0.0
52
37
CR
M 7
601
-aN
one
ne
CR
M 7
602-a
No
ne
ne
CR
M 7
603-a
No
ne
ne
RM
-BU
20
15
02
05
25
0.3
52
0.0
12
RM
-BV
20
15
02
05
25
2.5
13
0.0
12
RM
-BY
20
15
02
05
25
0.0
29
02
RM
-CA
20
15
02
05
25
1.4
27
0.0
12
38
CR
M 7
601-a
CR
M 7
602-a
CR
M 7
603-a
RM
-BU
20
15
01
22
20
0.3
27
0.0
02
20
.08
0.0
32
3.8
80
.06
23
.95
0.0
62
20
.53
0.0
42
RM
-BV
20
15
01
22
20
2.4
71
0.0
04
20
.05
0.0
22
35
.76
0.4
82
35
.81
0.4
82
99
.03
0.2
12
RM
-BY
20
15
01
22
20
0.0
43
0.0
02
20
.02
0.0
12
0.0
10
.03
20
.03
0.0
32
1.7
20
.01
2
RM
-CA
20
15
01
22
20
1.3
90
.00
32
0.0
70
.03
21
9.8
90
.32
19
.95
0.3
23
5.8
90
.13
2
IOCCP-JAMSTEC 2015 Inter calibration exercise

Lab
Sam
ple
Yea
rM
onth
Day
Tem
per
atu
reP
hosp
hate
ERR
Flag
Nitr
ite
ERR
Flag
Nitr
ate
ERR
Flag
NOX
ERR
Flag
RED
UCT
Sili
cate
ERR
Flag
20
15 I
C re
sult
s re
port
ed b
y th
e p
art
icip
an
tsin
mic
ro m
ole
s per
kil
ogra
m
39
CR
M 7
601
-a2
015
01
15
CR
M 7
602-a
20
15
01
15
CR
M 7
603-a
20
15
01
15
RM
-AX
20
15
01
15
22
.51
.59
90
.02
20
.38
0.0
12
21
.65
0.2
22
2.0
30
.22
59
.37
0.2
2
RM
-AZ
20
15
01
15
22
.53
.03
60
.03
92
0.0
50
.01
24
2.7
50
.39
24
2.8
0.3
92
13
6.0
80
.39
2
RM
-BD
20
15
01
15
22
.52
.17
30
.03
92
0.0
40
.01
22
9.9
30
.29
22
9.9
70
.29
26
6.0
60
.22
RM
-BP
20
15
01
15
22
.50
.04
40
.00
52
0.0
50
.01
20
.04
0.0
22
0.0
90
.02
21
.31
0.0
42
RM
-BQ
20
15
01
15
22
.53
.07
70
.03
92
0.0
40
.01
24
4.4
20
.39
24
4.4
60
.39
21
44
.68
0.4
92
RM
-BU
20
15
01
15
22
.50
.33
80
.01
20
.08
0.0
12
3.9
90
.04
24
.06
0.0
42
20
.93
0.0
52
RM
-BV
20
15
01
15
22
.52
.52
60
.03
92
0.0
60
.01
23
5.7
20
.39
23
5.4
80
.39
21
01
.93
0.2
92
RM
-BY
20
15
01
15
22
.50
.03
20
.00
52
0.0
30
.01
20
.03
0.0
22
0.0
60
.02
21
.76
0.0
42
RM
-CA
20
15
01
15
22
.51
.39
80
.02
20
.07
0.0
12
19
.92
0.2
22
00
.22
36
.65
0.1
2
40
CR
M 7
601-a
CR
M 7
602
-a
CR
M 7
603-a
RM
-BU
20
15
02
09
21
0.3
81
0.0
29
20
.08
0.1
24
.20
.12
4.3
0.1
22
0.0
20
.22
RM
-BV
20
15
02
09
21
2.5
39
0.0
59
2<
0.0
80
.29
53
7.1
10
.29
23
7.2
10
.29
21
12
.99
1.7
62
RM
-BY
20
15
02
09
21
<0
.03
0.0
29
5<
0.0
80
.07
50
.07
0.0
72
<0
.07
0.0
75
1.5
60
.12
RM
-CA
20
15
02
09
21
1.4
65
0.0
59
2<
0.0
80
.29
51
9.5
30
.29
21
9.6
30
.29
23
5.8
40
.22
41
CR
M 7
601-a
20
15
02
02
22
CR
M 7
602
-a2
015
02
02
22
CR
M 7
603-a
20
15
02
02
22
RM
-BU
20
15
02
02
22
0.4
32
0.0
92
4.2
24
.22
20
.41
2
RM
-BV
20
15
02
02
22
2.7
16
20
.07
23
5.2
62
35
.26
29
9.4
42
RM
-BY
20
15
02
02
22
0.1
07
20
.03
20
.12
0.1
21
.76
2
RM
-CA
20
15
02
02
22
1.4
36
20
.08
21
9.5
42
19
.63
23
6.2
42
IOCCP-JAMSTEC 2015 Inter calibration exercise

Lab
Sam
ple
Yea
rM
onth
Day
Tem
per
atu
reP
hosp
hate
ERR
Flag
Nitr
ite
ERR
Flag
Nitr
ate
ERR
Flag
NOX
ERR
Flag
RED
UCT
Sili
cate
ERR
Flag
20
15 I
C re
sult
s re
port
ed b
y th
e p
art
icip
an
tsin
mic
ro m
ole
s per
kil
ogra
m
45
CR
M 7
601
-a
CR
M 7
602-a
CR
M 7
603-a
RM
-BU
20
15
05
01
27
0.1
0.1
22
2.7
10
.06
22
.81
0.0
52
25
.53
0.1
2
RM
-BV
20
15
05
01
27
0.0
30
.01
23
4.2
70
.43
23
4.3
0.4
32
11
8.3
70
2
RM
-BY
20
15
05
01
27
0.0
40
.01
2N
AN
5N
AN
52
.42
0.0
32
RM
-CA
20
15
05
01
27
0.1
30
.02
21
9.2
70
.09
21
9.4
0.0
92
44
.48
0.1
62
IOCCP-JAMSTEC 2015 Inter calibration exercise
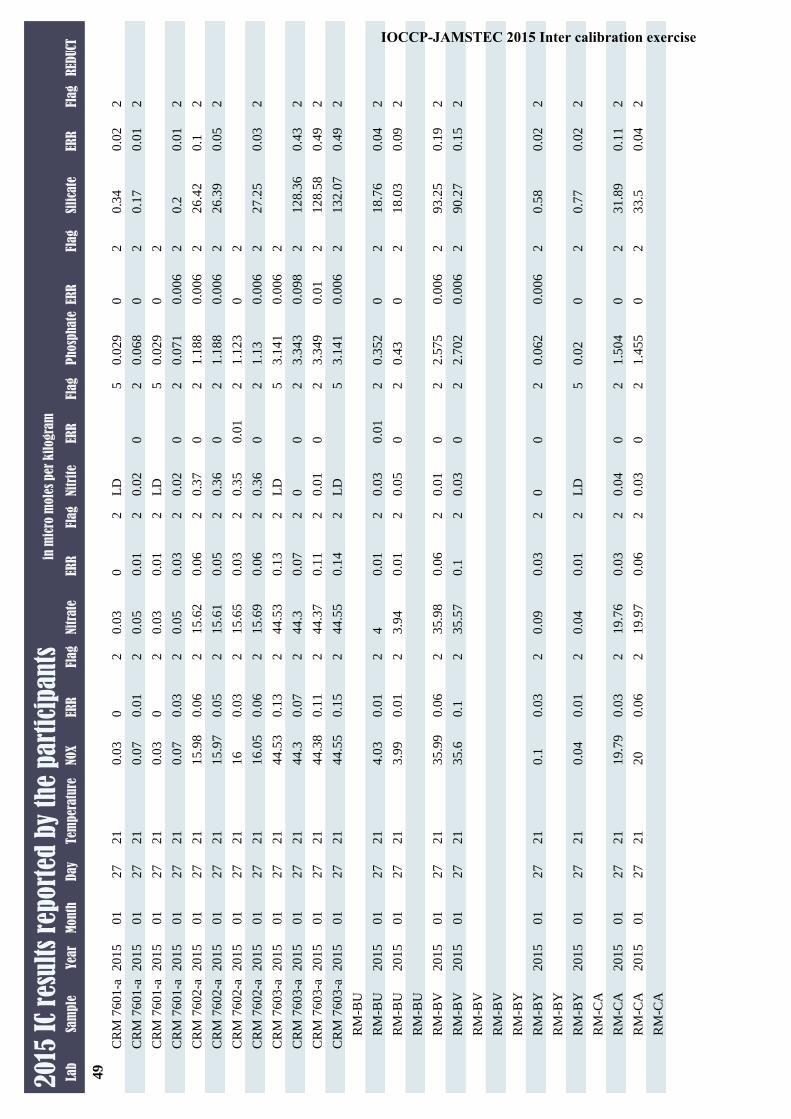
Lab
Sam
ple
Yea
rM
onth
Day
Tem
per
atu
reP
hosp
hate
ERR
Flag
Nitr
ite
ERR
Flag
Nitr
ate
ERR
Flag
NOX
ERR
Flag
RED
UCT
Sili
cate
ERR
Flag
20
15 I
C re
sult
s re
port
ed b
y th
e p
art
icip
an
tsin
mic
ro m
ole
s per
kil
ogra
m
49
CR
M 7
601
-a2
015
01
27
21
0.0
29
02
LD
50
.03
02
0.0
30
20
.34
0.0
22
CR
M 7
601-a
20
15
01
27
21
0.0
68
02
0.0
20
20
.05
0.0
12
0.0
70
.01
20
.17
0.0
12
CR
M 7
601-a
20
15
01
27
21
0.0
29
02
LD
50
.03
0.0
12
0.0
30
2
CR
M 7
601
-a2
015
01
27
21
0.0
71
0.0
06
20
.02
02
0.0
50
.03
20
.07
0.0
32
0.2
0.0
12
CR
M 7
602-a
20
15
01
27
21
1.1
88
0.0
06
20
.37
02
15
.62
0.0
62
15
.98
0.0
62
26
.42
0.1
2
CR
M 7
602-a
20
15
01
27
21
1.1
88
0.0
06
20
.36
02
15
.61
0.0
52
15
.97
0.0
52
26
.39
0.0
52
CR
M 7
602-a
20
15
01
27
21
1.1
23
02
0.3
50
.01
21
5.6
50
.03
21
60
.03
2
CR
M 7
602-a
20
15
01
27
21
1.1
30
.00
62
0.3
60
21
5.6
90
.06
21
6.0
50
.06
22
7.2
50
.03
2
CR
M 7
603
-a2
015
01
27
21
3.1
41
0.0
06
2L
D5
44
.53
0.1
32
44
.53
0.1
32
CR
M 7
603-a
20
15
01
27
21
3.3
43
0.0
98
20
02
44
.30
.07
24
4.3
0.0
72
12
8.3
60
.43
2
CR
M 7
603-a
20
15
01
27
21
3.3
49
0.0
12
0.0
10
24
4.3
70
.11
24
4.3
80
.11
21
28
.58
0.4
92
CR
M 7
603
-a2
015
01
27
21
3.1
41
0.0
06
2L
D5
44
.55
0.1
42
44
.55
0.1
52
13
2.0
70
.49
2
RM
-BU
RM
-BU
20
15
01
27
21
0.3
52
02
0.0
30
.01
24
0.0
12
4.0
30
.01
21
8.7
60
.04
2
RM
-BU
20
15
01
27
21
0.4
30
20
.05
02
3.9
40
.01
23
.99
0.0
12
18
.03
0.0
92
RM
-BU
RM
-BV
20
15
01
27
21
2.5
75
0.0
06
20
.01
02
35
.98
0.0
62
35
.99
0.0
62
93
.25
0.1
92
RM
-BV
20
15
01
27
21
2.7
02
0.0
06
20
.03
02
35
.57
0.1
23
5.6
0.1
29
0.2
70
.15
2
RM
-BV
RM
-BV
RM
-BY
RM
-BY
20
15
01
27
21
0.0
62
0.0
06
20
02
0.0
90
.03
20
.10
.03
20
.58
0.0
22
RM
-BY
RM
-BY
20
15
01
27
21
0.0
20
2L
D5
0.0
40
.01
20
.04
0.0
12
0.7
70
.02
2
RM
-CA
RM
-CA
20
15
01
27
21
1.5
04
02
0.0
40
21
9.7
60
.03
21
9.7
90
.03
23
1.8
90
.11
2
RM
-CA
20
15
01
27
21
1.4
55
02
0.0
30
21
9.9
70
.06
22
00
.06
23
3.5
0.0
42
RM
-CA
IOCCP-JAMSTEC 2015 Inter calibration exercise

Lab
Sam
ple
Yea
rM
onth
Day
Tem
per
atu
reP
hosp
hate
ERR
Flag
Nitr
ite
ERR
Flag
Nitr
ate
ERR
Flag
NOX
ERR
Flag
RED
UCT
Sili
cate
ERR
Flag
20
15 I
C re
sult
s re
port
ed b
y th
e p
art
icip
an
tsin
mic
ro m
ole
s per
kil
ogra
m
50
CR
M 7
601
-a
CR
M 7
602-a
CR
M 7
603-a
RM
-BU
20
15
01
29
23
.60
.37
0.0
02
20
.07
02
3.9
40
.02
24
0.0
22
21
.18
0.0
82
RM
-BV
20
15
01
29
23
.72
.49
90
.00
22
0.0
60
23
4.9
0.2
42
34
.96
0.2
32
10
2.3
30
.22
2
RM
-BY
20
15
01
29
23
.60
.03
90
.00
22
0.0
20
20
.02
02
0.0
40
.01
21
.83
0.0
12
RM
-CA
20
15
01
29
23
.61
.40
20
.02
92
0.0
80
21
9.5
70
.03
21
9.6
50
.03
23
6.0
20
.06
2
51
CR
M 7
601
-a2
015
02
09
21
LO
D0
.09
85
0.1
20
.12
2.3
30
.98
20
.60
.98
2
CR
M 7
602-a
20
15
02
09
21
0.8
72
0.0
98
20
.41
0.1
21
6.6
40
.98
22
5.8
10
.98
2
CR
M 7
603-a
20
15
02
09
RM
-BU
20
15
02
09
21
0.3
05
0.0
98
22
1.6
40
.98
2
RM
-BV
20
15
02
09
21
2.3
70
.09
82
10
6.9
10
.98
2
RM
-BY
20
15
02
09
21
LO
D0
.09
85
0.0
40
.12
0.6
80
.98
21
.58
0.9
82
RM
-CA
20
15
02
09
21
1.3
75
0.0
98
22
3.3
70
.98
23
8.2
0.9
82
52
CR
M 7
601-a
CR
M 7
602-a
CR
M 7
603-a
RM
-BU
20
15
03
11
14
0.3
66
0.0
06
2na
na
9na
na
93
.91
0.0
22
20
.99
0.0
72
RM
-BV
20
15
03
11
14
2.4
96
0.0
29
2na
na
9na
na
93
5.3
50
.04
21
01
.26
0.1
22
RM
-BY
20
15
03
11
14
0.0
26
0.0
03
2na
na
9na
na
90
.05
02
1.7
60
.02
2
RM
-CA
20
15
03
11
14
1.4
14
0.0
12
2na
na
9na
na
91
9.5
50
.09
23
6.1
0.0
92
IOCCP-JAMSTEC 2015 Inter calibration exercise
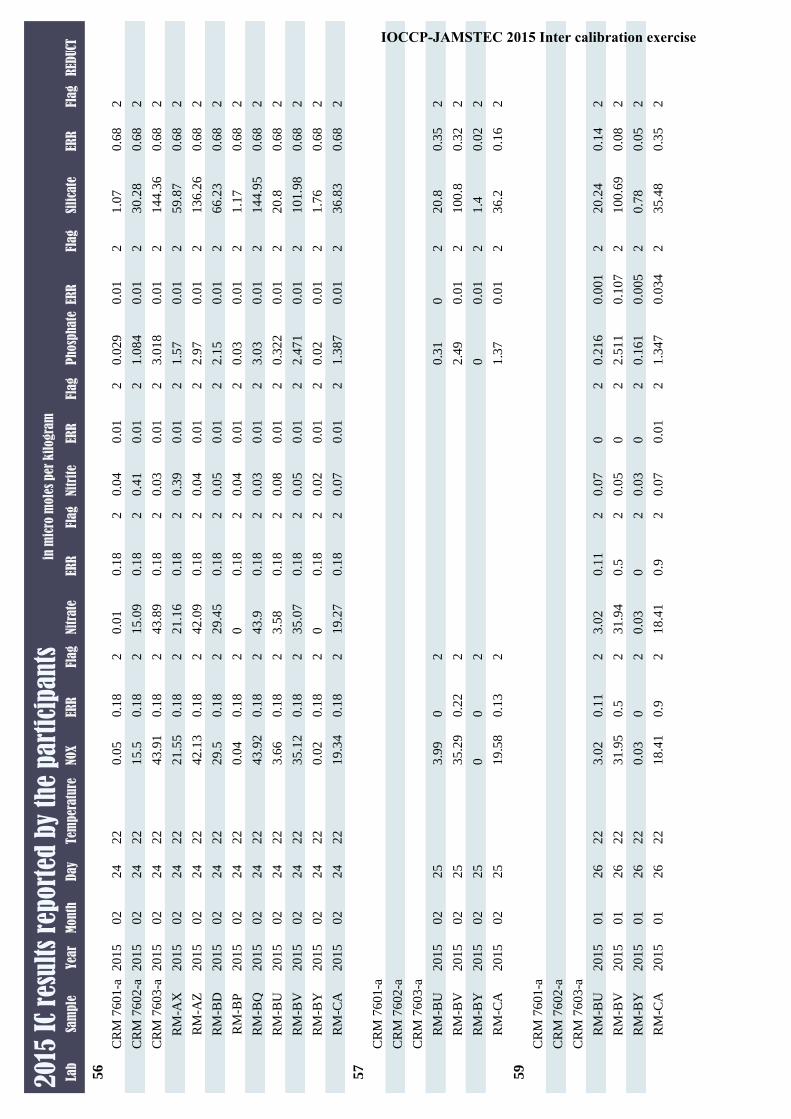
Lab
Sam
ple
Yea
rM
onth
Day
Tem
per
atu
reP
hosp
hate
ERR
Flag
Nitr
ite
ERR
Flag
Nitr
ate
ERR
Flag
NOX
ERR
Flag
RED
UCT
Sili
cate
ERR
Flag
20
15 I
C re
sult
s re
port
ed b
y th
e p
art
icip
an
tsin
mic
ro m
ole
s per
kil
ogra
m
56
CR
M 7
601
-a2
015
02
24
22
0.0
29
0.0
12
0.0
40
.01
20
.01
0.1
82
0.0
50
.18
21
.07
0.6
82
CR
M 7
602-a
20
15
02
24
22
1.0
84
0.0
12
0.4
10
.01
21
5.0
90
.18
21
5.5
0.1
82
30
.28
0.6
82
CR
M 7
603-a
20
15
02
24
22
3.0
18
0.0
12
0.0
30
.01
24
3.8
90
.18
24
3.9
10
.18
21
44
.36
0.6
82
RM
-AX
20
15
02
24
22
1.5
70
.01
20
.39
0.0
12
21
.16
0.1
82
21
.55
0.1
82
59
.87
0.6
82
RM
-AZ
20
15
02
24
22
2.9
70
.01
20
.04
0.0
12
42
.09
0.1
82
42
.13
0.1
82
13
6.2
60
.68
2
RM
-BD
20
15
02
24
22
2.1
50
.01
20
.05
0.0
12
29
.45
0.1
82
29
.50
.18
26
6.2
30
.68
2
RM
-BP
20
15
02
24
22
0.0
30
.01
20
.04
0.0
12
00
.18
20
.04
0.1
82
1.1
70
.68
2
RM
-BQ
20
15
02
24
22
3.0
30
.01
20
.03
0.0
12
43
.90
.18
24
3.9
20
.18
21
44
.95
0.6
82
RM
-BU
20
15
02
24
22
0.3
22
0.0
12
0.0
80
.01
23
.58
0.1
82
3.6
60
.18
22
0.8
0.6
82
RM
-BV
20
15
02
24
22
2.4
71
0.0
12
0.0
50
.01
23
5.0
70
.18
23
5.1
20
.18
21
01
.98
0.6
82
RM
-BY
20
15
02
24
22
0.0
20
.01
20
.02
0.0
12
00
.18
20
.02
0.1
82
1.7
60
.68
2
RM
-CA
20
15
02
24
22
1.3
87
0.0
12
0.0
70
.01
21
9.2
70
.18
21
9.3
40
.18
23
6.8
30
.68
2
57
CR
M 7
601-a
CR
M 7
602
-a
CR
M 7
603-a
RM
-BU
20
15
02
25
0.3
10
23
.99
02
20
.80
.35
2
RM
-BV
20
15
02
25
2.4
90
.01
23
5.2
90
.22
21
00
.80
.32
2
RM
-BY
20
15
02
25
00
.01
20
02
1.4
0.0
22
RM
-CA
20
15
02
25
1.3
70
.01
21
9.5
80
.13
23
6.2
0.1
62
59
CR
M 7
601-a
CR
M 7
602
-a
CR
M 7
603-a
RM
-BU
20
15
01
26
22
0.2
16
0.0
01
20
.07
02
3.0
20
.11
23
.02
0.1
12
20
.24
0.1
42
RM
-BV
20
15
01
26
22
2.5
11
0.1
07
20
.05
02
31
.94
0.5
23
1.9
50
.52
10
0.6
90
.08
2
RM
-BY
20
15
01
26
22
0.1
61
0.0
05
20
.03
02
0.0
30
20
.03
02
0.7
80
.05
2
RM
-CA
20
15
01
26
22
1.3
47
0.0
34
20
.07
0.0
12
18
.41
0.9
21
8.4
10
.92
35
.48
0.3
52
IOCCP-JAMSTEC 2015 Inter calibration exercise
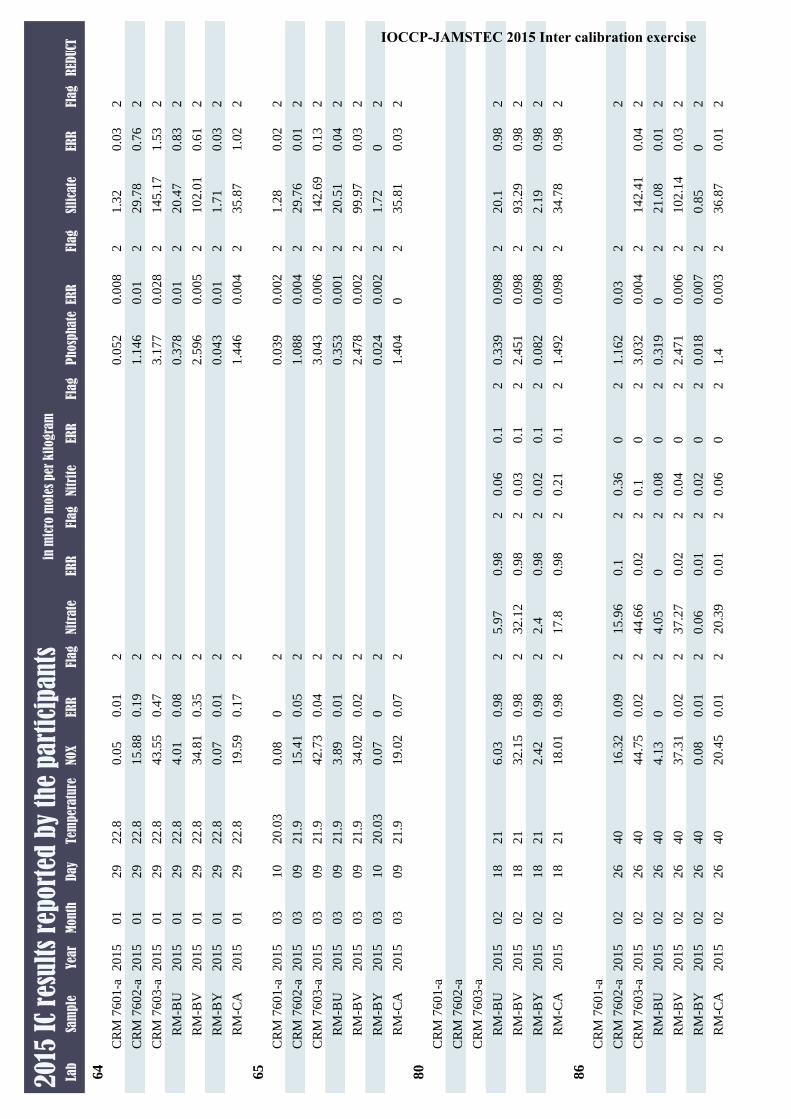
Lab
Sam
ple
Yea
rM
onth
Day
Tem
per
atu
reP
hosp
hate
ERR
Flag
Nitr
ite
ERR
Flag
Nitr
ate
ERR
Flag
NOX
ERR
Flag
RED
UCT
Sili
cate
ERR
Flag
20
15 I
C re
sult
s re
port
ed b
y th
e p
art
icip
an
tsin
mic
ro m
ole
s per
kil
ogra
m
64
CR
M 7
601
-a2
015
01
29
22
.80
.05
20
.00
82
0.0
50
.01
21
.32
0.0
32
CR
M 7
602-a
20
15
01
29
22
.81
.14
60
.01
21
5.8
80
.19
22
9.7
80
.76
2
CR
M 7
603-a
20
15
01
29
22
.83
.17
70
.02
82
43
.55
0.4
72
14
5.1
71
.53
2
RM
-BU
20
15
01
29
22
.80
.37
80
.01
24
.01
0.0
82
20
.47
0.8
32
RM
-BV
20
15
01
29
22
.82
.59
60
.00
52
34
.81
0.3
52
10
2.0
10
.61
2
RM
-BY
20
15
01
29
22
.80
.04
30
.01
20
.07
0.0
12
1.7
10
.03
2
RM
-CA
20
15
01
29
22
.81
.44
60
.00
42
19
.59
0.1
72
35
.87
1.0
22
65
CR
M 7
601
-a2
015
03
10
20
.03
0.0
39
0.0
02
20
.08
02
1.2
80
.02
2
CR
M 7
602-a
20
15
03
09
21
.91
.08
80
.00
42
15
.41
0.0
52
29
.76
0.0
12
CR
M 7
603-a
20
15
03
09
21
.93
.04
30
.00
62
42
.73
0.0
42
14
2.6
90
.13
2
RM
-BU
20
15
03
09
21
.90
.35
30
.00
12
3.8
90
.01
22
0.5
10
.04
2
RM
-BV
20
15
03
09
21
.92
.47
80
.00
22
34
.02
0.0
22
99
.97
0.0
32
RM
-BY
20
15
03
10
20
.03
0.0
24
0.0
02
20
.07
02
1.7
20
2
RM
-CA
20
15
03
09
21
.91
.40
40
21
9.0
20
.07
23
5.8
10
.03
2
80
CR
M 7
601-a
CR
M 7
602-a
CR
M 7
603-a
RM
-BU
20
15
02
18
21
0.3
39
0.0
98
20
.06
0.1
25
.97
0.9
82
6.0
30
.98
22
0.1
0.9
82
RM
-BV
20
15
02
18
21
2.4
51
0.0
98
20
.03
0.1
23
2.1
20
.98
23
2.1
50
.98
29
3.2
90
.98
2
RM
-BY
20
15
02
18
21
0.0
82
0.0
98
20
.02
0.1
22
.40
.98
22
.42
0.9
82
2.1
90
.98
2
RM
-CA
20
15
02
18
21
1.4
92
0.0
98
20
.21
0.1
21
7.8
0.9
82
18
.01
0.9
82
34
.78
0.9
82
86
CR
M 7
601-a
CR
M 7
602
-a2
015
02
26
40
1.1
62
0.0
32
0.3
60
21
5.9
60
.12
16
.32
0.0
92
2
CR
M 7
603-a
20
15
02
26
40
3.0
32
0.0
04
20
.10
24
4.6
60
.02
24
4.7
50
.02
21
42
.41
0.0
42
RM
-BU
20
15
02
26
40
0.3
19
02
0.0
80
24
.05
02
4.1
30
22
1.0
80
.01
2
RM
-BV
20
15
02
26
40
2.4
71
0.0
06
20
.04
02
37
.27
0.0
22
37
.31
0.0
22
10
2.1
40
.03
2
RM
-BY
20
15
02
26
40
0.0
18
0.0
07
20
.02
02
0.0
60
.01
20
.08
0.0
12
0.8
50
2
RM
-CA
20
15
02
26
40
1.4
0.0
03
20
.06
02
20
.39
0.0
12
20
.45
0.0
12
36
.87
0.0
12
IOCCP-JAMSTEC 2015 Inter calibration exercise

Lab
Sam
ple
Yea
rM
onth
Day
Tem
per
atu
reP
hosp
hate
ERR
Flag
Nitr
ite
ERR
Flag
Nitr
ate
ERR
Flag
NOX
ERR
Flag
RED
UCT
Sili
cate
ERR
Flag
20
15 I
C re
sult
s re
port
ed b
y th
e p
art
icip
an
tsin
mic
ro m
ole
s per
kil
ogra
m
87
CR
M 7
601
-a
CR
M 7
602-a
CR
M 7
603-a
RM
-BU
20
15
01
22
21
0.3
52
20
.07
23
.89
23
.95
22
0.4
72
RM
-BV
20
15
01
22
21
2.5
29
20
.05
23
5.1
32
35
.18
29
9.9
2
RM
-BY
20
15
01
22
21
0.0
49
20
.01
20
.01
20
.02
21
.61
2
RM
-CA
20
15
01
22
21
1.4
26
20
.06
21
9.4
22
19
.48
23
5.8
72
88
CR
M 7
601
-a
CR
M 7
602-a
CR
M 7
603-a
RM
-BU
20
15
01
20
21
0.3
78
24
.57
22
1.5
62
RM
-BV
20
15
01
20
21
2.5
32
23
4.4
92
10
4.8
32
RM
-BY
20
15
01
20
21
0.0
53
21
.34
22
.15
2
RM
-CA
20
15
01
20
21
1.4
26
21
9.3
52
37
.57
2
89
CR
M 7
601-a
CR
M 7
602-a
CR
M 7
603-a
RM
-BU
20
15
01
15
21
0.7
68
0.0
04
20
.13
0.0
12
3.9
60
.02
22
00
.09
2
RM
-BV
20
15
01
15
21
4.3
05
0.0
07
20
.07
0.0
12
34
.80
.03
29
9.7
70
.09
2
RM
-BY
20
15
01
15
21
0.0
54
0.0
01
20
.06
0.0
12
0.0
80
.01
21
.22
02
RM
-CA
20
15
01
15
21
2.0
77
0.0
08
20
.10
.01
21
9.3
30
.12
35
.59
0.1
52
90
CR
M 7
601-a
CR
M 7
602
-a
CR
M 7
603-a
RM
-BU
20
15
02
26
20
0.3
28
0.0
22
0.0
30
23
.25
0.1
72
3.2
80
.18
22
0.3
40
.11
2
RM
-BV
20
15
02
26
20
2.5
74
0.0
06
20
.03
02
28
.17
0.7
22
8.2
0.7
21
00
.94
0.5
72
RM
-BY
20
15
02
26
20
0.0
38
0.0
22
0.0
10
.01
2L
OD
52
1.0
30
.32
2
RM
-CA
20
15
02
26
20
1.4
43
0.0
05
20
.02
0.0
32
15
.56
0.1
22
15
.57
0.1
52
35
.19
0.7
32
IOCCP-JAMSTEC 2015 Inter calibration exercise
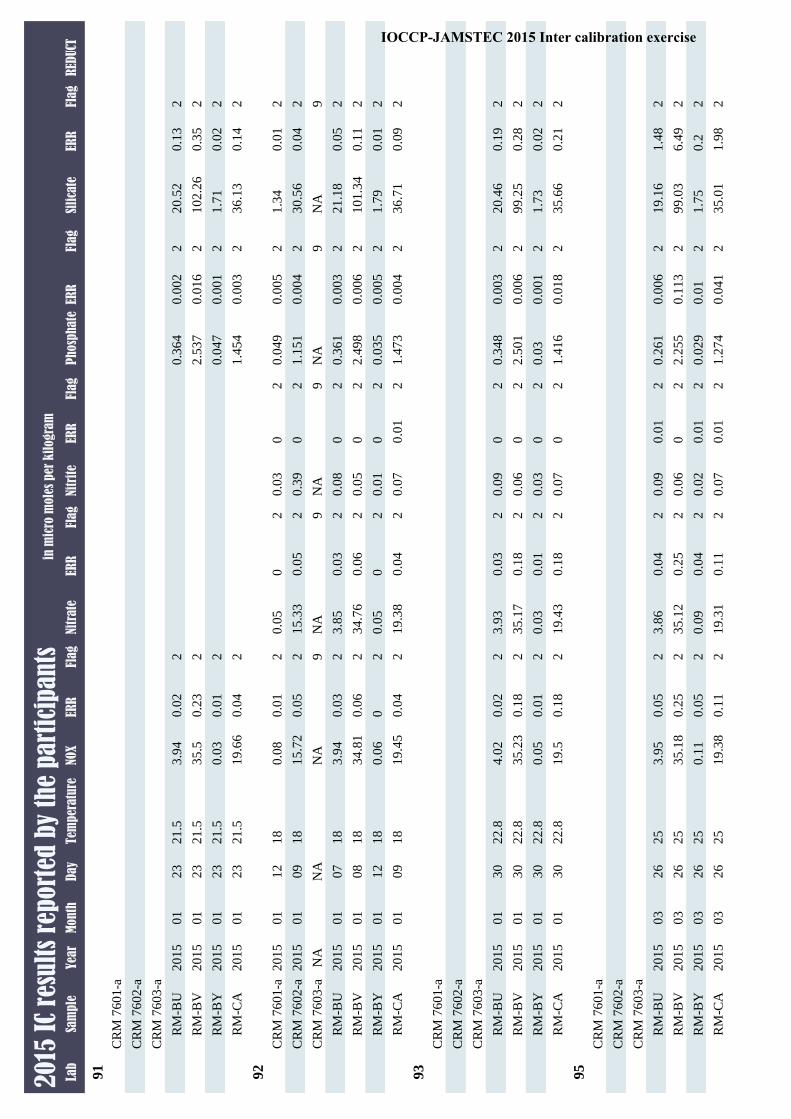
Lab
Sam
ple
Yea
rM
onth
Day
Tem
per
atu
reP
hosp
hate
ERR
Flag
Nitr
ite
ERR
Flag
Nitr
ate
ERR
Flag
NOX
ERR
Flag
RED
UCT
Sili
cate
ERR
Flag
20
15 I
C re
sult
s re
port
ed b
y th
e p
art
icip
an
tsin
mic
ro m
ole
s per
kil
ogra
m
91
CR
M 7
601
-a
CR
M 7
602-a
CR
M 7
603-a
RM
-BU
20
15
01
23
21
.50
.36
40
.00
22
3.9
40
.02
22
0.5
20
.13
2
RM
-BV
20
15
01
23
21
.52
.53
70
.01
62
35
.50
.23
21
02
.26
0.3
52
RM
-BY
20
15
01
23
21
.50
.04
70
.00
12
0.0
30
.01
21
.71
0.0
22
RM
-CA
20
15
01
23
21
.51
.45
40
.00
32
19
.66
0.0
42
36
.13
0.1
42
92
CR
M 7
601
-a2
015
01
12
18
0.0
49
0.0
05
20
.03
02
0.0
50
20
.08
0.0
12
1.3
40
.01
2
CR
M 7
602-a
20
15
01
09
18
1.1
51
0.0
04
20
.39
02
15
.33
0.0
52
15
.72
0.0
52
30
.56
0.0
42
CR
M 7
603-a
NA
NA
NA
9N
A9
NA
9N
A9
NA
9
RM
-BU
20
15
01
07
18
0.3
61
0.0
03
20
.08
02
3.8
50
.03
23
.94
0.0
32
21
.18
0.0
52
RM
-BV
20
15
01
08
18
2.4
98
0.0
06
20
.05
02
34
.76
0.0
62
34
.81
0.0
62
10
1.3
40
.11
2
RM
-BY
20
15
01
12
18
0.0
35
0.0
05
20
.01
02
0.0
50
20
.06
02
1.7
90
.01
2
RM
-CA
20
15
01
09
18
1.4
73
0.0
04
20
.07
0.0
12
19
.38
0.0
42
19
.45
0.0
42
36
.71
0.0
92
93
CR
M 7
601-a
CR
M 7
602-a
CR
M 7
603-a
RM
-BU
20
15
01
30
22
.80
.34
80
.00
32
0.0
90
23
.93
0.0
32
4.0
20
.02
22
0.4
60
.19
2
RM
-BV
20
15
01
30
22
.82
.50
10
.00
62
0.0
60
23
5.1
70
.18
23
5.2
30
.18
29
9.2
50
.28
2
RM
-BY
20
15
01
30
22
.80
.03
0.0
01
20
.03
02
0.0
30
.01
20
.05
0.0
12
1.7
30
.02
2
RM
-CA
20
15
01
30
22
.81
.41
60
.01
82
0.0
70
21
9.4
30
.18
21
9.5
0.1
82
35
.66
0.2
12
95
CR
M 7
601-a
CR
M 7
602
-a
CR
M 7
603-a
RM
-BU
20
15
03
26
25
0.2
61
0.0
06
20
.09
0.0
12
3.8
60
.04
23
.95
0.0
52
19
.16
1.4
82
RM
-BV
20
15
03
26
25
2.2
55
0.1
13
20
.06
02
35
.12
0.2
52
35
.18
0.2
52
99
.03
6.4
92
RM
-BY
20
15
03
26
25
0.0
29
0.0
12
0.0
20
.01
20
.09
0.0
42
0.1
10
.05
21
.75
0.2
2
RM
-CA
20
15
03
26
25
1.2
74
0.0
41
20
.07
0.0
12
19
.31
0.1
12
19
.38
0.1
12
35
.01
1.9
82
IOCCP-JAMSTEC 2015 Inter calibration exercise
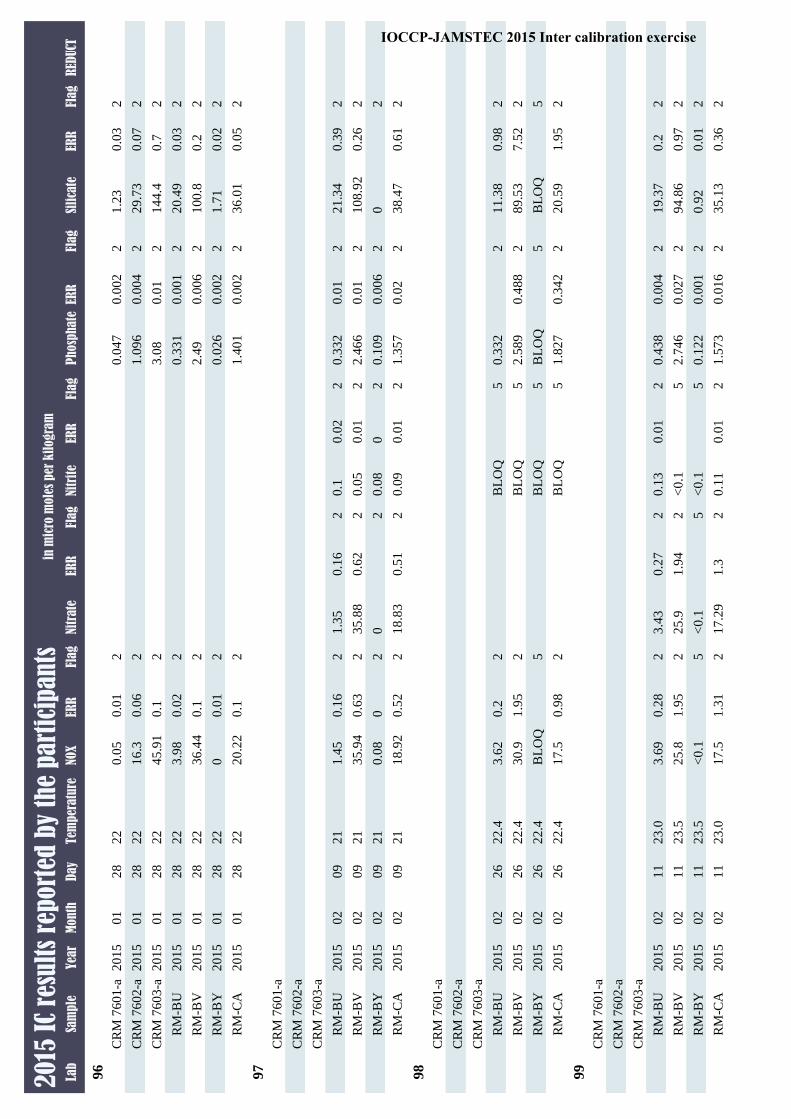
Lab
Sam
ple
Yea
rM
onth
Day
Tem
per
atu
reP
hosp
hate
ERR
Flag
Nitr
ite
ERR
Flag
Nitr
ate
ERR
Flag
NOX
ERR
Flag
RED
UCT
Sili
cate
ERR
Flag
20
15 I
C re
sult
s re
port
ed b
y th
e p
art
icip
an
tsin
mic
ro m
ole
s per
kil
ogra
m
96
CR
M 7
601
-a2
015
01
28
22
0.0
47
0.0
02
20
.05
0.0
12
1.2
30
.03
2
CR
M 7
602-a
20
15
01
28
22
1.0
96
0.0
04
21
6.3
0.0
62
29
.73
0.0
72
CR
M 7
603-a
20
15
01
28
22
3.0
80
.01
24
5.9
10
.12
14
4.4
0.7
2
RM
-BU
20
15
01
28
22
0.3
31
0.0
01
23
.98
0.0
22
20
.49
0.0
32
RM
-BV
20
15
01
28
22
2.4
90
.00
62
36
.44
0.1
21
00
.80
.22
RM
-BY
20
15
01
28
22
0.0
26
0.0
02
20
0.0
12
1.7
10
.02
2
RM
-CA
20
15
01
28
22
1.4
01
0.0
02
22
0.2
20
.12
36
.01
0.0
52
97
CR
M 7
601
-a
CR
M 7
602-a
CR
M 7
603-a
RM
-BU
20
15
02
09
21
0.3
32
0.0
12
0.1
0.0
22
1.3
50
.16
21
.45
0.1
62
21
.34
0.3
92
RM
-BV
20
15
02
09
21
2.4
66
0.0
12
0.0
50
.01
23
5.8
80
.62
23
5.9
40
.63
21
08
.92
0.2
62
RM
-BY
20
15
02
09
21
0.1
09
0.0
06
20
.08
02
02
0.0
80
20
2
RM
-CA
20
15
02
09
21
1.3
57
0.0
22
0.0
90
.01
21
8.8
30
.51
21
8.9
20
.52
23
8.4
70
.61
2
98
CR
M 7
601-a
CR
M 7
602-a
CR
M 7
603-a
RM
-BU
20
15
02
26
22
.40
.33
22
BL
OQ
53
.62
0.2
21
1.3
80
.98
2
RM
-BV
20
15
02
26
22
.42
.58
90
.48
82
BL
OQ
53
0.9
1.9
52
89
.53
7.5
22
RM
-BY
20
15
02
26
22
.4B
LO
Q5
BL
OQ
5B
LO
Q5
BL
OQ
5
RM
-CA
20
15
02
26
22
.41
.82
70
.34
22
BL
OQ
51
7.5
0.9
82
20
.59
1.9
52
99
CR
M 7
601-a
CR
M 7
602
-a
CR
M 7
603-a
RM
-BU
20
15
02
11
23
.00
.43
80
.00
42
0.1
30
.01
23
.43
0.2
72
3.6
90
.28
21
9.3
70
.22
RM
-BV
20
15
02
11
23
.52
.74
60
.02
72
<0
.15
25
.91
.94
22
5.8
1.9
52
94
.86
0.9
72
RM
-BY
20
15
02
11
23
.50
.12
20
.00
12
<0
.15
<0
.15
<0
.15
0.9
20
.01
2
RM
-CA
20
15
02
11
23
.01
.57
30
.01
62
0.1
10
.01
21
7.2
91
.32
17
.51
.31
23
5.1
30
.36
2
IOCCP-JAMSTEC 2015 Inter calibration exercise
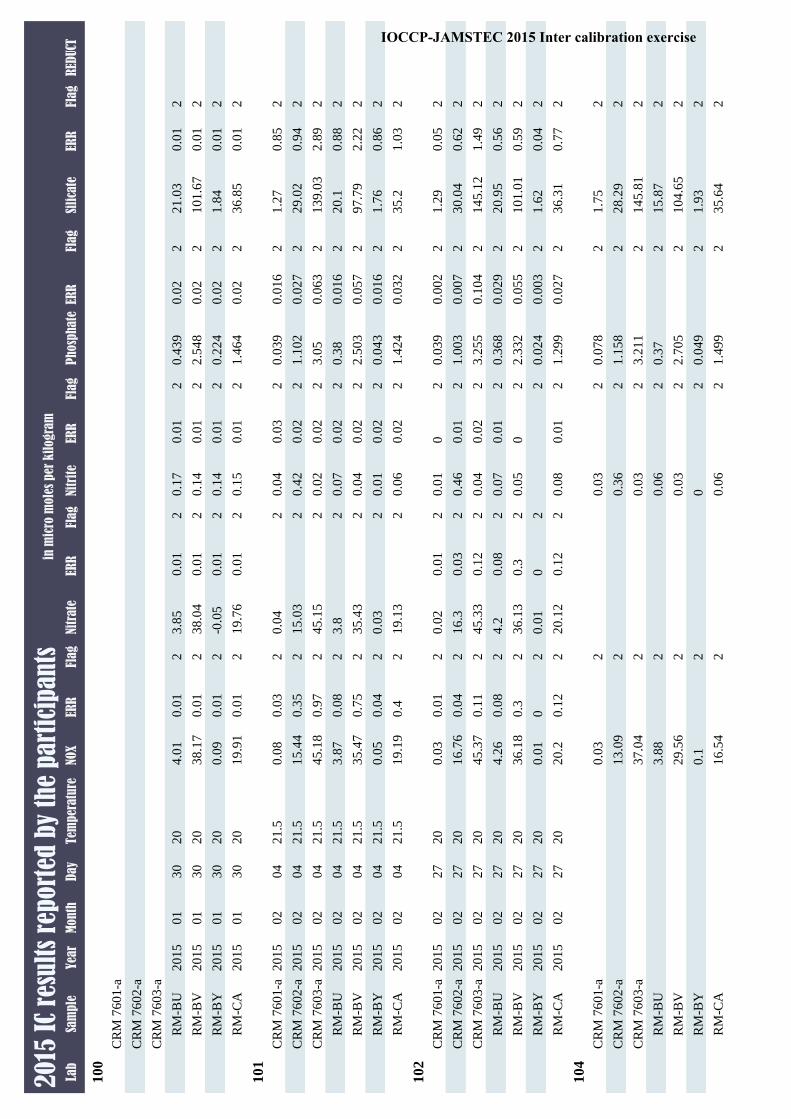
Lab
Sam
ple
Yea
rM
onth
Day
Tem
per
atu
reP
hosp
hate
ERR
Flag
Nitr
ite
ERR
Flag
Nitr
ate
ERR
Flag
NOX
ERR
Flag
RED
UCT
Sili
cate
ERR
Flag
20
15 I
C re
sult
s re
port
ed b
y th
e p
art
icip
an
tsin
mic
ro m
ole
s per
kil
ogra
m
100
CR
M 7
601
-a
CR
M 7
602-a
CR
M 7
603-a
RM
-BU
20
15
01
30
20
0.4
39
0.0
22
0.1
70
.01
23
.85
0.0
12
4.0
10
.01
22
1.0
30
.01
2
RM
-BV
20
15
01
30
20
2.5
48
0.0
22
0.1
40
.01
23
8.0
40
.01
23
8.1
70
.01
21
01
.67
0.0
12
RM
-BY
20
15
01
30
20
0.2
24
0.0
22
0.1
40
.01
2-0
.05
0.0
12
0.0
90
.01
21
.84
0.0
12
RM
-CA
20
15
01
30
20
1.4
64
0.0
22
0.1
50
.01
21
9.7
60
.01
21
9.9
10
.01
23
6.8
50
.01
2
101
CR
M 7
601
-a2
015
02
04
21
.50
.03
90
.01
62
0.0
40
.03
20
.04
20
.08
0.0
32
1.2
70
.85
2
CR
M 7
602-a
20
15
02
04
21
.51
.10
20
.02
72
0.4
20
.02
21
5.0
32
15
.44
0.3
52
29
.02
0.9
42
CR
M 7
603-a
20
15
02
04
21
.53
.05
0.0
63
20
.02
0.0
22
45
.15
24
5.1
80
.97
21
39
.03
2.8
92
RM
-BU
20
15
02
04
21
.50
.38
0.0
16
20
.07
0.0
22
3.8
23
.87
0.0
82
20
.10
.88
2
RM
-BV
20
15
02
04
21
.52
.50
30
.05
72
0.0
40
.02
23
5.4
32
35
.47
0.7
52
97
.79
2.2
22
RM
-BY
20
15
02
04
21
.50
.04
30
.01
62
0.0
10
.02
20
.03
20
.05
0.0
42
1.7
60
.86
2
RM
-CA
20
15
02
04
21
.51
.42
40
.03
22
0.0
60
.02
21
9.1
32
19
.19
0.4
23
5.2
1.0
32
102
CR
M 7
601-a
20
15
02
27
20
0.0
39
0.0
02
20
.01
02
0.0
20
.01
20
.03
0.0
12
1.2
90
.05
2
CR
M 7
602-a
20
15
02
27
20
1.0
03
0.0
07
20
.46
0.0
12
16
.30
.03
21
6.7
60
.04
23
0.0
40
.62
2
CR
M 7
603-a
20
15
02
27
20
3.2
55
0.1
04
20
.04
0.0
22
45
.33
0.1
22
45
.37
0.1
12
14
5.1
21
.49
2
RM
-BU
20
15
02
27
20
0.3
68
0.0
29
20
.07
0.0
12
4.2
0.0
82
4.2
60
.08
22
0.9
50
.56
2
RM
-BV
20
15
02
27
20
2.3
32
0.0
55
20
.05
02
36
.13
0.3
23
6.1
80
.32
10
1.0
10
.59
2
RM
-BY
20
15
02
27
20
0.0
24
0.0
03
22
0.0
10
20
.01
02
1.6
20
.04
2
RM
-CA
20
15
02
27
20
1.2
99
0.0
27
20
.08
0.0
12
20
.12
0.1
22
20
.20
.12
23
6.3
10
.77
2
104
CR
M 7
601-a
0.0
78
20
.03
20
.03
21
.75
2
CR
M 7
602
-a1
.15
82
0.3
62
13
.09
22
8.2
92
CR
M 7
603-a
3.2
11
20
.03
23
7.0
42
14
5.8
12
RM
-BU
0.3
72
0.0
62
3.8
82
15
.87
2
RM
-BV
2.7
05
20
.03
22
9.5
62
10
4.6
52
RM
-BY
0.0
49
20
20
.12
1.9
32
RM
-CA
1.4
99
20
.06
21
6.5
42
35
.64
2
IOCCP-JAMSTEC 2015 Inter calibration exercise

Lab
Sam
ple
Yea
rM
onth
Day
Tem
per
atu
reP
hosp
hate
ERR
Flag
Nitr
ite
ERR
Flag
Nitr
ate
ERR
Flag
NOX
ERR
Flag
RED
UCT
Sili
cate
ERR
Flag
20
15 I
C re
sult
s re
port
ed b
y th
e p
art
icip
an
tsin
mic
ro m
ole
s per
kil
ogra
m
106
CR
M 7
601
-a2
015
02
26
CR
M 7
602-a
20
15
02
26
CR
M 7
603-a
20
15
02
26
RM
-BU
20
15
02
26
22
0.3
39
0.0
13
20
.06
02
3.5
60
.02
23
.62
0.0
22
20
.28
0.0
72
RM
-BV
20
15
02
26
22
2.4
55
0.0
45
20
.05
02
33
.93
0.0
92
33
.98
0.0
92
87
.79
0.1
22
RM
-BY
20
15
02
26
22
0.0
29
0.0
02
20
.01
02
00
20
.01
02
1.8
70
.01
2
RM
-CA
20
15
02
26
22
1.4
0.0
38
20
.06
02
18
.71
0.1
82
18
.77
0.1
82
36
.09
0.1
72
107
CR
M 7
601
-a
CR
M 7
602-a
CR
M 7
603-a
RM
-BU
20
15
02
16
20
0.3
64
0.0
07
20
.05
0.0
12
3.9
50
.11
24
0.1
22
20
.43
0.0
82
RM
-BV
20
15
02
16
20
2.4
64
0.0
05
20
.04
02
35
.07
0.0
62
35
.10
.07
21
01
.31
0.3
32
RM
-BY
20
15
02
16
20
0.0
40
.00
72
00
20
.08
02
0.0
90
.01
21
.82
0.0
82
RM
-CA
20
15
02
16
20
1.4
06
0.0
01
20
.04
02
19
.28
0.0
62
19
.32
0.0
62
35
.06
0.0
62
108
CR
M 7
601-a
na
na
na
na
na
9na
na
9na
na
9na
na
9na
na
9
CR
M 7
602-a
na
na
na
na
na
9na
na
9na
na
9na
na
9na
na
9
CR
M 7
603-a
na
na
na
na
na
9na
na
9na
na
9na
na
9na
na
9
RM
-BU
20
15
02
26
21
0.8
79
0.4
12
0.5
80
.24
23
.27
0.8
23
.77
0.6
42
19
.03
0.7
42
RM
-BV
20
15
02
26
21
2.6
95
0.2
64
20
.34
0.1
92
30
.96
1.1
62
31
.31
.06
28
8.6
61
.22
2
RM
-BY
20
15
02
26
21
ND
NA
50
.10
.09
20
.41
0.2
62
0.4
90
.29
23
.13
0.8
92
RM
-CA
20
15
02
26
21
1.4
45
0.1
37
20
.43
0.0
82
17
.71
0.6
92
18
.08
0.5
32
21
.74
1.1
52
109
CR
M 7
601-a
20
15
02
23
19
.40
.04
70
.00
32
0.0
50
20
.04
02
0.1
02
1.3
60
2
CR
M 7
602
-a2
015
02
23
19
.41
.13
0.0
02
20
.40
21
6.0
40
.03
21
6.4
40
.03
23
0.8
0.0
42
CR
M 7
603-a
20
15
02
23
19
.43
.12
70
.01
12
0.0
40
24
4.6
0.1
24
4.6
40
.12
14
6.4
90
.13
2
RM
-BU
20
15
02
23
19
.40
.35
60
.00
32
0.0
90
24
.12
0.0
12
4.2
10
.01
22
1.3
80
.02
2
RM
-BV
20
15
02
23
19
.42
.55
30
.00
82
0.0
60
23
5.9
30
.07
23
5.9
90
.07
21
03
.19
0.2
2
RM
-BY
20
15
02
23
19
.40
.03
30
.00
42
0.0
40
20
.04
02
0.0
80
21
.81
02
RM
-CA
20
15
02
23
19
.41
.44
40
.00
72
0.0
80
22
0.2
30
.04
22
0.3
10
.04
23
7.3
30
.09
2
IOCCP-JAMSTEC 2015 Inter calibration exercise

Lab
Sam
ple
Yea
rM
onth
Day
Tem
per
atu
reP
hosp
hate
ERR
Flag
Nitr
ite
ERR
Flag
Nitr
ate
ERR
Flag
NOX
ERR
Flag
RED
UCT
Sili
cate
ERR
Flag
20
15 I
C re
sult
s re
port
ed b
y th
e p
art
icip
an
tsin
mic
ro m
ole
s per
kil
ogra
m
111
CR
M 7
601
-a
CR
M 7
602-a
CR
M 7
603-a
RM
-BU
20
15
01
27
21
0.3
58
0.0
29
20
.06
02
4.1
40
24
.20
22
1.9
0.6
52
RM
-BV
20
15
01
27
21
2.4
90
.04
52
0.0
50
23
4.5
70
.48
23
4.6
20
29
9.2
02
RM
-BY
20
15
01
27
21
0.0
49
02
0.0
10
20
.02
02
0.1
02
1.7
50
2
RM
-CA
20
15
01
27
21
1.4
32
0.0
66
20
.05
02
19
.77
02
19
.82
02
35
.59
2.7
22
112
CR
M 7
601
-aN
/A
CR
M 7
602-a
N/A
CR
M 7
603-a
N/A
RM
-BU
20
15
02
13
23
.30
.35
20
20
.07
0.0
12
NA
94
.05
0.0
12
20
.63
0.0
72
RM
-BV
20
15
02
13
23
.32
.50
20
20
.04
02
NA
93
6.3
30
.06
21
02
.11
0.1
22
RM
-BY
20
15
02
13
23
.30
.03
90
.01
20
.01
02
NA
90
.07
0.0
12
1.2
80
.07
2
RM
-CA
20
15
02
13
23
.31
.41
70
.01
20
.06
02
NA
91
9.8
0.0
22
36
.29
0.0
82
113
CR
M 7
601-a
CR
M 7
602-a
CR
M 7
603-a
RM
-BU
20
15
01
21
21
0.3
40
.00
22
0.0
80
23
.93
0.0
12
4.0
10
.01
22
1.2
40
.02
2
RM
-BV
20
15
01
21
21
2.4
76
0.0
11
20
.06
02
35
.03
0.0
82
35
.09
0.0
82
10
2.1
60
.37
2
RM
-BY
20
15
01
21
21
0.0
33
0.0
01
20
.03
02
0.0
40
.01
20
.07
0.0
12
1.8
20
.02
2
RM
-CA
20
15
01
21
21
1.4
03
0.0
07
20
.08
02
19
.54
0.0
32
19
.61
0.0
32
37
.02
0.0
32
114
CR
M 7
601-a
CR
M 7
602
-a
CR
M 7
603-a
RM
-BU
20
15
02
02
27
.50
.48
90
.00
22
40
.04
21
4.0
10
.05
2
RM
-BV
20
15
02
03
27
.42
.57
30
.00
12
34
.67
0.0
72
69
.24
0.5
42
RM
-BY
20
15
02
02
27
.50
.18
60
20
.06
02
1.9
70
.01
2
RM
-CA
20
15
02
03
27
.41
.49
70
.03
92
19
.38
0.1
32
2
IOCCP-JAMSTEC 2015 Inter calibration exercise

Table A4 Ammonia
Lab Sample Ammonia err Nitrite err Nitrate err Nitrate+Nitrite err
4
RM-BU 1.39 0.21 0.08 0.14 4.03 0.28 4.1 0.28
RM-BV 1.77 0.21 0.04 0.14 34.89 1.56 34.89 1.56
RM-BY 1.39 0.21 0.01 0.14 0.15 0.14 0.16 0.14
RM-CA 0.86 0.14 0.03 0.14 19.74 0.91 19.84 0.91
5
CRM 7601-a 7.91 0.23 0.03 0.1 0.01 0 0.04 0
CRM 7602-a 4.98 0.15 0.39 0.1 15.46 0.16 15.85 0.16
CRM 7603-a 6.17 0.19 0.02 0.1 46.34 0.46 46.36 0.46
RM-BU 1.11 0.03 0.08 0.1 3.87 0.04 3.95 0.04
RM-BV 1.32 0.04 0.05 0.1 36.72 0.36 36.76 0.36
RM-BY 0.78 0.02 0.02 0.1 <0.24 <0.24
RM-CA 0.59 0.02 0.06 0.1 22.5 0.22 22.56 0.22
8
CRM 7602-a 5.93 0.06 0.41 0 16.4 0.17 16.81 0.18
CRM 7603-a 11.3 0.16 0.03 0 46.34 0.14 46.37 0.14
RM-BU 1.4 0.1 0.09 0 3.91 0.08 4 0.08
RM-BV 2.41 0.27 0.06 0 36.48 0.17 36.55 0.2
RM-CA 1.11 0.08 0.06 0 20.47 0.05 20.55 0.04
19
RM-BU 1.23 0 0.08 0 3.97 0.1 4.05 0.1
RM-BV 1.44 0 0.05 0 35.96 0.1 36.01 0.1
RM-BY 0.98 0 0.02 0 0 0.03 0.02 0.03
RM-CA 0.68 0 0.07 0 19.97 0.03 20.03 0.03
20
RM-BU 1.4 0.21 0.08 0 3.98 0.08 4.06 0.08
RM-BV 1.34 0.21 0.05 0 35.74 0.82 35.79 0.82
RM-BY 0.87 0.13 0.02 0 0.03 0 0.05 0
RM-CA 0.72 0.11 0.06 0 19.93 0.6 19.99 0.6
27
CRM 7601-a 5.86 0.1 0.03 0.01 0.04 0.02 0.07 0.02
CRM 7602-a 5.86 0.1 0.38 0.01 15.09 0.15 15.47 0.15
CRM 7603-a 5.86 0.1 0.02 0 42.53 0.52 42.55 0.52
RM-BU 5.86 0.1 0.07 0.01 3.77 0.07 3.85 0.07
RM-BV 5.86 0.1 0.05 0.01 34.67 0.36 34.72 0.36
RM-BY 5.86 0.1 0.02 0.01 0.03 0.02 0.05 0.02
RM-CA 5.86 0.1 0.06 0.01 19.18 0.21 19.24 0.21
IOCCP-JAMSTEC 2015 Inter calibration exercise

Lab Sample Ammonia err Nitrite err Nitrate err Nitrate+Nitrite err
28
RM-BU 1.44 0.1 0.06 0 3.92 0.2 3.98 0.2
RM-BV 1.52 0.1 0.03 0 34.71 0.29 34.74 0.29
RM-BY 0.99 0.1 0.01 0 0.1 0.02 0.11 0.05
RM-CA 0.56 0.1 0.05 0 20.05 0.24 20.1 0.24
30
RM-BU 5.31 0.33 0.11 0 1.21 0.27 1.31 1.17
RM-BV 0.26 0.04 0.03 0 22.47 2.85 22.51 2.85
RM-BY ND ND 0 0 ND ND 0 0
RM-CA 0.53 0.06 0.04 0 16.57 0.29 16.61 3.03
32
RM-BU 1.35 0.19 <0.06 3.27 3.27 0.69
RM-BV 1.65 0.06 <0.06 31.85 31.85 1.84
RM-BY 0.71 0.05 <0.06 0.27 0.27 0.02
RM-CA 0.47 0.01 <0.06 18.43 18.43 1.33
40
RM-BU 4.49 0.2 0.08 0.1 4.2 0.1 4.3 0.1
RM-BV 4.79 0.2 <0.08 0.29 37.11 0.29 37.21 0.29
RM-BY 3.81 0.2 <0.08 0.07 0.07 0.07 <0.07 0.07
RM-CA 3.32 0.2 <0.08 0.29 19.53 0.29 19.63 0.29
50
RM-BU 1.35 0.02 0.07 0 3.94 0.02 4 0.02
RM-BV 1.4 0.02 0.06 0 34.9 0.24 34.96 0.23
RM-BY 0.92 0.01 0.02 0 0.02 0 0.04 0.01
RM-CA 0.7 0.01 0.08 0 19.57 0.03 19.65 0.03
51
CRM 7601-a 10.37 0.1 0.12 0.1 2.33 0.98
CRM 7602-a 5.09 0.1 0.41 0.1 16.64 0.98
RM-BU 1.41 0.1
RM-BV 1.88 0.1
RM-BY 1.01 0.1 0.04 0.1 0.68 0.98
RM-CA 0.82 0.1 23.37 0.98
52
RM-BU na na na na na na 3.91 0.02
RM-BV na na na na na na 35.35 0.04
RM-BY na na na na na na 0.05 0
RM-CA na na na na na na 19.55 0.09
IOCCP-JAMSTEC 2015 Inter calibration exercise

Lab Sample Ammonia err Nitrite err Nitrate err Nitrate+Nitrite err
56
CRM 7601-a 10.87 0 0.04 0.01 0.01 0.18 0.05 0.18
CRM 7602-a 5.08 0 0.41 0.01 15.09 0.18 15.5 0.18
CRM 7603-a 5.63 0 0.03 0.01 43.89 0.18 43.91 0.18
RM-AX 0.75 0 0.39 0.01 21.16 0.18 21.55 0.18
RM-AZ 0.7 0 0.04 0.01 42.09 0.18 42.13 0.18
RM-BD 5.83 0 0.05 0.01 29.45 0.18 29.5 0.18
RM-BP 3.32 0 0.04 0.01 0 0.18 0.04 0.18
RM-BQ 1.67 0 0.03 0.01 43.9 0.18 43.92 0.18
RM-BU 0.99 0 0.08 0.01 3.58 0.18 3.66 0.18
RM-BV 1.63 0 0.05 0.01 35.07 0.18 35.12 0.18
RM-BY 0.93 0 0.02 0.01 0 0.18 0.02 0.18
RM-CA 0.65 0 0.07 0.01 19.27 0.18 19.34 0.18
59
RM-BU 0.9 0.05 0.07 0 3.02 0.11 3.02 0.11
RM-BV 0.92 0.1 0.05 0 31.94 0.5 31.95 0.5
RM-BY 0.63 0 0.03 0 0.03 0 0.03 0
RM-CA 0.46 0.03 0.07 0.01 18.41 0.9 18.41 0.9
86
CRM 7602-a 7.82 0.61 0.36 0 15.96 0.1 16.32 0.09
CRM 7603-a 9.26 0.06 0.1 0 44.66 0.02 44.75 0.02
RM-BU 1.05 0.04 0.08 0 4.05 0 4.13 0
RM-BV 1.57 0.02 0.04 0 37.27 0.02 37.31 0.02
RM-BY 0.69 0.01 0.02 0 0.06 0.01 0.08 0.01
RM-CA 0.58 0.01 0.06 0 20.39 0.01 20.45 0.01
87
RM-BU 1.69 0.07 3.89 3.95
RM-BV 1.84 0.05 35.13 35.18
RM-BY 1.23 0.01 0.01 0.02
RM-CA 1 0.06 19.42 19.48
89
RM-BU 1.5 0 0.13 0.01 3.96 0.02
RM-BV 1.75 0 0.07 0.01 34.8 0.03
RM-BY 1.09 0.03 0.06 0.01 0.08 0.01
RM-CA 0.72 0 0.1 0.01 19.33 0.1
95
RM-BU 0.91 0.05 0.09 0.01 3.86 0.04 3.95 0.05
RM-BV 0.97 0.05 0.06 0 35.12 0.25 35.18 0.25
RM-BY 0.51 0.07 0.02 0.01 0.09 0.04 0.11 0.05
RM-CA 0.41 0.06 0.07 0.01 19.31 0.11 19.38 0.11
IOCCP-JAMSTEC 2015 Inter calibration exercise

Lab Sample Ammonia err Nitrite err Nitrate err Nitrate+Nitrite err
97
RM-BU 0.83 0 0.1 0.02 1.35 0.16 1.45 0.16
RM-BV 1.51 0.05 0.05 0.01 35.88 0.62 35.94 0.63
RM-BY 0.51 0.02 0.08 0 0 0.08 0
RM-CA 0.3 0.03 0.09 0.01 18.83 0.51 18.92 0.52
98
RM-BU 1.25 0.2 BLOQ 3.62 0.2
RM-BV 1.14 0.2 BLOQ 30.9 1.95
RM-BY 0.9 0.1 BLOQ BLOQ
RM-CA 0.51 0.1 BLOQ 17.5 0.98
99
RM-BU 1.56 0.16 0.13 0.01 3.43 0.27 3.69 0.28
RM-BV 1.93 0.19 <0.1 25.9 1.94 25.8 1.95
RM-BY 1.11 0.11 <0.1 <0.1 <0.1
RM-CA 0.92 0.09 0.11 0.01 17.29 1.3 17.5 1.31
100
RM-BU 1.57 0.02 0.17 0.01 3.85 0.01 4.01 0.01
RM-BV 2.03 0.02 0.14 0.01 38.04 0.01 38.17 0.01
RM-BY 1.16 0.02 0.14 0.01 -0.05 0.01 0.09 0.01
RM-CA 1.22 0.02 0.15 0.01 19.76 0.01 19.91 0.01
101
CRM 7601-a 11.27 0.29 0.04 0.03 0.04 0.08 0.03
CRM 7602-a 4.57 0.2 0.42 0.02 15.03 15.44 0.35
CRM 7603-a 7.15 0.22 0.02 0.02 45.15 45.18 0.97
RM-BU 1.44 0.21 0.07 0.02 3.8 3.87 0.08
RM-BV 1.77 0.2 0.04 0.02 35.43 35.47 0.75
RM-BY 1.2 0.21 0.01 0.02 0.03 0.05 0.04
RM-CA 1.04 0.2 0.06 0.02 19.13 19.19 0.4
102
CRM 7601-a 6.99 0.03 0.01 0 0.02 0.01 0.03 0.01
CRM 7602-a 3.04 0.23 0.46 0.01 16.3 0.03 16.76 0.04
CRM 7603-a 7.44 0.34 0.04 0.02 45.33 0.12 45.37 0.11
RM-BU 0.41 0.13 0.07 0.01 4.2 0.08 4.26 0.08
RM-BV 1.61 0.08 0.05 0 36.13 0.3 36.18 0.3
RM-BY 0.88 0.05 0.01 0 0.01 0
RM-CA 0.28 0.09 0.08 0.01 20.12 0.12 20.2 0.12
IOCCP-JAMSTEC 2015 Inter calibration exercise

Lab Sample Ammonia err Nitrite err Nitrate err Nitrate+Nitrite err
104
CRM 7601-a 6.16 0.03 0.03
CRM 7602-a 4.34 0.36 13.09
CRM 7603-a 6.06 0.03 37.04
RM-BU 1.21 0.06 3.88
RM-BV 1.64 0.03 29.56
RM-BY 0.83 0 0.1
RM-CA 0.83 0.06 16.54
106
RM-BU 1.5 0.03 0.06 0 3.56 0.02 3.62 0.02
RM-BV 1.76 0.02 0.05 0 33.93 0.09 33.98 0.09
RM-BY 1.06 0.02 0.01 0 0 0 0.01 0
RM-CA 0.65 0 0.06 0 18.71 0.18 18.77 0.18
108
CRM 7601-a na na na na na na na na
CRM 7602-a na na na na na na na na
CRM 7603-a na na na na na na na na
RM-BU 1.41 0.11 0.58 0.24 3.27 0.8 3.77 0.64
RM-BV 1.58 0.09 0.34 0.19 30.96 1.16 31.3 1.06
RM-BY 1.18 0.12 0.1 0.09 0.41 0.26 0.49 0.29
RM-CA 0.9 0.08 0.43 0.08 17.71 0.69 18.08 0.53
109
CRM 7601-a 9.99 0.04 0.05 0 0.04 0 0.1 0
CRM 7602-a 3.72 0 0.4 0 16.04 0.03 16.44 0.03
CRM 7603-a 5.64 0.02 0.04 0 44.6 0.1 44.64 0.1
RM-BU 1.59 0.01 0.09 0 4.12 0.01 4.21 0.01
RM-BV 2.04 0.01 0.06 0 35.93 0.07 35.99 0.07
RM-BY 1.32 0.01 0.04 0 0.04 0 0.08 0
RM-CA 1.05 0.01 0.08 0 20.23 0.04 20.31 0.04
112
RM-BU 1.22 0.01 0.07 0.01 NA 4.05 0.01
RM-BV 1.59 0.01 0.04 0 NA 36.33 0.06
RM-BY 0.84 0.01 0.01 0 NA 0.07 0.01
RM-CA 0.75 0 0.06 0 NA 19.8 0.02
113
RM-BU 1.16 0.01 0.08 0 3.93 0.01 4.01 0.01
RM-BV 1.65 0.01 0.06 0 35.03 0.08 35.09 0.08
RM-BY 0.97 0 0.03 0 0.04 0.01 0.07 0.01
RM-CA 0.84 0 0.08 0 19.54 0.03 19.61 0.03
IOCCP-JAMSTEC 2015 Inter calibration exercise
IOCCP-JAMSTEC 2015 Inter calibration exercise
This page left intentionally blank 25

Table A5 DOP
Lab Sample Phosphate err DOP err
32
RM-BU 0.374 0.032 0.65 0
RM-BV 2.649 0.078 2.87 0.06
RM-BY 0.042 0.014 0.29 0.01
RM-CA 1.506 0.049 1.62 0.02
37
RM-BU 0.352 0.01 0.29 0.01
RM-BV 2.513 0.01 0.39 0.01
RM-BY 0.029 0 0.26 0
RM-CA 1.427 0.01 0.18 0.02
40
RM-BU 0.381 0.029 0.2 0.1
RM-BV 2.539 0.059 0.29 0.1
RM-BY <0.03 0.029 <0.1 0.1
RM-CA 1.465 0.059 <0.1 0.1
49
CRM 7601-a 0.068 0 0.84
CRM 7601-a 0.071 0.006 0.62
CRM 7601-a 0.029 0 0.6 0
CRM 7601-a 0.029 0 0.61 0
CRM 7602-a 1.13 0.006 0.84 0.01
CRM 7602-a 1.123 0 0.22 0.1
CRM 7602-a 1.188 0.006 0.88
CRM 7602-a 1.188 0.006 0.57
CRM 7603-a 3.141 0.006 0.52 0.12
CRM 7603-a 3.343 0.098 0.6
CRM 7603-a 3.141 0.006 0.45 0.01
CRM 7603-a 3.349 0.01 0.46
RM-BU 0.43 0 0.48
RM-BU 0.352 0 0.29 0
RM-BV 2.702 0.006 0.65
RM-BV 2.575 0.006 0.46 0.01
RM-BY 0.062 0.006 0.41
RM-BY 0.02 0 0.33 0.01
RM-CA 1.504 0 0.38
RM-CA 1.455 0 0.26 0
IOCCP-JAMSTEC 2015 Inter calibration exercise
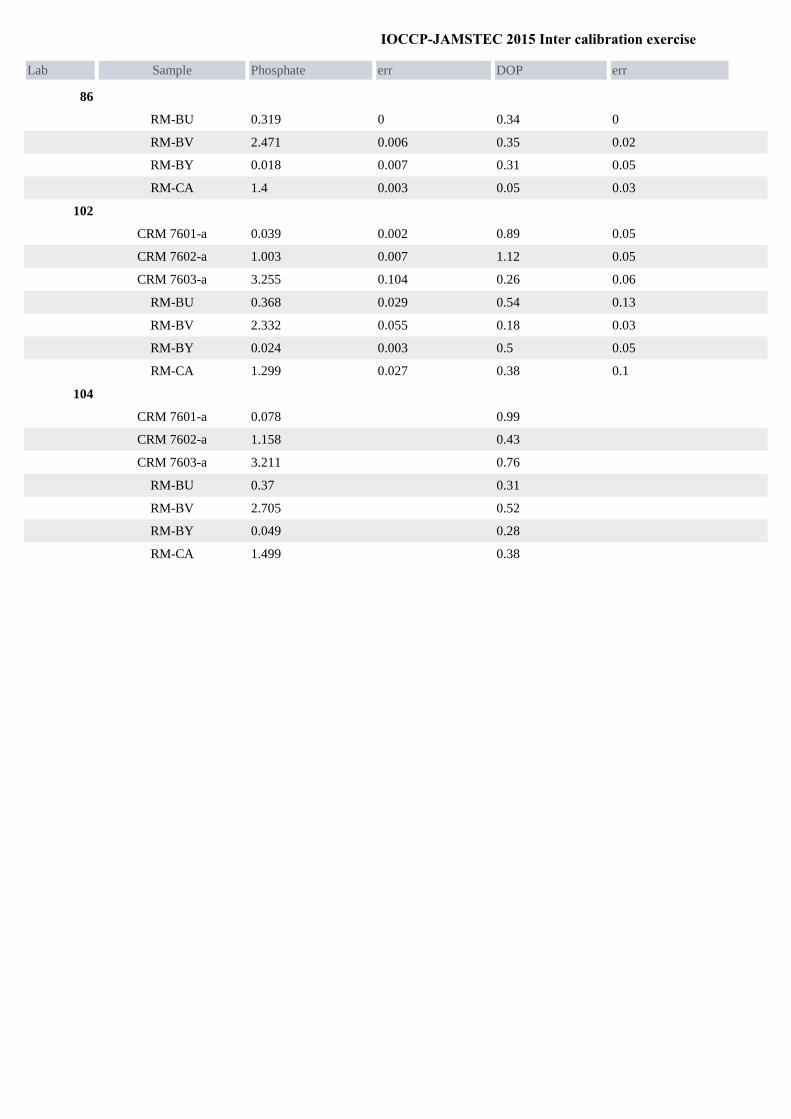
Lab Sample Phosphate err DOP err
86
RM-BU 0.319 0 0.34 0
RM-BV 2.471 0.006 0.35 0.02
RM-BY 0.018 0.007 0.31 0.05
RM-CA 1.4 0.003 0.05 0.03
102
CRM 7601-a 0.039 0.002 0.89 0.05
CRM 7602-a 1.003 0.007 1.12 0.05
CRM 7603-a 3.255 0.104 0.26 0.06
RM-BU 0.368 0.029 0.54 0.13
RM-BV 2.332 0.055 0.18 0.03
RM-BY 0.024 0.003 0.5 0.05
RM-CA 1.299 0.027 0.38 0.1
104
CRM 7601-a 0.078 0.99
CRM 7602-a 1.158 0.43
CRM 7603-a 3.211 0.76
RM-BU 0.37 0.31
RM-BV 2.705 0.52
RM-BY 0.049 0.28
RM-CA 1.499 0.38
IOCCP-JAMSTEC 2015 Inter calibration exercise

Table A6 DON
Lab Sample DON err Nitrate err Nitrite err Nitrate+Nitrite err Ammonia err
32
RM-BU 8.65 0.12 3.27 <0.06 3.27 0.69 1.35 0.19
RM-BV 32.03 0.48 31.85 <0.06 31.85 1.84 1.65 0.06
RM-BY 5.46 0.06 0.27 <0.06 0.27 0.02 0.71 0.05
RM-CA 19.45 0.07 18.43 <0.06 18.43 1.33 0.47 0.01
40
RM-BU 2.54 0.68 4.2 0.1 0.08 0.1 4.3 0.1 4.49 0.2
RM-BV 3.12 0.68 37.11 0.29 <0.08 0.29 37.21 0.29 4.79 0.2
RM-BY 2.25 0.68 0.07 0.07 <0.08 0.07 <0.07 0.07 3.81 0.2
RM-CA 3.61 0.68 19.53 0.29 <0.08 0.29 19.63 0.29 3.32 0.2
49
CRM 7601- 15.13 0.04 0.03 0 LD 0.03 0
CRM 7601- 14.68 0.05 0.01 0.02 0 0.07 0.01
CRM 7601- 14.43 0.05 0.03 0.02 0 0.07 0.03
CRM 7601- 14.92 0.07 0.03 0.01 LD 0.03 0
CRM 7602- 9.73 0.08 15.65 0.03 0.35 0.01 16 0.03
CRM 7602- 9.11 15.61 0.05 0.36 0 15.97 0.05
CRM 7602- 9.56 0.09 15.69 0.06 0.36 0 16.05 0.06
CRM 7602- 8.85 15.62 0.06 0.37 0 15.98 0.06
CRM 7603- 8.37 44.3 0.07 0 0 44.3 0.07
CRM 7603- 10.15 0.29 44.53 0.13 LD 44.53 0.13
CRM 7603- 8.34 44.37 0.11 0.01 0 44.38 0.11
CRM 7603- 10.18 0.26 44.55 0.14 LD 44.55 0.15
RM-BU 6.32 0.03 4 0.01 0.03 0.01 4.03 0.01
RM-BU 5.7 3.94 0.01 0.05 0 3.99 0.01
RM-BV 3.31 35.57 0.1 0.03 0 35.6 0.1
RM-BV 4.37 0.06 35.98 0.06 0.01 0 35.99 0.06
RM-BY 4.37 0.09 0.03 0 0 0.1 0.03
RM-BY 4.94 0.02 0.04 0.01 LD 0.04 0.01
RM-CA 3.59 0.11 19.97 0.06 0.03 0 20 0.06
RM-CA 3.13 19.76 0.03 0.04 0 19.79 0.03
86
RM-BU 3.95 0.07 4.05 0 0.08 0 4.13 0 1.05 0.04
RM-BV 0.27 0.13 37.27 0.02 0.04 0 37.31 0.02 1.57 0.02
RM-BY 3.74 0.08 0.06 0.01 0.02 0 0.08 0.01 0.69 0.01
RM-CA 1.97 0.11 20.39 0.01 0.06 0 20.45 0.01 0.58 0.01
102
CRM 7601- 5.35 0.12 0.02 0.01 0.01 0 0.03 0.01 6.99 0.03
CRM 7602- 5.06 0.14 16.3 0.03 0.46 0.01 16.76 0.04 3.04 0.23
CRM 7603- 0.99 0.13 45.33 0.12 0.04 0.02 45.37 0.11 7.44 0.34
IOCCP-JAMSTEC 2015 Inter calibration exercise
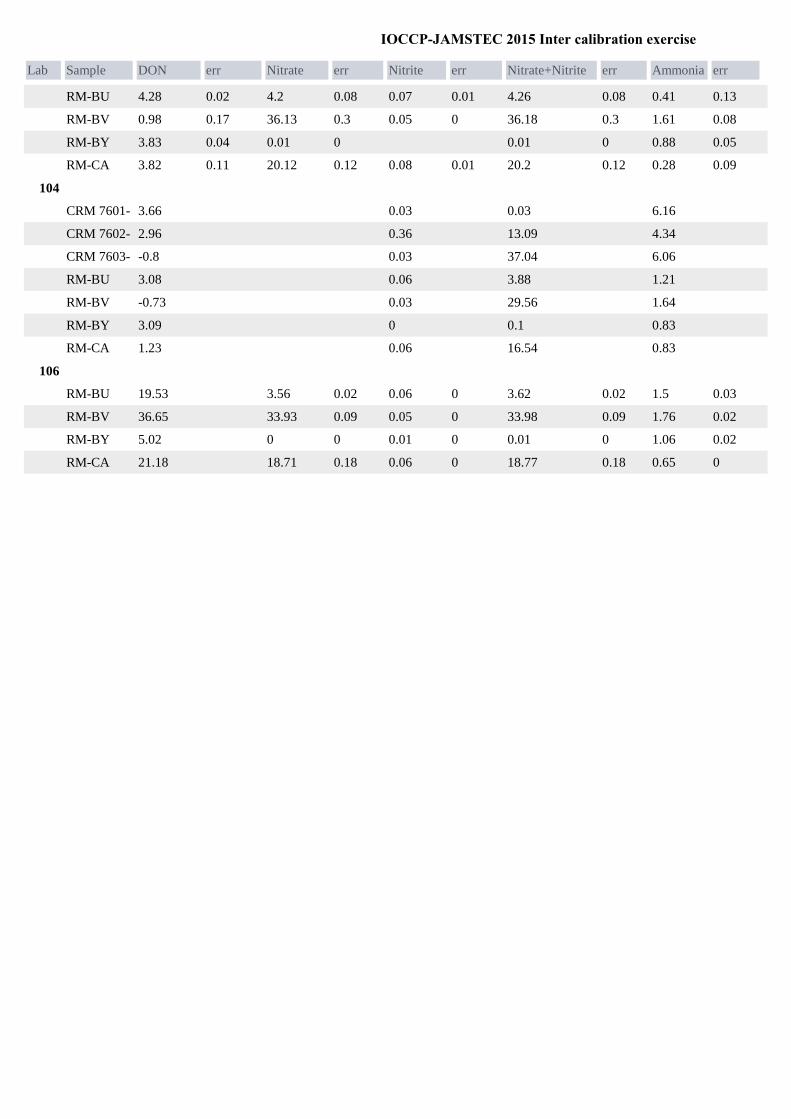
Lab Sample DON err Nitrate err Nitrite err Nitrate+Nitrite err Ammonia err
RM-BU 4.28 0.02 4.2 0.08 0.07 0.01 4.26 0.08 0.41 0.13
RM-BV 0.98 0.17 36.13 0.3 0.05 0 36.18 0.3 1.61 0.08
RM-BY 3.83 0.04 0.01 0 0.01 0 0.88 0.05
RM-CA 3.82 0.11 20.12 0.12 0.08 0.01 20.2 0.12 0.28 0.09
104
CRM 7601- 3.66 0.03 0.03 6.16
CRM 7602- 2.96 0.36 13.09 4.34
CRM 7603- -0.8 0.03 37.04 6.06
RM-BU 3.08 0.06 3.88 1.21
RM-BV -0.73 0.03 29.56 1.64
RM-BY 3.09 0 0.1 0.83
RM-CA 1.23 0.06 16.54 0.83
106
RM-BU 19.53 3.56 0.02 0.06 0 3.62 0.02 1.5 0.03
RM-BV 36.65 33.93 0.09 0.05 0 33.98 0.09 1.76 0.02
RM-BY 5.02 0 0 0.01 0 0.01 0 1.06 0.02
RM-CA 21.18 18.71 0.18 0.06 0 18.77 0.18 0.65 0
IOCCP-JAMSTEC 2015 Inter calibration exercise

Table A7 DOC
Lab Sample DOC err
106
RM-BU 168.58 2.02
RM-BV 119.95 1.1
RM-BY 133.98 1.56
RM-CA 101.29 1.68
IOCCP-JAMSTEC 2015 Inter calibration exercise

IOCCP-JAMSTEC 2015 Inter calibration exercise
1
Appendix III
Table A8-1 Cross reference table of ranked order and Lab # for Figure 1-1
Table A8-2 Cross reference table of ranked order and Lab # for Figure 1-2
Table A8-3 Cross reference table of ranked order and Lab # for Figure 2-1
Table A8-4 Cross reference table of ranked order and Lab # for Figure 2-2
Table A8-5 Cross reference table of ranked order and Lab # for Figure 3-1
Table A8-6 Cross reference table of ranked order and Lab # for Figure 3-2
Table A8-7 Cross reference table of ranked order and Lab # for Figure 4-1
Table A8-8 Cross reference table of ranked order and Lab # for Figure 4-2
Table A8-9 Cross reference table of ranked order and Lab # for Figure 5-1
Table A8-10 Cross reference table of ranked order and Lab # for Figure 5-2

IOCCP-JAMSTEC 2015 Inter calibration exercise
2
Table A8-1 Cross reference table of ranked order and Lab # for Figure 1-1
rank Lab No. Lab name
1 30 Central Institute of Fisheries Technology, India
2 99 Centro de Investigaciones Biológicas del, Noroeste SC., Mexico
3 90 School of Earth and Environmental Science,University of Portsmouth, UK
4 104 Australian Institute of Marine Science, Australia
5 98 University of Tartu, Estonian Marine Institute, Estonia
6 108 School of Fisheries and Ocean Sciences (SFOS) University of Alaska Fairbanks (UAF), USA
7 32 Israel Oceanographic & Limnological Res, National Institute of Oceanography, Israel
8 59 Monterey Bay Aquarium Research Institute, USA
9 80 Instituto del Mar del Perú, Peru
10 17 College of Marine and Environmental Sciences, Tianjin University of Science and Technology, China
11 106 Institut de Ciències del Mar (ICM-CSIC), Barcelona, Spain
12 65 Hawaii Ocean Time-series, USA
13 45 University of Cape town, Dept of Oceanography, South Africa
14 10 University of British Columbia, Department of Earth, Ocean & Atmospheric Sciences, Canada
15 88 Faroe Marine Research Institute, Faroe Islands
16 111 Institute of Oceanology Polish Academy of Sciences, Marine Chemistry and Biochemistry Department, Poland
17 114 LOQyCA - Centro Nacional Patagonico (CONICET), Argentina
18 27 Bundesamt für Seeschifffahrt und Hydrographie (BSH), Laboratorium Sülldorf, Germany
19 28 Alfred-Wegener-Institute; Helmholtz Centre for Polar and Marine Research, Germany
20 23 Mediterranean Institute of Oceanology (MIO) Campus de Luminy, France
21 89 Scottish Environment Protection Agency, UK
22 92 Station Biologique de Roscoff, Centre national de la recherche scientifique (CNRS) / Université Pierre et Marie Curie, France
23 64 University of Hawaii, SOEST Laboratory for Analytical Biogeochemistry (S-LAB), USA
24 29 Marine Research Institute, Iceland
25 4 Queensland Health Forensic and Scientific Services, Australia
26 50 Plymouth Marine Laboratory, UK
27 14 State Key laboratory of Marine Environmental Science, Xiamen University, China
28 113 Scripps Institution of Oceanography, CalCOFI Group, UC San Diego, USA
29 107 Observatoire oceanologique de Villefranche-sur-Mer (CNRS-UPMC), France
30 56 Scripps Institution of Oceanography, USA

IOCCP-JAMSTEC 2015 Inter calibration exercise
3
rank Lab No. Lab name
31 95 National Institute of Oceanography, India
32 87 Department of Fisheries and Oceans Canada, Canada
33 93 GEOMAR Helmholtz Center for Ocean Research, Kiel, Germany
34 41 Kjemilaboratoriet / Chemistry Laboratory, Havforskningsinstituttet / Institute of Marine Research, Norway
35 57 NOAA Atlantic Oceanographic and Meteorological Laboratory (AOML), Miami, Florida, USA
36 35 Japan Meteorological Agency, Japan
37 52 Department of Earth, Ocean and Ecological Sciences, SOES, University of Liverpool, UK
38 101 Marine Environment Research Division, National Institute of Fisheries Science, Republic of Korea
39 39 Royal NIOZ, Netherlands
40 91 Department of Fisheries and Oceans Canada, Institute of Ocean Sciences, Canada
41 49 National Oceanography Centre, Southampton, UK
42 26 Leibniz-Institute for Baltic Sea Research Warnemünde (IOW), Germany
43 20 Ifremer, LERN, Port en Bessin, France
44 38 Japan Sea National Fisheries Research Institute, Japan Fisheries Research and Education Agency, Japan
45 97 Geochemical & Environmental Research Group, Texas A&M University, USA
46 109 Oceanographic Measurement & Instrument Calibration Service Center (OMICS)/Korea Institute of Ocean Science & Technology, Republic of Korea
47 19 Ifremer, DYNECO/PELAGOS, Plouzané, France
48 102 Stazione Zoologica Anton Dohrn, Italy
49 112 R/V INVESTIGATOR, CSIRO Marine and Atmospheric Research, Australia
50 96 Department of Fisheries and Oceans Canada, Institute of Ocean Sciences, Canada
51 8 Institute of Biology, Rio de Janeiro Federal University, Brazil
52 5 OD NATURE – ECOCHEM, Belgium
53 40 National Institute of Water and Atmospheric Research (NIWA), New Zealand
54 86 Istituto Nazionale di Oceanografia e Geofisica Sperimentale, Italy
55 100 URI/Grad. School of Oceanography, USA
56 7 Laboratório de Nutrientes, Micronutrientes e Traços nos Oceanos (LABNUT-IOUSP), Instituto Oceanográfico da Universidade de São Paulo, Brazil
57 51 Marine Scotland - Science, UK
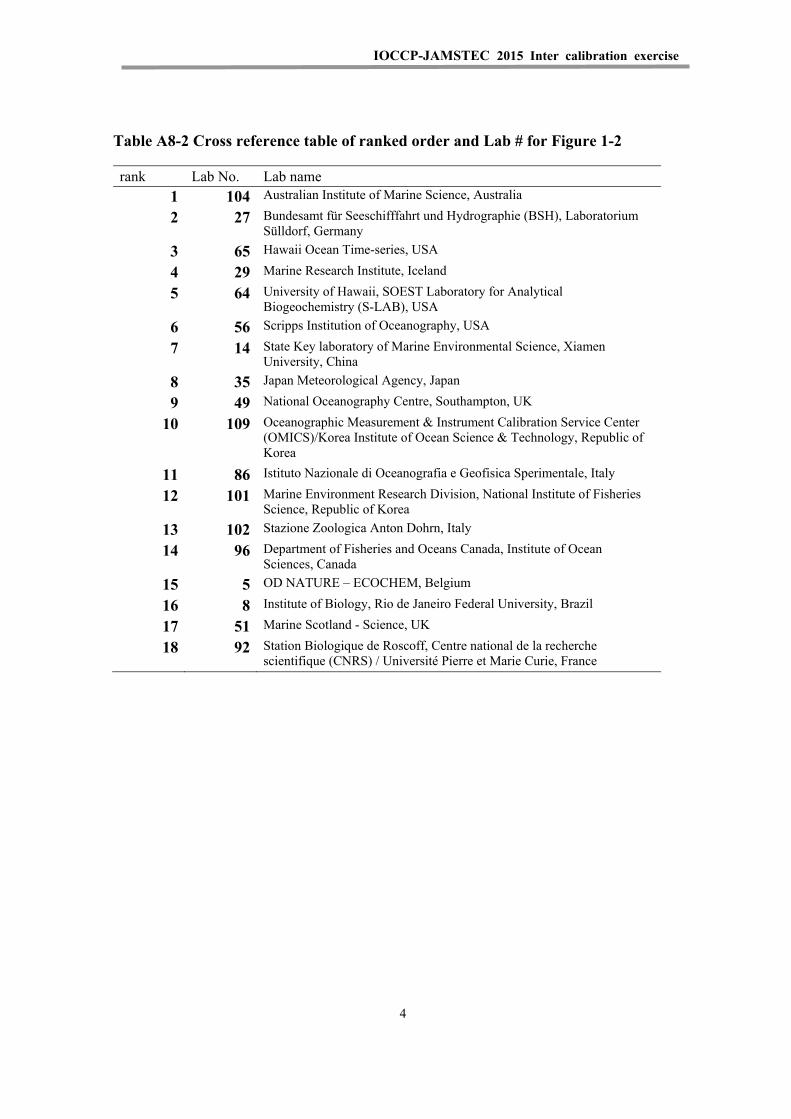
IOCCP-JAMSTEC 2015 Inter calibration exercise
4
Table A8-2 Cross reference table of ranked order and Lab # for Figure 1-2
rank Lab No. Lab name
1 104 Australian Institute of Marine Science, Australia
2 27 Bundesamt für Seeschifffahrt und Hydrographie (BSH), Laboratorium Sülldorf, Germany
3 65 Hawaii Ocean Time-series, USA
4 29 Marine Research Institute, Iceland
5 64 University of Hawaii, SOEST Laboratory for Analytical Biogeochemistry (S-LAB), USA
6 56 Scripps Institution of Oceanography, USA
7 14 State Key laboratory of Marine Environmental Science, Xiamen University, China
8 35 Japan Meteorological Agency, Japan
9 49 National Oceanography Centre, Southampton, UK
10 109 Oceanographic Measurement & Instrument Calibration Service Center (OMICS)/Korea Institute of Ocean Science & Technology, Republic of Korea
11 86 Istituto Nazionale di Oceanografia e Geofisica Sperimentale, Italy
12 101 Marine Environment Research Division, National Institute of Fisheries Science, Republic of Korea
13 102 Stazione Zoologica Anton Dohrn, Italy
14 96 Department of Fisheries and Oceans Canada, Institute of Ocean Sciences, Canada
15 5 OD NATURE – ECOCHEM, Belgium
16 8 Institute of Biology, Rio de Janeiro Federal University, Brazil
17 51 Marine Scotland - Science, UK
18 92 Station Biologique de Roscoff, Centre national de la recherche scientifique (CNRS) / Université Pierre et Marie Curie, France

IOCCP-JAMSTEC 2015 Inter calibration exercise
5
This page left intentionally blank
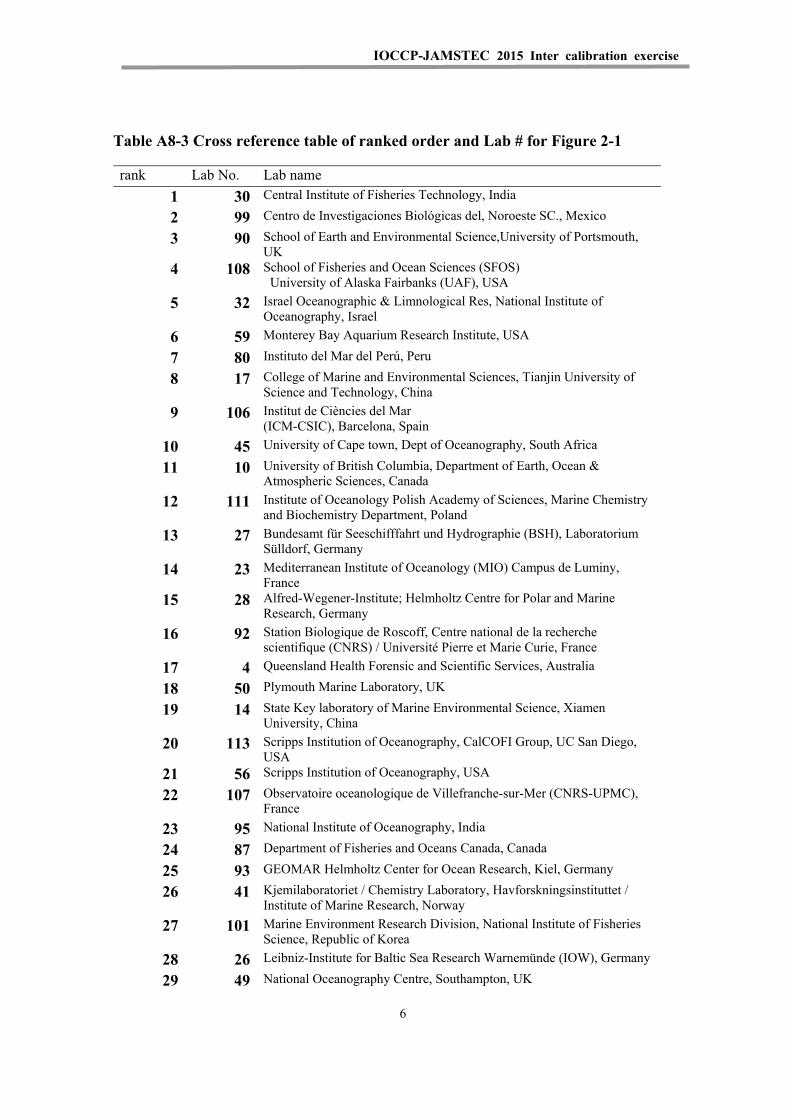
IOCCP-JAMSTEC 2015 Inter calibration exercise
6
Table A8-3 Cross reference table of ranked order and Lab # for Figure 2-1
rank Lab No. Lab name
1 30 Central Institute of Fisheries Technology, India
2 99 Centro de Investigaciones Biológicas del, Noroeste SC., Mexico
3 90 School of Earth and Environmental Science,University of Portsmouth, UK
4 108 School of Fisheries and Ocean Sciences (SFOS) University of Alaska Fairbanks (UAF), USA
5 32 Israel Oceanographic & Limnological Res, National Institute of Oceanography, Israel
6 59 Monterey Bay Aquarium Research Institute, USA
7 80 Instituto del Mar del Perú, Peru
8 17 College of Marine and Environmental Sciences, Tianjin University of Science and Technology, China
9 106 Institut de Ciències del Mar (ICM-CSIC), Barcelona, Spain
10 45 University of Cape town, Dept of Oceanography, South Africa
11 10 University of British Columbia, Department of Earth, Ocean & Atmospheric Sciences, Canada
12 111 Institute of Oceanology Polish Academy of Sciences, Marine Chemistry and Biochemistry Department, Poland
13 27 Bundesamt für Seeschifffahrt und Hydrographie (BSH), Laboratorium Sülldorf, Germany
14 23 Mediterranean Institute of Oceanology (MIO) Campus de Luminy, France
15 28 Alfred-Wegener-Institute; Helmholtz Centre for Polar and Marine Research, Germany
16 92 Station Biologique de Roscoff, Centre national de la recherche scientifique (CNRS) / Université Pierre et Marie Curie, France
17 4 Queensland Health Forensic and Scientific Services, Australia
18 50 Plymouth Marine Laboratory, UK
19 14 State Key laboratory of Marine Environmental Science, Xiamen University, China
20 113 Scripps Institution of Oceanography, CalCOFI Group, UC San Diego, USA
21 56 Scripps Institution of Oceanography, USA
22 107 Observatoire oceanologique de Villefranche-sur-Mer (CNRS-UPMC), France
23 95 National Institute of Oceanography, India
24 87 Department of Fisheries and Oceans Canada, Canada
25 93 GEOMAR Helmholtz Center for Ocean Research, Kiel, Germany
26 41 Kjemilaboratoriet / Chemistry Laboratory, Havforskningsinstituttet / Institute of Marine Research, Norway
27 101 Marine Environment Research Division, National Institute of Fisheries Science, Republic of Korea
28 26 Leibniz-Institute for Baltic Sea Research Warnemünde (IOW), Germany
29 49 National Oceanography Centre, Southampton, UK
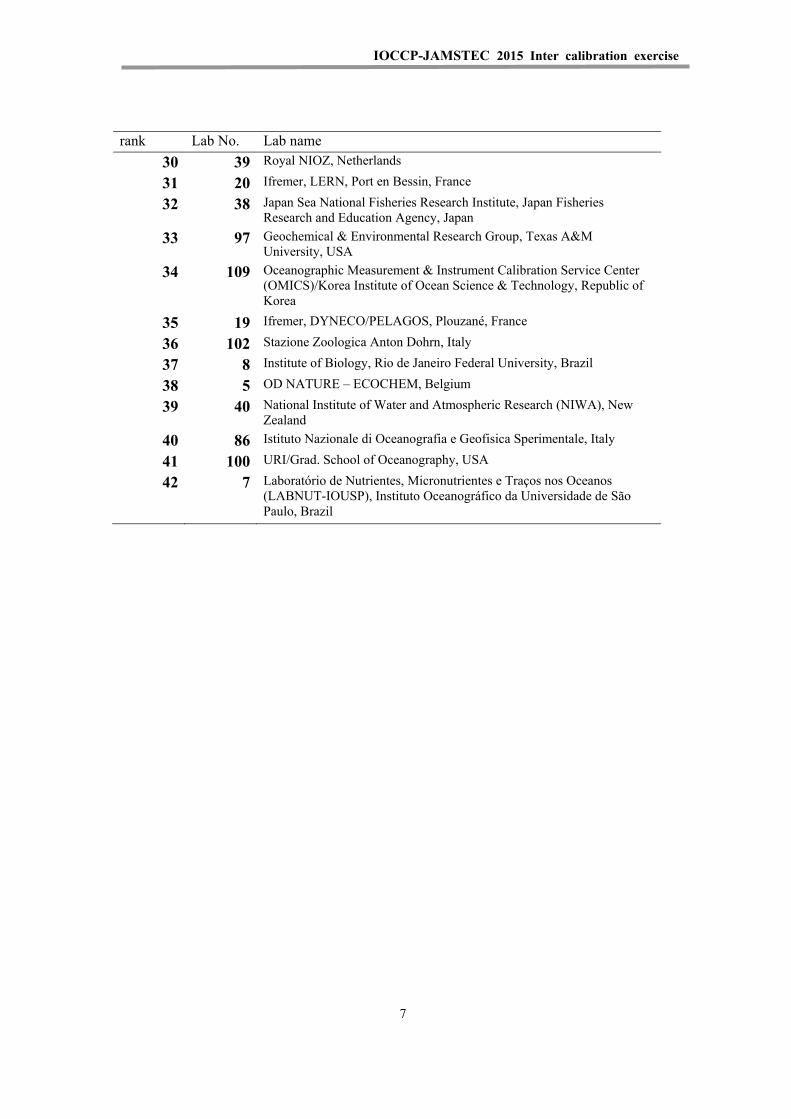
IOCCP-JAMSTEC 2015 Inter calibration exercise
7
rank Lab No. Lab name
30 39 Royal NIOZ, Netherlands
31 20 Ifremer, LERN, Port en Bessin, France
32 38 Japan Sea National Fisheries Research Institute, Japan Fisheries Research and Education Agency, Japan
33 97 Geochemical & Environmental Research Group, Texas A&M University, USA
34 109 Oceanographic Measurement & Instrument Calibration Service Center (OMICS)/Korea Institute of Ocean Science & Technology, Republic of Korea
35 19 Ifremer, DYNECO/PELAGOS, Plouzané, France
36 102 Stazione Zoologica Anton Dohrn, Italy
37 8 Institute of Biology, Rio de Janeiro Federal University, Brazil
38 5 OD NATURE – ECOCHEM, Belgium
39 40 National Institute of Water and Atmospheric Research (NIWA), New Zealand
40 86 Istituto Nazionale di Oceanografia e Geofisica Sperimentale, Italy
41 100 URI/Grad. School of Oceanography, USA
42 7 Laboratório de Nutrientes, Micronutrientes e Traços nos Oceanos (LABNUT-IOUSP), Instituto Oceanográfico da Universidade de São Paulo, Brazil

IOCCP-JAMSTEC 2015 Inter calibration exercise
8
Table A8-4 Cross reference table of ranked order and Lab # for Figure 2-2
rank Lab No. Lab name
1 27 Bundesamt für Seeschifffahrt und Hydrographie (BSH), Laboratorium Sülldorf, Germany
2 56 Scripps Institution of Oceanography, USA
3 14 State Key laboratory of Marine Environmental Science, Xiamen University, China
4 49 National Oceanography Centre, Southampton, UK
5 109 Oceanographic Measurement & Instrument Calibration Service Center (OMICS)/Korea Institute of Ocean Science & Technology, Republic of Korea
6 86 Istituto Nazionale di Oceanografia e Geofisica Sperimentale, Italy
7 101 Marine Environment Research Division, National Institute of Fisheries Science, Republic of Korea
8 102 Stazione Zoologica Anton Dohrn, Italy
9 5 OD NATURE – ECOCHEM, Belgium
10 8 Institute of Biology, Rio de Janeiro Federal University, Brazil
11 92 Station Biologique de Roscoff, Centre national de la recherche scientifique (CNRS) / Université Pierre et Marie Curie, France

IOCCP-JAMSTEC 2015 Inter calibration exercise
9
This page left intentionally blank

IOCCP-JAMSTEC 2015 Inter calibration exercise
10
Table A8-5 Cross reference table of ranked order and Lab # for Figure 3-1
rank Lab No. Lab name
1 90 School of Earth and Environmental Science,University of Portsmouth, UK
2 17 College of Marine and Environmental Sciences, Tianjin University of Science and Technology, China
3 49 National Oceanography Centre, Southampton, UK
4 107 Observatoire oceanologique de Villefranche-sur-Mer (CNRS-UPMC), France
5 10 University of British Columbia, Department of Earth, Ocean & Atmospheric Sciences, Canada
6 28 Alfred-Wegener-Institute; Helmholtz Centre for Polar and Marine Research, Germany
7 80 Instituto del Mar del Perú, Peru
8 104 Australian Institute of Marine Science, Australia
9 106 Institut de Ciències del Mar (ICM-CSIC), Barcelona, Spain
10 111 Institute of Oceanology Polish Academy of Sciences, Marine Chemistry and Biochemistry Department, Poland
11 14 State Key laboratory of Marine Environmental Science, Xiamen University, China
12 23 Mediterranean Institute of Oceanology (MIO) Campus de Luminy, France
13 27 Bundesamt für Seeschifffahrt und Hydrographie (BSH), Laboratorium Sülldorf, Germany
14 29 Marine Research Institute, Iceland
15 50 Plymouth Marine Laboratory, UK
16 59 Monterey Bay Aquarium Research Institute, USA
17 87 Department of Fisheries and Oceans Canada, Canada
18 101 Marine Environment Research Division, National Institute of Fisheries Science, Republic of Korea
19 102 Stazione Zoologica Anton Dohrn, Italy
20 112 R/V INVESTIGATOR, CSIRO Marine and Atmospheric Research, Australia
21 4 Queensland Health Forensic and Scientific Services, Australia
22 5 OD NATURE – ECOCHEM, Belgium
23 19 Ifremer, DYNECO/PELAGOS, Plouzané, France
24 20 Ifremer, LERN, Port en Bessin, France
25 35 Japan Meteorological Agency, Japan
26 38 Japan Sea National Fisheries Research Institute, Japan Fisheries Research and Education Agency, Japan
27 39 Royal NIOZ, Netherlands
28 40 National Institute of Water and Atmospheric Research (NIWA), New Zealand
29 56 Scripps Institution of Oceanography, USA
30 86 Istituto Nazionale di Oceanografia e Geofisica Sperimentale, Italy

IOCCP-JAMSTEC 2015 Inter calibration exercise
11
rank Lab No. Lab name
31 92 Station Biologique de Roscoff, Centre national de la recherche scientifique (CNRS) / Université Pierre et Marie Curie, France
32 113 Scripps Institution of Oceanography, CalCOFI Group, UC San Diego, USA
33 8 Institute of Biology, Rio de Janeiro Federal University, Brazil
34 41 Kjemilaboratoriet / Chemistry Laboratory, Havforskningsinstituttet / Institute of Marine Research, Norway
35 93 GEOMAR Helmholtz Center for Ocean Research, Kiel, Germany
36 95 National Institute of Oceanography, India
37 109 Oceanographic Measurement & Instrument Calibration Service Center (OMICS)/Korea Institute of Ocean Science & Technology, Republic of Korea
38 45 University of Cape town, Dept of Oceanography, South Africa
39 97 Geochemical & Environmental Research Group, Texas A&M University, USA
40 26 Leibniz-Institute for Baltic Sea Research Warnemünde (IOW), Germany
41 30 Central Institute of Fisheries Technology, India
42 89 Scottish Environment Protection Agency, UK
43 99 Centro de Investigaciones Biológicas del, Noroeste SC., Mexico
44 7 Laboratório de Nutrientes, Micronutrientes e Traços nos Oceanos (LABNUT-IOUSP), Instituto Oceanográfico da Universidade de São Paulo, Brazil
45 100 URI/Grad. School of Oceanography, USA
46 108 School of Fisheries and Ocean Sciences (SFOS) University of Alaska Fairbanks (UAF), USA
47 51 Marine Scotland - Science, UK

IOCCP-JAMSTEC 2015 Inter calibration exercise
12
Table A8-6 Cross reference table of ranked order and Lab # for Figure 3-2
rank Lab No. Lab name
1 86 Istituto Nazionale di Oceanografia e Geofisica Sperimentale, Italy
2 104 Australian Institute of Marine Science, Australia
3 49 National Oceanography Centre, Southampton, UK
4 27 Bundesamt für Seeschifffahrt und Hydrographie (BSH), Laboratorium Sülldorf, Germany
5 5 OD NATURE – ECOCHEM, Belgium
6 92 Station Biologique de Roscoff, Centre national de la recherche scientifique (CNRS) / Université Pierre et Marie Curie, France
7 14 State Key laboratory of Marine Environmental Science, Xiamen University, China
8 35 Japan Meteorological Agency, Japan
9 109 Oceanographic Measurement & Instrument Calibration Service Center (OMICS)/Korea Institute of Ocean Science & Technology, Republic of Korea
10 8 Institute of Biology, Rio de Janeiro Federal University, Brazil
11 51 Marine Scotland - Science, UK
12 56 Scripps Institution of Oceanography, USA
13 101 Marine Environment Research Division, National Institute of Fisheries Science, Republic of Korea
14 29 Marine Research Institute, Iceland
15 102 Stazione Zoologica Anton Dohrn, Italy

IOCCP-JAMSTEC 2015 Inter calibration exercise
13
This page left intentionally blank

IOCCP-JAMSTEC 2015 Inter calibration exercise
14
Table A8-7 Cross reference table of ranked order and Lab # for Figure 4-1
rank Lab No. Lab name
1 7 Laboratório de Nutrientes, Micronutrientes e Traços nos Oceanos (LABNUT-IOUSP), Instituto Oceanográfico da Universidade de São Paulo, Brazil
2 95 National Institute of Oceanography, India
3 28 Alfred-Wegener-Institute; Helmholtz Centre for Polar and Marine Research, Germany
4 30 Central Institute of Fisheries Technology, India
5 102 Stazione Zoologica Anton Dohrn, Italy
6 51 Marine Scotland - Science, UK
7 17 College of Marine and Environmental Sciences, Tianjin University of Science and Technology, China
8 27 Bundesamt für Seeschifffahrt und Hydrographie (BSH), Laboratorium Sülldorf, Germany
9 8 Institute of Biology, Rio de Janeiro Federal University, Brazil
10 80 Instituto del Mar del Perú, Peru
11 106 Institut de Ciències del Mar (ICM-CSIC), Barcelona, Spain
12 107 Observatoire oceanologique de Villefranche-sur-Mer (CNRS-UPMC), France
13 97 Geochemical & Environmental Research Group, Texas A&M University, USA
14 10 University of British Columbia, Department of Earth, Ocean & Atmospheric Sciences, Canada
15 38 Japan Sea National Fisheries Research Institute, Japan Fisheries Research and Education Agency, Japan
16 56 Scripps Institution of Oceanography, USA
17 86 Istituto Nazionale di Oceanografia e Geofisica Sperimentale, Italy
18 113 Scripps Institution of Oceanography, CalCOFI Group, UC San Diego, USA
19 65 Hawaii Ocean Time-series, USA
20 26 Leibniz-Institute for Baltic Sea Research Warnemünde (IOW), Germany
21 57 NOAA Atlantic Oceanographic and Meteorological Laboratory (AOML), Miami, Florida, USA
22 96 Department of Fisheries and Oceans Canada, Institute of Ocean Sciences, Canada
23 111 Institute of Oceanology Polish Academy of Sciences, Marine Chemistry and Biochemistry Department, Poland
24 35 Japan Meteorological Agency, Japan
25 19 Ifremer, DYNECO/PELAGOS, Plouzané, France
26 52 Department of Earth, Ocean and Ecological Sciences, SOES, University of Liverpool, UK
27 92 Station Biologique de Roscoff, Centre national de la recherche scientifique (CNRS) / Université Pierre et Marie Curie, France
28 23 Mediterranean Institute of Oceanology (MIO) Campus de Luminy, France
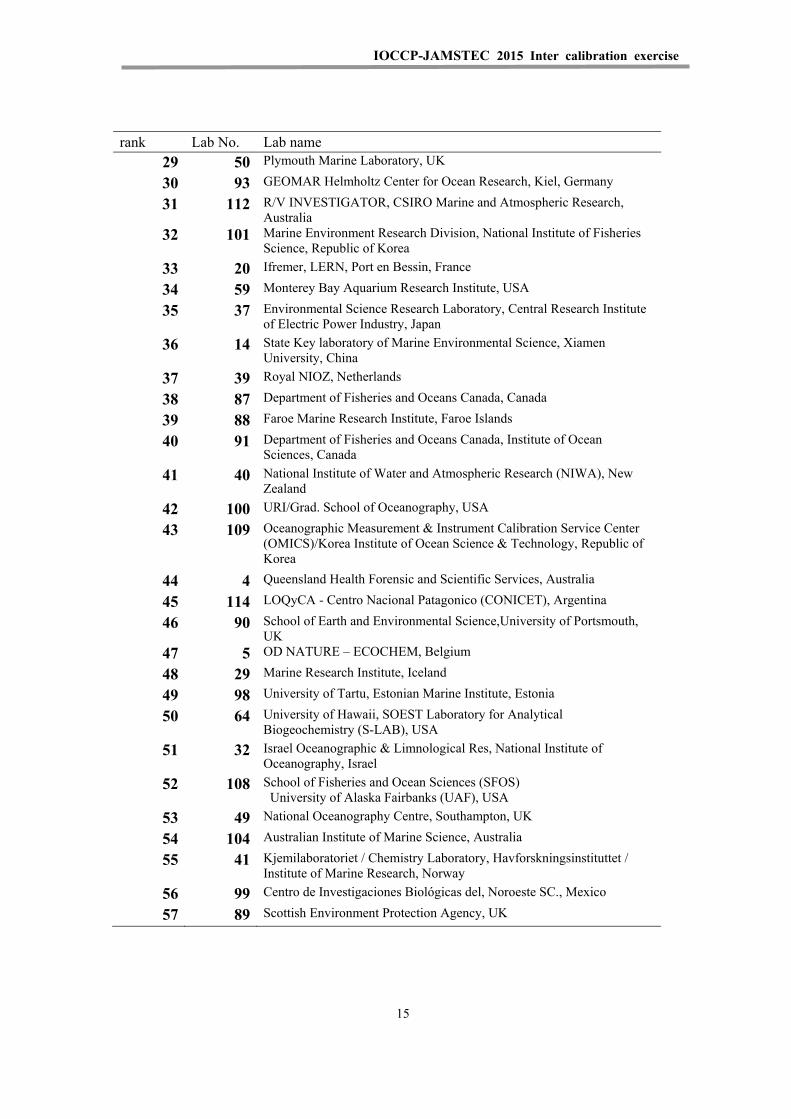
IOCCP-JAMSTEC 2015 Inter calibration exercise
15
rank Lab No. Lab name
29 50 Plymouth Marine Laboratory, UK
30 93 GEOMAR Helmholtz Center for Ocean Research, Kiel, Germany
31 112 R/V INVESTIGATOR, CSIRO Marine and Atmospheric Research, Australia
32 101 Marine Environment Research Division, National Institute of Fisheries Science, Republic of Korea
33 20 Ifremer, LERN, Port en Bessin, France
34 59 Monterey Bay Aquarium Research Institute, USA
35 37 Environmental Science Research Laboratory, Central Research Institute of Electric Power Industry, Japan
36 14 State Key laboratory of Marine Environmental Science, Xiamen University, China
37 39 Royal NIOZ, Netherlands
38 87 Department of Fisheries and Oceans Canada, Canada
39 88 Faroe Marine Research Institute, Faroe Islands
40 91 Department of Fisheries and Oceans Canada, Institute of Ocean Sciences, Canada
41 40 National Institute of Water and Atmospheric Research (NIWA), New Zealand
42 100 URI/Grad. School of Oceanography, USA
43 109 Oceanographic Measurement & Instrument Calibration Service Center (OMICS)/Korea Institute of Ocean Science & Technology, Republic of Korea
44 4 Queensland Health Forensic and Scientific Services, Australia
45 114 LOQyCA - Centro Nacional Patagonico (CONICET), Argentina
46 90 School of Earth and Environmental Science,University of Portsmouth, UK
47 5 OD NATURE – ECOCHEM, Belgium
48 29 Marine Research Institute, Iceland
49 98 University of Tartu, Estonian Marine Institute, Estonia
50 64 University of Hawaii, SOEST Laboratory for Analytical Biogeochemistry (S-LAB), USA
51 32 Israel Oceanographic & Limnological Res, National Institute of Oceanography, Israel
52 108 School of Fisheries and Ocean Sciences (SFOS) University of Alaska Fairbanks (UAF), USA
53 49 National Oceanography Centre, Southampton, UK
54 104 Australian Institute of Marine Science, Australia
55 41 Kjemilaboratoriet / Chemistry Laboratory, Havforskningsinstituttet / Institute of Marine Research, Norway
56 99 Centro de Investigaciones Biológicas del, Noroeste SC., Mexico
57 89 Scottish Environment Protection Agency, UK
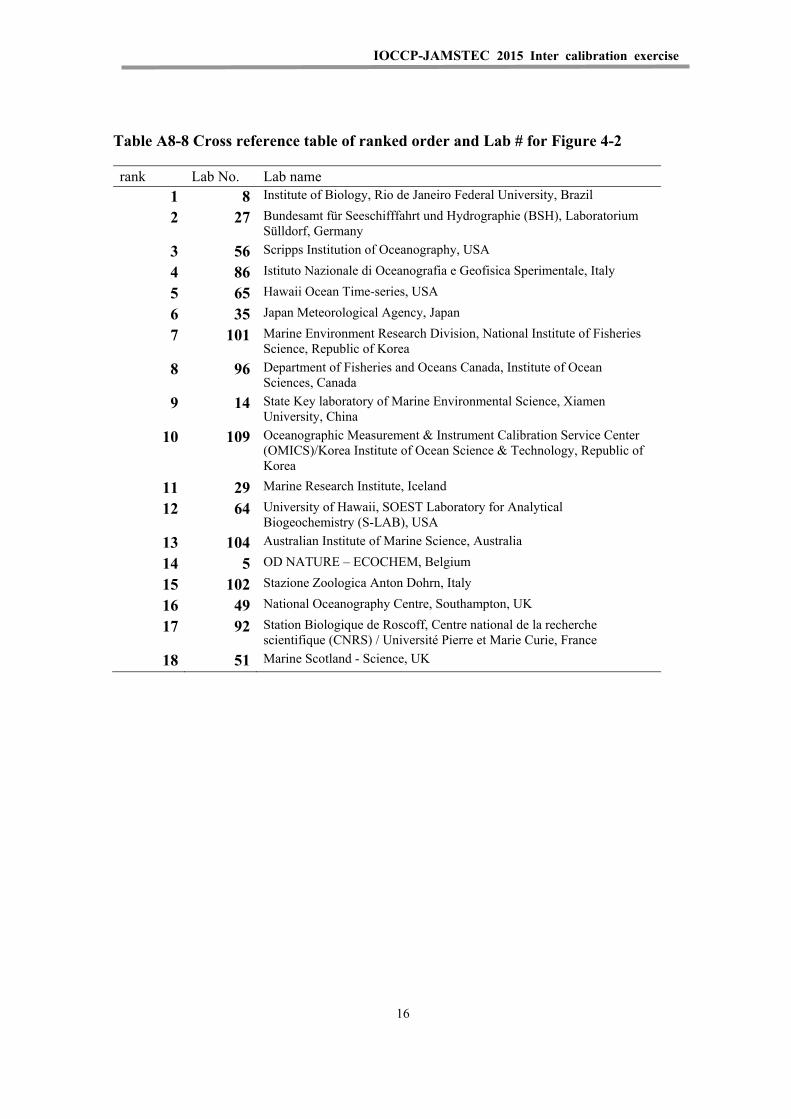
IOCCP-JAMSTEC 2015 Inter calibration exercise
16
Table A8-8 Cross reference table of ranked order and Lab # for Figure 4-2
rank Lab No. Lab name
1 8 Institute of Biology, Rio de Janeiro Federal University, Brazil
2 27 Bundesamt für Seeschifffahrt und Hydrographie (BSH), Laboratorium Sülldorf, Germany
3 56 Scripps Institution of Oceanography, USA
4 86 Istituto Nazionale di Oceanografia e Geofisica Sperimentale, Italy
5 65 Hawaii Ocean Time-series, USA
6 35 Japan Meteorological Agency, Japan
7 101 Marine Environment Research Division, National Institute of Fisheries Science, Republic of Korea
8 96 Department of Fisheries and Oceans Canada, Institute of Ocean Sciences, Canada
9 14 State Key laboratory of Marine Environmental Science, Xiamen University, China
10 109 Oceanographic Measurement & Instrument Calibration Service Center (OMICS)/Korea Institute of Ocean Science & Technology, Republic of Korea
11 29 Marine Research Institute, Iceland
12 64 University of Hawaii, SOEST Laboratory for Analytical Biogeochemistry (S-LAB), USA
13 104 Australian Institute of Marine Science, Australia
14 5 OD NATURE – ECOCHEM, Belgium
15 102 Stazione Zoologica Anton Dohrn, Italy
16 49 National Oceanography Centre, Southampton, UK
17 92 Station Biologique de Roscoff, Centre national de la recherche scientifique (CNRS) / Université Pierre et Marie Curie, France
18 51 Marine Scotland - Science, UK

IOCCP-JAMSTEC 2015 Inter calibration exercise
17
This page left intentionally blank

IOCCP-JAMSTEC 2015 Inter calibration exercise
18
Table A8-9 Cross reference table of ranked order and Lab # for Figure 5-1
rank Lab No. Lab name
1 114 LOQyCA - Centro Nacional Patagonico (CONICET), Argentina
2 17 College of Marine and Environmental Sciences, Tianjin University of Science and Technology, China
3 8 Institute of Biology, Rio de Janeiro Federal University, Brazil
4 106 Institut de Ciències del Mar (ICM-CSIC), Barcelona, Spain
5 108 School of Fisheries and Ocean Sciences (SFOS) University of Alaska Fairbanks (UAF), USA
6 98 University of Tartu, Estonian Marine Institute, Estonia
7 49 National Oceanography Centre, Southampton, UK
8 80 Instituto del Mar del Perú, Peru
9 99 Centro de Investigaciones Biológicas del, Noroeste SC., Mexico
10 23 Mediterranean Institute of Oceanology (MIO) Campus de Luminy, France
11 101 Marine Environment Research Division, National Institute of Fisheries Science, Republic of Korea
12 38 Japan Sea National Fisheries Research Institute, Japan Fisheries Research and Education Agency, Japan
13 95 National Institute of Oceanography, India
14 111 Institute of Oceanology Polish Academy of Sciences, Marine Chemistry and Biochemistry Department, Poland
15 93 GEOMAR Helmholtz Center for Ocean Research, Kiel, Germany
16 41 Kjemilaboratoriet / Chemistry Laboratory, Havforskningsinstituttet / Institute of Marine Research, Norway
17 35 Japan Meteorological Agency, Japan
18 29 Marine Research Institute, Iceland
19 7 Laboratório de Nutrientes, Micronutrientes e Traços nos Oceanos (LABNUT-IOUSP), Instituto Oceanográfico da Universidade de São Paulo, Brazil
20 89 Scottish Environment Protection Agency, UK
21 87 Department of Fisheries and Oceans Canada, Canada
22 65 Hawaii Ocean Time-series, USA
23 59 Monterey Bay Aquarium Research Institute, USA
24 57 NOAA Atlantic Oceanographic and Meteorological Laboratory (AOML), Miami, Florida, USA
25 96 Department of Fisheries and Oceans Canada, Institute of Ocean Sciences, Canada
26 90 School of Earth and Environmental Science,University of Portsmouth, UK
27 5 OD NATURE – ECOCHEM, Belgium
28 102 Stazione Zoologica Anton Dohrn, Italy
29 52 Department of Earth, Ocean and Ecological Sciences, SOES, University of Liverpool, UK
30 107 Observatoire oceanologique de Villefranche-sur-Mer (CNRS-UPMC), France

IOCCP-JAMSTEC 2015 Inter calibration exercise
19
rank Lab No. Lab name
31 92 Station Biologique de Roscoff, Centre national de la recherche scientifique (CNRS) / Université Pierre et Marie Curie, France
32 14 State Key laboratory of Marine Environmental Science, Xiamen University, China
33 100 URI/Grad. School of Oceanography, USA
34 28 Alfred-Wegener-Institute; Helmholtz Centre for Polar and Marine Research, Germany
35 39 Royal NIOZ, Netherlands
36 56 Scripps Institution of Oceanography, USA
37 64 University of Hawaii, SOEST Laboratory for Analytical Biogeochemistry (S-LAB), USA
38 112 R/V INVESTIGATOR, CSIRO Marine and Atmospheric Research, Australia
39 86 Istituto Nazionale di Oceanografia e Geofisica Sperimentale, Italy
40 113 Scripps Institution of Oceanography, CalCOFI Group, UC San Diego, USA
41 91 Department of Fisheries and Oceans Canada, Institute of Ocean Sciences, Canada
42 50 Plymouth Marine Laboratory, UK
43 20 Ifremer, LERN, Port en Bessin, France
44 19 Ifremer, DYNECO/PELAGOS, Plouzané, France
45 109 Oceanographic Measurement & Instrument Calibration Service Center (OMICS)/Korea Institute of Ocean Science & Technology, Republic of Korea
46 27 Bundesamt für Seeschifffahrt und Hydrographie (BSH), Laboratorium Sülldorf, Germany
47 26 Leibniz-Institute for Baltic Sea Research Warnemünde (IOW), Germany
48 104 Australian Institute of Marine Science, Australia
49 88 Faroe Marine Research Institute, Faroe Islands
50 10 University of British Columbia, Department of Earth, Ocean & Atmospheric Sciences, Canada
51 32 Israel Oceanographic & Limnological Res, National Institute of Oceanography, Israel
52 51 Marine Scotland - Science, UK
53 4 Queensland Health Forensic and Scientific Services, Australia
54 97 Geochemical & Environmental Research Group, Texas A&M University, USA
55 40 National Institute of Water and Atmospheric Research (NIWA), New Zealand
56 30 Central Institute of Fisheries Technology, India
57 45 University of Cape town, Dept of Oceanography, South Africa

IOCCP-JAMSTEC 2015 Inter calibration exercise
20
Table A8-10 Cross reference table of ranked order and Lab # for Figure 5-2
rank Lab No. Lab name
1 5 OD NATURE – ECOCHEM, Belgium
2 8 Institute of Biology, Rio de Janeiro Federal University, Brazil
3 49 National Oceanography Centre, Southampton, UK
4 101 Marine Environment Research Division, National Institute of Fisheries Science, Republic of Korea
5 29 Marine Research Institute, Iceland
6 35 Japan Meteorological Agency, Japan
7 86 Istituto Nazionale di Oceanografia e Geofisica Sperimentale, Italy
8 65 Hawaii Ocean Time-series, USA
9 56 Scripps Institution of Oceanography, USA
10 96 Department of Fisheries and Oceans Canada, Institute of Ocean Sciences, Canada
11 14 State Key laboratory of Marine Environmental Science, Xiamen University, China
12 102 Stazione Zoologica Anton Dohrn, Italy
13 64 University of Hawaii, SOEST Laboratory for Analytical Biogeochemistry (S-LAB), USA
14 104 Australian Institute of Marine Science, Australia
15 109 Oceanographic Measurement & Instrument Calibration Service Center (OMICS)/Korea Institute of Ocean Science & Technology, Republic of Korea
16 27 Bundesamt für Seeschifffahrt und Hydrographie (BSH), Laboratorium Sülldorf, Germany
17 51 Marine Scotland - Science, UK
18 92 Station Biologique de Roscoff, Centre national de la recherche scientifique (CNRS) / Université Pierre et Marie Curie, France

IOCCP-JAMSTEC 2015 Inter calibration exercise
1
Appendix IV
Invitation letter to 2015 I/C exercise

IOCCP-JAMSTEC 2015 Inter calibration exercise
2
Dummy

IOCCP-JAMSTEC 2015 Inter calibration exercise
3
24 October 2014 Dear Colleague,
The International Ocean Carbon Coordination Project (IOCCP) and Japan Agency for Marine-Earth Science and Technology (JAMATEC) are pleased to invite you to participate in the 4th International Inter-Calibration Exercise, the “2014 inter-laboratory comparison study of Certified Reference Material of Nutrients in Seawater and Reference Material of Nutrients in Seawater (CRM & RMNS)”.
This “2014 Inter-comparison study of Certified Reference Material of Nutrients in
Seawater and Reference Material of Nutrients in Seawater (CRM & RMNS)” is planned to test the global comparability of nutrient measurements and to promote the use of CRM/RM of nutrients in seawater. As with the previous four inter-comparison studies organized by MRI-JMA, the aim is also to improve the level of comparability by exchange of knowledge between participating laboratories. Therefore, if you join this inter-comparison study, you will be asked to report (1) the concentrations of nutrients in the samples we send you and (2) details of analytical methods you used. The scale of the study has been expanded and a total of 85 laboratories are receiving this invitation across five continents. You can consult the reports from previous inter-laboratory comparison studies of Reference Material of Nutrients in Seawater (RMNS) conducted in 2006, 2008 and 2012 at the MRI’s web site: http://www.mri-jma.go.jp/Dep/oc/oc_3/RMNScomp2012/RMNScomp2012.html (2012) http://www.mri-jma.go.jp/Publish/Technical/DATA/VOL_60/60_en.html (2008) http://www.mri-jma.go.jp/Publish/Technical/DATA/VOL_58/58_en.html (2006) A chapter of the GO-SHIP manual on nutrient methods entitled Recommendations for the Determination of Nutrients in Seawater to High Levels of Precision and Inter-Comparability using Continuous Flow Analyzers (Hydes et al., 2010) produced following the 2012 inter-comparison is available from the GO-SHIP website at http://www.go-ship.org/HydroMan.html Please use the attached reply form to confirm your participation. Take note of the following timetable and important points: 1. Your acceptance must be received by 30 November 2014. 2. We will acknowledge receipt of your reply and send out a list of the participants by
15 December 2014. If you do not receive an acknowledgement by 15 December 2014, please contact us.
3. A positive reply to us confirms: (1) your wish to participate in this inter-comparison study and (2) your ability to meet the reporting deadline of 28 February 2015.
4. You will receive four samples of RMNS free of charge from experiment organizers. If you want to analyze three levels of CRMs distributed by NMIJ, Japan or/and MOOS-3 by NRC, Canada, you will need to pay for them. A cost per bottle is about JPY 22,000 (roughly 200 USD). Credit card or bank transfer will be accepted

IOCCP-JAMSTEC 2015 Inter calibration exercise
4
methods of payment. We realize that the cost of CRMs might be substantial for some laboratories but for the benefit of the final results we would like to strongly encourage all participants to analyze the CRMs. Details of the payment will be sent separately when you order CRMs.
5. We expect to receive data on concentrations for nitrate, nitrite, phosphate and silicate from all participants.
6. We also welcome data for concentrations of ammonia and dissolved organic nitrogen and phosphorus from labs able to perform such analyses.
7. All resulting data reports will fully acknowledge the contribution of each participant. 8. The data set will be archived at CDIAC and will receive a digital object identifier
number (doi). Best regards, Prof. Michio AOYAMA, Dr. Principal Research Scientist, RCGC - JAMSTEC Professor, Institute of Environmental Radioactivity, Fukushima University, Japan IOCCP Scientific Steering Group Expert for Nutrients (www.ioccp.org/nutrients) Tel: +81-24-504-2882 E-mail: [email protected]

IOCCP-JAMSTEC 2015 Inter calibration exercise
5
2014 Inter-comparison study of Reference Material of Nutrients (RMNS) in seawater
Important Dates
Deadline for Reply: 30 November 2014
List of Participants: 15 December 2014
Samples Shipped by: Mid-December 2014
Reporting Deadline: 28 February 2015
Expected Draft of Inter-comparison Summary: 30 June 2015
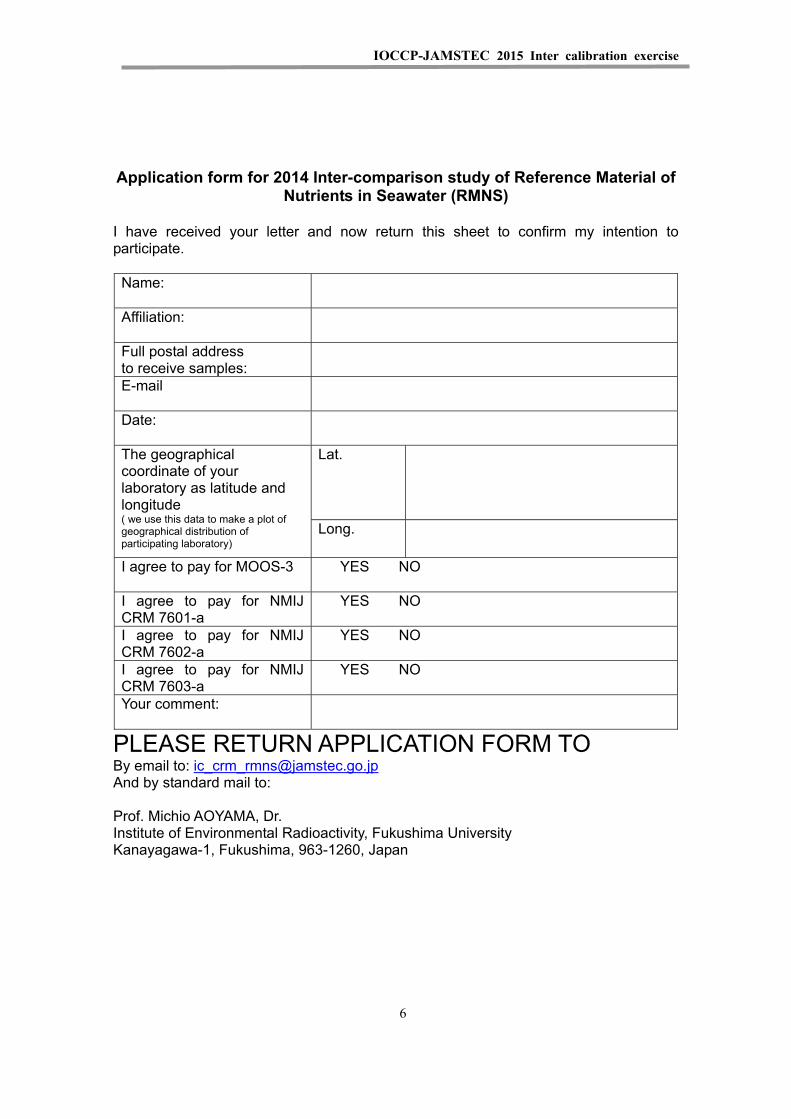
IOCCP-JAMSTEC 2015 Inter calibration exercise
6
Application form for 2014 Inter-comparison study of Reference Material of Nutrients in Seawater (RMNS)
I have received your letter and now return this sheet to confirm my intention to participate.
Name:
Affiliation:
Full postal address to receive samples:
Date:
The geographical coordinate of your laboratory as latitude and longitude ( we use this data to make a plot of geographical distribution of participating laboratory)
Lat.
Long.
I agree to pay for MOOS-3 YES NO
I agree to pay for NMIJ CRM 7601-a
YES NO
I agree to pay for NMIJ CRM 7602-a
YES NO
I agree to pay for NMIJ CRM 7603-a
YES NO
Your comment:
PLEASE RETURN APPLICATION FORM TO By email to: [email protected] And by standard mail to: Prof. Michio AOYAMA, Dr. Institute of Environmental Radioactivity, Fukushima University Kanayagawa-1, Fukushima, 963-1260, Japan

IOCCP-JAMSTEC 2015 Inter calibration exercise
1
Appendix V
Description on KIOST Nutrient Reference Materials for Seawater (K-RMS)

IOCCP-JAMSTEC 2015 Inter calibration exercise
2
Contents
Appendix V ....................................................................................................................... 1 Description on KIOST Nutrient Reference Materials for Seawater (K-RMS) ......... 1
1. Source seawater ...................................................................................................... 52. Pasteurization ......................................................................................................... 53. Bottling .................................................................................................................... 54. Package .................................................................................................................... 55. Homogeneity ........................................................................................................... 56. Assigned value ......................................................................................................... 77. Ranked scatter-plots ............................................................................................... 88. Participants and response. ....................................................................................149. Consensus means, medians, and standard deviations ....................................... 1510. Z-score ................................................................................................................. 19

IOCCP-JAMSTEC 2015 Inter calibration exercise
3
List of Tables and Figures
Table KIOST-1 Comparison between certified value of CRM BT by KANSO and measured value by KIOST ……………………………………………………....6
Table KIOST-1-2 Homegeneity of KISOT RMs…………………………………….6
Table KIOST-1-3 Assigned values of KIOST RMs………………………………….7
Figure KIOST-1. Nitrate+Nitrite results for KIOST RMs. Laboratories are ranked in order of concentrations reported for NAF…………………………………………9
Figure KIOST-2. Nitrate results for KIOST RMs. Laboratories are ranked in order of concentrations reported for NAF…………………………………………..10
Figure KIOST-3. Nitrite results for KIOST RMs. Laboratories are ranked in order of concentrations reported for NAE…………………………………………..11
Figure KIOST-4. Phosphate results for KIOST RMs. Laboratories are ranked in order of concentrations reported for NAF…………………………………………..12
Figure KIOST-5. Silicate results for KIOST RMs. Laboratories are ranked in order of concentrations reported for NAF…………………………………………..13
Table KIOST-2. Summary of responses from participants………………………...14
Table KIOST-3. Raw and robust statistics for nutrient concentrations calculated using all reported values……………………………………………………………...15
Table KIOST-4. Consensus means, medians, and standard deviations for 4 samples…………………………………………………………………………………16
Table KIOST-5-1. Median and range of analytical precision of participating laboratories, and consensus coefficient of variation for analyses of nutrients in NAE…………………………………………………………………………………….17
Table KIOST-5-2. Median and range of analytical precision of participating laboratories, and consensus coefficient of variation for analyses of nutrients in NAG…………………..17
Table KIOST-5-3. Median and range of analytical precision of participating laboratories, and consensus coefficient of variation for analyses of nutrients in NAD…..……...………………………………………………………………………..17
Table KIOST-5-4. Median and range of analytical precision of participating laboratories, and consensus coefficient of variation for analyses of nutrients in NAF.................................................................................................................................18
IOCCP-JAMSTEC 2015 Inter calibration exercise
4
Table KIOST-6-1. Z-scores for nitrate+nitrite analyses............................................19
Table KIOST-6-2. Z-scores for nitrate analyses.........................................................20
Table KIOST-6-3. Z-scores for nitrite analyses..........................................................21
Table KIOST-6-4. Z-scores for phosphate analyses...................................................22
Table KIOST-6-5. Z-scores for silicate analyses.........................................................23
Table KIOST-6-6. Combined Z-scores for phosphate and nitrate+nitrite analyses...........................................................................................................................24
Table KIOST-6-7. Combined Z-scores for phosphate, nitrate+nitrite, and silicate analyses...........................................................................................................................25
TableKIOST-A1. List of participants..........................................................................26
Table KIOST-A2. Results reported by the participants............................................28
Table KIOST-A3. Ammonia results reported by the participants...........................34
Table KIOST-A4-1 Cross reference table of ranked order and Lab # for Figure KIOST-1.........................................................................................................................36
Table KIOST-A4-2 Cross reference table of ranked order and Lab # for Figure KIOST-2.........................................................................................................................37
Table KIOST-A4-3 Cross reference table of ranked order and Lab # for Figure KIOST-3.........................................................................................................................38
Table KIOST-A4-4 Cross reference table of ranked order and Lab # for Figure KIOST-4.........................................................................................................................39
Table KIOST-A4-5 Cross reference table of ranked order and Lab # for Figure KIOST-5.........................................................................................................................40
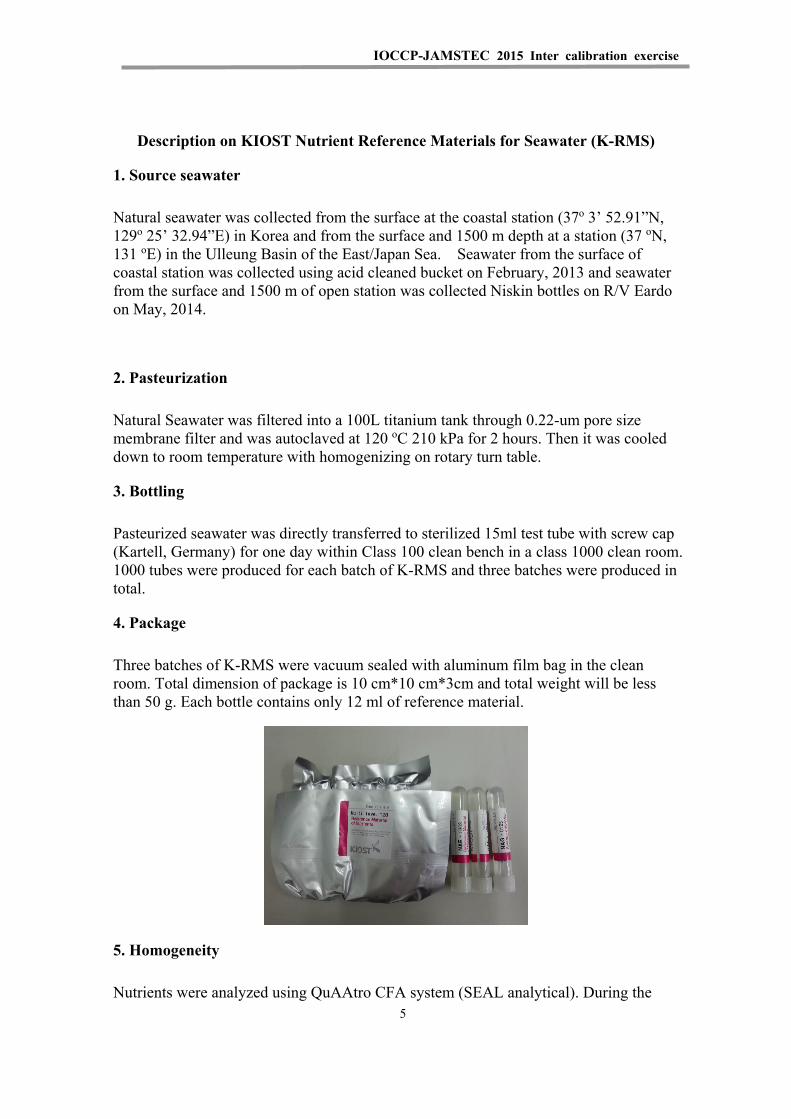
IOCCP-JAMSTEC 2015 Inter calibration exercise
5
Description on KIOST Nutrient Reference Materials for Seawater (K-RMS)
1. Source seawater
Natural seawater was collected from the surface at the coastal station (37o 3’ 52.91”N, 129o 25’ 32.94”E) in Korea and from the surface and 1500 m depth at a station (37 oN, 131 oE) in the Ulleung Basin of the East/Japan Sea. Seawater from the surface of coastal station was collected using acid cleaned bucket on February, 2013 and seawater from the surface and 1500 m of open station was collected Niskin bottles on R/V Eardo on May, 2014.
2. Pasteurization
Natural Seawater was filtered into a 100L titanium tank through 0.22-um pore size membrane filter and was autoclaved at 120 oC 210 kPa for 2 hours. Then it was cooled down to room temperature with homogenizing on rotary turn table.
3. Bottling
Pasteurized seawater was directly transferred to sterilized 15ml test tube with screw cap (Kartell, Germany) for one day within Class 100 clean bench in a class 1000 clean room. 1000 tubes were produced for each batch of K-RMS and three batches were produced in total.
4. Package
Three batches of K-RMS were vacuum sealed with aluminum film bag in the clean room. Total dimension of package is 10 cm*10 cm*3cm and total weight will be less than 50 g. Each bottle contains only 12 ml of reference material.
5. Homogeneity
Nutrients were analyzed using QuAAtro CFA system (SEAL analytical). During the
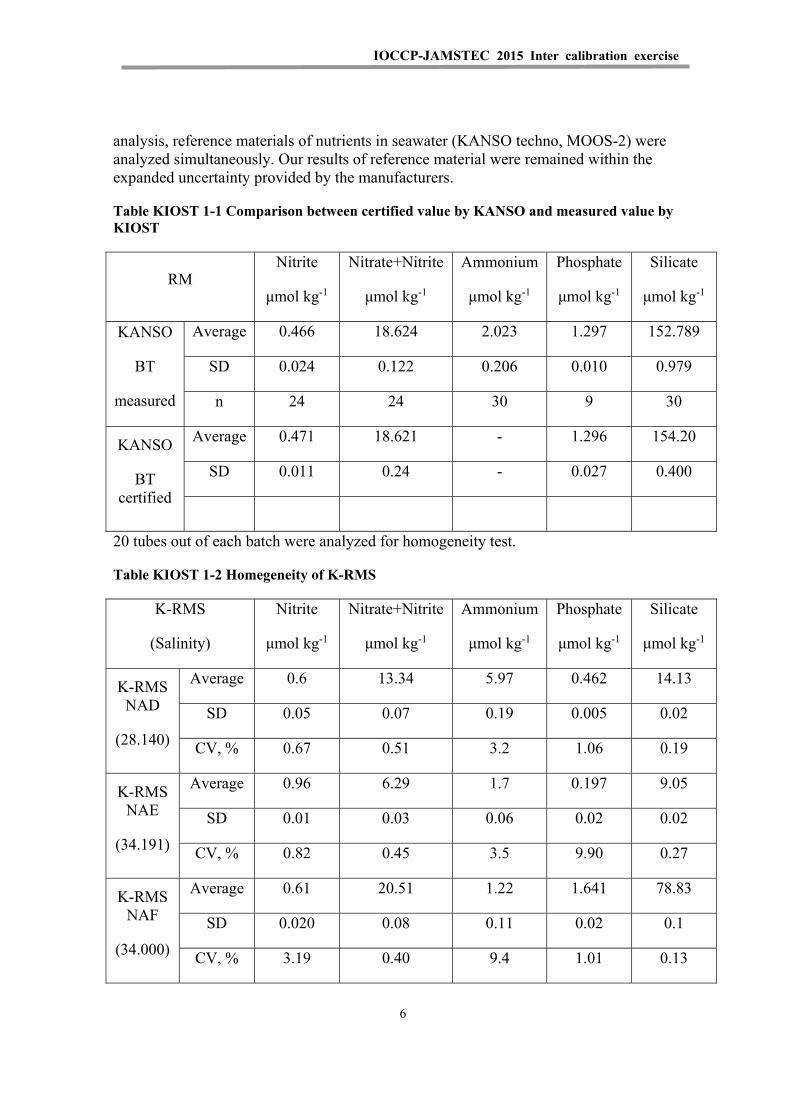
IOCCP-JAMSTEC 2015 Inter calibration exercise
6
analysis, reference materials of nutrients in seawater (KANSO techno, MOOS-2) were analyzed simultaneously. Our results of reference material were remained within the expanded uncertainty provided by the manufacturers.
Table KIOST 1-1 Comparison between certified value by KANSO and measured value by KIOST
RM Nitrite
μmol kg-1
Nitrate+Nitrite
μmol kg-1
Ammonium
μmol kg-1
Phosphate
μmol kg-1
Silicate
μmol kg-1
KANSO
BT
measured
Average 0.466 18.624 2.023 1.297 152.789
SD 0.024 0.122 0.206 0.010 0.979
n 24 24 30 9 30
KANSO
BT certified
Average 0.471 18.621 - 1.296 154.20
SD 0.011 0.24 - 0.027 0.400
20 tubes out of each batch were analyzed for homogeneity test.
Table KIOST 1-2 Homegeneity of K-RMS
K-RMS
(Salinity)
Nitrite
μmol kg-1
Nitrate+Nitrite
μmol kg-1
Ammonium
μmol kg-1
Phosphate
μmol kg-1
Silicate
μmol kg-1
K-RMS NAD
(28.140)
Average 0.6 13.34 5.97 0.462 14.13
SD 0.05 0.07 0.19 0.005 0.02
CV, % 0.67 0.51 3.2 1.06 0.19
K-RMS NAE
(34.191)
Average 0.96 6.29 1.7 0.197 9.05
SD 0.01 0.03 0.06 0.02 0.02
CV, % 0.82 0.45 3.5 9.90 0.27
K-RMS NAF
(34.000)
Average 0.61 20.51 1.22 1.641 78.83
SD 0.020 0.08 0.11 0.02 0.1
CV, % 3.19 0.40 9.4 1.01 0.13

IOCCP-JAMSTEC 2015 Inter calibration exercise
7
K-RMS NAG
(34.210)
Average 0.21 11.02 1.17 0.775 40.04
SD 0.00 0.05 0.02 0.007 0.1
CV, % 1.9 0.44 1.9 0.882 0.25
6. Assigned value
Property values of K-RMS were assigned based on 15 measurements for 3~5 months. Randomly selected K-RMS were analyzed with triplicate.
Table KIOST 1-3 Assigned values of KIOST RMS
K-RMS
(Salinity)
Nitrite
μmol kg-1
Nitrate+Nitrite
μmol kg-1
Ammonium
μmol kg-1
Phosphate
μmol kg-1
Silicate
μmol kg-1
K-RMS NAD
(28.140)
Average 0.56 13.34 5.97 0.457 14.13
SD 0.09 0.36 0.19 0.026 0.05
CV, % 10.8 2.71 3.20 5.79 0.36
K-RMS NAE
(34.191)
Average 0.96 6.27 1.7 0.208 9.02
SD 0.01 0.06 0.06 0.034 0.04
CV, % 0.919 0.935 3.51 16.4 0.43
K-RMS NAF
(34.000)
Average 0.60 20.51 1.22 1.641 78.54
SD 0.02 0.24 0.117 0.036 0.38
CV, % 3.73 1.16 9.36 2.20 0.49
K-RMS NAG
(34.210)
Average 0.19 11.02 1.17 0.787 39.95
SD 0.01 0.09 0.02 0.027 0.23
CV, % 5.02 0.809 1.92 3.47 0.57
IOCCP-JAMSTEC 2015 Inter calibration exercise
8
7. Ranked scatter-plots
Ranked scatter-plots of nitrate+nitrite, nitrate, nitrite, phosphate and silicate of four K-RMS are shown at Figure 1 to 5. For nitrate+nitrite, nitrate, phosphate and silicate, the laboratories results were sorted in order of the concentrations reported for NAF. For nitrite, the laboratories results were sorted in order of the concentrations for NAE. General trends of ranked scatter-plots of K-RMS are similar to those of KANSO

IOCCP-JAMSTEC 2015 Inter calibration exercise
9
0
10
20
30
40
50
0 5 10 15 20 25 30
Nitrate + Nitrite
KNRMS-NAD
KNRMS-NAE
KNRMS-NAF
KNRMS-NAG
Nit
rate
+ N
itri
te / m
ol k
g-1
Figure KIOST 1. Nitrate+Nitrite results for KIOST RMs. Laboratories are ranked in order of concentrations reported for NAF.

IOCCP-JAMSTEC 2015 Inter calibration exercise
10
0
5
10
15
20
25
0 5 10 15 20 25 30
Nitrate
KNRMS-NAD
KNRMS-NAE
KNRMS-NAF
KNRMS-NAG
Nit
rate
/ m
ol k
g-1
Figure KIOST 2. Nitrate results for KIOST RMs. Laboratories are ranked in order of concentrations reported for NAF.

IOCCP-JAMSTEC 2015 Inter calibration exercise
11
0
0.2
0.4
0.6
0.8
1
1.2
0 5 10 15 20 25 30
Nitrite
KNRMS-NAD
KNRMS-NAE
KNRMS-NAF
KNRMS-NAG
Nit
rite
/ m
ol k
g-1
Figure KIOST 3. Nitrite results for KIOST RMs. Laboratories are ranked in order of concentrations reported for NAE.
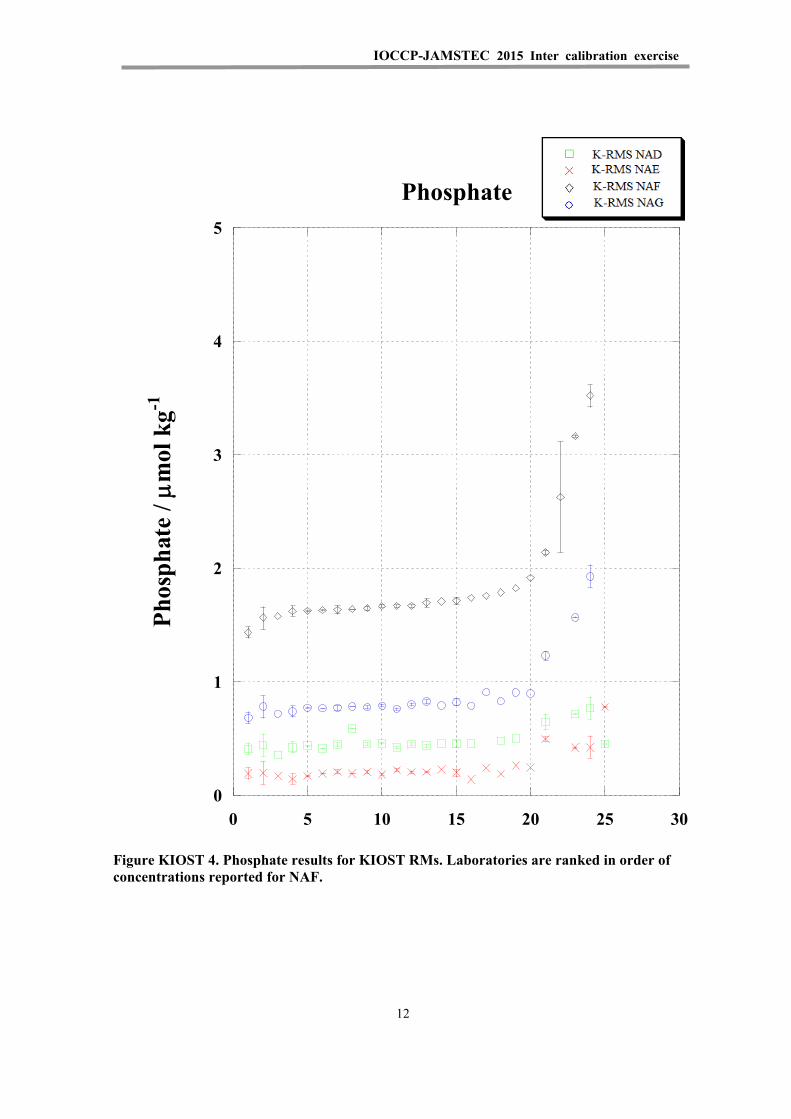
IOCCP-JAMSTEC 2015 Inter calibration exercise
12
0
1
2
3
4
5
0 5 10 15 20 25 30
Phosphate
KNRMS-NAD
KNRMS-NAE
KNRMS-NAF
KNRMS-NAG
Pho
sph
ate
/ m
ol k
g-1
Figure KIOST 4. Phosphate results for KIOST RMs. Laboratories are ranked in order of concentrations reported for NAF.
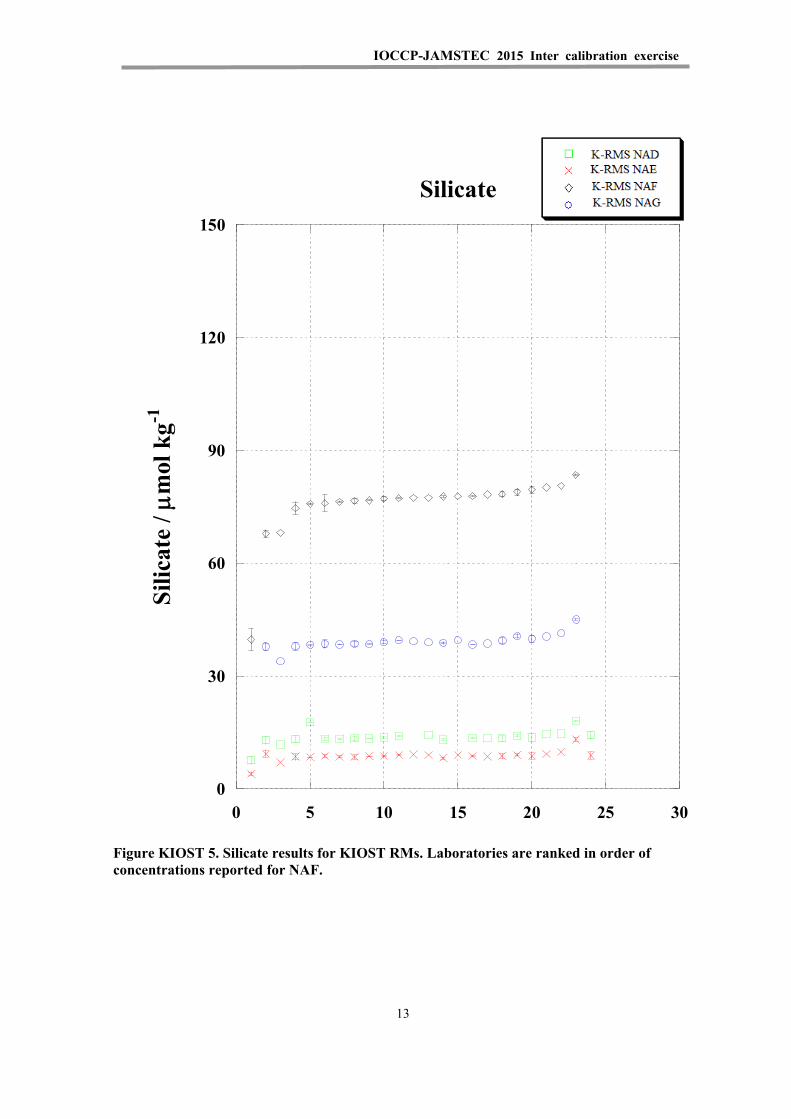
IOCCP-JAMSTEC 2015 Inter calibration exercise
13
0
30
60
90
120
150
0 5 10 15 20 25 30
Silicate
KNRMS-NAD
KNRMS-NAE
KNRMS-NAF
KNRMS-NAG
Sili
cate
/ m
ol k
g-1
Figure KIOST 5. Silicate results for KIOST RMs. Laboratories are ranked in order of concentrations reported for NAF.

IOCCP-JAMSTEC 2015 Inter calibration exercise
14
8. Participants and response During 2104 IOCCP/JAMSTEC co-organized inter-laboratory comparison study of nutrient reference material, 34 laboratories from 20 countries were voluntarily participated for the analysis of KIOST nutrient reference material (K-RMS). Results were submitted by 27 laboratories. Table KIOST-2 summarizes numbers of response from participants and participant numbers used for statistical treatment in this report.
Table KIOST 2. Summary of responses from participants.
Nutrient Sample # Number of results Nutrient Sample # Number of results
Received
Statistically
Received
Statistically
treated treated
Nitrate NAE 26 26 Phosphate NAE 26 26
+Nitrite NAG 25 25 NAG 26 26 NAD 23 23 NAD 23 23 NAF 25 25 NAF 27 27
Nitrate NAE 18 18 Silicate NAE 26 26 NAG 17 17 NAG 25 25 NAD 15 15 NAD 23 23 NAF 18 18 NAF 26 26
Nitrite NAE 24 24 Ammonia NAE 12 12 NAG 23 23 NAG 12 12 NAD 21 21 NAD 9 9
NAF 23 23 NAF 12 12

IOCCP-JAMSTEC 2015 Inter calibration exercise
15
9. Consensus means, medians, and standard deviations
The consensus means and medians for all parameters are in good agreement with the assigned values within the standard deviations.
Table KIOST 3. Raw and robust statistics for nutrient concentrations calculated using all reported values.
Nutrient Sample #
n Raw Mean
Raw Median
Raw SD Robust mean
Robust SD
μmol kg-1 μmol kg-1 μmol kg-1 μmol kg-1 μmol kg-1
Nitrate+Nitrite NAE 26 6.51 6.29 1.06 6.31 0.28NAG 25 11.23 11.16 0.35 11.22 0.35NAD 23 13.29 13.27 0.43 13.29 0.32NAF 25 20.49 20.58 0.71 20.54 0.63
Nitrate NAE 18 5.68 5.37 1.45 5.36 0.29NAG 17 11.09 10.98 0.37 11.07 0.34NAD 15 12.65 12.68 0.48 12.66 0.46NAF 18 19.96 20.01 0.77 19.98 0.55
Nitrite NAE 24 0.93 0.97 0.17 0.97 0.04NAG 23 0.21 0.20 0.04 0.20 0.02NAD 21 0.63 0.60 0.08 0.63 0.09NAF 23 0.67 0.62 0.14 0.65 0.10
Phosphate NAE 26 0.25 0.21 0.14 0.21 0.04NAG 26 0.89 0.80 0.28 0.82 0.08NAD 23 0.48 0.45 0.10 0.46 0.04NAF 27 1.86 1.70 0.48 1.73 0.14
Silicate NAE 26 8.71 8.77 1.40 8.78 0.43NAG 25 39.07 39.00 1.92 39.21 0.99NAD 23 13.66 13.49 1.94 13.65 0.86
NAF 26 75.58 77.39 8.11 77.27 2.56

IOCCP-JAMSTEC 2015 Inter calibration exercise
16
Table KIOST 4. Consensus means, medians, and standard deviations for 4 samples.
Nutrient Sample # n Consensus
Mean Consensus
Median Consensus SD
μmol kg-1 μmol kg-1 μmol kg-1
Nitrate+Nitrite NAE 22 (26) 6.31 6.29 0.20
NAG 24 (25) 11.20 11.15 0.31 NAD 16 (23) 13.22 13.26 0.15 NAF 20 (25) 20.59 20.60 0.40
Nitrate NAE 13 (18) 5.39 5.41 0.14
NAG 16 (17) 11.04 10.98 0.31 NAD 15 (15) 12.65 12.68 0.48 NAF 14 (18) 19.98 20.01 0.33
Nitrite NAE 21 (24) 0.97 0.98 0.03
NAG 19 (23) 0.20 0.20 0.01 NAD 21 (21) 0.63 0.60 0.08 NAF 15 (23) 0.61 0.60 0.02
Phosphate NAE 19 (26) 0.21 0.21 0.02
NAG 22 (26) 0.81 0.79 0.05 NAD 17 (23) 0.45 0.45 0.02 NAF 18 (27) 1.66 1.66 0.05
Silicate NAE 20 (26) 8.84 8.78 0.24
NAG 19 (25) 38.91 38.84 0.63 NAD 18 (23) 13.72 13.53 0.52
NAF 16 (26) 77.38 77.39 0.87

IOCCP-JAMSTEC 2015 Inter calibration exercise
17
Table KIOST 5-1. Median and range of analytical precision of participating laboratories, and consensus coefficient of variation for analyses of nutrients in NAE.
Nutrients Analytical precision of participating laboratories
Consensus coefficient of
variation n Median% (range) n CV%
Nitrate+Nitrite 17 1.3 (0-16.1) 22 3.2
Phosphate 17 4.8 (0-49.8) 19 9.5
Silicate 17 3.2 (0-11.2) 20 2.7
Table KIOST 5-2. Median and range of analytical precision of participating laboratories, and consensus coefficient of variation for analyses of nutrients in NAG.
Nutrients Analytical precision of participating laboratories
Consensus coefficient of
variation n Median% (range) n CV%
Nitrate+Nitrite 15 1 (0.1-9.1) 24 2.8
Phosphate 16 2 (0-12.5) 22 6.3
Silicate 15 1 (0.1-3) 19 1.6
Table KIOST 5-3. Median and range of analytical precision of participating laboratories, and consensus coefficient of variation for analyses of nutrients in NAD.
Nutrients Analytical precision of participating laboratories
Consensus coefficient of
variation n Median% (range) n CV%
Nitrate+Nitrite 17 1.1 (0-7.9) 16 1.1
Phosphate 17 2.2 (0-22.1) 17 4.4
Silicate 17 2.1 (0.1-12.8) 18 3.8

IOCCP-JAMSTEC 2015 Inter calibration exercise
18
Table KIOST 5-4. Median and range of analytical precision of participating laboratories, and consensus coefficient of variation for analyses of nutrients in NAF.
Nutrients Analytical precision of participating laboratories
Consensus coefficient of
variation n Median% (range) n CV%
Nitrate+Nitrite 15 0.9 (0.1-5.2) 20 1.9
Phosphate 17 1.2 (0-18.6) 18 3
Silicate 16 0.8 (0.1-7.4) 16 1.1
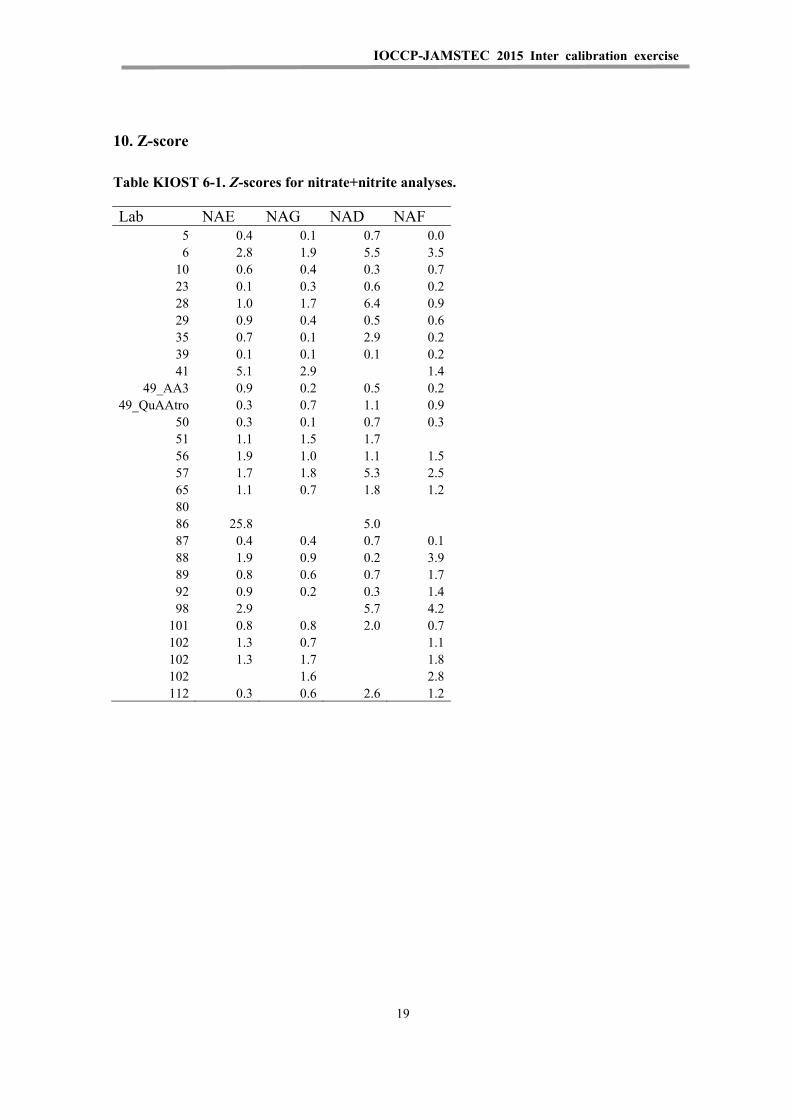
IOCCP-JAMSTEC 2015 Inter calibration exercise
19
10. Z-score
Table KIOST 6-1. Z-scores for nitrate+nitrite analyses.
Lab NAE NAG NAD NAF 5 0.4 0.1 0.7 0.0 6 2.8 1.9 5.5 3.5
10 0.6 0.4 0.3 0.7 23 0.1 0.3 0.6 0.2 28 1.0 1.7 6.4 0.9 29 0.9 0.4 0.5 0.6 35 0.7 0.1 2.9 0.2 39 0.1 0.1 0.1 0.2 41 5.1 2.9 1.4
49_AA3 0.9 0.2 0.5 0.2 49_QuAAtro 0.3 0.7 1.1 0.9
50 0.3 0.1 0.7 0.3 51 1.1 1.5 1.7 56 1.9 1.0 1.1 1.5 57 1.7 1.8 5.3 2.5 65 1.1 0.7 1.8 1.2 80 86 25.8 5.0 87 0.4 0.4 0.7 0.1 88 1.9 0.9 0.2 3.9 89 0.8 0.6 0.7 1.7 92 0.9 0.2 0.3 1.4 98 2.9 5.7 4.2
101 0.8 0.8 2.0 0.7 102 1.3 0.7 1.1 102 1.3 1.7 1.8 102 1.6 2.8 112 0.3 0.6 2.6 1.2
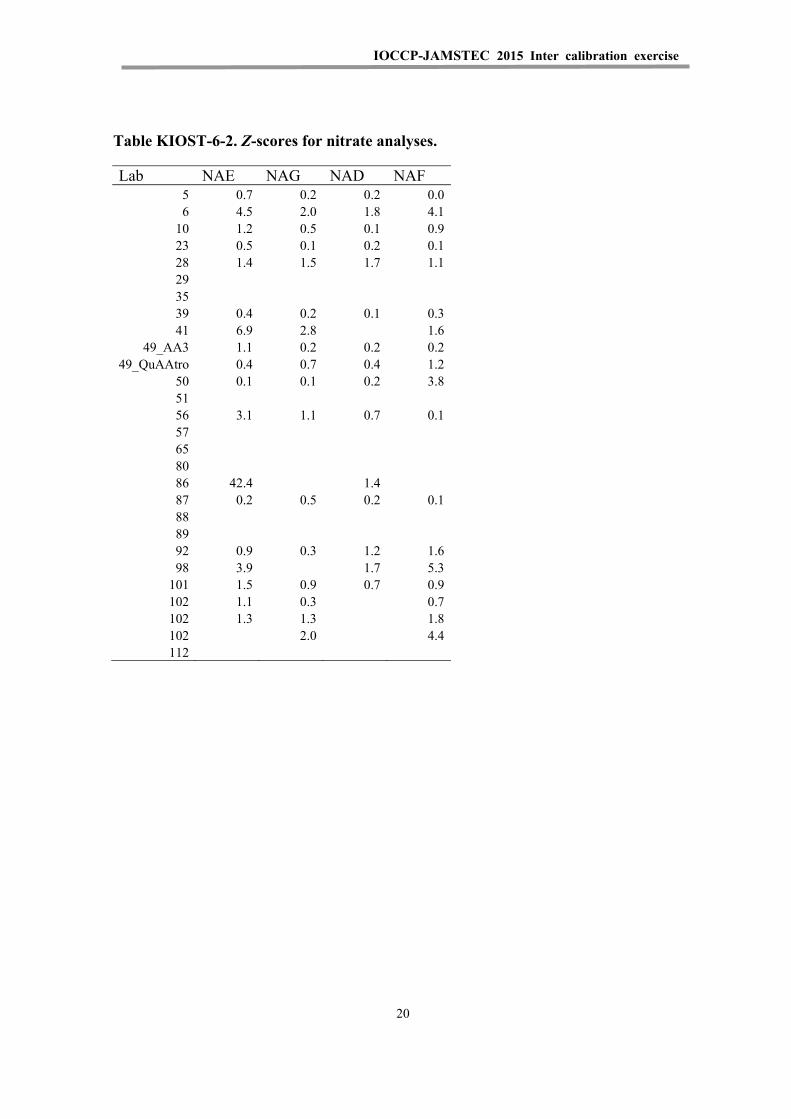
IOCCP-JAMSTEC 2015 Inter calibration exercise
20
Table KIOST-6-2. Z-scores for nitrate analyses.
Lab NAE NAG NAD NAF 5 0.7 0.2 0.2 0.0 6 4.5 2.0 1.8 4.1
10 1.2 0.5 0.1 0.9 23 0.5 0.1 0.2 0.1 28 1.4 1.5 1.7 1.1 29 35 39 0.4 0.2 0.1 0.3 41 6.9 2.8 1.6
49_AA3 1.1 0.2 0.2 0.2 49_QuAAtro 0.4 0.7 0.4 1.2
50 0.1 0.1 0.2 3.8 51 56 3.1 1.1 0.7 0.1 57 65 80 86 42.4 1.4 87 0.2 0.5 0.2 0.1 88 89 92 0.9 0.3 1.2 1.6 98 3.9 1.7 5.3
101 1.5 0.9 0.7 0.9 102 1.1 0.3 0.7 102 1.3 1.3 1.8 102 2.0 4.4 112
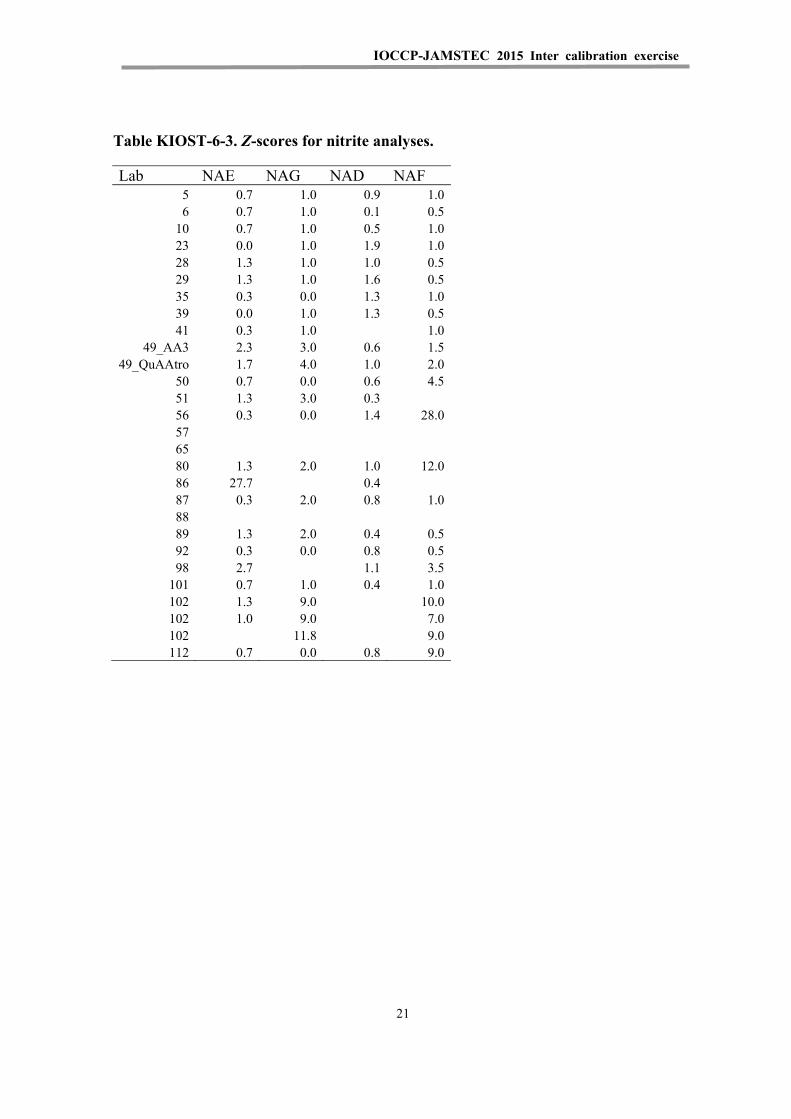
IOCCP-JAMSTEC 2015 Inter calibration exercise
21
Table KIOST-6-3. Z-scores for nitrite analyses.
Lab NAE NAG NAD NAF 5 0.7 1.0 0.9 1.0 6 0.7 1.0 0.1 0.5
10 0.7 1.0 0.5 1.0 23 0.0 1.0 1.9 1.0 28 1.3 1.0 1.0 0.5 29 1.3 1.0 1.6 0.5 35 0.3 0.0 1.3 1.0 39 0.0 1.0 1.3 0.5 41 0.3 1.0 1.0
49_AA3 2.3 3.0 0.6 1.5 49_QuAAtro 1.7 4.0 1.0 2.0
50 0.7 0.0 0.6 4.5 51 1.3 3.0 0.3 56 0.3 0.0 1.4 28.0 57 65 80 1.3 2.0 1.0 12.0 86 27.7 0.4 87 0.3 2.0 0.8 1.0 88 89 1.3 2.0 0.4 0.5 92 0.3 0.0 0.8 0.5 98 2.7 1.1 3.5
101 0.7 1.0 0.4 1.0 102 1.3 9.0 10.0 102 1.0 9.0 7.0 102 11.8 9.0 112 0.7 0.0 0.8 9.0
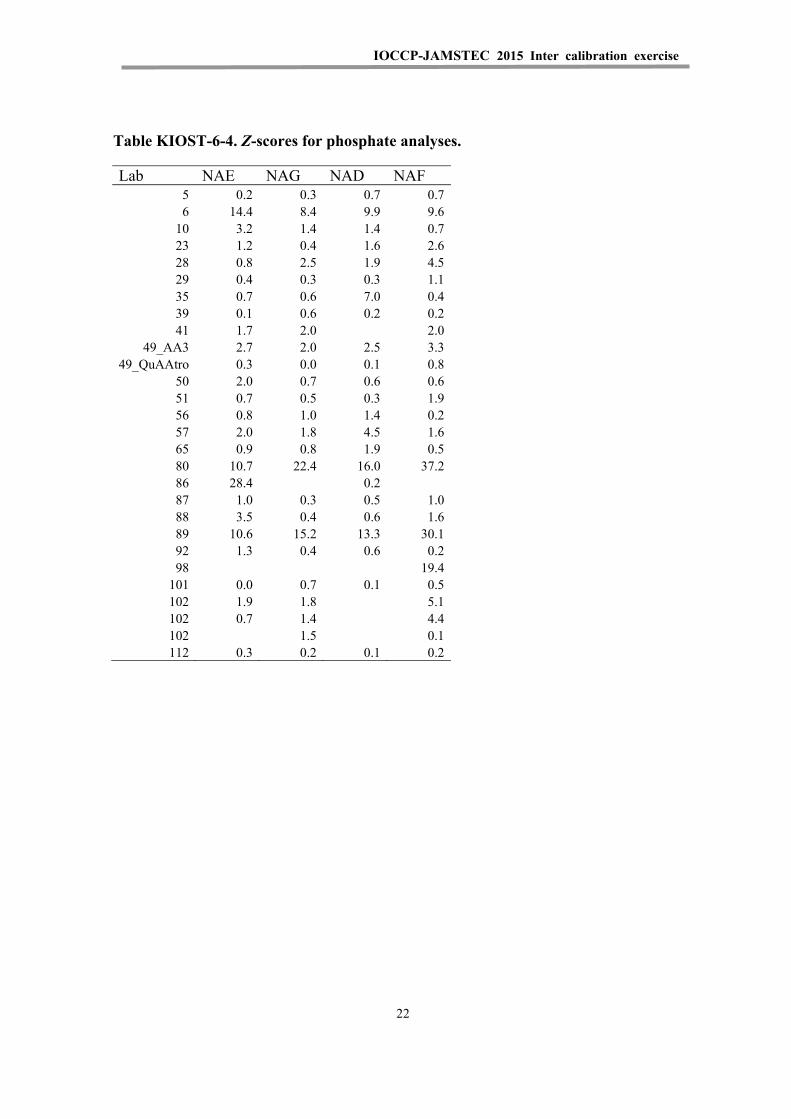
IOCCP-JAMSTEC 2015 Inter calibration exercise
22
Table KIOST-6-4. Z-scores for phosphate analyses.
Lab NAE NAG NAD NAF 5 0.2 0.3 0.7 0.7 6 14.4 8.4 9.9 9.6
10 3.2 1.4 1.4 0.7 23 1.2 0.4 1.6 2.6 28 0.8 2.5 1.9 4.5 29 0.4 0.3 0.3 1.1 35 0.7 0.6 7.0 0.4 39 0.1 0.6 0.2 0.2 41 1.7 2.0 2.0
49_AA3 2.7 2.0 2.5 3.3 49_QuAAtro 0.3 0.0 0.1 0.8
50 2.0 0.7 0.6 0.6 51 0.7 0.5 0.3 1.9 56 0.8 1.0 1.4 0.2 57 2.0 1.8 4.5 1.6 65 0.9 0.8 1.9 0.5 80 10.7 22.4 16.0 37.2 86 28.4 0.2 87 1.0 0.3 0.5 1.0 88 3.5 0.4 0.6 1.6 89 10.6 15.2 13.3 30.1 92 1.3 0.4 0.6 0.2 98 19.4
101 0.0 0.7 0.1 0.5 102 1.9 1.8 5.1 102 0.7 1.4 4.4 102 1.5 0.1 112 0.3 0.2 0.1 0.2

IOCCP-JAMSTEC 2015 Inter calibration exercise
23
Table KIOST-6-5. Z-scores for silicate analyses.
Lab NAE NAG NAD NAF 5 0.3 0.5 0.8 1.6 6 18.0 9.7 8.5 7.1
10 0.3 1.6 0.0 2.5 23 4.1 4.0 1.9 3.7 28 0.9 2.8 0.7 1.8 29 1.5 0.5 0.5 0.9 35 1.5 1.1 7.7 1.7 39 0.2 0.2 0.0 0.2 41 1.0 0.6 0.0
49_AA3 7.6 7.8 3.7 10.7 49_QuAAtro 5.6 4.8 3.3 6.9
50 0.3 0.8 0.3 0.6 51 0.0 1.1 56 0.6 0.9 0.5 1.1 57 0.7 0.1 1.3 0.0 65 0.6 0.6 0.6 0.7 80 1.9 1.7 1.4 10.9 86 87 0.9 0.4 0.4 1.1 88 2.0 2.6 1.7 3.1 89 1.0 0.7 0.9 1.2 92 0.9 1.0 0.7 0.0 98 19.9 11.7 43.3
101 1.0 1.6 0.9 3.2 102 0.4 1.0 0.6 102 0.6 1.6 0.6 102 0.8 5.0 112 2.9 0.1 1.1 0.4

IOCCP-JAMSTEC 2015 Inter calibration exercise
24
Table KIOST-6-6. Combined Z-scores for phosphate and nitrate+nitrite analyses.
Lab NAE NAG NAD NAF 5 0.3 0.2 0.7 0.4 6 8.6 5.2 7.7 6.6
10 1.9 0.9 0.9 0.7 23 0.7 0.4 1.1 1.4 28 0.9 2.1 4.2 2.7 29 0.7 0.4 0.4 0.9 35 0.7 0.4 5.0 0.3 39 0.1 0.4 0.2 0.2 41 3.4 2.5 1.7
49_AA3 1.8 1.1 1.5 1.8 49_QuAAtro 0.3 0.4 0.6 0.9
50 1.2 0.4 0.7 0.5 51 0.9 1.0 1.0 56 1.4 1.0 1.3 0.9 57 1.9 1.8 4.9 2.1 65 1.0 0.8 1.9 0.9 80 86 27.1 2.6 87 0.7 0.4 0.6 0.6 88 2.7 0.7 0.4 2.8 89 5.7 7.9 7.0 15.9 92 1.1 0.3 0.5 0.8 98 11.8
101 0.4 0.8 1.1 0.6 102 1.6 1.3 3.1 102 1.0 1.6 3.1 102 1.6 1.5 112 0.3 0.4 1.4 0.7

IOCCP-JAMSTEC 2015 Inter calibration exercise
25
Table KIOST-6-7. Combined Z-scores for phosphate, nitrate+nitrite, and silicate analyses.
Lab NAE NAG NAD NAF 5 0.3 0.3 0.7 0.8 6 11.7 6.7 8.0 6.7
10 1.4 1.1 0.6 1.3 23 1.8 1.6 1.4 2.2 28 0.9 2.3 3.0 2.4 29 0.9 0.4 0.4 0.9 35 1.0 0.6 5.9 0.8 39 0.1 0.3 0.1 0.2 41 2.6 1.8 1.1
49_AA3 3.7 3.3 2.2 4.7 49_QuAAtro 2.1 1.8 1.5 2.9
50 0.9 0.5 0.5 0.5 51 0.6 1.0 56 1.1 1.0 1.0 0.9 57 1.5 1.2 3.7 1.4 65 0.9 0.7 1.4 0.8 80 86 87 0.8 0.4 0.5 0.7 88 2.5 1.3 0.8 2.9 89 4.1 5.5 5.0 11.0 92 1.0 0.5 0.5 0.5 98 22.3
101 0.6 1.0 1.0 1.5 102 1.2 1.2 2.3 102 0.9 1.6 2.3 102 1.3 2.6 112 1.2 0.3 1.3 0.6

IOCCP-JAMSTEC 2015 Inter calibration exercise
26
Table KIOST-A1. List of participants.
Lab# Name Affliation Country 5 Marc Knockaert OD NATURE – ECOCHEM Belgium 6 Steven Bell Bermuda Institute of Ocean
Sciences Bermuda
10 Chris Payne University of British Columbia, Department of Earth, Ocean & Atmospheric Sciences
Canada
23 Patrick Raimbault Mediterranean Institute of Oceanology (MIO) Campus de Luminy
France
28 Kai-Uwe Ludwichowski Alfred-Wegener-Institute; Helmholtz Centre for Polar and Marine Research
Germany
29 Sólveig Rósa Ólafsdóttir Marine Research Institute Iceland
35 Sukeyoshi Takatani Japan Meteorological Agency Japan 39 Jan van Ooijen Royal NIOZ Netherlands
41 Kjell Gundersen Kjemilaboratoriet / Chemistry Laboratory, Havforskningsinstituttet / Institute of Marine Research
Norway
49 Sinhué Torres-Valdés National Oceanography Centre, Southampton
UK
50 E. Malcolm S. Woodward Plymouth Marine Laboratory UK
51 Pamela Walsham Alison Taylor
Marine Scotland - Science UK
56 Susan Becker Scripps Institution of Oceanography
USA
57 Jia-Zhong Zhang NOAA Atlantic Oceanographic and Meteorological Laboratory (AOML), Miami, Florida
USA
65 Susan Curless Matt Church
Hawaii Ocean Time-series USA
80 Jesús Ledesma Instituto del Mar del Perú Peru
86 Martina Kralj Istituto Nazionale di Oceanografia e Geofisica Sperimentale
Italy
87 Peter Thamer Department of Fisheries and Oceans Canada
Canada
88 Sólvá Jacobsen Faroe Marine Research Institute
Faroe Islands

IOCCP-JAMSTEC 2015 Inter calibration exercise
27
Lab# Name Affliation Country 89 Trevor McCormack Scottish Environment
Protection Agency UK
92 Thierry Cariou Station Biologique de Roscoff, Centre national de la recherche scientifique (CNRS) / Université Pierre et Marie Curie
France
98 Silvie Lainela University of Tartu, Estonian Marine Institute
Estonia
101 Jae-Hyun Lim Marine Environment Research Division, National Institute of Fisheries Science
Republic of Korea
102 Francesca Margiotta Stazione Zoologica Anton Dohrn
Italy
112 Carol Anstey Christine Rees
R/V INVESTIGATOR, CSIRO Marine and Atmospheric Research
Australia
IOCCP-JAMSTEC 2015 Inter calibration exercise
28
Table KIOST-A2. Results reported by the participants.

Lab
Sam
ple
Yea
rM
onth
Day
Tem
per
atu
reP
hosp
hate
ERR
Flag
Nitr
ite
ERR
Flag
Nitr
ate
ERR
Flag
NOX
ERR
Flag
RED
UCT
Sili
cate
ERR
Flag
20
15 I
C re
sult
s re
port
ed b
y th
e p
art
icip
an
tsin
mic
ro m
ole
s per
kil
ogra
m
5
NA
D-1
36
22
01
50
51
52
20
.43
70
.00
92
0.5
60
.02
21
2.7
50
.12
21
3.3
20
.14
21
3.3
10
.42
NA
E-0
887
20
15
05
15
22
0.2
07
0.0
04
20
.95
0.0
32
5.2
90
.05
26
.24
0.0
62
8.7
70
.26
2
NA
F-0
705
20
15
05
15
22
1.6
97
0.0
35
20
.59
0.0
22
19
.99
0.2
22
0.5
80
.21
27
6.0
12
.28
2
NA
G-0
81
72
01
50
51
52
20
.82
70
.01
72
0.1
90
.01
21
0.9
70
.11
21
1.1
60
.11
23
8.5
91
.16
3
6
NA
D-1
50
42
015
02
26
22
.60
.64
80
.06
92
0.6
20
.02
21
1.7
80
.23
21
2.4
0.2
52
18
.13
0.1
12
NA
E-0
867
20
15
02
26
22
.60
.49
80
.02
20
.99
0.0
12
4.7
60
.01
25
.75
0.0
12
13
.16
0.4
42
NA
F-0
861
20
15
02
26
22
.62
.14
0.0
22
0.6
0.0
12
18
.62
0.0
72
19
.21
0.0
82
83
.53
0.1
52
NA
G-0
89
02
01
50
22
62
2.6
1.2
31
0.0
39
20
.21
0.0
12
10
.42
0.0
82
10
.62
0.0
92
45
0.2
3
10
NA
D-1
52
82
015
03
26
21
0.4
23
0.0
49
20
.67
0.0
52
12
.59
0.2
92
13
.26
0.2
92
13
.73
0.9
82
NA
E-0
85
92
01
50
32
62
10
.14
70
.04
92
0.9
90
.05
25
.22
0.2
92
6.2
0.2
92
8.7
60
.98
2
NA
F-0
858
20
15
03
26
21
1.6
25
0.0
49
20
.63
0.0
52
19
.68
0.2
92
20
.32
0.2
92
79
.56
0.9
82
NA
G-0
87
32
015
03
26
21
0.7
40
.04
92
0.1
90
.05
21
0.8
90
.29
21
1.0
80
.29
23
9.9
30
.98
3
23
NA
D-3
50
20
15
02
09
21
0.4
81
20
.78
21
2.5
42
13
.31
21
4.7
32
NA
E-0
142
20
15
02
09
21
0.1
86
20
.97
25
.32
26
.29
29
.82
2
NA
F-0
070
20
15
02
09
21
1.7
88
20
.63
22
0.0
22
20
.65
28
0.5
92
NA
G-0
10
02
015
02
09
21
0.8
32
20
.21
21
1.0
82
11
.28
24
1.4
33
28
NA
D-1
35
92
015
02
15
22
0.4
12
0.0
49
20
.71
02
13
.47
0.2
21
4.1
80
.22
14
.09
0.2
92
NA
E-0
817
20
15
02
15
22
0.1
95
0.0
49
20
.93
02
5.5
80
.22
6.5
10
.22
9.0
60
.29
2
NA
F-0
70
42
01
50
21
52
21
.43
60
.04
92
0.6
02
20
.35
0.2
42
20
.95
0.2
42
78
.94
0.7
82
NA
G-0
81
62
015
02
15
22
0.6
84
0.0
49
20
.21
02
11
.51
0.2
21
1.7
10
.22
40
.64
0.4
93
29
NA
D-1
51
62
01
50
11
92
10
.45
60
.03
22
0.7
60
.01
21
3.1
40
.15
21
3.4
40
.63
2
NA
E-0
898
20
15
01
19
21
0.2
02
0.0
32
21
.01
0.0
12
6.1
40
.15
28
.49
0.6
32
NA
F-0
846
20
15
01
19
21
1.7
14
0.0
32
20
.62
0.0
12
20
.36
0.1
52
76
.62
0.6
32
NA
G-0
86
52
015
01
19
21
0.8
24
0.0
32
20
.19
0.0
12
11
.09
0.1
52
38
.62
0.6
33
IOCCP-JAMSTEC 2015 Inter calibration exercise

Lab
Sam
ple
Yea
rM
onth
Day
Tem
per
atu
reP
hosp
hate
ERR
Flag
Nitr
ite
ERR
Flag
Nitr
ate
ERR
Flag
NOX
ERR
Flag
RED
UCT
Sili
cate
ERR
Flag
20
15 I
C re
sult
s re
port
ed b
y th
e p
art
icip
an
tsin
mic
ro m
ole
s per
kil
ogra
m
35
NA
D-1
41
32
01
50
21
72
4.1
0.5
89
02
0.7
30
21
3.6
60
.01
21
7.7
0.0
32
NA
E-0
858
20
15
02
17
24
.10
.19
60
20
.96
02
6.1
80
28
.48
0.0
12
NA
F-0
852
20
15
02
17
24
.11
.64
20
20
.59
02
20
.52
0.0
22
75
.88
0.1
12
NA
G-0
83
72
01
50
21
72
4.1
0.7
82
02
0.2
02
11
.16
0.0
12
38
.24
0.0
63
39
NA
D-1
35
42
015
01
15
22
.50
.45
30
.01
20
.53
0.0
12
12
.68
0.1
21
3.2
10
.12
13
.72
0.2
2
NA
E-0
834
20
15
01
15
22
.50
.20
80
.01
20
.97
0.0
12
5.3
30
.04
26
.29
0.0
42
8.7
90
.15
2
NA
F-0
701
20
15
01
15
22
.51
.65
0.0
22
0.6
0.0
12
20
.07
0.2
22
0.6
60
.22
77
.17
0.5
92
NA
G-0
82
82
01
50
11
52
2.5
0.7
78
0.0
15
20
.19
0.0
12
10
.97
0.1
21
1.1
70
.12
39
.05
0.3
93
41
NA
D
NA
E2
01
50
20
22
20
.24
42
0.9
82
6.3
52
7.3
32
9.0
92
NA
F2
015
02
02
22
1.7
59
20
.63
21
9.4
42
20
.03
27
7.3
82
NA
G2
015
02
02
22
0.9
09
20
.21
21
1.9
22
12
.11
23
9.2
73
49
NA
D-1
35
82
015
01
27
21
0.4
51
20
.55
21
2.8
32
13
.38
21
1.9
92
NA
D-1
35
82
015
01
27
21
0.5
20
.58
21
2.5
52
13
.14
21
1.8
2
NA
E-0
587
20
15
01
27
21
0.2
05
20
.92
25
.45
26
.37
27
.52
NA
E-0
587
20
15
01
27
21
0.2
64
20
.92
5.2
42
6.1
42
7.0
12
NA
F-0
77
32
01
50
12
72
11
.72
0.5
72
20
.37
22
0.9
32
71
.39
2
NA
F-0
773
20
15
01
27
21
1.8
27
20
.58
21
9.9
22
20
.52
68
.06
2
NA
G-0
83
22
015
01
27
21
0.9
08
20
.17
21
0.9
82
11
.14
23
4.0
23
NA
G-0
83
22
01
50
12
72
10
.81
12
0.1
62
11
.25
21
1.4
12
35
.88
3
50
NA
D-1
55
7+
15
65
20
15
01
29
21
0.4
39
0.0
03
20
.58
02
12
.75
02
13
.33
02
13
.57
0.0
42
NA
E-0
70
6+
075
62
01
50
12
92
10
.17
0.0
02
20
.95
0.0
12
5.4
10
.03
26
.36
0.0
32
8.7
70
.03
2
NA
F-0
810
+0
822
20
15
01
29
21
1.6
29
0.0
04
20
.52
02
21
.24
0.0
22
20
.72
0.0
22
77
.94
0.1
2
NA
G-0
85
7+
08
76
20
15
01
29
21
0.7
73
0.0
02
20
.20
21
1.0
10
.02
21
1.2
20
.02
23
8.4
0.0
23
IOCCP-JAMSTEC 2015 Inter calibration exercise

Lab
Sam
ple
Yea
rM
onth
Day
Tem
per
atu
reP
hosp
hate
ERR
Flag
Nitr
ite
ERR
Flag
Nitr
ate
ERR
Flag
NOX
ERR
Flag
RED
UCT
Sili
cate
ERR
Flag
20
15 I
C re
sult
s re
port
ed b
y th
e p
art
icip
an
tsin
mic
ro m
ole
s per
kil
ogra
m
51
NA
D-X
XX
X2
01
50
30
61
80
.44
40
.09
82
0.6
10
.12
21
3.4
70
.98
21
4.3
0.9
82
NA
E-X
XX
X2
015
03
06
18
0.1
97
0.0
98
20
.93
0.1
22
6.0
90
.98
28
.85
0.9
82
NA
F-X
XX
X2
015
03
06
18
1.5
64
0.0
98
2
NA
G-X
XX
X2
01
50
30
61
80
.78
30
.09
82
0.1
70
.12
21
0.7
30
.98
23
56
NA
D-1
56
02
015
02
24
22
0.4
22
0.0
12
0.7
40
.01
21
2.3
20
.18
21
3.0
50
.18
21
3.4
40
.69
2
NA
E-0
748
20
15
02
24
22
0.2
25
0.0
12
0.9
80
.01
24
.96
0.1
82
5.9
40
.18
28
.69
0.6
82
NA
F-0
883
20
15
02
24
22
1.6
71
0.0
12
1.1
70
.01
22
00
.18
22
1.1
70
.18
27
8.3
60
.68
2
NA
G-0
87
52
01
50
22
42
20
.76
20
.01
20
.20
.01
21
0.7
0.1
82
10
.89
0.1
82
39
.47
0.6
83
57
NA
D-
20
15
02
25
0.3
62
14
.01
21
4.4
2
NA
E-
20
15
02
25
0.1
72
6.6
52
92
NA
F-
20
15
02
25
1.5
82
21
.57
27
7.4
2
NA
G-
20
15
02
25
0.7
22
11
.77
23
93
65
NA
D-1
40
32
015
03
09
21
.90
.41
30
.00
12
12
.95
0.0
72
13
.42
0.0
12
NA
E-0
893
20
15
03
09
21
.90
.19
30
.00
22
6.1
02
8.6
90
2
NA
F-0
872
20
15
03
09
21
.91
.63
30
.00
42
20
.10
.08
27
6.7
90
.15
2
NA
G-0
88
52
015
03
09
21
.90
.77
20
21
0.9
80
.07
23
8.5
50
.04
3
80
NA
D2
015
02
18
21
0.7
69
0.0
98
20
.71
0.1
21
30
.98
2
NA
E2
015
02
18
21
0.4
24
0.0
98
21
.01
0.1
29
.30
.98
2
NA
F2
01
50
21
82
13
.52
20
.09
82
0.8
50
.12
67
.86
0.9
82
NA
G2
015
02
18
21
1.9
32
0.0
98
20
.22
0.1
23
7.8
30
.98
3
86
NA
D-X
XX
X2
01
50
22
64
00
.45
40
.00
72
0.6
60
21
3.3
10
.04
21
3.9
70
.03
2
NA
E-X
XX
X4
00
.77
70
.00
12
0.1
40
21
1.3
20
.05
21
1.4
60
.05
2
NA
F-X
XX
X
NA
G-X
XX
X
IOCCP-JAMSTEC 2015 Inter calibration exercise

Lab
Sam
ple
Yea
rM
onth
Day
Tem
per
atu
reP
hosp
hate
ERR
Flag
Nitr
ite
ERR
Flag
Nitr
ate
ERR
Flag
NOX
ERR
Flag
RED
UCT
Sili
cate
ERR
Flag
20
15 I
C re
sult
s re
port
ed b
y th
e p
art
icip
an
tsin
mic
ro m
ole
s per
kil
ogra
m
87
NA
D-1
50
32
01
50
12
22
10
.45
92
0.5
72
12
.75
21
3.3
22
13
.49
2
NA
E-0
884
20
15
01
22
21
0.2
29
20
.96
25
.42
26
.38
28
.62
2
NA
F-0
874
20
15
01
22
21
1.7
09
20
.59
22
0.0
22
20
.61
27
8.2
92
NA
G-0
88
62
01
50
12
22
10
.79
42
0.1
82
10
.92
11
.08
23
8.6
63
88
NA
D-1
36
02
015
01
20
21
0.4
61
21
3.2
52
14
.58
2
NA
E-0
827
20
15
01
20
21
0.1
42
6.6
82
9.3
22
NA
F-0
766
20
15
01
20
21
1.7
39
21
9.0
52
80
.08
2
NA
G-0
87
82
01
50
12
02
10
.79
12
10
.91
24
0.5
53
89
NA
D-1
53
52
10
.71
60
.00
22
0.6
02
13
.12
0.1
22
13
.27
0.0
42
NA
E-0
86
22
10
.42
10
.00
62
1.0
10
.01
26
.15
0.0
82
8.5
90
.19
2
NA
F-0
860
21
3.1
64
0.0
11
20
.62
02
19
.90
.22
27
6.3
80
.12
2
NA
G-0
87
42
11
.56
90
.00
12
0.2
20
21
1.0
10
.05
23
8.4
80
.04
3
92
NA
D-1
40
1/1
40
22
015
02
23
18
0.4
61
0.0
06
20
.57
02
13
.21
0.0
52
13
.27
0.0
52
14
.07
0.0
52
NA
E-0
811
/08
71
20
15
01
07
18
0.1
85
0.0
12
0.9
60
25
.51
0.0
52
6.4
80
.05
29
.05
0.0
52
NA
F-0
840
/08
91
20
15
01
08
18
1.6
69
0.0
12
0.6
02
19
.45
0.0
52
20
.05
0.0
52
77
.35
0.0
52
NA
G-0
83
8/0
89
22
015
01
08
18
0.7
90
.01
20
.20
21
0.9
40
.05
21
1.1
40
.05
23
9.5
50
.05
3
98
NA
D-1
39
82
015
02
26
22
.40
.54
21
1.8
22
12
.36
0.9
82
7.6
60
.98
2
NA
E-0
803
20
15
02
26
22
.40
.89
24
.85
25
.73
0.2
92
4.0
70
.39
2
NA
F-0
85
02
01
50
22
62
2.4
2.6
29
0.4
89
20
.68
21
8.2
22
18
.91
0.9
82
39
.72
2.9
32
NA
G-0
80
52
015
02
26
101
NA
D-1
54
52
01
50
20
42
1.5
0.4
49
0.0
17
20
.60
.02
21
2.3
32
12
.92
0.2
72
13
.25
0.8
82
NA
E-0
744
20
15
02
04
21
.50
.21
0.0
17
20
.99
0.0
32
5.1
82
6.1
60
.13
28
.61
0.8
82
NA
F-0
854
20
15
02
04
21
.51
.63
50
.03
72
0.6
30
.02
21
9.6
82
20
.31
0.4
22
74
.63
1.6
62
NA
G-0
88
02
015
02
04
21
.50
.77
30
.02
12
0.1
90
.02
21
0.7
72
10
.96
0.2
32
37
.91
1.0
53
IOCCP-JAMSTEC 2015 Inter calibration exercise

Lab
Sam
ple
Yea
rM
onth
Day
Tem
per
atu
reP
hosp
hate
ERR
Flag
Nitr
ite
ERR
Flag
Nitr
ate
ERR
Flag
NOX
ERR
Flag
RED
UCT
Sili
cate
ERR
Flag
20
15 I
C re
sult
s re
port
ed b
y th
e p
art
icip
an
tsin
mic
ro m
ole
s per
kil
ogra
m
102
NA
D-1
41
1
NA
D-1
41
22
0
NA
D-1
41
62
02
NA
E-0
84
82
01
50
22
62
00
.24
72
1.0
12
5.5
52
6.5
72
8.9
42
NA
E-0
872
20
15
02
26
20
0.2
23
21
25
.57
26
.57
28
.99
2
NA
E-0
886
20
15
02
26
20
2
NA
F-0
829
20
15
02
26
20
1.6
55
20
.79
22
1.4
45
22
1.7
12
81
.75
82
NA
F-0
839
20
15
02
26
20
1.9
17
20
.81
22
0.2
12
21
.02
27
7.9
32
NA
F-0
86
32
01
50
22
62
01
.88
12
0.7
52
20
.56
22
1.3
12
77
.86
2
NA
G-0
87
22
015
02
26
21
0.9
20
.29
21
1.1
22
11
.41
23
9.5
53
NA
G-0
88
12
015
02
26
21
0.8
87
20
.31
82
11
.64
92
11
.69
23
9.4
23
NA
G-0
89
92
01
50
22
62
10
.88
20
.29
21
1.4
32
11
.71
23
9.9
33
112
NA
D 1
527
20
15
02
13
23
.30
.45
20
.01
20
.57
0.0
12
n/a
n/a
91
3.6
10
.14
21
3.1
30
.26
2
NA
E 0
86
62
01
50
21
32
3.3
0.2
05
0.0
12
0.9
90
.01
2n/a
n/a
96
.37
0.1
42
8.1
50
.25
2
NA
F 0
83
42
015
02
13
23
.31
.67
10
.01
20
.79
0.0
12
n/a
n/a
92
1.0
60
.14
27
7.7
10
.25
2
NA
G 0
844
20
15
02
13
23
.30
.80
10
.01
20
.20
.01
2n/a
n/a
91
1.3
90
.14
23
8.8
40
.25
3
IOCCP-JAMSTEC 2015 Inter calibration exercise
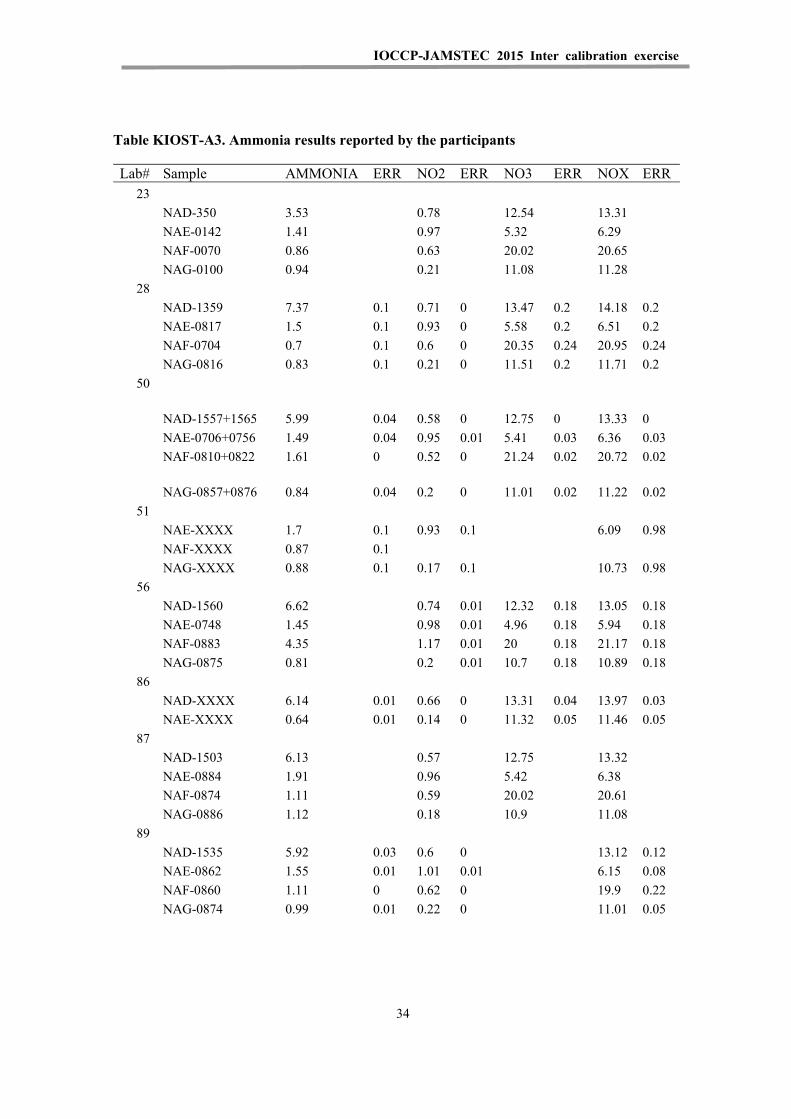
IOCCP-JAMSTEC 2015 Inter calibration exercise
34
Table KIOST-A3. Ammonia results reported by the participants
Lab# Sample AMMONIA ERR NO2 ERR NO3 ERR NOX ERR23
NAD-350 3.53 0.78 12.54 13.31
NAE-0142 1.41 0.97 5.32 6.29
NAF-0070 0.86 0.63 20.02 20.65
NAG-0100 0.94 0.21 11.08 11.28
28
NAD-1359 7.37 0.1 0.71 0 13.47 0.2 14.18 0.2
NAE-0817 1.5 0.1 0.93 0 5.58 0.2 6.51 0.2
NAF-0704 0.7 0.1 0.6 0 20.35 0.24 20.95 0.24
NAG-0816 0.83 0.1 0.21 0 11.51 0.2 11.71 0.2
50
NAD-1557+1565 5.99 0.04 0.58 0 12.75 0 13.33 0
NAE-0706+0756 1.49 0.04 0.95 0.01 5.41 0.03 6.36 0.03
NAF-0810+0822 1.61 0 0.52 0 21.24 0.02 20.72 0.02
NAG-0857+0876 0.84 0.04 0.2 0 11.01 0.02 11.22 0.02
51
NAE-XXXX 1.7 0.1 0.93 0.1 6.09 0.98
NAF-XXXX 0.87 0.1
NAG-XXXX 0.88 0.1 0.17 0.1 10.73 0.98
56
NAD-1560 6.62 0.74 0.01 12.32 0.18 13.05 0.18
NAE-0748 1.45 0.98 0.01 4.96 0.18 5.94 0.18
NAF-0883 4.35 1.17 0.01 20 0.18 21.17 0.18
NAG-0875 0.81 0.2 0.01 10.7 0.18 10.89 0.18
86
NAD-XXXX 6.14 0.01 0.66 0 13.31 0.04 13.97 0.03
NAE-XXXX 0.64 0.01 0.14 0 11.32 0.05 11.46 0.05
87
NAD-1503 6.13 0.57 12.75 13.32
NAE-0884 1.91 0.96 5.42 6.38
NAF-0874 1.11 0.59 20.02 20.61
NAG-0886 1.12 0.18 10.9 11.08
89
NAD-1535 5.92 0.03 0.6 0 13.12 0.12
NAE-0862 1.55 0.01 1.01 0.01 6.15 0.08
NAF-0860 1.11 0 0.62 0 19.9 0.22
NAG-0874 0.99 0.01 0.22 0 11.01 0.05
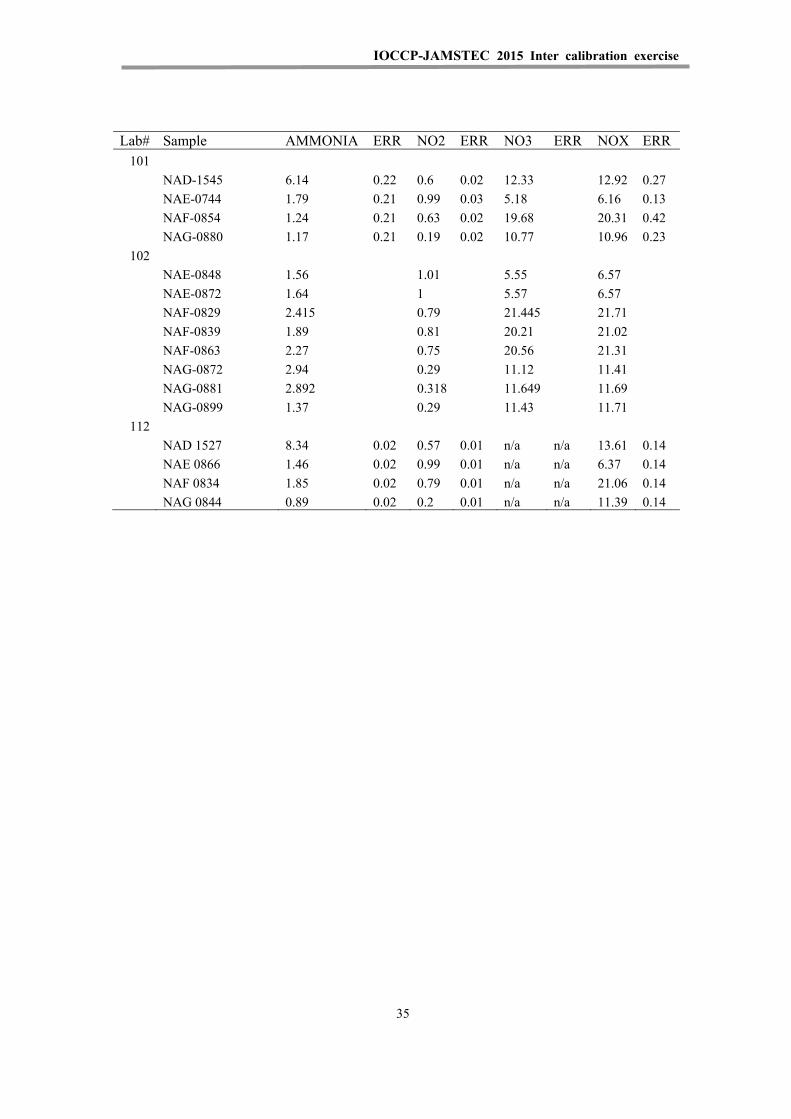
IOCCP-JAMSTEC 2015 Inter calibration exercise
35
Lab# Sample AMMONIA ERR NO2 ERR NO3 ERR NOX ERR101
NAD-1545 6.14 0.22 0.6 0.02 12.33 12.92 0.27
NAE-0744 1.79 0.21 0.99 0.03 5.18 6.16 0.13
NAF-0854 1.24 0.21 0.63 0.02 19.68 20.31 0.42
NAG-0880 1.17 0.21 0.19 0.02 10.77 10.96 0.23
102
NAE-0848 1.56 1.01 5.55 6.57
NAE-0872 1.64 1 5.57 6.57
NAF-0829 2.415 0.79 21.445 21.71
NAF-0839 1.89 0.81 20.21 21.02
NAF-0863 2.27 0.75 20.56 21.31
NAG-0872 2.94 0.29 11.12 11.41
NAG-0881 2.892 0.318 11.649 11.69
NAG-0899 1.37 0.29 11.43 11.71
112
NAD 1527 8.34 0.02 0.57 0.01 n/a n/a 13.61 0.14
NAE 0866 1.46 0.02 0.99 0.01 n/a n/a 6.37 0.14
NAF 0834 1.85 0.02 0.79 0.01 n/a n/a 21.06 0.14
NAG 0844 0.89 0.02 0.2 0.01 n/a n/a 11.39 0.14

IOCCP-JAMSTEC 2015 Inter calibration exercise
36
Table KIOST-A4-1 Cross reference table of ranked order and Lab # for Figure KIOST-1
rank Lab No. Lab name
1 98 University of Tartu, Estonian Marine Institute, Estonia
2 88 Faroe Marine Research Institute, Faroe Islands
3 6 Bermuda Institute of Ocean Sciences, Bermuda
4 89 Scottish Environment Protection Agency, UK
5 41 Kjemilaboratoriet / Chemistry Laboratory, Havforskningsinstituttet / Institute of Marine Research, Norway
6 92 Station Biologique de Roscoff, Centre national de la recherche scientifique (CNRS) / Université Pierre et Marie Curie, France
7 65 Hawaii Ocean Time-series, USA
8 101 Marine Environment Research Division, National Institute of Fisheries Science, Republic of Korea
9 10 University of British Columbia, Department of Earth, Ocean & Atmospheric Sciences, Canada
10 29 Marine Research Institute, Iceland
11 49 National Oceanography Centre, Southampton, UK
12 35 Japan Meteorological Agency, Japan
13 5 OD NATURE – ECOCHEM, Belgium
14 87 Department of Fisheries and Oceans Canada, Canada
15 23 Mediterranean Institute of Oceanology (MIO) Campus de Luminy, France
16 39 Royal NIOZ, Netherlands
17 50 Plymouth Marine Laboratory, UK
18 28 Alfred-Wegener-Institute; Helmholtz Centre for Polar and Marine Research, Germany
19 102 Stazione Zoologica Anton Dohrn, Italy
20 112 R/V INVESTIGATOR, CSIRO Marine and Atmospheric Research, Australia
21 56 Scripps Institution of Oceanography, USA
22 57 NOAA Atlantic Oceanographic and Meteorological Laboratory (AOML), Miami, Florida, USA
23 51 Marine Scotland - Science, UK
24 86 Istituto Nazionale di Oceanografia e Geofisica Sperimentale, Italy

IOCCP-JAMSTEC 2015 Inter calibration exercise
37
Table KIOST-A4-2 Cross reference table of ranked order and Lab # for Figure KIOST-2
rank Lab No. Lab name
1 98 University of Tartu, Estonian Marine Institute, Estonia
2 6 Bermuda Institute of Ocean Sciences, Bermuda
3 41 Kjemilaboratoriet / Chemistry Laboratory, Havforskningsinstituttet / Institute of Marine Research, Norway
4 92 Station Biologique de Roscoff, Centre national de la recherche scientifique (CNRS) / Université Pierre et Marie Curie, France
5 10 University of British Columbia, Department of Earth, Ocean & Atmospheric Sciences, Canada
6 101 Marine Environment Research Division, National Institute of Fisheries Science, Republic of Korea
7 49 National Oceanography Centre, Southampton, UK
8 5 OD NATURE – ECOCHEM, Belgium
9 56 Scripps Institution of Oceanography, USA
10 23 Mediterranean Institute of Oceanology (MIO) Campus de Luminy, France
11 87 Department of Fisheries and Oceans Canada, Canada
12 39 Royal NIOZ, Netherlands
13 102 Stazione Zoologica Anton Dohrn, Italy
14 28 Alfred-Wegener-Institute; Helmholtz Centre for Polar and Marine Research, Germany
15 50 Plymouth Marine Laboratory, UK
16 86 Istituto Nazionale di Oceanografia e Geofisica Sperimentale, Italy

IOCCP-JAMSTEC 2015 Inter calibration exercise
38
Table KIOST-A4-3 Cross reference table of ranked order and Lab # for Figure KIOST-3
rank Lab No. Lab name
1 86 Istituto Nazionale di Oceanografia e Geofisica Sperimentale, Italy
2 98 University of Tartu, Estonian Marine Institute, Estonia
3 49 National Oceanography Centre, Southampton, UK
4 28 Alfred-Wegener-Institute; Helmholtz Centre for Polar and Marine Research, Germany
5 51 Marine Scotland - Science, UK
6 5 OD NATURE – ECOCHEM, Belgium
7 50 Plymouth Marine Laboratory, UK
8 35 Japan Meteorological Agency, Japan
9 87 Department of Fisheries and Oceans Canada, Canada
10 92 Station Biologique de Roscoff, Centre national de la recherche scientifique (CNRS) / Université Pierre et Marie Curie, France
11 23 Mediterranean Institute of Oceanology (MIO) Campus de Luminy, France
12 39 Royal NIOZ, Netherlands
13 41 Kjemilaboratoriet / Chemistry Laboratory, Havforskningsinstituttet / Institute of Marine Research, Norway
14 56 Scripps Institution of Oceanography, USA
15 6 Bermuda Institute of Ocean Sciences, Bermuda
16 10 University of British Columbia, Department of Earth, Ocean & Atmospheric Sciences, Canada
17 101 Marine Environment Research Division, National Institute of Fisheries Science, Republic of Korea
18 112 R/V INVESTIGATOR, CSIRO Marine and Atmospheric Research, Australia
19 29 Marine Research Institute, Iceland
20 80 Instituto del Mar del Perú, Peru
21 89 Scottish Environment Protection Agency, UK
22 102 Stazione Zoologica Anton Dohrn, Italy
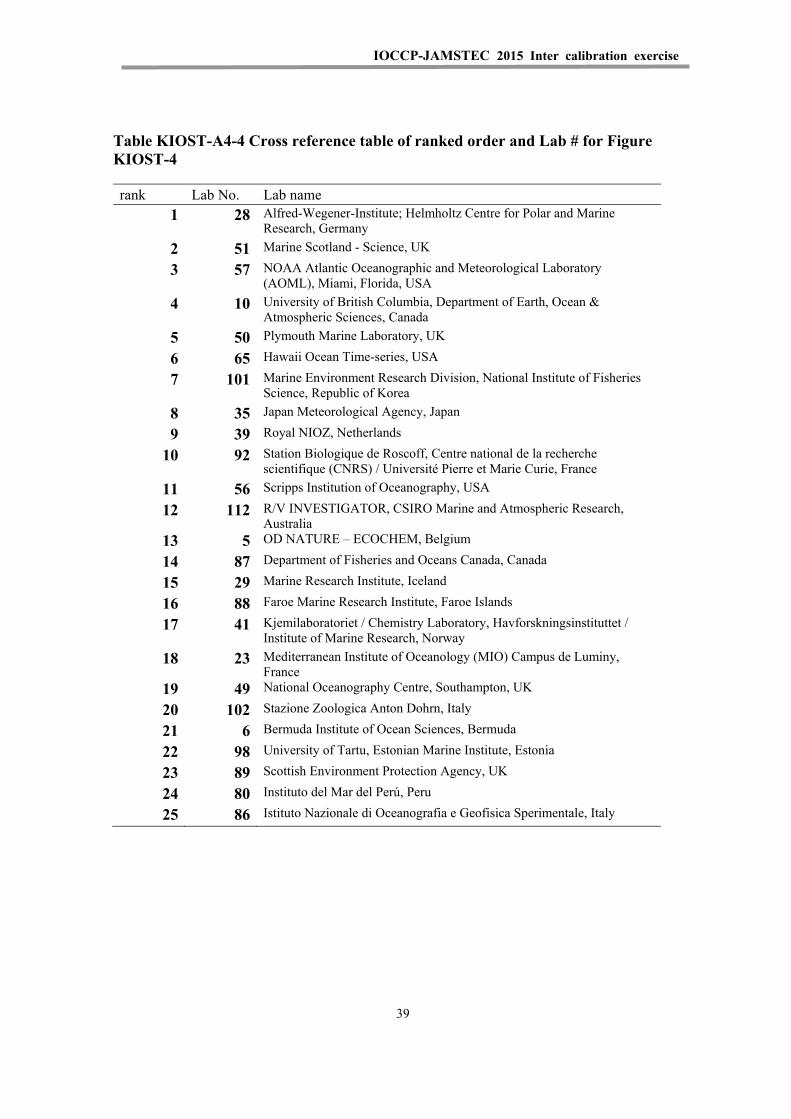
IOCCP-JAMSTEC 2015 Inter calibration exercise
39
Table KIOST-A4-4 Cross reference table of ranked order and Lab # for Figure KIOST-4
rank Lab No. Lab name
1 28 Alfred-Wegener-Institute; Helmholtz Centre for Polar and Marine Research, Germany
2 51 Marine Scotland - Science, UK
3 57 NOAA Atlantic Oceanographic and Meteorological Laboratory (AOML), Miami, Florida, USA
4 10 University of British Columbia, Department of Earth, Ocean & Atmospheric Sciences, Canada
5 50 Plymouth Marine Laboratory, UK
6 65 Hawaii Ocean Time-series, USA
7 101 Marine Environment Research Division, National Institute of Fisheries Science, Republic of Korea
8 35 Japan Meteorological Agency, Japan
9 39 Royal NIOZ, Netherlands
10 92 Station Biologique de Roscoff, Centre national de la recherche scientifique (CNRS) / Université Pierre et Marie Curie, France
11 56 Scripps Institution of Oceanography, USA
12 112 R/V INVESTIGATOR, CSIRO Marine and Atmospheric Research, Australia
13 5 OD NATURE – ECOCHEM, Belgium
14 87 Department of Fisheries and Oceans Canada, Canada
15 29 Marine Research Institute, Iceland
16 88 Faroe Marine Research Institute, Faroe Islands
17 41 Kjemilaboratoriet / Chemistry Laboratory, Havforskningsinstituttet / Institute of Marine Research, Norway
18 23 Mediterranean Institute of Oceanology (MIO) Campus de Luminy, France
19 49 National Oceanography Centre, Southampton, UK
20 102 Stazione Zoologica Anton Dohrn, Italy
21 6 Bermuda Institute of Ocean Sciences, Bermuda
22 98 University of Tartu, Estonian Marine Institute, Estonia
23 89 Scottish Environment Protection Agency, UK
24 80 Instituto del Mar del Perú, Peru
25 86 Istituto Nazionale di Oceanografia e Geofisica Sperimentale, Italy
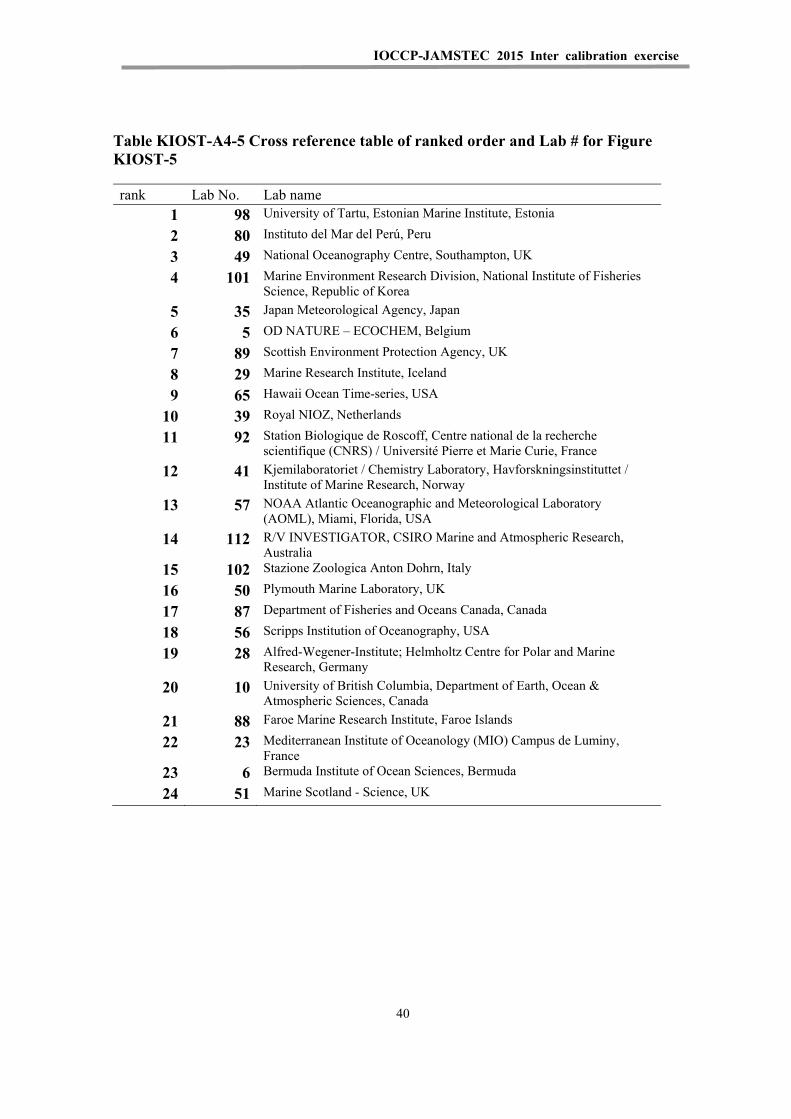
IOCCP-JAMSTEC 2015 Inter calibration exercise
40
Table KIOST-A4-5 Cross reference table of ranked order and Lab # for Figure KIOST-5
rank Lab No. Lab name
1 98 University of Tartu, Estonian Marine Institute, Estonia
2 80 Instituto del Mar del Perú, Peru
3 49 National Oceanography Centre, Southampton, UK
4 101 Marine Environment Research Division, National Institute of Fisheries Science, Republic of Korea
5 35 Japan Meteorological Agency, Japan
6 5 OD NATURE – ECOCHEM, Belgium
7 89 Scottish Environment Protection Agency, UK
8 29 Marine Research Institute, Iceland
9 65 Hawaii Ocean Time-series, USA
10 39 Royal NIOZ, Netherlands
11 92 Station Biologique de Roscoff, Centre national de la recherche scientifique (CNRS) / Université Pierre et Marie Curie, France
12 41 Kjemilaboratoriet / Chemistry Laboratory, Havforskningsinstituttet / Institute of Marine Research, Norway
13 57 NOAA Atlantic Oceanographic and Meteorological Laboratory (AOML), Miami, Florida, USA
14 112 R/V INVESTIGATOR, CSIRO Marine and Atmospheric Research, Australia
15 102 Stazione Zoologica Anton Dohrn, Italy
16 50 Plymouth Marine Laboratory, UK
17 87 Department of Fisheries and Oceans Canada, Canada
18 56 Scripps Institution of Oceanography, USA
19 28 Alfred-Wegener-Institute; Helmholtz Centre for Polar and Marine Research, Germany
20 10 University of British Columbia, Department of Earth, Ocean & Atmospheric Sciences, Canada
21 88 Faroe Marine Research Institute, Faroe Islands
22 23 Mediterranean Institute of Oceanology (MIO) Campus de Luminy, France
23 6 Bermuda Institute of Ocean Sciences, Bermuda
24 51 Marine Scotland - Science, UK
IOCCP-JAMSTEC 2015 Inter calibration exercise
1
Appendix VI
History of Inter-comparison studies

IOCCP-JAMSTEC 2015 Inter calibration exercise
2
Dummy

IOCCP-JAMSTEC 2015 Inter calibration exercise
3
History of nutrient inter-laboratory comparison study
This history of nutrient inter-laboratory comparison study is based on several reports of previous intercomparison exercises. The histories of the first to fourth ICES exercises are derived from Aminot and Kirkwood’s (1995) detailed report of the fifth ICES intercomparison, which includes histories of the first to fourth ICES exercises. Histories of the fifth ICES exercise, the first and second NOAA/NRC inter-laboratory comparison study, MRI 2003 and 2006 intercomparisons are also summarized in this appendix.
1. First ICES Exercise
The first intercalibration to include nutrients was an entirely Baltic affair in June 1965, when three research vessels met by private agreement in Copenhagen:
Aranda Institute of Marine Research (IMR), Helsinki
Hermann Wattenberg Institut für Meereskunde, Kiel
Skagerak Royal Fishery Board, Gothenburg
Each ship contributed freshly collected bulk samples to the experiment, which were sub-sampled and analyzed on board each of the three participating ships on the same day. Oxygen, salinity, chlorinity, alkalinity, and phosphate were determined.
2. Second ICES Exercise
The second ICES exercise, carried out in 1966 under the auspices of the newly formed ICES Working Group on the Intercalibration of Chemical Methods, was still predominantly a Baltic initiative and consisted of two parts: Part I, Leningrad, during the 5th Conference of Baltic Oceanographers; and Part II, Copenhagen, at the 54th ICES Statutory Meeting.
Part I, Leningrad (May 1966)
The participating research vessels were
Alkor Institut für Meereskunde, Kiel
Okeanograf Institute of Marine Research, Leningrad
Prof Otto Krammel Institut für Meereskunde, Warnemünde
Skagerak Fisheries Board of Sweden, Gothenburg
The research vessels delivered bulk samples, which were subsampled and analyzed almost immediately for oxygen, salinity, chlorinity, pH, and phosphate.

IOCCP-JAMSTEC 2015 Inter calibration exercise
4
Part II, Copenhagen (September 1966)
The list of interested parties continued to grow and, in addition to Baltic countries, Norway and the UK were represented. Research vessels delivered bulk samples and the various participants analyzed samples simultaneously in Copenhagen. The determinants of primary interest included not only oxygen, salinity, chlorinity, and phosphate, as in Part I (Leningrad) and the previous year's exercise (Copenhagen, 1965), but also nitrate, nitrite, and silicate.
The final report, edited by Grasshoff (UNESCO, 1966), makes no mention of nitrate or nitrite but some of those who were present confessed that these results were "too terrible to be included"! To be fair to those involved, 1966 was an early time in the development of heterogeneous cadmium-based nitrate/nitrite reduction techniques and some of the associated problems were presumably not fully appreciated at the time.
Evidently nitrate analysis had some way to go to achieve the reliability and ease of operation of the Murphy and Riley (1962) phosphate technique, but it is worth noting that intercomparison work on phosphate so far had consisted of simultaneous analysis of freshly obtained subsamples by a small number of highly competent workers, in close contact with each other, exchanging calibration solutions, ideas, technical details, etc. Subsequent to the Copenhagen trial, Jones and Folkard (ICES, 1966) undertook a detailed laboratory examination of the individual methods used by the participants and, in their contribution to Grasshoff’s report, they announced, "There seems to be no need for any further intercalibration in the determination of inorganic phosphate by this method."
Clearly this happy state of affairs could and did not last. Along came the autoanalyzer!
3. Third ICES Exercise
The third ICES exercise was organized by the ICES Working Group on Chemical Analysis of Sea Water under the joint auspices of ICES and SCOR and its official title, "The International Intercalibration Exercise for Nutrient Methods2”, shows that it set out to be an ambitious project.
Samples were distributed in 1969–1970 and 45 laboratories from 20 countries submitted results, but the final report on the results of the exercise was not published for several years (ICES, 1977).
The time had come to study "nutrients" separately from oxygen, salinity, chlorinity, and pH, but with the awareness of problems arising from the instability of natural seawater samples, the organizers chose to use standard solutions that were prepared and distributed by the Sagami Chemical Research Center, Japan. [Note added by Aoyama: The standard solutions used in this exercise were Cooperative Survey of Kuroshio(CSK) standards, which are solutions in artificial seawater for nitrate, phosphate, and silicate and in pure water for nitrite.]

IOCCP-JAMSTEC 2015 Inter calibration exercise
5
In this exercise, participants performed the analyses in their own laboratories but, despite being supplied (knowingly) with appropriate blank solutions for each determination, the overall accuracy, particularly for phosphate and nitrate, was disappointing.
The report concludes, "As methods did not diverge much, it is clear that variations must be sought primarily in the standardization procedures. The results will also aid participants in re-evaluating their analytical procedures by comparison of their methods with those that appear most satisfactory from this exercise".
The names of the participating laboratories were listed, as were the tables of results, but it was not possible to link them together. Hindsight suggests that this may have been counterproductive; we now suspect that there is no greater incentive for a laboratory to improve its performance than the knowledge that peer laboratories throughout the world are aware that it is producing poor quality data.
4. Fourth ICES Exercise
Various "workshop" and multi-ship events following the ICES/SCOR exercise including nutrient studies, but it was many years later (1988) before the ICES Marine Chemistry Working Group produced volunteers (Don Kirkwood, Alain Aminot, and Matti Perttilä) to organize the next large-scale intercalibration exercise, designated "NUTS I/C 4". This exercise did not set out to be worldwide, beginning only with laboratories in ICES Member Countries, but other laboratories who were interested in participating were not turned away.
The fourth exercise differed from the third exercise in three important respects.
1) The test samples were natural or near-natural seawater rather than standard solutions. (Strictly speaking, this made the exercise an intercomparison rather than an intercalibration.)
2) Participants were unaware that "blank" samples were included.
3) Anonymity was abolished. Participants were made aware from the outset that the final report would list identities of laboratories, results, and a means for any reader to contact them.
Sixty-nine laboratories from 22 countries submitted results and, thanks in some measure to the telefax machine, the final 83-page report (Kirkwood et al., 1991) was in the hands of participants within two years of the distribution of samples. Statistical treatment identified 58 laboratories consistent in phosphate analyses, 51 consistent in nitrate analyses, and 48 consistent in both phosphate and nitrate analyses, including a group of 12 whose results were especially close to the consensus concentrations.
IOCCP-JAMSTEC 2015 Inter calibration exercise
6
5. Fifth ICES Exercise
Due to the generally perceived need for more and better quality control in analytical measurement, a fifth ICES intercomparison exercise was carried out in 1993. A total of 142 sets of samples were distributed in 31 countries. Results were returned by 132 laboratories, 61 of which had participated in the fourth intercomparison and 56 of which were participating in QUASIMEME (Quality Assurance of Information for Marine Environmental Monitoring in Europe).
The distribution of laboratories was as follows:
UK (22), Germany (18), Sweden (13), France (11), Spain (8), USA (7), Norway(5), Ireland(5), Australia(4) Canada(4), Netherlands(4), Denmark(3), Greece(3), Portugal(3), Belgium(2), Estonia(2), Finland(2), Italy(2), Poland(2), Argentina(1), Bermuda(1), China(1), Faroe Islands(1), Iceland(1), Japan(1), Latvia(1), Lithuania(1), New Zealand(1), Qatar(1), South Africa(1), Turkey(1).
The method of sample preparation, autoclaving, for the fifth intercomparison imposed constraints that resulted in there being only two relevant determinants per sample (nitrate and nitrite in one series, and phosphate and ammonia in the other series).
A large volume of low-nutrient natural seawater was spiked with known concentrations of nutrient salt. Although the concentrations in the distributed samples covered a greater concentration range than that in the fourth intercomparison, the concentration levels were representative of the Atlantic Ocean, 1–26 μmol L-1 for nitrate and 0.08–1.85 μmol L-1 for phosphate.
There have been no further ICES intercomparison exercises since 1993.
6. QUASIMEME
The European Union (EU) supported the QUASIMEME project between 1993 and 1995. Its aim was to develop a holistic quality assurance programme for marine environmental monitoring information in Europe. As a result of this pioneering project a marine network and laboratory performance studies have been established for most of the determinants measured in the marine environmental programmes for both monitoring and research purposes. The nutrient part of QUASIMEME was entirely based on the groundbreaking work of ICES experts and the principles and methodology described above were used. The project proved that laboratories which followed on a regular basis the learning programmes and the laboratory testing schemes improved the quality of their data. (Should some results i.e. interlaboratory variability be added?)
After the end of the EU funding in 1995, the QUASIMEME scheme continued on subscription basis. Now it is possible for any laboratory worldwide to participate (should numbers of participants be added?). QUASIMEME results have been used to assess the quality of data submitted to the marine conventions for the purpose of assessing the quality status of the marine environment.
IOCCP-JAMSTEC 2015 Inter calibration exercise
7
7. 2000 NOAA/NRC Intercomparison
The test material distributed in this intercomparison was MOOS-1, a proposed certified reference material for nutrients in seawater (Clancy and Willie, 2004). The sample material was intended to be a certified reference material for silicate, phosphate, nitrite, and nitrate + nitrite. Participating laboratories were each sent two bottles of MOOS-1 and requested to perform duplicate analyses on each of the bottles. The prepared samples were sent to 36 participating laboratories. Thirty sets of results were returned.
The results of this intercomparison may, in several respects, have been compromised by sample homogeneity problems. The target standard deviation for measuring p-scores is too broad and does not reflect the measurement precision that can be attained.
8. 2002 NOAA/NRC Intercomparison
A further intercomparison exercise was undertaken to assess the current capabilities of a group of laboratories to quantitate orthophosphate, silicate, nitrite, and nitrite + nitrate in a seawater sample. This was the second such exercise sponsored by the NOAA Center for Coastal Monitoring and Assessment (CCMA) and coordinated by the Institute for National Measurement Standards of the National Research Council of Canada. Two seawater samples — one from Pensacola Sound, FL, and a proposed certified reference material for nutrients in seawater (MOOS-1) — were distributed to 31 laboratories.
Twenty-four laboratories submitted data. Methodologies were not prescribed to the participants; however, all reported results were obtained using traditional colorimetric procedures. Generally, satisfactory agreement among participants was achieved, with results within 10% of the assigned mean values.
The results from this exercise suggest that the homogeneity problem identified in the first NOAA/NRC intercomparison exercise was overcome, although the orthophosphate data indicate a larger inter-laboratory spread of results than expected.
Results for silicate, nitrite, and nitrite + nitrate in the distributed seawater samples were acceptable for the majority of the participants and generally deviated <±10% from the assigned mean. All laboratories used methodology based on colorimetric principles.
9. 2003 MRI Intercomparison
Autoclaved natural seawater was prepared for inter-laboratory comparison study samples. Sample homogeneity was confirmed by repeatability of measurement. Sets of 6 samples covering a concentration range greater than that in previous inter-laboratory comparison study were distributed. The concentrations were 0–38 μmol kg-1 for nitrate, 0–0.9 μmol kg-1 for nitrite, 0–2.7 μmol kg-1 for phosphate, and 0–136 μmol kg-1 for silicate. A total of 18 sets of samples were distributed to 18 laboratories in 5 countries. Results were returned by 17 laboratories in 5 countries. Although consensus

IOCCP-JAMSTEC 2015 Inter calibration exercise
8
concentrations were obtained for the 6 samples, the standard deviations were 4.5 times and more than 10 times greater than those of the homogeneities for phosphate and silicate, respectively. For nitrate, the standard deviations were only about double the homogeneities. These results indicate that variability in in-house standards of the participating laboratories – rather than analytical precision – is the primary source of inter-laboratory discrepancy. Therefore use of a certified RMNS is essential for establishing nutrient data sets that can be compared across laboratories, especially for silicate and phosphate.
10. 2006 MRI Intercomparison
Autoclaved natural seawater was used for an inter-laboratory comparison study for a reference material for nutrients in seawater in 2006, similar to the 2003 intercomparison exercise. Sample homogeneity was confirmed by repeatability of measurement and those for nitrate, phosphate and silicate were 0.2%, 0.3% and 0.2%, respectively. Sets of 6 samples covering a concentration range of 0.1–42.4 μmol kg-1 for nitrate, 0.0–0.6 μmol kg-1 for nitrite, 0.0–3.0 μmol kg-1 for phosphate, and 1.7–156.1 μmol kg-1 for silicate were prepared. A total of 55 sets of samples were distributed to 55 laboratories in 20 countries. Results were returned by 52 laboratories from 19 countries.
11. 2008 MRI Intercomparison
Autoclaved natural seawater was used for the next inter-laboratory comparison study for a reference material for nutrients in seawater in 2008, just as in 2003 and 2006. A total of 58 sets of samples were distributed to 58 laboratories in 20 countries. Results were returned by 52 laboratories from 19 countries.
Two of 6 samples used in 2008 I/C study were the same lots as used in the 2006 I/C study, therefore we can see internal comparability at each laboratory who participated both in the 2006 and 2008 studies as well as the international comparability of the nutrients data among the participating laboratories.
12. 2012 MRI Intercomparison
Autoclaved natural seawater was used for the next inter-laboratory comparison study for a reference material for nutrients in seawater in 2008, just as in 2003 and 2006. A total of 69 sets of samples were distributed to 69 laboratories in 28 countries. Results were returned by 67 laboratories in 28 countries.
Sample #1 used in 2012 I/C study were the same lots as used in the 2006 and 2008I/C study. Sample #2 used in 2012 I/C study were the same lots as used in the 2006 I/C study and sample #3 used in 2012 I/C study were the same lots as used in the 2008 I/C study, respectively. Therefore we can see internal comparability at each laboratory who participated in the previous I/C studies as well as the international comparability of the nutrients data among the participating laboratories.
IOCCP-JAMSTEC 2015 Inter calibration exercise
9
Results of internal comparability showed that our community have good internal comparability, but less external comparability.
IOCCP-JAMSTEC 2015 Inter calibration exercise
ISBN 978-4-901833-23-3


![Michio Kaku [cr] (por: carlitosrangel)](https://img.pdfslide.net/doc/110x75/55a921c01a28ab795a8b4814/michio-kaku-cr-por-carlitosrangel.jpg)