Embed Size (px)
Citation preview

June 2016

Southeast Multifamily Market Assessment 2
Report Authors
Abby Fox, Policy Manager
Ashley Fournier, Director of Operations
About the Southeast Energy Efficiency Alliance (SEEA)
The Southeast Energy Efficiency Alliance (SEEA) is one of six regional energy efficiency organizations in the
United States working to transform the energy efficiency marketplace through collaborative public policy,
thought leadership, outreach programs and technical advisory services. SEEA promotes energy efficiency
as a catalyst for economic growth, workforce development and energy security across 11 southeastern
states. These states include Alabama, Arkansas, Florida, Georgia, Kentucky, Louisiana, Mississippi, North
Carolina, South Carolina, Tennessee and Virginia.
For additional information, visit www.seealliance.org.
Acknowledgements
Support for this report is provided by the John D. & Catherine T. MacArthur Foundation. The authors
would like to thank the many organizations and individuals who provided input and expertise to help
create this report. These include Lauren Ross, the American Council for an Energy-Efficient Economy;
Kristofor Anderson, the Georgia Environmental Finance Authority; Alex Trachtenberg, Southface Energy
Institute; Jaclyn Mothupi and Margaret Joyce, Tennessee Department of Environment and Conservation;
Bill Bullock, Memphis Light, Gas and Water; Kevin McCarthy, Florida Housing Finance Corporation; and
Dana Bartolomei, National Housing Trust.
We also thank the SEEA staff who contributed to reviewing the report and preparing it for publication,
including Meghan Joyce, Judy Knight and Lauren Westmoreland.

Southeast Multifamily Market Assessment 3
Contents
Executive Summary ....................................................................................................................................... 4
Introduction .................................................................................................................................................. 5
Multifamily Construction Market Analysis ................................................................................................... 6
A. Methodology ..................................................................................................................................... 6
B. Multifamily Building Stock Characteristics ........................................................................................ 7
C. Multifamily Building Location ............................................................................................................ 7
D. Multifamily Construction Starts ...................................................................................................... 10
E. Size of Multifamily Projects ............................................................................................................. 11
F. Value of Multifamily Projects .......................................................................................................... 13
G. Regional Multifamily Trends and Opportunities ............................................................................. 14
Utility Multifamily Energy Efficiency Programs .......................................................................................... 16
A. Unique Challenges within the Multifamily Housing Sector ............................................................. 16
B. Program Growth: Driving Forces ..................................................................................................... 17
C. Program Service ............................................................................................................................... 17
D. Characterization of Southeastern, Utility-Administered Multifamily Energy Efficiency Programs. 19
E. Program Characteristics .................................................................................................................. 20
Case Study: Duke Energy’s Multifamily Energy Efficiency Program ....................................................... 21
Case Study: MLGW’s Energy Advantage Apartments Program .............................................................. 23
National, State and Local Multifamily Initiatives ........................................................................................ 24
A. Financing .......................................................................................................................................... 24
B. Supporting Tools .............................................................................................................................. 26
Case Study: Florida’s Multifamily Energy Retrofit Program ................................................................... 28
Findings and Conclusions ............................................................................................................................ 30
References .................................................................................................................................................. 32
Appendix A .................................................................................................................................................. 34
Appendix B .................................................................................................................................................. 40
Appendix C .................................................................................................................................................. 45

Southeast Multifamily Market Assessment 4
Executive Summary
In the southeastern United States, more than seven million housing units, representing nearly a quarter
of the region’s housing stock, are multifamily construction. Constituting such a sizable share of the
region’s housing market, multifamily housing presents a clear and significant opportunity to capture
energy savings.
To most effectively leverage these energy efficiency opportunities, it is important to understand the
current state of the multifamily housing market in the Southeast, and the programs and resources
available throughout the region for addressing multifamily building efficiency. The Southeast Energy
Efficiency Alliance (SEEA) has prepared this assessment of the Southeast’s multifamily sector to better
understand the current stock of multifamily units; regional and state multifamily construction trends;
utility multifamily energy efficiency programs; and state and local policies and programs focused on the
multifamily sector.
Building Stock and Construction Trends
Of the more than 7.46 million multifamily housing units in the Southeast, 86 percent are located in
metropolitan areas. From 2005 to 2015, the number of multifamily building renovations undertaken
exceeded new multifamily construction in the majority of southeastern states. However, new
construction multifamily projects accounted for most of the total project area. Additionally, while
multifamily construction projects only represented six percent of the total number of construction
projects undertaken during this time period, they made up the single largest percentage of construction
projects based on dollar value, with a total project value of $97 billion.
Utility Energy Efficiency Programs
While much progress has been made to address energy efficiency in single-family residential and
commercial properties, standalone multifamily energy efficiency programs are just beginning to emerge
in the Southeast. Utility programs addressing multifamily housing tend to be most active in dense urban
areas. Of the ten largest MSAs in the Southeast – many of which have a high prevalence of multifamily
properties – the majority remain unserved by standalone multifamily programs. This indicates a significant
opportunity to tap into multifamily housing as a new source of energy savings.
This assessment includes case studies that provide illustrative examples of utility energy efficiency
programs focused on multifamily buildings, including Duke Energy’s Multifamily Energy Efficiency Program
and Memphis Light, Gas and Water’s (MLGW) Energy Advantage Apartments Program.

Southeast Multifamily Market Assessment 5
State and Local Policies and Initiatives
A number of state and local policies and programs can be leveraged to support investment in multifamily
energy efficiency programs. These include financing programs such as tax credit allocations, Property
Assessed Clean Energy (PACE) and loan programs. Other supporting resources include energy
performance benchmarking and voluntary energy savings programs. Additionally, a case study from
Florida’s Multifamily Energy Retrofit Program provides an example of how multiple actors can
collaboratively design, develop and operate a multifamily program within a state.
Opportunities
This assessment report is a starting point – one that SEEA hopes will help to inform future research and
analysis on the Southeast’s multifamily market. Its conclusions identify areas for potential further
assessment, including the efficiency of the Southeast’s multifamily buildings; the scope, design and
effectiveness of multifamily energy efficiency programs; financing mechanisms to address energy
efficiency in multifamily buildings; and other successful models of collaboration among the multiple actors
involved in multifamily energy efficiency efforts.
Introduction
Nearly a quarter of the Southeast’s housing stock is classified as multifamily housing, or residences with
five or more housing units. Largely concentrated in urban areas, these structures reflect elements of both
commercial and residential buildings, and can be quite complex in terms of their ownership, financing
structures, and energy usage and billing. For these reasons, the Southeast’s multifamily building stock has
remained a largely untapped source of energy savings. In recent years, as the Southeast’s energy
efficiency marketplace has continued to mature, interest in better serving the multifamily sector and
capturing the significant energy savings opportunity it promises has grown. As a result, utilities, state
agencies, NGOs and the private sector continue to expand programming that targets multifamily
dwellings.
The purpose of this report is to assess the current stock of multifamily buildings in the Southeast, analyze
growth in multifamily construction and major renovation projects, and identify opportunities to tap into
the energy savings available within this sector through various programmatic offerings.
This assessment report is a “first step” and is intended as a starting point for further research and
discussion.

Southeast Multifamily Market Assessment 6
Multifamily Construction Market Analysis
A. Methodology
To develop a comprehensive picture of the multifamily sector and the current state of energy efficiency
programs and initiatives targeting multifamily buildings, SEEA analyzed data in three areas: building stock,
utility energy efficiency programs, and state and local policies and initiatives. Based on this analysis, we
have highlighted areas with significant opportunity to address energy efficiency in multifamily buildings.
The geographic scope of this assessment is SEEA’s eleven-state region, which includes the following states:
Alabama, Arkansas, Florida, Georgia, Kentucky, Louisiana, Mississippi, North Carolina, South Carolina,
Tennessee and Virginia.
This report analyzes the following aspects of the multifamily sector:
1. Building Stock
SEEA collected information on multifamily buildings from two sources:
SEEA utilized data from the U.S. Census American Community Survey to identify the
existing multifamily building stock and its characteristics.
SEEA utilized data from CMD Group to identify multifamily building construction trends
from 2005 to 2015.
2. Utility Energy Efficiency Programs
SEEA obtained information on utility-administered multifamily programs primarily from public
service commission filings, supplemented by aggregated data from E Source’s DSM Insights
database. In addition, SEEA gathered program-specific information from phone interviews with
program administrators.
3. State and Local Policies and Initiatives
Much of this information was sourced from the SEEA staff who have engaged directly in state and
local policy work. SEEA gathered additional detailed information from state agency and program
administrator interviews, as well as from existing studies and reports.
The U.S. Department of Housing and Urban Development and the Federal Housing Finance Agency define
multifamily housing as a residence consisting of more than four dwelling units (HUD 2016). The definition
used by these entities aligns with lending regulations that require residential financing for buildings with
one to four units and commercial financing for buildings with five or more units. For the purposes of this
assessment, multifamily housing is defined as a building with more than one dwelling unit. Two- to four-
unit structures have been broken out separately in this report as a comparison for larger multifamily
structures and to differentiate them from one-unit, single-family attached or detached structures.
Southeast Multifamily Market Assessment 7
B. Multifamily Building Stock Characteristics
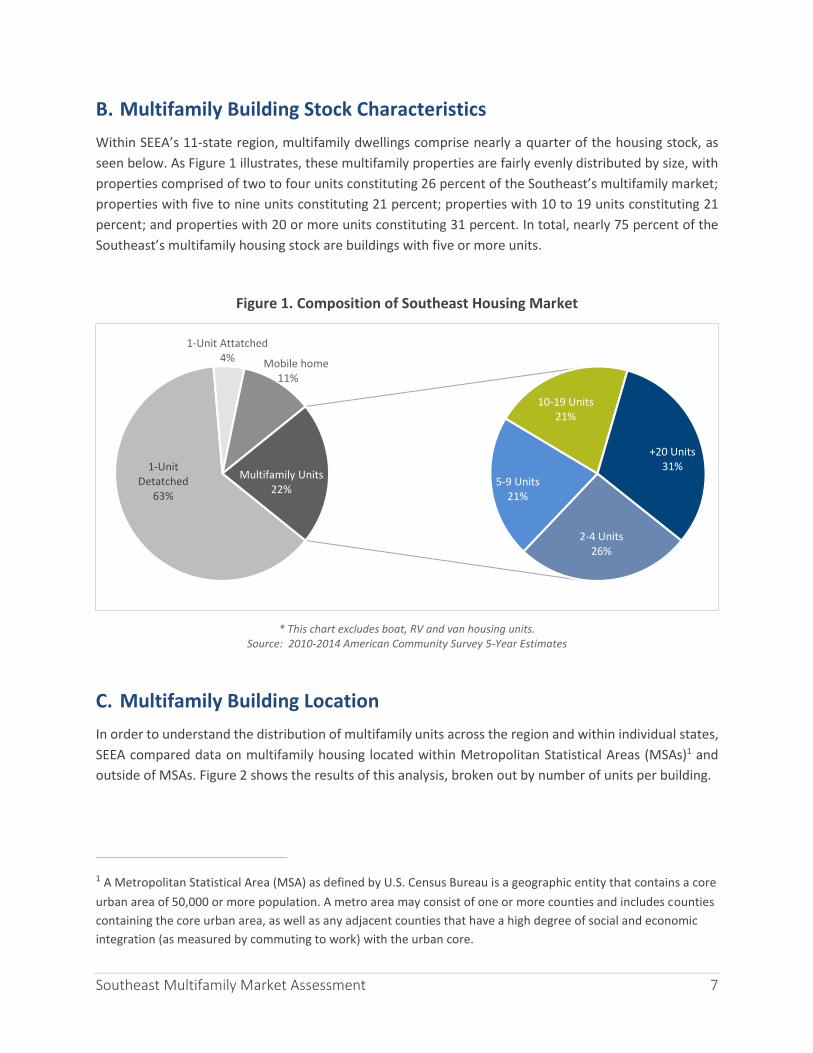
Within SEEA’s 11-state region, multifamily dwellings comprise nearly a quarter of the housing stock, as
seen below. As Figure 1 illustrates, these multifamily properties are fairly evenly distributed by size, with
properties comprised of two to four units constituting 26 percent of the Southeast’s multifamily market;
properties with five to nine units constituting 21 percent; properties with 10 to 19 units constituting 21
percent; and properties with 20 or more units constituting 31 percent. In total, nearly 75 percent of the
Southeast’s multifamily housing stock are buildings with five or more units.
Figure 1. Composition of Southeast Housing Market
* This chart excludes boat, RV and van housing units. Source: 2010-2014 American Community Survey 5-Year Estimates
C. Multifamily Building Location
In order to understand the distribution of multifamily units across the region and within individual states,
SEEA compared data on multifamily housing located within Metropolitan Statistical Areas (MSAs)1 and
outside of MSAs. Figure 2 shows the results of this analysis, broken out by number of units per building.
1 A Metropolitan Statistical Area (MSA) as defined by U.S. Census Bureau is a geographic entity that contains a core
urban area of 50,000 or more population. A metro area may consist of one or more counties and includes counties
containing the core urban area, as well as any adjacent counties that have a high degree of social and economic
integration (as measured by commuting to work) with the urban core.
1-Unit Detatched
63%
1-Unit Attatched4% Mobile home
11%
2-4 Units26%
5-9 Units21%
10-19 Units21%
+20 Units31%
Multifamily Units22%

Southeast Multifamily Market Assessment 8
Figure 2. Location of Multifamily Housing Units by Number of Units
Source: 2010-2014 American Community Survey 5-Year Estimates
The vast majority of the Southeast’s multifamily units (86 percent) are situated in metropolitan areas. As
the number of units per property increases, this distinction becomes increasingly apparent: properties
with more units tend to be found in population-dense urban areas. As a result, on a localized basis,
multifamily housing can be a fairly significant component of the building stock. This is reflective of national
trends; according to the 2013 American Housing Survey, over 95 percent of multifamily buildings are
located in metropolitan areas, while only two percent of households living in buildings with 50 or more
units are located outside of metropolitan areas (Ross et al. 2016).
There are several factors that may contribute to the higher number of large multifamily buildings in
metropolitan areas, including the availability and cost of land for development, proximity to infrastructure
and other businesses, and zoning regulations.
There are 113 MSAs in the Southeast. Table 1 shows the number of total housing units, multifamily units
and the percentage of multifamily units for the 25 metropolitan areas in the Southeast with the largest
multifamily housing markets.
Data for all metropolitan areas in the Southeast can be found in Table A1 in Appendix A.
- 2 4 6
2 to 4 units
5 to 9 units
10 to 19 units
20 or more units
Total Multifamily Units
Millions
Outside MSA Inside MSA

Southeast Multifamily Market Assessment 9
Table 1. Top 25 Southeastern Metropolitan Areas with the Largest Multifamily Housing
Markets
Geography Total Housing
Units Multifamily
Units Percent of
Multifamily Units
1 Naples-Immokalee-Marco Island, FL Metro Area
199,818 97,253 49%
2 Miami-Fort Lauderdale-West Palm Beach, FL Metro Area
2,475,877 1,137,300 46%
3 Gainesville, FL Metro Area 120,574 41,910 35%
4 Greenville, NC Metro Area 75,844 24,851 33%
5 Panama City, FL Metro Area 109,023 32,474 30%
6 Myrtle Beach-Conway-North Myrtle Beach, SC-NC Metro Area
268,415 77,685 29%
7 Athens-Clarke County, GA Metro Area 82,159 23,581 29%
8 New Orleans-Metairie, LA Metro Area 550,248 154,987 28%
9 Tampa-St. Petersburg-Clearwater, FL Metro Area
1,362,891 380,858 28%
10 Cape Coral-Fort Myers, FL Metro Area 372,769 103,513 28%
11 Orlando-Kissimmee-Sanford, FL Metro Area
955,148 264,851 28%
12 Lexington-Fayette, KY Metro Area 212,020 57,960 27%
13 Durham-Chapel Hill, NC Metro Area 227,389 61,076 27%
14 Crestview-Fort Walton Beach-Destin, FL Metro Area
139,731 37,505 27%
15 Tallahassee, FL Metro Area 164,135 42,243 26%
16 Sebastian-Vero Beach, FL Metro Area 76,786 19,488 25%
17 Tuscaloosa, AL Metro Area 103,348 25,877 25%
18 Virginia Beach-Norfolk-Newport News, VA-NC Metro Area
696,858 173,116 25%
19 Daphne-Fairhope-Foley, AL Metro Area 105,563 26,220 25%
20 Atlanta-Sandy Springs-Roswell, GA Metro Area
2,189,138 542,955 25%
21 North Port-Sarasota-Bradenton, FL Metro Area
404,534 99,469 25%
22 Jacksonville, FL Metro Area 606,085 148,996 25%
23 Columbus, GA-AL Metro Area 130,160 31,844 24%
24 Auburn-Opelika, AL Metro Area 64,258 15,619 24%
25 Port St. Lucie, FL Metro Area 215,521 50,755 24%
Source: 2014 American Community Survey

Southeast Multifamily Market Assessment 10
D. Multifamily Construction Starts
From 2005 to 2015, the number and type of multifamily construction projects in the Southeast fluctuated
due to a number of contributing factors. Over this ten-year period, of the 10,298 multifamily construction
projects, 48 percent were new construction and 52 percent were renovations. Figure 3 shows the total
number of multifamily new construction and renovation projects in all 11 states in the Southeast from
2005 to 2015.2 From 2005 to 2008, new construction projects outnumbered renovation projects.
However, in 2009, the number of new construction projects began to decline and in 2011, both new
construction and renovation of multifamily housing reached a ten-year low. As the construction market
recovered over the 2011 to 2015 timeframe, the relative percentage of renovations overtook new
construction as the dominant force within the multifamily market. In 2005, renovations represented only
35 percent of the multifamily market, while in 2015, this number had risen to 60 percent.
In general, over the ten-year period from 2005 to 2015, most states saw more multifamily renovation
projects than new construction. There are exceptions to this, including the high-growth states of Florida,
North Carolina and Virginia, which in total experienced more new construction multifamily projects as
opposed to renovations.
Figure 3. Multifamily Building Construction Starts (2005-2015)
*Data labels represent total number of new construction and renovation projects
Source: Construction Market Data Group LLC
2 For purposes of this paper, SEEA defines “the Southeast” as the states of Alabama, Arkansas, Florida, Georgia, Kentucky, Louisiana, Mississippi, North Carolina, South Carolina, Tennessee and Virginia.
960 983
1095
880 902955
679
885948
1072
939
0
200
400
600
800
1000
1200
2005 2006 2007 2008 2009 2010 2011 2012 2013 2014 2015
New Renovation

Southeast Multifamily Market Assessment 11
On a state-by-state level, multifamily construction tends to loosely reflect both population and population
density trends, with a heavier presence of multifamily construction in more populous and population-
dense states. For a comparison of multifamily project starts to state population density see Table A2 in
Appendix A.
Finally, when comparing the total number of construction starts to all other construction starts from
2005 to 2015, multifamily projects make up a relatively small portion (six percent) of projects, as
illustrated in Figure 4. However, as described in the section that follows, the relative scale of these
projects is quite significant.
Figure 4. Southeastern Construction Starts by Building Type (2005 – 2015)
Source: Construction Market Data Group LLC *Other category includes building sectors with project values less than three percent of the total construction
starts. This includes: Warehouses, Religious, Fire and Police Stations, Military, Medical Misc. Libraries, Museums, Transportation Terminals, Prisons, Special, Vocational, Hotels, Courthouses, Nursing, Homes, Sports Arenas,
Convention Centers, Parking Garages, Laboratory, Manufacturing.
E. Size of Multifamily Projects
From 2005 to 2015, the more than ten thousand multifamily projects in the Southeast accounted for
nearly 830 million square feet of project space. The average southeastern multifamily project during this
period was 152,010.52 sq. ft.
Other*22%
K-12 Schools 17%
Shopping15%
Government Offices11%
College, University9%
Retail Misc.7%
Amusement6%
Multifamily6%
Hospitals, Clinics4%
Offices, 3%

Southeast Multifamily Market Assessment 12
Table 2 shows the breakdown of project area by renovation and new construction projects. The total
project area of multifamily construction projects is 829.52 million square feet. New construction projects
account for 98 percent of the total project area, at 818.17 million square feet. The average area of new
multifamily projects is 164,342.32 square feet, and the average area of multifamily renovation projects is
22,621.02 square feet. This indicates that new construction multifamily projects are typically much larger
than renovation projects in terms of project area.
Table 2. Multifamily Construction Project Area (2005-2015)
Construction Type Total Project Area
(million sq. ft.) Total Number of
Construction Starts Average Project Area
(sq. ft.)
New 818.71 4,980 164,342.32
Renovation 10.81 5,318 22,621.02
Grand Total 829.52 10,298 152,010.52
Source: Construction Market Data Group LLC *Project area data is only available for half of all projects completed during this time period. The average project
area is the average of those projects that have reported project area values and not of the total number of projects.
Table 3 shows the top five building types with the highest total project area from 2005 to 2015, including
both new construction and renovation projects. New multifamily construction projects make up the
majority of that total project area. As noted in the previous section, multifamily projects make up a
relatively small number of projects overall; however, these projects tend to be large in size.
Table 3. Top 5 Building Types with Highest Total Project Area (2005-2015)
Building Types New Construction Total Project Area
(millions sq. ft.)
Renovation Total Project Area
(millions sq. ft.)
Total Project Area (millions sq. ft.)
Multi-Family 818.71 10.81 829.52
Shopping 482.91 17.01 499.92
Manufacturing 254.52 5.40 259.92
Offices 254.42 8.71 263.13
Warehouses 232.15 10.38 242.53
Source: Construction Market Data Group LLC

Southeast Multifamily Market Assessment 13
F. Value of Multifamily Projects
Project value is a combination of numerous inputs, including the of cost of materials installed or erected,
construction labor, equipment rental, architectural and engineering work, contractor overhead, and
interest and taxes paid during construction. Table 4 shows the breakdown of project value for multifamily
renovation and new construction projects. The average project value per project of new multifamily
projects is $18.08 million, and the average value per project of multifamily renovation projects is $4.10
million. In total, the project value of new construction projects is more than 12 times greater than the
total project value of renovation projects. In fact, of the more than $97 billion in project value generated
by multifamily construction projects, new construction projects account for 92 percent, while renovations
account for only eight percent.
These numbers indicate that renovations have a lower average project value, tend to be smaller than new
construction and generate lower total project values. New construction multifamily projects have a higher
average project value, tend to be much larger and generate higher total project values when compared
with renovation projects.
Table 4. Multifamily Project Value (2005 – 2015)
Project Type Total Project
Area (millions sq. ft.)
Total Number of Projects
Total Project Value
(millions of $)
Average Project Value Per
Project (millions of $)
New 818.71 4,980 $90.04 $18.08
Renovation 10.81 5,318 $7.37 $4.10
Grand Total 829.52 10,298 $97.41 $16.86
Source: Construction Market Data Group LLC *Project area data is only available for half of all projects completed during this time period. The average project
area is the average of those projects that have reported project area values and not of the total number of projects.
Recognizing that the majority of project value for multifamily projects comes from new construction, SEEA
analyzed how new construction multifamily project values compare to new construction projects within
other building types. Figure 5 shows the total value of new construction projects from 2005 to 2015.
Multifamily projects in the Southeast represent the largest percentage (22 percent) of total project value
compared to other building types. This is significant in terms of the impact that multifamily new
construction can have on the overall construction market in the Southeast.

Southeast Multifamily Market Assessment 14
Figure 5. Southeast New Construction Project Value by Building Type (2005 – 2015)
Source: Construction Market Data Group LLC *Other category includes building sectors with project values less than three percent of the total project value. This
includes: transportation terminals, miscellaneous retail, religious, miscellaneous medical, nursing homes, sports arena/convention centers, libraries/museums, prisons, parking garages, fire and police stations, courthouses,
vocational, and industrial/school laboratories.
G. Regional Multifamily Trends and Opportunities
The data currently available on the building stock and construction activity in the multifamily sector can
help to articulate both trends and opportunities going forward. A variety of stakeholders, including state
and local governments agencies, nonprofit organizations, utilities and energy efficiency program
administrators can use this information to inform their activities in the multifamily sector in the Southeast.
Trends
Size of Multifamily Housing Market
o Multifamily dwellings account for nearly a quarter of the total housing market in the
Southeast.
Location of Multifamily Buildings
o The majority of multifamily buildings tend to be concentrated in the Southeast’s major
metropolitan areas.
Other*32%
Multi-Family22%
K-12 Schools12%
Shopping9%
Offices7%
Hospitals, Clinics6%
College, University5%
Amusement3%
Government Offices
2%Retail. Msc.
2%

Southeast Multifamily Market Assessment 15
o In metropolitan areas, multifamily buildings with 20 or more units are the most common
multifamily building type.
Number of Multifamily Construction Projects
o Compared to other building types, multifamily building projects make up six percent of
overall commercial building construction projects from 2005 to 2015.
o In most southeastern states and the region overall, there have been more total
multifamily renovation projects than new construction projects. Exceptions include
Florida, North Carolina and Virginia, in which in there have been more new construction
multifamily projects than renovations.
Size of Multifamily Construction Projects
o Despite making up a small percentage of overall projects, multifamily buildings are large
in size and account for the largest percentage of overall project area generated from
commercial building construction projects from 2005 to 2015.
o On average, new construction multifamily projects are larger than multifamily
renovations and account for the majority of construction area addressed from 2005 to
2015.
Project Value of Multifamily Construction Projects
o Multifamily construction projects have generated the highest percentage of total project
value compared to all other commercial building types.
o New construction multifamily projects have generated more than 90 percent of the total
project value for multifamily projects from 2005 to 2015.
Opportunities
Utilities and Program Administrators
o New construction multifamily projects offer an opportunity to promote the inclusion of
specific energy-efficient technologies and measures or going beyond the requirements of
the standard building energy code.
o Existing civic and industry infrastructure in major cities can simplify the program
marketing and outreach process for multifamily energy efficiency programs.
o Interacting with multifamily owners and developers within a property’s lifecycle can
ensure that owners and developers are engaged when making renovation decisions.

Southeast Multifamily Market Assessment 16
State and Local Government Agencies and Other Organizations
o Resources and incentives can be helpful in addressing energy efficiency in multifamily
buildings. Focusing on metropolitan areas will provide the greatest opportunity and
highest concentration of multifamily buildings.
The section that follows builds from this analysis, providing an overview of the programs and resources
that exist to support energy efficiency in the Southeast’s multifamily building stock.
Utility Multifamily Energy Efficiency Programs
A. Unique Challenges within the Multifamily Housing Sector
Southeastern utilities have historically targeted single-family residences in developing programmatic
offerings for their residential customers. While multifamily housing represents 22 percent of housing in
the region, as noted above, there are a number of unique structural, financial and technical factors that
have contributed to the scarcity of programs targeting multifamily properties, including the following:
The dual nature of multifamily housing, which embodies characteristics of both commercial and
residential buildings;
The “split incentive” issue in which building owners and managers pay the costs of energy
efficiency upgrades, while tenants largely reap the utility bill savings;
Lack of publicly accessible whole-building data on tenant energy use and savings; and
Complex building ownership and management structures.
An additional complicating factor is the diverse composition of the multifamily market, which
encompasses rental units and owned units, as well as market-rate, subsidized and public housing. Policies
supporting energy efficiency within each of these sub-sectors may vary, be structured differently and
involve different market actors.
Given the fragmented nature of the multifamily housing sector and the variability of local market
conditions, utility-administered multifamily programs vary significantly. Research by the American Council
for an Energy-Efficient Economy (ACEEE) has distilled this spectrum down to a handful of program types,
as described below.
Direct installation of no-cost energy efficiency measures such as lighting, weather stripping, and
faucet aerators;
Equipment and product rebates or incentives for the purchase and installation of energy-efficient
equipment such as HVAC systems, appliances, insulation and water heating systems;
Whole building programs for new construction and comprehensive retrofits—often involving
additional work beyond energy upgrades—that provide incentives for all cost-effective energy
efficiency measures identified by energy audits or modeling (Johnson and Mackres 2013).

Southeast Multifamily Market Assessment 17
In addition to the diversity in program type, utility energy efficiency programs may be focused on one or
multiple sub-sectors within the multifamily market. For instance, some may focus on buildings that house
low-income residents.
B. Program Growth: Driving Forces
A 2013 ACEEE assessment of the 50 metropolitan statistical areas (MSAs) with the largest multifamily
housing markets reported that of the southeastern MSAs included (Miami, Cape Coral-Fort Myers,
Jacksonville, Orlando, Tampa, Louisville, Richmond, Virginia Beach, Charlotte, Memphis, Nashville, Raleigh
and Atlanta), only Raleigh and Charlotte were served by a standalone utility program targeting the
multifamily sector (Johnson and Mackres 2013). In this assessment, SEEA revisited ACEEE’s analysis,
finding that utility interest in the savings potential of the region’s multifamily building stock has grown in
the intervening year. In 2016, of these cities, multifamily program offerings were available in Orlando,
Charlotte, Memphis and Raleigh.
In general, this expansion reflects the increase in multifamily housing activity discussed above, as well as
the ramp up of energy efficiency as a resource within southeastern utility portfolios. Over the past decade,
utilities in the Southeast have committed $611 million in ratepayer dollars to energy efficiency programs
– an increase of 279 percent (SEEA 2015). As this trend continues, multifamily housing represents an
important and largely untapped source of cost-effective savings.
In addition, there is a growing recognition throughout the region of the need to make programs accessible
to all customer classes, including those that have been traditionally underserved. The multifamily market
represents an opportunity to reach these customers. In general, rental properties tend to touch lower
income or housing cost-burdened individuals. In 2013, nearly half of renters had housing cost burdens,
spending at least 30 percent of their income on housing, with more than a quarter of the renters spending
more than 50 percent of their income on housing (JCHS 2015). In addition, from 2007 to 2011, 45 percent
of rentals in the nation’s largest cities were located in low-income neighborhoods (JCHS 2013). These
statistics indicate that multifamily energy-efficiency programs may have a significant role to play in
addressing accessibility of energy efficiency programs to low-income residents.
C. Program Service
In general, southeastern utility programs addressing multifamily housing tend to be most active in denser
urban areas. Of the ten largest MSAs in the Southeast – many of which have a high prevalence of
multifamily properties – the majority remain unserved by multifamily programs. This indicates a
significant opportunity to tap into new sources of energy savings through the multifamily market.

Southeast Multifamily Market Assessment 18
Table 8. Utility-Administered Multifamily Programs Serving Southeastern MSAs
Southeast Rank (Size)
Metro Area Geography
Percent of Total Multifamily
Housing Units Utility Serving MSA
Standalone Multifamily Program?
1 Miami-Fort
Lauderdale-West Palm Beach, FL
46% Florida Power and Light,
TECO, People’s Gas No
2 Atlanta-Sandy Springs-
Roswell, GA 25%
Georgia Power, various gas companies
No3
3 Tampa-St. Petersburg-
Clearwater, FL 28%
TECO, People’s Gas, Duke Energy Florida
No
4 Orlando-Kissimmee-
Sanford, FL 28%
Orlando Utilities Commission, Kissimmee Utility Authority, Duke
Energy Florida
No
5 Charlotte-Concord-
Gastonia, NC-SC 20%
Duke Energy Carolinas, Piedmont Natural Gas
Yes
6 Nashville-Davidson--
Murfreesboro--Franklin, TN
23% Nashville Electric Service,
Atmos Energy No
7 Virginia Beach-Norfolk-Newport News, VA-NC
25% Dominion, Virginia
Natural Gas No
8 Jacksonville, FL 25% JEA, TECO, People’s Gas No
9 Memphis, TN-MS-AR 23% Memphis Light, Gas and
Water; Entergy Mississippi
Yes
10 New Orleans-Metairie,
LA 28%
Entergy New Orleans, Energy Louisiana, Atmos
Energy Yes
Source: 2014 American Community Survey
3 As noted above, Georgia Power does not offer a standalone multifamily program; however, both the Home Energy Improvement Program EarthCents New Home Program offer multifamily tracks.

Southeast Multifamily Market Assessment 19
D. Characterization of Southeastern, Utility-Administered Multifamily
Energy Efficiency Programs
SEEA limited the scope of this assessment to multifamily offerings filed as standalone programs in both
program planning and reporting. However, as discussed below, some multifamily efforts administered as
“tiers” within other programs provide at least some level of service to MSAs with high concentrations of
multifamily housing stock.
SEEA’s research identified the following utility-administered multifamily programs operating across the
Southeast in 2016:
Table 9. Utility-Administered Multifamily Energy Efficiency Programs
State Utility Program Program
Type
Year
Program
Began
Measures
Arkansas Entergy
Arkansas
Entergy
Solutions for
Multifamily
Direct Install 2011 Efficient light bulbs,
showerheads, and faucet
aerators, advanced power
strips, central AC tune-up;
wall insulation, ceiling
insulation, air infiltration,
duct sealing, water heater
jackets and pipe insulation
Arkansas Oklahoma
Gas and
Electric
Company
Multi-Family
Direct Install
Program
Direct Install 2011 CFL’s, advanced power
strips (“APS”), low-flow
showerheads, faucet
aerators, duct sealing, and
air sealing
Florida Gulf Power Landlord-
Renter
Custom
Incentive
Equipment
Rebates
2010
(renamed
in 2015)
Applicable residential DSM
measures from other
programs; custom measures
meeting the objectives of
the program
Kentucky Duke Energy
Kentucky
Multifamily
Energy
Efficiency
Program
Direct Install 2012 Lighting and water
measures (bath and kitchen
faucet aerators, water
saving showerheads and
pipe wrap)

Southeast Multifamily Market Assessment 20
Louisiana Entergy New
Orleans
Energy
Smart for
Multifamily
Direct
Install/
Prescriptive
2017 Efficient light bulbs,
showerheads, and faucet
aerators, advanced power
strips, Central AC tune-up;
wall insulation, ceiling
insulation, air infiltration,
duct sealing, water heater
jackets and pipe insulation
Mississippi Atmos
Energy
Multi-family
Direct Install
Program
Direct Install 2014 Low flow shower heads,
aerators, pipe wrap, water
heater wraps and basic
weather-stripping (if
needed)
North
Carolina/
South
Carolina
Duke Energy
Carolinas
Multifamily
Energy
Efficiency
Program
Direct Install
2014 Lighting and water heating
low flow devices
North
Carolina/
South
Carolina
Duke Energy
Progress
Multifamily
Energy
Efficiency
Program
Direct Install 2014 Lighting and water heating
low flow devices
Tennessee Memphis
Light, Gas
and Water
Energy
Advantage
Apartments
New
Construction
2015 N/A (whole-building)
Sources: Arkansas Public Service Commission, Florida Public Service Commission, Kentucky Public Service
Commission, Entergy New Orleans website, Mississippi Public Service Commission, North Carolina Utilities
Commission, South Carolina Public Service Commission, MLGW Website, E Source DSM Insights.
See Appendix B for details.
E. Program Characteristics
While many utilities allow rebate dollars to be applied to multifamily housing stock, very few break out
multifamily vs. single-family properties in their program filings. For example, most investor-owned utilities
in Florida rebate select measures for multifamily residents, and Georgia Power allows individual units
within multifamily properties to qualify for its EarthCents New Home Program and Home Energy
Improvement Program (Georgia Power Company 2016).

Southeast Multifamily Market Assessment 21
Within ACEEE’s program classification framework, the majority of the southeastern multifamily programs
identified fall into the category of direct-install programs, while others incorporate direct-install elements.
In general, southeastern utilities have only recently begun ramping up their energy efficiency portfolios,
lagging behind those in other regions that have better developed, more comprehensive programmatic
offerings.4 Currently, many southeastern utilities offer “Quick Start” programs—proven, high-impact
programs that can be deployed quickly and help to build the infrastructure necessary for future
Comprehensive Portfolio programs (Schwimmer and Fournier 2014). While multifamily investment is
growing, it still remains a fraction of total portfolio investment. This trend is also reflected nationally.
Many of the programs identified include an educational element, where installations may be paired with
educational materials or leave-behinds to support energy-saving behaviors from individual residents.
Some programs combine multiple approaches; for instance, Entergy Arkansas offers a combination of
incentives for both direct install and prescriptive measures, as well as property owner and tenant
education, and select weatherization measures (Entergy Arkansas, Inc. 2015). Gulf Power offers significant
flexibility, inclusive of DSM measures available through other residential programs and custom measures
(Gulf Power Company 2015). Two of the programs identified address energy-saving opportunities in new-
construction multifamily properties: Georgia Power’s EarthCents New Home Program and MLGW’s Energy
Advantage Apartments Program.
Case studies on two of the Southeast’s utility-administered multifamily energy efficiency programs are
provided below.
Case Study
Duke Energy’s Multifamily Energy Efficiency Program
Program Overview
Duke Energy’s Multifamily Energy Efficiency Program has
its roots in the company’s Property Manager CFL
Program – the company’s first multifamily-specific
energy efficiency program. Launched in 2010, this
program was a strategic initiative in response to both
customer demand and the acquired knowledge of
program managers that multifamily customers represented an underserved market. Through this
program, Duke Energy recruited property managers for the program, and then shipped CFLs to the site
for installation by maintenance crews during routine in-unit visits.
After a few years, using experience of successful engagement of property managers and collected lessons
learned, Duke Energy decided to take full advantage of the multifamily opportunity to take more control
4 States like Arkansas, Florida and North Carolina prove an exception and have been offering energy efficiency programs for much longer than their regional counterparts.

Southeast Multifamily Market Assessment 22
of installation schedules while also improving quality control processes. The company also began to look
at changing its model to refine specific program design elements and to incorporate water measures. For
example, its original Property Manager CFL program relied on property maintenance staff to conduct the
installations, which generally lagged Duke Energy’s timeline. For these reasons, Duke Energy decided to
move to a direct installation approach, as described below.
Program Design
In its current form, the Multifamily Energy Efficiency Program address both lighting and water measures
through a direct installation approach implemented by a third-party vendor. This program is available to
property owners and managers within the Duke Energy service territory in the Carolinas and the Midwest.
The intake process begins with the acquisition of information about potentially eligible properties, either
through the vendor’s energy advisors research (a “bottom-up” approach), or through industry aggregators
like apartment associations, trade shows and property management companies (a “top-down” approach).
The energy advisors then make initial calls to properties, and visit the site to conduct an energy
assessment, determine eligibility and answer any questions that the property manager may have.
Upon qualification, Duke Energy provides and directly installs efficient lighting and water measures at no
direct cost. Duke Energy leverages the evaluation, measurement and verification process and customer
satisfaction surveys to gather additional feedback from property managers as well as tenants in order to
provide all stakeholders with an excellent customer experience.
Results
Duke’s multifamily programs, which began in the Carolinas, have since expanded to other markets with
an interest in better serving multifamily customers and capturing the tremendous energy-saving
opportunities within this sector. Since it began, the program has reached approximately 100,000 units in
Kentucky, North Carolina, South Carolina and Ohio.
The process of “selling” the program has not been a challenge, once property managers understand the
program is a free service offered by Duke Energy. This process must operate at multiple levels since
property managers often don’t pay the bills for in-unit electricity use and therefore program savings may
not always resonate specifically with property managers. However, in cases where the property owner
does pay the water bill, they may see a bottom-line impact. In addition to this, property owners and
managers can also benefit from reduced maintenance costs and efforts and improved customer
satisfaction by helping tenants save energy and money.
Following the “sale,” program managers and administrators have found that communicating clearly and
establishing expectations for both management and tenants have been crucial success factors.
Duke Energy also views the Multifamily Energy Efficiency Program as a relationship building block that will
assist Duke Energy in developing and providing additional offers in the future that serve the property
managers and assist the tenants in managing their energy bill.
For more information on Duke Energy’s Multifamily Energy Efficiency Program, visit
duke-energy.com/multifamily.

Southeast Multifamily Market Assessment 23
Case Study
MLGW’s Energy Advantage Apartments Program
Program Overview
Memphis Light, Gas and Water (MLGW) is the nation’s largest three-
service municipal utility, serving nearly 421,000 customers in
Memphis and Shelby County (MLGW 2016). MLGW’s service territory
is marked by high rates of poverty, which often intersects with the
high prevalence of multifamily housing (23 percent) in the Memphis
Metropolitan Statistical Area.
As one of a network of more than 150 Tennessee Valley Authority
(TVA) distributors, MLGW offers a number of TVA energy efficiency
programs. While many TVA programs are provided “out of the box,”
Energy Advantage Apartments developed organically to provide a
solution to concerns seen in the field. MLGW staff observed that, of all residential units, apartment
complexes tended to use the most energy per tenant, and that the culprit was often the use of electric
resistance heating. Electric resistance heating is relatively inefficient, and, coupled with leaky building
envelopes, it was a clear contributor to high utility bills.
Program Design
With these supporting factors, ultimately, Energy
Advantage Apartments was developed in response to
specific developer interest in applying MLGW’s EcoBUILD
new construction program to multifamily housing. MLGW
worked closely with the developer to modify EcoBUILD’s
new home program elements to more adequately address
the characteristics of multifamily housing.
Through a simulation process, MLGW identifies expected
energy usage and determines project eligibility for
incentives.
Facilities that demonstrate performance equal to or greater than current EcoBUILD standards may
qualify for incentives and certification.
All new electric apartment projects may qualify to receive the same MLGW construction
incentives as apartments that utilize gas for heat.
Qualifying units heated with heat pumps that meet EcoBUILD standards are eligible for up to $275
per unit in defraying upfront MLGW electric costs. If the units are all electric and electric
resistance heat is the primary heating source for the units, MLGW will not participate financially
in the project.
South Junction, the first development to participate in
MLGW’s Energy Advantage Apartments program.

Southeast Multifamily Market Assessment 24
With prior approval, the builder of the apartment may also be eligible for a rebate under
EcoBUILD, based on funding availability.
In addition to this new construction program, MLGW is developing an existing program tier, which will
allow for rebates for measures such as windows, insulation and HVAC equipment – especially heat pumps,
as an alternative to electric resistance heating.
Results
While full results are not yet available, preliminary data show decreased occupant turnover and an overall
high level of satisfaction for both occupants and building owners. In addition, MLGW has begun to explore
options for retrofitting existing multifamily properties, leveraging TVA rebates. While preliminary data
won’t be available until next winter, MLGW looks forward to delivering continued value to customers
through the program.
For more information, visit http://www.mlgw.com/images/content/files/pdf/EAA2.pdf.
National, State and Local Multifamily Initiatives
A variety of state and local policies can support investment in multifamily energy efficiency efforts. Within
a given state or locality, policies can exist within a variety of agencies, local governments and NGOs. In
many cases, programs may leverage incentives and infrastructure from multiple actors. Due to the limited
scope of this analysis, we have chosen to focus on a handful of key policies that drive investments in
energy efficiency in the Southeast across the market rate, subsidized and affordable housing sectors.
A. Financing
Year after year, interest continues to grow in incentives for supporting energy efficiency investments.
However, deploying private capital within the multifamily sector has been challenging, given the diverse
nature of the multifamily sector, as well as the unique timelines on which developers operate. Entities at
the national, state and local levels have stepped in to provide targeted financing programs to fill this gap,
with many notable and successful models in the Southeast.
Tax Credit Allocation
One tool that states may use to support energy efficiency in affordable multifamily housing is the Low
Income Housing Tax Credit (LIHTC) program. The LIHTC program is the largest affordable rental housing
production and preservation program in the nation and is administered jointly by the U.S. Department of
Treasury and state housing agencies (Trachtenberg et al. 2016). State housing agencies receive a fixed
share of tax credit authority each year, which they allocate to developers through a competitive process.
Federal statute provides state housing agencies wide latitude determining how to distribute tax credits to
address local housing needs. On an annual basis, state housing agencies must develop a Qualified
Allocation Plan (QAP), which sets forth the eligibility and selection criteria for distributing the tax credits.

Southeast Multifamily Market Assessment 25
Within the QAP framework, state housing agencies can encourage green building, which may include
efficient construction practices, through set-asides, targeted point allocations or threshold criteria.
According to a 2013 analysis by Global Green USA, Georgia’s QAP is consistently ranked highest in the
Southeast for prioritization of green building criteria, inclusive of energy efficiency (Fuhry 2013). Virginia’s
QAP is also widely recognized for its encouragement of energy efficiency. Developers must adhere to
rigorous standards, as well as third-party testing and inspection from EarthCraft Virginia and LEED
certification programs. A recent study conducted by Virginia Tech’s Center for Housing Research (McCoy
2015) found that units built to these standards used 40 percent less energy than housing built to meet
existing code requirements.
Property Assessed Clean Energy (PACE)
Property Assessed Clean Energy (PACE) financing supports building upgrades – often including energy
efficiency improvements – which are then repaid through an assessment on the property owner’s tax bill.
Currently, all but thre of the states in SEEA’s footprint (Mississippi, South Carolina and Tennessee) have
passed PACE-enabling legislation. Table 10 provides a summary of the PACE enabling legislation for each
Southeastern state.
Table 10. PACE-Enabling Legislation in Southeastern States
State Legislation Year Sector Targeted
Alabama SB 220 / Act No. 2015-494 2015 Commercial
Arkansas SB 640 / Act 1074 2013 Commercial
Florida
CS/HB 7179 2010 Commercial and Residential
Title XI, Chapter 163 2011 Commercial and Residential
Georgia HB 1388 2010 Commercial and Residential
Kentucky HB 100 2015 Commercial
Mississippi No PACE Enabling Legislation
Louisiana
HB 973 / Act No. 611 2010 Commercial
SB 224 2009 Commercial
North Carolina
SB 284 2015 Commercial
N.C. Gen. Stat. § 153A-210.1, et seq. 2008 Commercial and Residential
N.C. Gen. Stat. § 160A-239.1, et seq. 2008 Commercial and Residential

Southeast Multifamily Market Assessment 26
South Carolina No PACE Enabling Legislation
Tennessee No PACE Enabling Legislation
Virginia
Ch. 9, sec 15.2-958.3 2010 Commercial
Ch. 389 2015 Commercial
Ch. 773 2009 Commercial
Source: PACENation
While PACE is most often applied to commercial properties, some states have extended eligibility to
multifamily properties. For example, when SB 97 was enacted in North Carolina in 2009, it included a
provision for special assessments to finance energy efficiency improvements in a range of buildings,
including multifamily residential. In Florida, while multifamily properties are not explicitly referenced in a
statute, they are folded into commercial PACE. Arkansas, which passed PACE-enabling legislation in 2013,
already has a handful of multifamily projects in its project pipeline.
Loan Programs
Some states have established state-administered financing programs that can be leveraged by multifamily
property owners for energy efficiency upgrades. In 2013, the Florida Department of Agriculture and
Consumer Services, Office of Energy awarded the Florida Housing Finance Corporation grant funding to
establish a revolving loan program, known as the Multifamily Energy Retrofit Program (MERP). Loans are
used for retrofitting rental properties in older buildings within the Corporation’s portfolio that have the
potential to achieve at least 15 percent projected energy savings (Florida Housing Finance Corporation
2016). Additional information on the MERP is provided in the case study that follows.
In Tennessee, local community development financial institution (CDFI) Pathway Lending has established
multifamily energy efficiency as a priority area of focus. In 2013, Pathway Lending launched the Loan
Consortium for Affordable Multi-Family Housing, in partnership with the Tennessee Bankers Association
and the Tennessee Housing Development Agency, to provide permanent financing to multifamily
developers who had been awarded a Low-Income Housing Tax Credit. This consortium is working
collaboratively to identify qualified developers, underwrite loan requests and participate in loans with
subscribing banks (Clinard 2014).
B. Supporting Tools
Benchmarking
Benchmarking is the process of tracking the energy use of a building or group of buildings over time and
comparing it with the energy use of similar structures or an established baseline (Kismohr 2013). A central
goal of benchmarking is to overcome barriers restricting private investment in energy efficiency, including

Southeast Multifamily Market Assessment 27
lack of awareness by building owners and operators about performance improvement opportunities, lack
of energy performance recognition in the marketplace, and lack of availability of energy performance data
to tenants, prospective lessees, investors, lenders, appraisers and other entities (Burr et al. 2012).
Comprehensive local benchmarking and disclosure ordinances are becoming increasingly prevalent and
have been passed in major cities like Austin, Boston, Minneapolis, New York, Philadelphia, San Francisco
and Washington, D.C. In SEEA’s footprint, the Atlanta City Council unanimously approved the Atlanta
Commercial Buildings Energy Efficiency Ordinance in 2015. Currently, multifamily building owners may
claim an exemption, until Georgia Power provides adequate data aggregation.
Figure 28. U.S. Building Benchmarking and Transparency Policies
Source: Institute for Market Transformation 2016.
The City of Orlando is currently in the process of drafting a similar ordinance, which would require
commercial, multifamily and industrial buildings with 40,000 square feet or greater to benchmark energy
consumption on an annual basis.
Voluntary Programs
In recent years, local jurisdictions, as well as private sector players, have tapped into energy-saving
opportunities available through voluntary or challenge programs. One of the most notable of these is the
U.S. Department of Energy’s Better Buildings Challenge. This initiative, launched in 2011, aims to make
commercial, public, industrial and residential buildings 20 percent more energy efficient over the next

Southeast Multifamily Market Assessment 28
decade. Multifamily residential partners are multifamily housing owners and managers who commit to
reducing energy use across their U.S. portfolios by 20 percent in ten years (DOE ND).
As a leading partner under the Better Buildings Challenge, the City of Atlanta has launched a
complementary Affordable Multifamily Housing Challenge pilot program, in partnership with the City
Energy Project and Energy Efficiency for All. This program allows qualified participants to access tools and
resources for reducing energy and water consumption, incentives and funding options to support energy
and water efficiency retrofit projects, and other resources and trainings. In order to participate, property
owners or managers must commit to reducing energy consumption 20 percent by 2020 and benchmarking
their energy data (Atlanta Better Buildings Challenge 2016).
Various public housing authorities have also made the decision to participate in the Better Buildings
Challenge as a mechanism for providing economic development and self-sufficiency activities for
residents, as well as equal access to safe, quality housing for low and moderate income families. As a
partner in the Better Buildings Challenge, the Tampa Housing Authority includes energy consumption
reduction as a goal of its five-year plan, requiring a 15 percent reduction in energy consumption agency-
wide, reaching 20 percent by 2020. To advance these goals, the Tampa Housing Authority has undertaken
a performance contract that includes installation of ENERGY STAR® appliances, double-pane argon gas
windows, weatherization measures, increased insulation, high SEER air conditioners, low-flow water
devices, interior CFL lighting and LED or conduction lighting (DOE ND). In the Southeast, the Housing
Authority of the City of Palatka, Florida has also made a commitment through the Better Buildings
Challenge.
Case Study
Florida’s Multifamily Energy Retrofit Program
Program Background
Florida’s Multifamily Energy Retrofit Program
(MERP) began in 2013 with an initial investment of
$6.3 million in unexpended American Recovery and
Reinvestment Act Funds from Florida’s Office of
Energy. The Office of Energy contributed additional
funds in 2014 bringing the total to $8.3 million. These dollars were used to seed a revolving loan fund,
managed by the Florida Housing Finance Corporation (FHFC), intended to support the financing of energy
retrofits in older affordable housing multifamily properties.
When the FHFC issued an initial Request for Applications (RFA) for the program in October 2014, they
received very little interest. As a result, FHFC spent the better part of a year engaging developers, federal
agencies and other stakeholders in designing a program that better reflected the needs of the market.

Southeast Multifamily Market Assessment 29
Program Design
The newly designed program, launched in 2015, featured a number of modifications designed to simplify
and streamline the process, and gain additional developer interest and buy-in. FHFC increased the
allowable investment per unit, in addition to making return-in-investment (ROI) criteria less stringent and
adding a developer fee. Finally, FHFC conducted extensive outreach within the community of affordable
housing developers, helping developers to better understand the impact of these investments on their
bottom line. As before, projects were selected via a competitive RFA process. When the RFA was again
released in late 2015, FHFC received 33 applications.
According to program guidelines, loan funds may support the installation of the following measures, upon
the completion of an energy audit showing projected energy savings:
Air infiltration (e.g., envelope sealing, duct sealing, weather stripping);
Replacement of appliances with Energy Star qualified appliances, lighting, faucets/showerheads,
HVAC systems, programmable thermostats, boilers/water heaters, insulation, window film, high
efficiency windows; and
Other building improvements which will result in reduced energy and/or water consumption
(Florida Housing Finance Corporation 2015).
Loans may cover up to $15,000 of retrofit expenses per unit. A portion of the loan is forgivable; ten percent
for profit-oriented applicants and 15 percent for not-for-profit applicants. Loans to for-profit applicants
are priced at one percent; loans to not-for-profit applicants are priced at zero percent. The term of the
loan is 15 years.
The new program design attracted significant interest from developers who had deferred capital needs
and limited cash flow to act upon them.
Successes and Challenges
One of the most challenging elements of the MERP has been assembling the infrastructure to track utility
data for properties that have undergone a MERP retrofit. FHFC has partnered with the Program for
Resource Efficient Communities at the University of Florida to do the data tracking; however, getting the
buy-in of utility stakeholders to provide the necessary data to the university required several rounds of
engagement and trust-building. Ultimately, all of the state’s investor-owned electric utilities agreed to
provide this information, although some required a demonstration of tenant consent.
The first round of retrofits funded by the MERP will be installed in 2016, and results will be available soon
after. Given the limited supply of capital and the 15-year loan term, it may be some time before FHFC is
able to offer a similar volume of retrofit financing; however, FHFC hopes that the utility data tracking will
serve as a “proof of concept” to illustrate the significant savings available through energy efficiency
retrofits in the affordable multifamily housing sector.
Southeast Multifamily Market Assessment 30
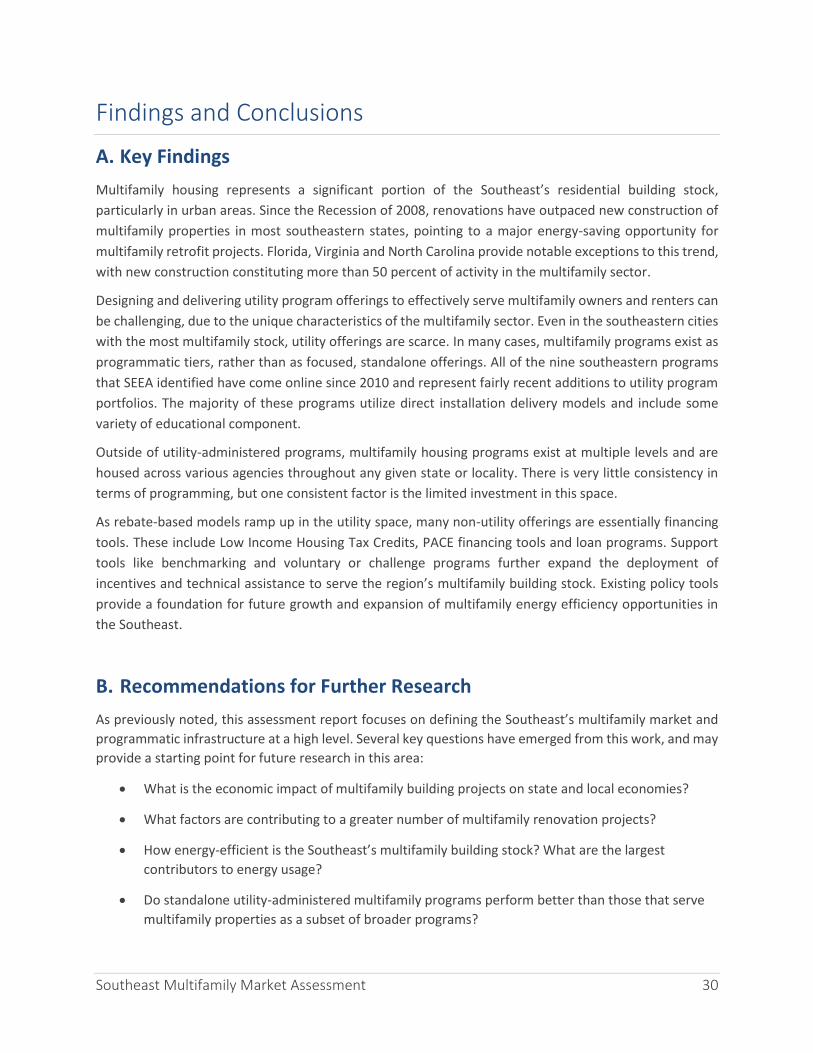
Findings and Conclusions
A. Key Findings
Multifamily housing represents a significant portion of the Southeast’s residential building stock,
particularly in urban areas. Since the Recession of 2008, renovations have outpaced new construction of
multifamily properties in most southeastern states, pointing to a major energy-saving opportunity for
multifamily retrofit projects. Florida, Virginia and North Carolina provide notable exceptions to this trend,
with new construction constituting more than 50 percent of activity in the multifamily sector.
Designing and delivering utility program offerings to effectively serve multifamily owners and renters can
be challenging, due to the unique characteristics of the multifamily sector. Even in the southeastern cities
with the most multifamily stock, utility offerings are scarce. In many cases, multifamily programs exist as
programmatic tiers, rather than as focused, standalone offerings. All of the nine southeastern programs
that SEEA identified have come online since 2010 and represent fairly recent additions to utility program
portfolios. The majority of these programs utilize direct installation delivery models and include some
variety of educational component.
Outside of utility-administered programs, multifamily housing programs exist at multiple levels and are
housed across various agencies throughout any given state or locality. There is very little consistency in
terms of programming, but one consistent factor is the limited investment in this space.
As rebate-based models ramp up in the utility space, many non-utility offerings are essentially financing
tools. These include Low Income Housing Tax Credits, PACE financing tools and loan programs. Support
tools like benchmarking and voluntary or challenge programs further expand the deployment of
incentives and technical assistance to serve the region’s multifamily building stock. Existing policy tools
provide a foundation for future growth and expansion of multifamily energy efficiency opportunities in
the Southeast.
B. Recommendations for Further Research
As previously noted, this assessment report focuses on defining the Southeast’s multifamily market and
programmatic infrastructure at a high level. Several key questions have emerged from this work, and may
provide a starting point for future research in this area:
What is the economic impact of multifamily building projects on state and local economies?
What factors are contributing to a greater number of multifamily renovation projects?
How energy-efficient is the Southeast’s multifamily building stock? What are the largest
contributors to energy usage?
Do standalone utility-administered multifamily programs perform better than those that serve
multifamily properties as a subset of broader programs?

Southeast Multifamily Market Assessment 31
Has spending grown for existing utility-administered energy efficiency programs? How does the
relative level of spending and savings of these programs compare nationally?
What barriers prevent southeastern utilities covering multifamily-rich geographies from offering
programming to serve multifamily properties?
What challenges and opportunities have utility program administrators that are offering
multifamily programs identified in their work?
What additional financial tools are available to support energy efficiency investments in
multifamily properties?
What capital sources are available to support more robust loan programming for multifamily
properties?
How effective has PACE financing been in driving investments in the Southeast’s multifamily
residences?
What is the impact of benchmarking on encouraging energy savings in multifamily properties?
Are there successful models from other regions that support greater coordination of the
multiple actors involved in multifamily energy efficiency efforts?
As previously described, this report is intended as a starting point. SEEA hopes that market actors
throughout the region will continue to explore these questions and others to enhance the body of regional
knowledge and expertise in this area.
Southeast Multifamily Market Assessment 32
References Atlanta Better Buildings Challenge. 2016. “About AMH Challenge.” Accessed May 16. http://atlantabbc.com/initiatives/affordable-multifamily-housing-challenge/.
Burr, A., Majersik, C., Stellberg, S. and Garrett-Peltier, H. 2012. Analysis of Job Creation and Energy Cost Savings from Building Energy Rating and Disclosure Policy. Washington, DC: Institute for Market Transformation. http://www.imt.org/uploads/resources/files/Analysis_Job_Creation.pdf.
Clinard, M. 2014. “Pathway Lending Loan Consortium: Delivering Affordable Multi-Family Housing Through Loan Participation.” http://www.slideshare.net/infopathway/loan-consortium-online-power-point-2014-0301.
DOE (U.S. Department of Energy). NDa. Better Buildings Challenge Overview. Washington, DC: DOE. http://betterbuildingssolutioncenter.energy.gov/sites/default/files/attachments/Better%20Buildings%20Challenge%20Overview.pdf.
DOE (U.S. Department of Energy). NDb. Housing Authority of the City of Tampa, FL.” Accessed May 16. http://betterbuildingssolutioncenter.energy.gov/partners/housing-authority-city-tampa-fl.
Entergy Arkansas, Inc. 2015. 2016 Energy Efficiency Program Plan. Filed in Arkansas Public Service Commission Docket No. 07-085-TF. http://www.apscservices.info/pdf/07/07-085-TF_530_1.pdf.
E Source. 2015. “DSM Insights Database.” Accessed May 16. www.esource.com/about-dsminsights.
Florida Housing Finance Corporation. 2015. Request for Applications 2015-115: Multifamily Energy Retrofit Program. Tallahassee: Florida Housing Finance Corporation. http://www.floridahousing.org/FH-ImageWebDocs/Developers/MultiFamilyPrograms/2015-115_MERP/10-23-15_FINAL_MERP_III_for_posting.pdf.
Florida Housing Finance Corporation. 2016. “Multifamily Energy Retrofit Program.” Accessed May 16. http://apps.floridahousing.org/StandAlone/FHFC_ECM/ContentPage.aspx?PAGE=0459.
Fuhry, L. 2013. 2013 QAP Analysis: Green Building Criteria in Low-Income Housing Tax Credit Programs. Santa Monica: Global Green USA. http://static1.squarespace.com/static/5548ed90e4b0b0a763d0e704/t/55520ec5e4b0b1995caa0f9c/1431441093899/2013QAP_FINAL.pdf.
Georgia Power Company. 2016. Application for the Certification, Decertification, and Amended Demand Side Management Plan. Filed in Georgia Public Service Commission Docket No. 40162. http://www.psc.state.ga.us/factsv2/Document.aspx?documentNumber=161826.
Gulf Power Company. 2015. 2015 Demand-Side Management Plan. Filed in Florida Public Service Commission Docket No. 15-0086-EG. http://www.psc.state.fl.us/library/filings/15/01473-15/01473-15.pdf.
HUD (U.S. Department of Housing and Urban Development). 2016. “Glossary of HUD Terms.” Accessed May 16. https://www.huduser.gov/portal/glossary/glossary_m.html.

Southeast Multifamily Market Assessment 33
Institute for Market Transformation. 2015. “U.S. Benchmarking and Transparency Policies.” Accessed May 16. http://www.buildingrating.org/graphic/us-benchmarking-policy-landscape.
JCHS (Joint Center for Housing Studies of Harvard University). 2013. America’s Rental Housing: Evolving Markets and Needs. Cambridge, MA: Harvard. http://www.jchs.harvard.edu/sites/jchs.harvard.edu/files/jchs_americas_rental_housing_2013_1_0.pdf
JCHS (Joint Center for Housing Studies of Harvard University). 2015. The State of the Nation’s Housing 2015. Cambridge, MA: Harvard. http://www.jchs.harvard.edu/sites/jchs.harvard.edu/files/jchs-sonhr-2015-full.pdf.
Johnson, K. and E. Mackres. Scaling Up Multifamily Energy Efficiency Programs: A Metropolitan Area Assessment. Washington, DC: ACEEE 2013. http://aceee.org/sites/default/files/publications/researchreports/e135.pdf
Kismohr, S. 2013. Introduction to Benchmarking or Tracking Energy Consumption in Public or Commercial
Buildings. Chicago: Midwest Energy Efficiency Alliance.
http://mwalliance.org/sites/default/files/uploads/MEEA%20Benchmarking%20FactSheet%20for%20Co
mm%20and%20Public%20Buildings%202013.pdf.
McCoy, A. 2015. The Impact of Energy Efficient Design and Construction on LIHTC Housing in Virginia. Blacksburg: Virginia Center for Housing Research at Virginia Tech. http://www.vchr.vt.edu/wp-content/uploads/2015/02/Housing-VA-LIHTC-Study-Full-Report.pdf.
MLGW (Memphis Light, Gas and Water. 2016. “About” Accessed May 15. http://www.mlgw.com/about/.
Ross, L., M. Jarrett and D. York. 2016. Reaching More Residents: Opportunities for Increasing Participation in Multifamily Energy Efficiency Programs. Washington, DC: ACEEE. http://aceee.org/sites/default/files/publications/researchreports/u1603.pdf.
Schwimmer, A. and A. Fournier. 2014. Energy Efficiency Quick Start Programs: A Guide to Best Practices. Atlanta: SEEA. http://www.seealliance.org/wp-content/uploads/Quick-Start-Best-Practices-041414-FINAL.pdf Southeast Energy Efficiency Alliance. 2015. Annual Report. Atlanta: SEEA. http://www.seealliance.org/wp-content/uploads/Annual-Report.pdf. Trachtenberg, A., S. Hill, McCoy, A. and Ladipo, T. The Impact of Green Affordable Housing. Atlanta: Southface Energy Institute and Virginia Center for Housing Research. http://www.southface.org/affordablehousing/IGAHfinalreport.pdf.

Southeast Multifamily Market Assessment 34
Appendix A
Table A1. Southeastern Metropolitan Area Multifamily Housing Markets
Geography Total
Housing Units
Multifamily Units
Percent of Multifamily
1 Naples-Immokalee-Marco Island, FL Metro Area
199,818 97,253 49%
2 Miami-Fort Lauderdale-West Palm Beach, FL Metro Area
2,475,877 1,137,300 46%
3 Gainesville, FL Metro Area 120,574 41,910 35%
4 Greenville, NC Metro Area 75,844 24,851 33%
5 Panama City, FL Metro Area 109,023 32,474 30%
6 Myrtle Beach-Conway-North Myrtle Beach, SC-NC Metro Area
268,415 77,685 29%
7 Athens-Clarke County, GA Metro Area 82,159 23,581 29%
8 New Orleans-Metairie, LA Metro Area 550,248 154,987 28%
9 Tampa-St. Petersburg-Clearwater, FL Metro Area
1,362,891 380,858 28%
10 Cape Coral-Fort Myers, FL Metro Area 372,769 103,513 28%
11 Orlando-Kissimmee-Sanford, FL Metro Area
955,148 264,851 28%
12 Lexington-Fayette, KY Metro Area 212,020 57,960 27%
13 Durham-Chapel Hill, NC Metro Area 227,389 61,076 27%
14 Crestview-Fort Walton Beach-Destin, FL Metro Area
139,731 37,505 27%
15 Tallahassee, FL Metro Area 164,135 42,243 26%
16 Sebastian-Vero Beach, FL Metro Area 76,786 19,488 25%
17 Tuscaloosa, AL Metro Area 103,348 25,877 25%
18 Virginia Beach-Norfolk-Newport News, VA-NC Metro Area
696,858 173,116 25%

Southeast Multifamily Market Assessment 35
19 Daphne-Fairhope-Foley, AL Metro Area 105,563 26,220 25%
20 Atlanta-Sandy Springs-Roswell, GA Metro Area
2,189,138 542,955 25%
21 North Port-Sarasota-Bradenton, FL Metro Area
404,534 99,469 25%
22 Jacksonville, FL Metro Area 606,085 148,996 25%
23 Columbus, GA-AL Metro Area 130,160 31,844 24%
24 Auburn-Opelika, AL Metro Area 64,258 15,619 24%
25 Port St. Lucie, FL Metro Area 215,521 50,755 24%
26 Savannah, GA Metro Area 153,562 36,163 24%
27 Hilton Head Island-Bluffton-Beaufort, SC Metro Area
104,060 24,405 23%
28 Nashville-Davidson--Murfreesboro--Franklin, TN Metro Area
715,164 166,443 23%
29 Charleston-North Charleston, SC Metro Area
305,301 70,904 23%
30 Memphis, TN-MS-AR Metro Area 559,091 129,707 23%
31 Palm Bay-Melbourne-Titusville, FL Metro Area
271,005 62,259 23%
32 Louisville/Jefferson County, KY-IN Metro Area
543,855 124,522 23%
33 Albany, GA Metro Area 66,257 14,908 23%
34 Greensboro-High Point, NC Metro Area 325,526 72,399 22%
35 Raleigh, NC Metro Area 480,522 106,816 22%
36 Richmond, VA Metro Area 512,296 113,534 22%
37 Hattiesburg, MS Metro Area 62,121 13,639 22%
38 Wilmington, NC Metro Area 129,947 28,317 22%
39 Harrisonburg, VA Metro Area 51,885 11,132 21%
40 Fayetteville-Springdale-Rogers, AR-MO Metro Area
201,212 42,528 21%
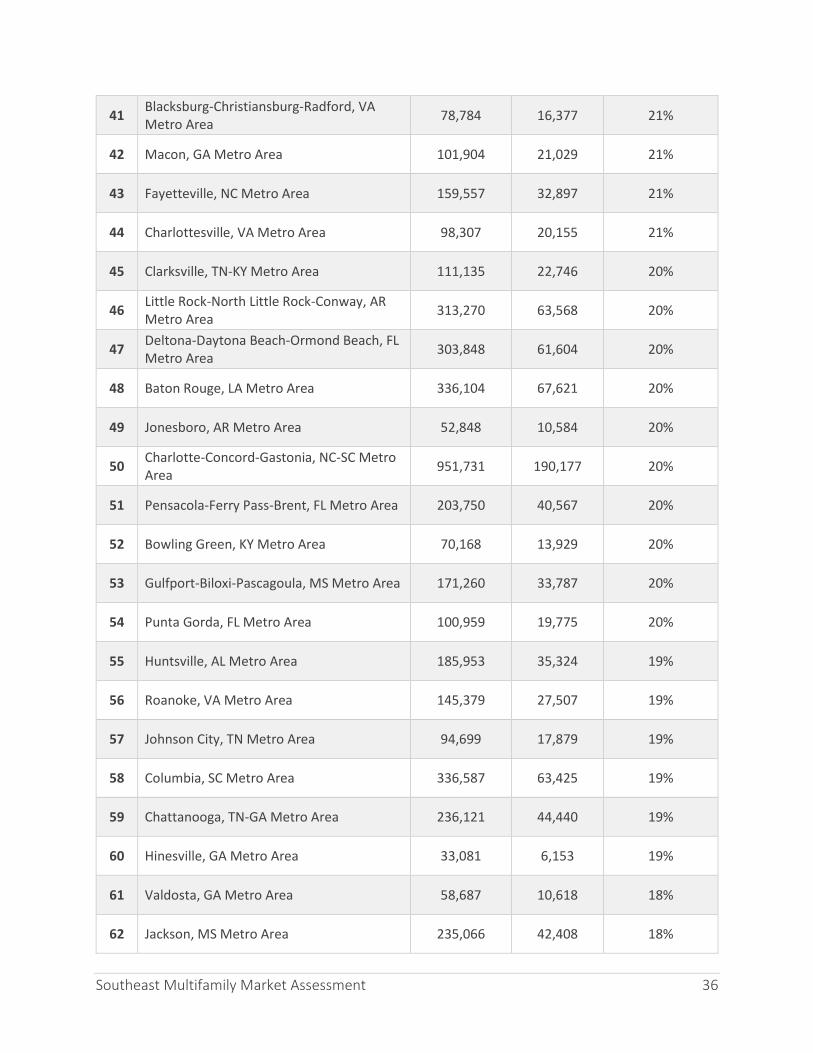
Southeast Multifamily Market Assessment 36
41 Blacksburg-Christiansburg-Radford, VA Metro Area
78,784 16,377 21%
42 Macon, GA Metro Area 101,904 21,029 21%
43 Fayetteville, NC Metro Area 159,557 32,897 21%
44 Charlottesville, VA Metro Area 98,307 20,155 21%
45 Clarksville, TN-KY Metro Area 111,135 22,746 20%
46 Little Rock-North Little Rock-Conway, AR Metro Area
313,270 63,568 20%
47 Deltona-Daytona Beach-Ormond Beach, FL Metro Area
303,848 61,604 20%
48 Baton Rouge, LA Metro Area 336,104 67,621 20%
49 Jonesboro, AR Metro Area 52,848 10,584 20%
50 Charlotte-Concord-Gastonia, NC-SC Metro Area
951,731 190,177 20%
51 Pensacola-Ferry Pass-Brent, FL Metro Area 203,750 40,567 20%
52 Bowling Green, KY Metro Area 70,168 13,929 20%
53 Gulfport-Biloxi-Pascagoula, MS Metro Area 171,260 33,787 20%
54 Punta Gorda, FL Metro Area 100,959 19,775 20%
55 Huntsville, AL Metro Area 185,953 35,324 19%
56 Roanoke, VA Metro Area 145,379 27,507 19%
57 Johnson City, TN Metro Area 94,699 17,879 19%
58 Columbia, SC Metro Area 336,587 63,425 19%
59 Chattanooga, TN-GA Metro Area 236,121 44,440 19%
60 Hinesville, GA Metro Area 33,081 6,153 19%
61 Valdosta, GA Metro Area 58,687 10,618 18%
62 Jackson, MS Metro Area 235,066 42,408 18%

Southeast Multifamily Market Assessment 37
63 Birmingham-Hoover, AL Metro Area 503,430 89,944 18%
64 Mobile, AL Metro Area 180,277 31,588 18%
65 Rome, GA Metro Area 40,475 7,075 17%
66 Knoxville, TN Metro Area 383,916 66,823 17%
67 Montgomery, AL Metro Area 163,130 28,253 17%
68 Winston-Salem, NC Metro Area 288,897 49,820 17%
69 Burlington, NC Metro Area 67,487 11,580 17%
70 Hot Springs, AR Metro Area 50,552 8,628 17%
71 Elizabethtown-Fort Knox, KY Metro Area 63,024 10,691 17%
72 Shreveport-Bossier City, LA Metro Area 195,808 33,121 17%
73 Greenville-Anderson-Mauldin, SC Metro Area
365,035 61,223 17%
74 Brunswick, GA Metro Area 58,478 9,610 16%
75 Dalton, GA Metro Area 55,645 9,052 16%
76 Monroe, LA Metro Area 76,758 12,351 16%
77 Jackson, TN Metro Area 55,700 8,960 16%
78 Owensboro, KY Metro Area 49,968 8,015 16%
79 Jacksonville, NC Metro Area 72,570 11,638 16%
80 Warner Robins, GA Metro Area 75,531 12,070 16%
81 Cleveland, TN Metro Area 50,109 7,857 16%
82 Hammond, LA Metro Area 51,363 7,852 15%
83 Staunton-Waynesboro, VA Metro Area 53,101 8,102 15%
84 Fort Smith, AR-OK Metro Area 122,052 18,455 15%

Southeast Multifamily Market Assessment 38
85 Augusta-Richmond County, GA-SC Metro Area
245,526 35,916 15%
86 Lafayette, LA Metro Area 198,738 28,739 14%
87 Rocky Mount, NC Metro Area 67,072 9,668 14%
88 Florence-Muscle Shoals, AL Metro Area 70,017 10,086 14%
89 Lynchburg, VA Metro Area 113,464 16,302 14%
90 Asheville, NC Metro Area 215,589 30,758 14%
91 Lakeland-Winter Haven, FL Metro Area 281,617 39,935 14%
92 Gainesville, GA Metro Area 69,053 9,777 14%
93 Spartanburg, SC Metro Area 137,467 19,027 14%
94 Goldsboro, NC Metro Area 53,074 7,208 14%
95 Alexandria, LA Metro Area 65,406 8,878 14%
96 Lake Charles, LA Metro Area 87,634 11,866 14%
97 Anniston-Oxford-Jacksonville, AL Metro Area
53,306 7,153 13%
98 Florence, SC Metro Area 89,180 11,748 13%
99 Kingsport-Bristol-Bristol, TN-VA Metro Area
147,174 19,344 13%
100 Decatur, AL Metro Area 66,514 8,722 13%
101 Pine Bluff, AR Metro Area 42,059 5,472 13%
102 Sumter, SC Metro Area 46,497 5,995 13%
103 Morristown, TN Metro Area 50,587 6,441 13%
104 New Bern, NC Metro Area 57,974 6,803 12%
105 Gadsden, AL Metro Area 47,507 5,553 12%
106 Hickory-Lenoir-Morganton, NC Metro Area 162,385 18,961 12%

Southeast Multifamily Market Assessment 39
107 Dothan, AL Metro Area 67,444 7,845 12%
108 Sebring, FL Metro Area 55,150 6,330 11%
109 Winchester, VA-WV Metro Area 57,521 6,578 11%
110 Houma-Thibodaux, LA Metro Area 83,338 9,029 11%
111 Ocala, FL Metro Area 163,731 16,371 10%
112 Homosassa Springs, FL Metro Area 77,875 4,254 5%
113 The Villages, FL Metro Area 58,511 1,746 3%
Source: 2014 American Community Survey
Table A2. Multifamily Construction Starts and Population Density by State
State Multifamily Construction Starts Population Density
per Square Mile
Florida 2,405 308
North Carolina 1,457 187
Georgia 1,187 172
Virginia 1,030 196
Tennessee 1,020 157
South Carolina 690 153
Kentucky 624 110
Alabama 570 93
Arkansas 540 56
Louisiana 530 89
Mississippi 245 62
Source: U.S. Census Bureau

Southeast Multifamily Market Assessment 40
Appendix B
Table B1. Multifamily Utility Program Descriptions
State Utility Program Name
Program Description
Source
Arkansas Entergy
Arkansas
Entergy
Solutions
for
Multifamily
This program will target multifamily
property owners (landlords) and
managers, as well as apartment and
condo renters to address the three
principal barriers to multifamily EE…
EAI’s Multifamily Program
specifically addresses their unique
needs, which are often overlooked,
through a combination of incentives
for both direct install and
prescriptive measures, and through
property owner and tenant
education.
Docket No. 07-085-TF
Arkansas Oklahoma
Gas and
Electric
Company
Multi-
Family
Direct
Install
Program
This new program proposed by
OG&E encourages property
managers and owners of multifamily
dwellings to upgrade their central air
conditioning units. OG&E will
provide $250 per ton rebate
incentive to the property owner for
any replacement of a 13 SEER HVAC
system with a 16 SEER heat pump, if
the units are total electric, or 16
SEER and 90% gas furnace, if the
units are heated with natural gas.
The incentive will be offered directly
to the installer of the high efficiency
equipment. In order to receive the
incentive payment for upgrading to a
more efficient unit, the customer
must contract with an OG&E
approved local, certified, and
licensed HVAC contractor to proceed
with the installation.
Docket No. 07-075-TF

Southeast Multifamily Market Assessment 41
Florida Gulf
Power
Landlord-
Renter
Custom
Incentive
The Residential Custom Incentive
Program is a flexible program
designed to increase energy
efficiency in the residential rental
property sector… This program will
promote the installation of various
energy efficiency measures available
through other programs including
HVAC, windows, appliances, etc.
Depending on the individual
circumstances of the rental
property, additional incentives may
be necessary to overcome the split-
incentive barrier. This program may
also promote the installation of low
cost measures associated with the
Community Energy Saver Program
by the landlord of multi-family
properties. These measures, when
provided to the landlord for
installation, will benefit the renter
and represent one solution to the
split-incentive barrier possible with
this program. The program may
provide other technical assistance
services such as project savings
evaluation as another means of
overcoming this barrier.
Docket No. 15-0086-
EG
Kentucky Duke
Energy
Kentucky
Multifamily
Energy
Efficiency
Program
The Multifamily Energy Efficiency
Program … allows Duke Energy
Kentucky to utilize an alternative
delivery channel which targets
multifamily apartment complexes.
The measures are directly installed
in permanent fixtures by the
program vendor, Franklin Energy, or
the property management staff via
the DIY (Do It Yourself) option. The
target audience for the program is
property managers who have
Case No. 2015-00368

Southeast Multifamily Market Assessment 42
properties that consist of four or
more units and are served on an
individually metered residential rate
schedule. In order to receive water
measures, apartments must have
electric water heating. … The
Program helps property managers
upgrade lighting with energy
efficient CFLs and also saves energy
by offering water measures such as
bath and kitchen faucet aerators,
water saving showerheads and pipe
wrap.
Louisiana Entergy
New
Orleans
Energy
Smart for
Multifamily
This ENO program will target
multifamily property owners
(landlords) and managers, as well as
apartment and condo renters to
address the three principal barriers
to multifamily energy efficiency….
ENO’s Multifamily Program
specifically addresses their unique
needs, which are often overlooked,
through a combination of incentives
for both direct install and
prescriptive measures, and through
property owner and tenant
education. Multifamily will also be
the delivery mechanism for the
program-wide weatherization
collaborative cost effective
measures.
Docket No. UD-08-02
Mississippi Atmos
Energy
Multi-
family
Direct
Install
Program
This program will target multi-family
complexes with four or more units
that utilize has water heaters. The
benefit to offering a multi-family
direct install program is that it offers
energy saving opportunities to the
Atmos Energy rental community.
The program offers the installation
of low flow shower heads, aerators,
Docket No 2014-UN-
17

Southeast Multifamily Market Assessment 43
pipe wrap, water heater wraps and
basic weather-stripping (if needed)
at no cost to the property
management company. While
performing the direct install service,
the program representative will
complete an inventory of existing
equipment and identify
opportunities for additional energy
saving opportunities. The program
representative will educate the
complex manager/owner regarding
other measures that we can install
to provide additional savings.
North and
South
Carolina
Duke
Energy
Carolinas
Multifamily
Energy
Efficiency
Program
The Multifamily Energy Efficiency
Program encourages multifamily
property owners properly managers,
and tenants to become more energy
efficient through the installation
energy efficient measures. Energy
efficient lighting measures and
energy efficient water heating low
flow devices at no direct cost to the
property manager. PMs managing
multi-family units served by Duke
Energy Carolinas. LLC (the Company)
on a residential rate schedule who
meet the program eligibility
requirements.
Docket No. E-7, Sub
1032
North and
South
Carolina
Duke
Energy
Progress
Multifamily
Energy
Efficiency
Program
The purpose of this Program is to
encourage multi-family property
owners, property managers and
tenants to become more energy
efficient through the installation of
new energy efficient appliances and
devices in permanent fixtures. The
Program offers appliances and
devices such as energy efficient
Docket No. E-2, Sub
1059

Southeast Multifamily Market Assessment 44
lighting measures and energy
efficient water heating measures.
Tennessee Memphis
Light, Gas
and
Water
Energy
Advantage
Apartments
MLGW’s Energy Advantage
Apartments (EAA) Certification
program ensures that newly
constructed apartments in Shelby
County are as energy efficient as
dwellings built to MLGW’s EcoBUILD
standards for homes. MLGW works
with apartment developers to
simulate energy usage given
specifications on heating and cooling
equipment, windows, building
envelope, and other equipment in
the units. If the simulation shows
efficiency equal to or greater than
current EcoBUILD standards, the
complex can qualify.
MLGW Website

Southeast Multifamily Market Assessment 45
Appendix C
Additional Multifamily Resources
American Council for an Energy-Efficient Economy (ACEEE) ACEEE’s Multifamily Energy Savings Project focuses on creating and expanding comprehensive building upgrade programs for market-rate and affordable multifamily housing through partnerships between utilities and the multifamily housing community.
Database of State Incentives for Renewables & Efficiency (DSIRE) Searchable database of information on incentives and policies that support renewable energy and energy efficiency in the United States.
Energy Efficiency for All (EFFA) Collaborative project initiated by the National Housing Trust, Natural Resources Defense Council, Energy Foundation, and Elevate Energy to provide state and local partners with the tools and resources to help increase energy efficiency investments in affordable multifamily housing.
National Housing Trust The National Housing Trust is the nation’s leading expert in preserving and improving affordable housing.
Network for Energy, Water, and Health in Affordable Buildings (NEWHAB) A network of individuals and organizations working together to share best practices, innovations, and successes to address policy and projects related to energy, housing, water, health, and social justice.
U.S. Department of Energy Better Buildings Challenge Initiative to drive leadership and commitment to energy efficiency in commercial, public, industrial, and residential buildings to achieve the goal of becoming 20 percent more energy efficient over the next decade.
U.S. Housing and Urban Development Multifamily Programs HUD’s Federal Housing Administration (FHA) Office of Multifamily Housing Programs is responsible for the overall management, development, direction and administration of HUD’s Multifamily Housing Programs.