Embed Size (px)
Citation preview

“Loss-non”
Reduc ing food lo s s and was te in Japan
- Account ing and Repor t ing sy s tem -
June 2017
Environmental Policy Office
Food Industry Affairs Bureau
M i n i s t r y o f A g r i c u l t u r e
F o r e s t r y a n d F i s h e r i e s
(MAFF), JAPAN

Meaning of Food waste / loss in Japan
1
Food manufacturers Food retailers Households
Wheat bran
Liquids(dehydration,evaporation)
Wheat
Crusts of bread(edible)
Over production
(edible)
Over delivery deadline /
Returns(edible)
Over best before date /
Leftovers(edible/inedible)
Food waste from industryValuable by-products
Reducing Food waste from household
Left over dough
(edible/inedible)
Paper, vinyl
Bottle, can
Combustible garbage
After using / not using for foodBy-products from manufacturing, processing and cooking which cannot be eaten
Combustible garbage except paper, vinyl and non-food items

Usage situation of food waste generation (FY2014) <Conceptual diagram>
2
Main
users o
f food
resou
rces
Business waste
(8.39 m tons)
Valuable by-products
[e.g., Soybean meal](8.89 m tons)
1) Food-related business operators Food
manufacturers Food
wholesalers Food retailers Restaurant
industry
Household waste(8.22 m tons)Edible portion
leftovers, excess removed, direct
disposal(2.82 m tons)
Food waste generation under Food Recycling Law
Food supply (82.94 m tons)
Food waste generation under Waste Management Law
2) Households
Business waste
+Valuable by-
products
(19.53 m tons)
Edible portionunsold/returned
products, leftovers
(3.39 m tons)
Recycled: 13.5 m tonsfeed: 9:83 m tonsfertilizer: 2.49 m tonsother: 1.18 m tons
Thermal recovery: 0.45 m tons
Reduced: 2.24 m tons
Appropriate disposal: 2.85 m tons
Incineration, landfill:7.67 m tons
Food waste
(27.75 m tons)
Edible portion,
Called “food loss”
6.21 m tons
Recycled: 0.55 m tons(fertilizer, methanation)

Food loss generation in Japan
3
Food loss generated in Japan (6.21 million tons) is about twice the food assistance amount
offered by the World Food Program (WFP) for the entire world.
Weight of food loss per person per day in Japan is about that of a bowl of rice.
BusinessesEdible portion
(3.39 million
tons)
Households
Edible portion
(2.82 million
tons)
Food loss generation in
Japan (FY2014)
(6.21 million tons)
food assistance amount offered by the
World Food Program (WFP) for the
entire world (2014):
About 3.20 million tons
Weight of food loss
per person per day:
About 134g
(about that of a bowl of rice)

The amount of food business waste (FY2014)
The total amount of food waste from the food-related industry was 19.53 million tons (FY2014).
Manufacturers accounted for 83% of this.
The edible portion of this waste was 3.39 million tons (FY2014).
Manufacturers accounted for 42%, and restaurants accounted for 35% of this.
◆ Food waste generation ◆ Edible portion (food loss)
4
Manufacturers16.06Mt
(82%)
Wholesalers0.27Mt(1%)
Retailors1.27Mt(7%)
Restaurants1.94Mt(10%)
Manufacturers1.44Mt(42%)
Wholesalers0.16Mt(5%)
Retailors0.6Mt(18%)
Restaurants1.2Mt(35%)
(FY2014)Total amount
3.39Mt
(FY2014)Total amount
19.53Mt

5
Priorities of initiatives
i) Restraining waste generation
ii) Recycling (highest priority: animal feed)
iii) Thermal recovery iv) Reduction in weight
Recycling rate targets
Food manufacturers (95%) Food wholesalers (70%)
Food retailers (55%) Restaurant industry (50%)
Responsibility of relevant ministers (Minister of the Environment,
Minister of Agriculture, Forestry and Fisheries, etc.)
Formulation of basic policy
- Numerical targets - Measures to promote recycling
Development of criteria for food-related businesses
- Criteria for reducing the generation of waste
- Criteria for reducing waste volume - Criteria for recycling, etc.

6
Promotion of 3R
●Set targets on food waste reduction for each industry group.
E.g. Meat product manufacturing industry: 113kg/1 million yen of sales.
●Mandatory regular reporting on the amount of food waste
From food-related businesses which produce large quantities of food waste (100 tons of
food waste or more in the previous year) to the relevant minister
●Promote recycling in the private sector.
• Foster recycling business operators through the “Registered Recycling Business
Operator System”
• Formulate good practices (food recycling loop) through the “Recycling Business
Plan Approval System”
Role of the national government
● To all food-related business operators
Guidance and advice
● To operators of recycling who generate food waste over 100t
Advice, announcements, orders, penalties

7
Mandatory regulatory reporting categories
Amounts of food waste
Volume of production or sales for manufacturers
Sales for retailers and wholesalers
Guests in restaurants
Number (above) per unit
Amounts of reduction / recycling / thermal / dehydration and
evaporation / incineration and landfill
Recycling rate

8
Reporting method
Company Branch office
of MAFFHeadquarters
9
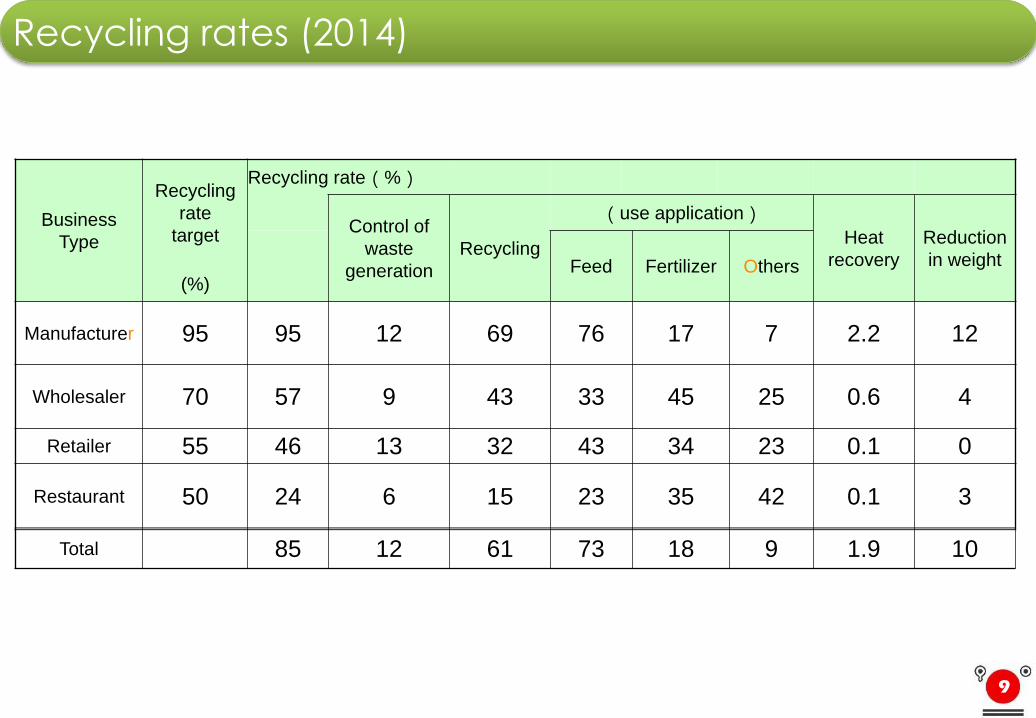
Recycling rates (2014)
Business
Type
Recycling
rate
target
Recycling rate(%)
Control of
waste
generation
Recycling
(use application)Heat
recovery
Reduction
in weightFeed Fertilizer Others(%)
Manufacturer 95 95 12 69 76 17 7 2.2 12
Wholesaler 70 57 9 43 33 45 25 0.6 4
Retailer 55 46 13 32 43 34 23 0.1 0
Restaurant 50 24 6 15 23 35 42 0.1 3
Total 85 12 61 73 18 9 1.9 10

10
Coverage rate in food industry (2014)
Companiesreporting: 3,536
(2%)Reported:14.84 Mt
(76%)
From number of companies
Total food industry companies:
190,000
Amount of waste from all industries19.53 Mt
From amount of waste

Business type Target Business type Target Business type Target
Meat product
manufacturers
113 kg/1 million
yen of sales
Prepared food
manufacturers
403 kg/1 million
yen of salesMiscellaneous restaurants
108 kg/1 million
yen of sales
Milk/dairy product
manufacturers
108 kg/1 million
yen of sales
Sushi/lunchbox/sandwich
manufacturers
224 kg/1 million
yen of sales
Takeout/delivery food
service(other than
school lunch, etc.)
184 kg/1 million
yen of sales
Canned/bottled seafood
manufacturers
480 kg/1 million
yen of sales
Food/drink wholesalers
(mainly drinks)
14.8 kg/1 million
yen of salesWedding halls
0.826 kg/
1 person (user)
Pickled vegetable
manufacturers
668 kg/1 million
yen of salesVarious food retailers
65.6 kg/1 million
yen of salesHotels
0.777 kg/1 person
(user)
Miso manufacturers191 kg/1 million
yen of salesSnack/bread retailers
106 kg/1 million
yen of sales
Soy sauce
manufacturers
895 kg/1 million
yen of salesConvenience stores
44.1 kg/1 million
yen of sales
Sauce manufacturers59.8 kg/1 ton of
product
Diners/restaurants (mainly
offering noodles)
175 kg/1 million
yen of sales
Bread manufacturers194 kg/1 million
yen of sales
Diners/restaurants (other
than those mainly offering
noodles)
152 kg/1 million
yen of sales
Noodle manufacturers270 kg/1 million
yen of salesBars, etc.
152 kg/1 million
yen of sales
Tofu/fried tofu
manufacturers
2,560 kg/1 million
yen of salesCafés
108 kg/1 million
yen of sales
Precooked frozen
packed food
manufacturers
363 kg/1 million
yen of salesFast food stores
108 kg/1 million
yen of sales
■ Targets for the control of food waste generation (April 2014 - March 2019)
■New targets(July 2015)
Business type Target
Miscellaneous livestock
product manufacturers
501 kg/1 ton of
sales
Vinegar manufacturers252 kg/1 million
yen of sales
Confectionary
manufacturers
249 kg/1 million
yen of sales
Coffee drinks and juice
manufacturers
429 kg/1 ton of
product
School lunch and
hospital food, etc.
332 kg/1 million
yen of sales
Targets for the control of food waste generation
11

The way for estimating the amount of edible FLW
12
Ministry of agriculture
Ministry of environment
Industry Households
Questionnaire about
Method of measuring the edible/inedible
amount of food loss waste (FLW)
Calculating the ratio of edible portion
by each industry group (grasp & estimate)
Companies
Municipality Municipality
Research on the amount of food loss and waste from combustible waste.
(not grasp & estimate)
Use the answer Use the estimation datafrom the remaining data & its combustible waste
Amount of the edible FLW =
(Total FLW ratio of edible portion)Industry group
(FLW from combustible household waste)
Municipality

Underway Project for detail survey for mandatory report
13
• Select business category for setting target• Investigate the target by business category
• Definition and range of edible part• Measurement for separating edible /
inedible part• Obtain the problem in measuring
Survey for setting target of edible part
Total amount in Business category
Industry
No food-related target
Only reducing total amount of garbage
‘17
‘18
‘19
Investigate and examine the target
• Grasping edible part by investigating garbage composition
Research the situation in local government
Household
Set a new target for edible part
Present target Edible part
Inedible part
Edible part
Inedible part
Edible part
Inedible part
Improve the accuracy by increasing local government

Proposal to APEC MEs
14
Discuss the definition of
• food loss and waste(edible / inedible)
• measurement method(extraction survey / regular report)
• range of reducing action(which method can be counted?)<animal feed / fertilizer / anaerobic digestion / thermal usage>
Discuss the base year for the target

The so-called “one-third rule” is one of the factors that create food loss.
Conceptual diagram of deadline set by the “one-third rule”
(in the case of a six-month expiration date)
Consumer
Selling at
store
2 months 2 months2 months
Production
date
Wh
olesa
ler
Man
ufa
cturer
Disposed / returned
from wholesaler and
retailer to manufacturer:
82.1 billion yen/year
Disposed / returned
from retailer to
wholesaler:43.2 billion yen/year
● International comparison
Country Delivery deadline
(Expiration date
base)
USA Leaving 1/2
France 1/3
Italy 1/3
Belgium 1/3
Japan Leaving 2/3 on average
Efforts in the food industry (1) Review of delivery deadline
15
Delivery
deadlineSell deadline
Expiration
date
Gro
cery sto
re

ConfectionarySoft drinks
2 months
Production date Delivery deadline Sell deadline Expiration date
Manufacturer
3 months
Monitoring delivery, expired
stocks, returned, disposal
and transfer
Monitoring sales,
expired stocks
Monitoring
returned, non-
shipped and
disposal
Monitoring
buying behavior
Consumers
Modified delivery deadline for soft drinks and confectionaries in trial projects.
Total food loss in the supply chain decreased drastically.
WholesalerGrocery
storeSelling at store
Removal and disposal
(or sell at a discount)
Sell deadline set by
retailers
3 months
Curren
tP
ilot p
roject
(Expiration date six months)
Efforts in the food industry (1) Review of delivery deadline
16
Manufacturer Wholesaler
Returned(disposal)
Returned(disposal)
Expiration dateDelivery deadlineProduction date
2 months 2 months
Grocery
store

Extending the expiration date Changing display from expiration date to
expiration month
Efforts in the food industry (2) Review of Expiration date
○January 2009 – October 2013
Extended for 958 items
○November 2013 – October 2014
Extended for 199 items
○November 2014 – October 2015
Extended for 163 items
○Future plans
Extended for 587 items
○January 2009 – October 2013
Switched for 50 items
○November 2013 – October 2014
Switched for 159 items
○November 2014 – October 2015
Switched for 115 items
○Future plans
Switched for 107 items
AfterBefore
Instant noodles in bag packaging
Expiration date: six months eight months
Instant noodles in cup packaging
Expiration date: five months six months
Best before:
January 24,
2019
Best before:
January 2019
17

Before
Efforts in the food industry (3) Improved packaging
18
PEOxygen
Barrier
LayerPE
Oxygen
Barrier
LayerPE
After
PEOxygen
Barrier
Layer
Oxygen
Absorbing
Layer
Oxygen
Barrier
Layer
PE
Oxygen
Oxygen
Inside
Outside
Outside
Inside
By using a bottle with high oxygen barrier properties, the expiration date of mayonnaise can be
extended from seven to twelve months.

Collaboration with weather data companies
19
Expected temperature
Sensible temperature
index
Tofu index
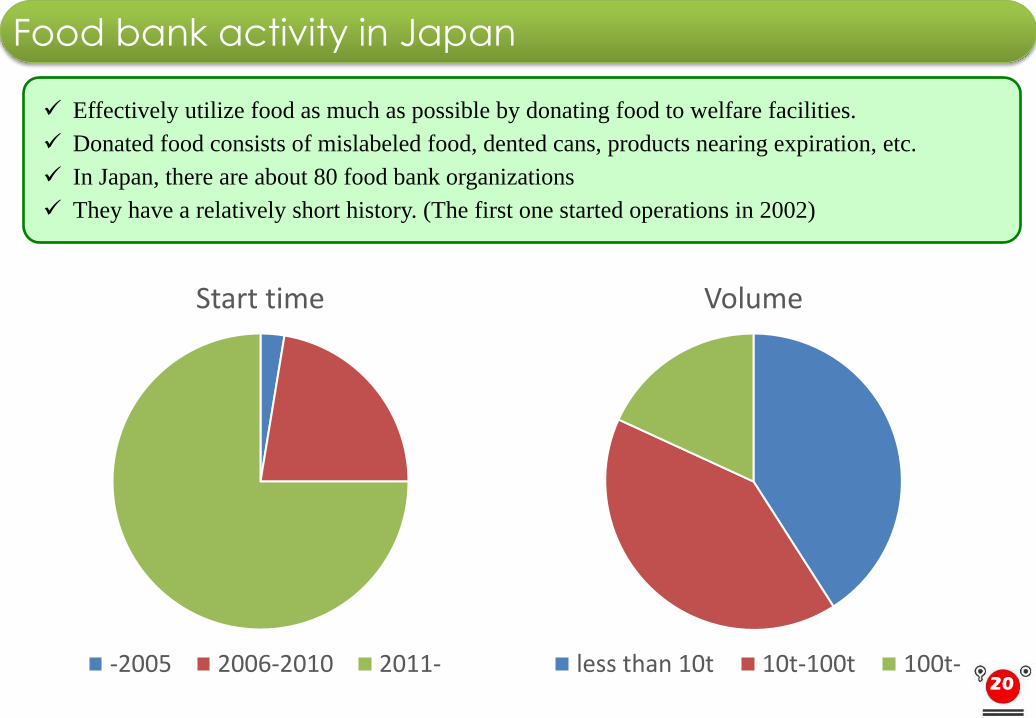
Food bank activity in Japan
Effectively utilize food as much as possible by donating food to welfare facilities.
Donated food consists of mislabeled food, dented cans, products nearing expiration, etc.
In Japan, there are about 80 food bank organizations
They have a relatively short history. (The first one started operations in 2002)
20
Start time
-2005 2006-2010 2011-
Volume
less than 10t 10t-100t 100t-

Guideline for food bank activity
21
Rule on providing and donating
Rule-making with stakeholders
Quality and hygiene management
Record and share information
Contents
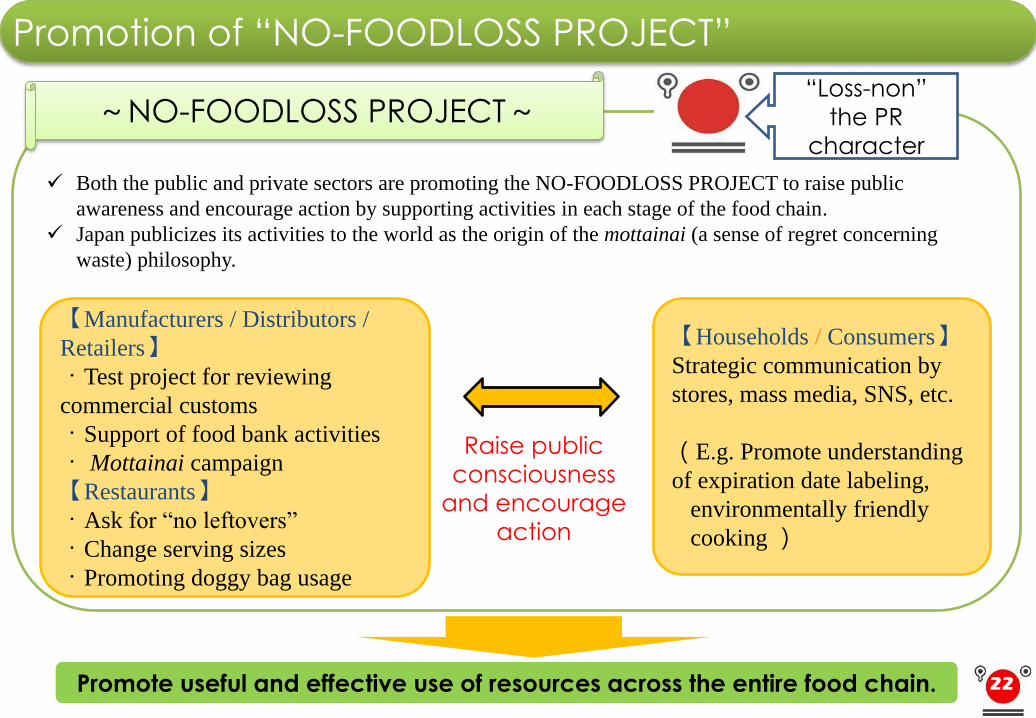
Both the public and private sectors are promoting the NO-FOODLOSS PROJECT to raise public
awareness and encourage action by supporting activities in each stage of the food chain.
Japan publicizes its activities to the world as the origin of the mottainai (a sense of regret concerning
waste) philosophy.
Promote useful and effective use of resources across the entire food chain.
Raise public
consciousness
and encourage
action
【Households / Consumers】Strategic communication by
stores, mass media, SNS, etc.
(E.g. Promote understanding
of expiration date labeling,
environmentally friendly
cooking )
【Manufacturers / Distributors /
Retailers】・Test project for reviewing
commercial customs
・Support of food bank activities
・ Mottainai campaign
【Restaurants】・Ask for “no leftovers”
・Change serving sizes
・Promoting doggy bag usage
Promotion of “NO-FOODLOSS PROJECT”
~NO-FOODLOSS PROJECT~
22
“Loss-non”
the PR
character

Collaboration with Loss-non
23
Use at sales storefronts for household appliances and in sales catalogs
Posting in the beverage sales area
Set up on tabletops in the employee cafeteria to call attention to the "Tabekiri(finish the food) movement"