Embed Size (px)
Citation preview

Life Insurance Claims and Disputes Statistics
June 2018 (released 29 March 2019)

AUSTRALIAN PRUDENTIAL REGULATION AUTHORITY 2
Forthcoming issues
This publication will be released according to the timetable published on the APRA website.
Notation
The symbol ‘*’ indicates that the data have been masked to avoid publishing data that is not
statistically credible.
Rounding
Details on tables may not add up to totals due to rounding.
Glossary and explanatory notes
A set of explanatory notes and a glossary are provided on the APRA website to assist the
reader in understanding the source and definitions of the data.
Enquiries
For more information about the statistics in this publication, contact:
Manager, Life Insurance Strategic Intelligence
Australian Prudential Regulation Authority
GPO Box 9836
Sydney NSW 2001
Disclaimer and Copyright
While APRA endeavours to ensure the quality of this publication, it does not accept any
responsibility for the accuracy, completeness or currency of the material included in this
publication and will not be liable for any loss or damage arising out of any use of, or
reliance on, this publication.
© Australian Prudential Regulation Authority (APRA)
This work is licensed under the Creative Commons Attribution 3.0 Australia Licence
(CCBY 3.0). This licence allows you to copy, distribute and adapt this work, provided you
attribute the work and do not suggest that APRA endorses you or your work. To view a full
copy of the terms of this licence, visit https://creativecommons.org/licenses/by/3.0/au/
AUSTRALIAN PRUDENTIAL REGULATION AUTHORITY 3
Contents
Contents ................................................................................................. 3
Executive summary ................................................................................ 4
Background ............................................................................................ 8
Data interpretation and disclaimer ......................................................... 9
Data interpretation ........................................................................................................... 9
Masking .......................................................................................................................... 10
Important disclaimer ..................................................................................................... 11
Industry-level results ........................................................................... 12
Claims outcomes ............................................................................................................ 12
Claim frequency and claims paid ratio ........................................................................... 15
Claims processing duration ........................................................................................... 17
Dispute lodgement ratio ................................................................................................. 18
Disputes outcomes ......................................................................................................... 19
Disputes processing duration ......................................................................................... 21
Attachment A – List of insurers ............................................................ 22
Attachment B – Policy statistics ........................................................... 23

AUSTRALIAN PRUDENTIAL REGULATION AUTHORITY 4
Executive summary
Over the past two years, the Australian Prudential Regulation Authority (APRA) and the
Australian Securities and Investments Commission (ASIC) (the agencies) have worked to
establish and implement a public reporting regime for claims and disputes statistics for life
insurers.
To meet the needs of the different audiences of the data, two types of publications are being
released. Together, they form a comprehensive and targeted approach to the communication
of this important data.
The first publication is APRA’s Life Insurance Claims and Disputes Statistics (this
publication), which is a comprehensive suite of industry and insurer-level data across a
range of dimensions.
The second is ASIC’s Life insurance claims comparison tool, a consumer-oriented tool
designed to readily assist in making reasonable comparisons of key metrics across the
industry.1
This is the first formal statistical publication under the regime, and provides data on both an
industry-level and named individual insurer-level basis. It follows two publications of pilot
round data, which were limited to industry-level results. This document provides and
discusses high-level industry results; the accompanying spreadsheet2 provides more
granular information, including at the entity level.
Future publications are intended to be released semi-annually, with each publication
covering a rolling 12-month period.
Table 1 summarises the key results from the first formal data collection and provides a
comparison with the results reported in the May 2018 Response Paper.
1 The ASIC tool is located on the MoneySmart website at https://www.moneysmart.gov.au/tools-and-
resources/calculators-and-apps/life-insurance-claims-comparison-tool. 2 Refer to https://www.apra.gov.au/life-claims-data-collection.

AUSTRALIAN PRUDENTIAL REGULATION AUTHORITY 5
Table 1: First formal data collection summary and comparison with May 2018 Response Paper
Claims outcomes May 2018 Response Paper
(6 months to 30 June 17)
First formal data collection
(12 months to 30 June 18) ^
Number Ratio Number Ratio
Claims Received # 71,170 129,046
Claims Finalised 47,069 66% of received 106,779 83% of received
- Claims Admitted 43,920 93% of finalised 98,704 92% of finalised
- Claims Declined 3,149 7% of finalised 8,075 8% of finalised
Claims Withdrawn 4,604 6% of received 5,910 5% of received
Claims Undetermined 19,497 27% of received 16,357 13% of received
^ Compared to the 2018 Response Paper, the first formal data collection includes additional cover types: DII
Business Expense, CCI Incapacity and Redundancy, and Accidental Death and Injury.
# Claims received is the sum of: claims that were undetermined at the start of the reporting period; claims that
were received during the reporting period; and claims that insurers re-opened during the reporting period.
Compared to the May 2018 Response Paper results, there has been a significant increase in
the proportion of reported claims finalised within the reporting period (83 per cent versus 66
per cent). This is largely because the Response Paper covered a shorter reporting period (6
months versus 12 months), with a commensurately shorter period for insurers in which to
resolve claims.
The admittance rate across all cover types and distribution channels is 92 per cent in the first
formal data collection, in line with the 93 per cent presented in the May 2018 Response
Paper. These findings are broadly consistent with the data the agencies released in
November 2017, and with the findings published in ASIC’s 2016 Report 498 Life insurance
claims: An industry review.
The 92 per cent admittance rate reported in Table 1 conceals some variability across cover
types and distribution channels; Table 2 breaks the admittance rate down by cover type and
channel.

AUSTRALIAN PRUDENTIAL REGULATION AUTHORITY 6
Table 2: Claims admittance rate by cover type and distribution channel
Individual
Advised
Individual
Non-Advised Group Super Group Ordinary
Cover type % admitted % admitted % admitted % admitted
Death 97% 88% 98% 100%
TPD 85% 68% 86% 81%
Trauma 85% 84% n/a 88%
DII 94% 83% 96% 95%
CCI n/a 86% n/a *
Funeral n/a 99% n/a n/a
Accident 16% 81% n/a n/a
* In this publication, Group Ordinary CCI is masked as there was only one provider of this product, which reported
fewer than 50 finalised claims.
Table 2 reveals significant variance in the admittance rate between different cover types and
distribution channels, from 100 per cent for Group Ordinary Death to 16 per cent for
Individual Advised Accident. These results, however, are affected by the number of
observations – the latter combination only reflects 116 finalised claims, whereas 13 out of the
19 combinations published in Table 2 have more than 1,000. (Table 7 in the main body of the
publication gives the number of finalised claims for each combination.)
Generally, Individual Advised business shows higher admittance rates than Individual Non-
Advised for the same cover type. This could be due to the policyholder having clearer
expectations up front of what is covered by the product, or (related to the previous point) the
adviser discouraging the policyholder from lodging a claim that is not covered by the policy.
The exception is Individual Advised Accident, which has an unusually low admittance rate.
However, as noted above the number of observations is quite small (116 finalised claims,
versus 3,260 for Non-Advised), plus the agencies were informed by the main writer of this
product of some existing data limitations that have reduced the accuracy of their reported
results.
In terms of overall data quality, the reported results have significantly improved over the
course of three pilot rounds. With some exceptions, like the one mentioned in the previous
paragraph, the data is of good quality. Insurers are currently addressing the few remaining
issues.

AUSTRALIAN PRUDENTIAL REGULATION AUTHORITY 7
Table 3: Claims paid ratio^ by cover type and distribution channel
Cover type Individual
Advised
Individual
Non-Advised Group Super Group Ordinary
Death 41% 28% 81% 70%
TPD 42% 26% 73% 30%
Trauma 61% 39% n/a 68%
DII # 66% 72% 87% 56%
CCI n/a 24% n/a *
Funeral n/a 23% n/a n/a
Accident 26% 49% n/a n/a
^ The claims paid ratio is the dollar amount of claims paid out in the reporting period as a percentage of the
annual premiums receivable in the same period.
# DII has recurring monthly payments. For the purposes of the reported claims ratio, total payments are
approximated using an average 24-month payout period.
Table 3 provides the claims paid ratio by cover type and distribution channel. There is
significant variance between products, ranging from 23 per cent (Individual Non-Advised
Funeral) to 87 per cent (Group Super DII). As this information is based on finalised claims, the
caveats regarding sample size accompanying Table 2 apply here as well. However, it is
notable that the two products with the lowest claims paid ratios have a relatively large
sample: Individual Non-Advised Funeral (11,708 finalised claims) and Individual Non-Advised
CCI (9,490 claims).
In general, Individual products will have higher acquisition costs associated with the policy
compared to Group products. As these costs will make up a larger proportion of the overall
premium income, the claims payments will be a correspondingly lower percentage.
Across all distribution channels except Group Ordinary, DII business has the highest claims
paid ratio. This aligns with the observations made in APRA’s thematic review into the
sustainability of this product.3
The agencies urge caution in interpreting the information presented in Table 3 as a measure
of consumer value or product profitability. For insurers, claims payments are only one part of
the costs associated with an insurance policy. Other costs, such as administration,
acquisition costs and claims reserves, are not included. Whether and how profitable the
product is to the insurer will depend in part on these factors.
Please note that the claims paid ratio reported in this publication is only a proxy of the loss
ratio; refer to the Industry-level results chapter for more information on this.
3 Refer to Seeking sustainability: challenges facing individual disability income insurance, APRA Insight (2018).

AUSTRALIAN PRUDENTIAL REGULATION AUTHORITY 8
Background
In 2016, ASIC conducted a thematic review to identify any systemic concerns with claims
handling in the life insurance industry. A key finding was that there is a clear need for better
quality, more consistent and more transparent data about insurance claims. The report
recommended the establishment of a consistent public reporting regime for claims data and
claims outcomes, including claims handling timeframes and dispute levels across all policy
types.
Commencing in May 2017, the agencies undertook a joint initiative to collect and publicly
report on life insurance claims and disputes data. The agencies adopted a two-phase
approach to this work: the first involved collecting data in a pilot process to establish an
effective and consistent collection approach (pilot data phase), with the second being the
ongoing collection and publication of credible, reliable and comparable data (ongoing
reporting phase).
The pilot data phase commenced in May 2017, and comprised three rounds of voluntary data
collection of claims and disputes data. Data was collected from approximately 20 insurers.
Over the course of the three rounds, the definitions used, the scope of data collected and the
collection template were incrementally improved.
To facilitate the start of the ongoing reporting phase and publication of data, in October 2018
Life Insurance Reporting Standard LRS 750.0 Claims and Disputes (LRS 750.0) was released.
LRS 750.0 requires life insurers regulated under the Life Insurance Act 1995 that write certain
specified types of life insurance business to report life insurance claims and disputes data to
APRA twice a year, covering six-month reporting periods. In addition to forming the basis of
statistical publications, the data collected will be shared with ASIC, in order to assist them in
performing their regulatory duties.
The agencies’ objectives in these new reporting requirements are to:
improve accountability and performance of life insurers; and
facilitate an informed public discussion about the performance of the life insurance
industry.
The new reporting requirements have been developed through extensive consultation with
life insurers, consumer representatives, service providers and the Financial Services Council.
In particular, the May 2018 Response Paper4 sought feedback on the core principles to be met
by the publication, industry-level data tables, proposed insurer-level data tables, individual
data items, and the provision of educational materials. The agencies have considered the
feedback provided as part of the consultation process in the development of this publication.
ASIC has developed a consumer-tested tool, hosted on its MoneySmart website, in order to
help consumers make reasonable comparisons across the industry.5
4 Refer to https://www.apra.gov.au/life-claims-data-collection.
5 Refer to https://www.moneysmart.gov.au/tools-and-resources/calculators-and-apps/life-insurance-claims-
comparison-tool.

AUSTRALIAN PRUDENTIAL REGULATION AUTHORITY 9
Data interpretation and disclaimer
Data interpretation
This publication provides claims and disputes data for the seven cover types listed in Table 4.
Table 4: Cover types included in this publication
Cover type Description
Death Cover that provides a lump-sum payment in the event of the death of the insured
life. Can be with or without a Terminal Illness benefit.
Total and
Permanent
Disability (TPD)
Cover that provides a lump-sum payment in the event of the insured life being
considered totally and permanently disabled in accordance with the policy
definition.
Disability
Income
Insurance (DII)
Cover that provides for a regular payment for a maximum defined benefit period
after a defined waiting period, in the event of the insured life being considered
totally or partially disabled in accordance with the policy definitions. DII is
relevant for both Individual and Group contracts and is commonly referred to as
Income Protection and Group Salary Continuance, respectively.
Trauma
Cover that provides a lump-sum payment in the event of the occurrence of a
predefined illness or traumatic event. Trauma can be either standalone or an
acceleration of the Death/TPD benefit.
Consumer
Credit
Insurance (CCI)
Insurance providing for a lump-sum payment of the insured’s outstanding loan or
credit card balance (in part or in full) or regular payments limited to the
minimum repayments for a period, payable in the event of one or more
predefined events occurring. CCI can relate to the death, incapacity or involuntary
redundancy of the insured life.
Funeral
Insurance
Insurance for paying the expenses of, or incidental to, the funeral, burial or
cremation of the insured life.
Accident
Insurance
Insurance providing for a lump-sum payment in the event of the accidental death
or injury of the insured life.
This publication also distinguishes four life insurance distribution channels, as explained in
Table 5. Note that the split differs slightly from the split used in the May 2018 Response
Paper; refer to the glossary accompanying this publication for an exact breakdown of the
distribution channels.

AUSTRALIAN PRUDENTIAL REGULATION AUTHORITY 10
Table 5: Distribution channels included in this publication
Channel Description
Individual
Advised
Individually underwritten insurance that was sold with the provision of personal
advice.
Individual
Non-Advised
Individually underwritten insurance that was sold without the provision of personal
advice. This includes where no advice or general advice is provided.
Group Super
Group superannuation business, where the trustee of a superannuation fund with
at least five members purchased a group insurance policy to provide cover for the
fund members.
Group
Ordinary
Group business outside of superannuation, where an employer purchased a group
insurance policy to provide cover for its employees.
All distribution channels except Group Ordinary are also included in ASIC’s MoneySmart tool.
Note that one channel that is collected through LRF 750.0, Individual Non-Advised Super, is
not included in this publication, as this channel is very small with only 74 finalised claims in
total across all cover types.
Six cover type and distribution channel combinations are not provided for in APRA’s reporting
form, and are listed as ‘n/a’ in the relevant industry-level tables:
Individual Advised CCI
Individual Advised Funeral
Group Super CCI
Group Super Funeral
Group Super Accident
Group Ordinary Funeral
Further, while they are possible combinations, no business was reported for Group Super
Trauma and Group Ordinary Accident; these combinations therefore also show ‘n/a’ in this
publication.
Some of the tables in this industry-level publication combine the four distribution channels
for a cover type. This may conceal some variability across distribution channels – in other
words, consumer experience may differ across the channels. A breakdown by distribution
channel is provided in the accompanying entity-level spreadsheet publication.
Masking
A few data items have been masked with an asterisk (*), as the sample size was too small to
be statistically credible. For any cover type and distribution channel combination, APRA
applies masking in the following cases:
If an insurer reports more than 0, but fewer than 50 claims finalised.
If only one insurer is masked due to having fewer than 50 claims, the next-lowest is also
masked, as otherwise it would be possible to reverse engineer the masked data from the
industry total and the sum of the non-masked insurers.

AUSTRALIAN PRUDENTIAL REGULATION AUTHORITY 11
If only one insurer provides a specific combination and it has fewer than 50 claims
finalised, the industry-level data is also masked. In this publication, that is the case for
Group Ordinary CCI.
Where insurers with fewer than 50 claims comprise more than 70 per cent of the total
number of claims finalised, the other insurers are also masked (but the industry totals
are still provided).
Masking is applied consistently across claims and disputes data for the relevant cover type
and distribution channel combination. That is, if an insurer’s Individual Advised Death claims
data is masked, all Individual Advised Death data across claims, claims duration, disputes
and disputes duration is masked for that insurer. Conversely, if claims data is not masked for
the insurer, all claims, claims duration, disputes and disputes duration data is shown.
Important disclaimer
If you are a consumer and should you wish to use the information in this publication when
making a decision on what life insurance policy to acquire, please consider the following:
The data is historic and provides no guarantee for future experience;
Some samples are small, especially for disputes data. Outliers can therefore have a
disproportionate impact on an insurer’s reported results; and
Next to the claims and disputes experience, consumers should take other relevant
considerations into account, including (but not limited to):
o personal circumstances and medical history;
o product coverage;
o any exclusions;
o waiting periods;
o pricing, including premium structure (level or stepped); and
o in the case of insurance in superannuation: the fund’s overall superannuation
offering and the impact on your super savings.
Consumers should use this information to compare claims and disputes outcomes only.
Whatever insurance you choose, it is important to review your cover against your needs on a
regular basis.
ASIC’s MoneySmart website explains what to look for in insurance products so you can find
the right policy for your needs: https://www.moneysmart.gov.au/insurance.

AUSTRALIAN PRUDENTIAL REGULATION AUTHORITY 12
Industry-level results
This chapter presents the key industry-level claims and dispute outcomes for 20 Australian
life insurers6 writing direct business (i.e. excluding reinsurance), covering the period from
1 July 2017 to 30 June 2018. A spreadsheet publication with additional information and entity-
level data, and a glossary explaining in detail all relevant terms used, are available on APRA’s
website.7
Attachment B presents additional information on the key characteristics of the Australian
direct life insurance market for the cover types included in this publication: lives insured,
annual premium volume, sum insured, new business written and lapse rate.
Claims outcomes
Table 6: Claims outcomes by cover type (combines distribution channels)
Claims
Finalised
Claims
Admitted
Claims
Declined
Claims
Withdrawn
Claims
Undetermined^
Cover type % of
received# % of finalised % of finalised % of received % of received
Death 89% 97% 3% 3% 9%
TPD 67% 86% 14% 6% 27%
Trauma 86% 85% 15% 4% 10%
DII 84% 95% 5% 5% 11%
CCI 83% 86% 14% 10% 8%
Funeral 98% 99% 1% 0% 1%
Accident 91% 79% 21% 3% 6%
# ‘Claims received’ is the sum of: claims that were undetermined at the start of the reporting period; claims that
were received during the reporting period; and claims that insurers re-opened (subsequent to being withdrawn)
during the reporting period.
^ ‘Claims Undetermined’ refers to all claims that remain open for assessment at the end of the reporting period.
Table 6 summarises the claims outcomes by cover type, combining all distribution channels.
The share of claims that are finalised during the reporting period varies considerably across
the cover types. This is due in part to the relative complexity of assessing the claim: a TPD
product generally takes longer than a Funeral claim, so a high share of Funeral claims are
6 A list of contributing entities is provided in Attachment A.
7 Refer to https://www.apra.gov.au/life-claims-data-collection.

AUSTRALIAN PRUDENTIAL REGULATION AUTHORITY 13
finalised, whereas a relatively large share of TPD claims remains undetermined at the end of
the reporting period.
The relatively lower admittance rate in respect cover types such as TPD, Trauma and
Accident in part reflects the complexities of assessing these claims, as well as consumer
clarity on what exactly is covered by the policy. Death and Funeral claims, on the other hand,
are relatively straightforward to assess, which is reflected in their high admittance rate.
Compared to other cover types, CCI has a large share of withdrawn claims. The withdrawn
reasons are provided in Table 10.
Table 7: Claims admittance rate by cover type and distribution channel
Individual Advised Individual
Non-Advised Group Super Group Ordinary
Cover
type
Claims
finalised
%
admitted
Claims
finalised
%
admitted
Claims
finalised
%
admitted
Claims
finalised
%
admitted
Death 3,800 97% 1,321 88% 15,362 98% 184 100%
TPD 1,360 85% 56 68% 15,923 86% 52 81%
Trauma 4,617 85% 950 84% n/a n/a 17 88%
DII 12,601 94% 2,349 83% 20,663 96% 2,913 95%
CCI n/a n/a 9,490 86% n/a n/a * *
Funeral n/a n/a 11,708 99% n/a n/a n/a n/a
Accident 116 16% 3,260 81% n/a n/a n/a n/a
Table 7 summarises the claims admittance rate by cover type and distribution channel. While
only Group Ordinary CCI is masked, several other combinations have a very small number of
claims finalised in the reporting period: Individual Advised Accident (116 claims across the
industry), Individual Non-Advised TPD (56 claims), Group Ordinary Death (184 claims), Group
Ordinary TPD (52 claims) and Group Ordinary Trauma (17 claims). The agencies urge caution
in interpreting the results for these combinations, as such a low volume of claims leads to
more volatility in the reported admittance rates.

AUSTRALIAN PRUDENTIAL REGULATION AUTHORITY 14
Table 8: Claims decline reasons by cover type (combines distribution channels)
Cover type
Contractual
definition not
met
Exclusion
clause
Unintentional non-
disclosure or mis-
representation
Fraudulent
claim
Other
reasons
Death 54% 33% 7% 2% 5%
TPD 85% 7% 1% 0% 6%
Trauma 82% 10% 2% 1% 5%
DII 61% 19% 10% 1% 8%
CCI 71% 26% 1% 1% 2%
Funeral 12% 80% 0% 0% 8%
Accident 61% 31% 0% 0% 8%
Table 8 summarises the reasons provided by insurers for declining a claim, by cover type.
With the exception of Funeral policies, the contractual definition not being met is the
dominant cause for claims being declined. For Funeral policies, exclusion causes are the
main decline reason.
Table 9: Claims withdrawn rate by cover type and distribution channel
Cover type Individual
Advised
Individual
Non-Advised Group Super Group Ordinary
Death 4% 4% 2% 4%
TPD 11% 11% 5% 6%
Trauma 4% 4% n/a 0%
DII 6% 7% 4% 2%
CCI n/a 10% n/a *
Funeral n/a 0% n/a n/a
Accident 4% 3% n/a n/a
Table 9 summarises the claims withdrawn rate by cover type and distribution channel.
Withdrawal rates are relatively low across all cover type and distribution channel
combinations, topping at 11 per cent for TPD (both Individual Advised and Non-Advised).

AUSTRALIAN PRUDENTIAL REGULATION AUTHORITY 15
Table 10: Claims withdrawn reasons by cover type (combines distribution channels)
Cover type Withdrawn by
claimant
Withdrawn by insurer
due to claimant
inactivity
Other reasons
Death 46% 33% 21%
TPD 46% 46% 8%
Trauma 72% 18% 10%
DII 57% 37% 6%
CCI 31% 66% 3%
Funeral 14% 83% 2%
Accident 42% 46% 13%
Table 10 summarises the claims withdrawn reasons by cover type. For Death, Trauma and
DII claims, most withdrawals were initiated by claimants. For CCI and Funeral claims, most
withdrawals were initiated by the insurer due to claimant inactivity. This could be because the
insurer did not receive any response from the claimant when further information was
requested, as well as (for some cover types) instances where the insured has deceased
subsequent to the claim being lodged and the claim is no longer relevant. Finally, there is a
(close to) even split between claimant and insurer for TPD and Accident.
Claim frequency and claims paid ratio
Table 11: Claims frequency by cover type and distribution channel
Cover type Individual
Advised
Individual
Non-Advised Group Super Group Ordinary
Death 0.18% 0.19% 0.12% 0.10%
TPD 0.11% 0.06% 0.12% 0.02%
Trauma 0.48% 0.26% n/a 0.27%
DII 1.37% 1.68% 0.44% 0.65%
CCI n/a 0.30% n/a *
Funeral n/a 1.40% n/a n/a
Accident 0.12% 0.34% n/a n/a
Table 11 summarises the claims frequency by cover type and distribution channel. The
claims frequency refers to the number of admitted claims as a proportion of average lives
AUSTRALIAN PRUDENTIAL REGULATION AUTHORITY 16
insured. As reported in Table 7, certain combinations have a very small number of claims
finalised in the reporting period. The same caveats regarding the interpretation of the results
therefore apply here as well.
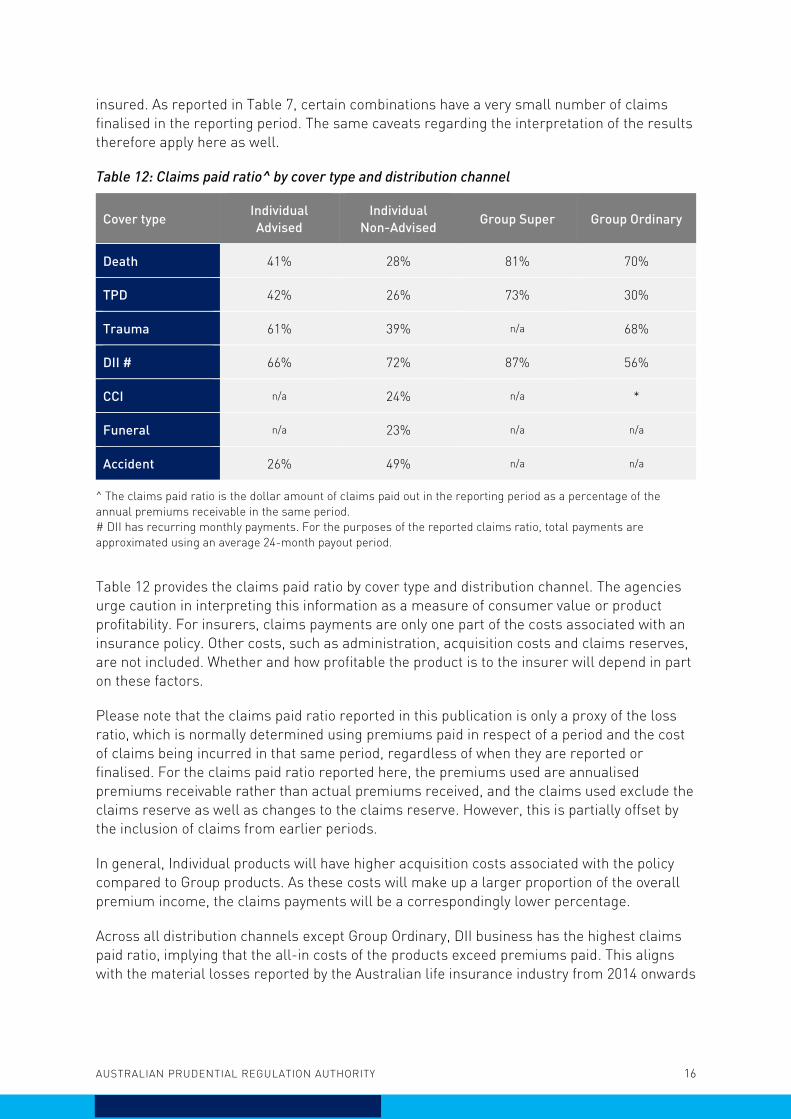
Table 12: Claims paid ratio^ by cover type and distribution channel
Cover type Individual
Advised
Individual
Non-Advised Group Super Group Ordinary
Death 41% 28% 81% 70%
TPD 42% 26% 73% 30%
Trauma 61% 39% n/a 68%
DII # 66% 72% 87% 56%
CCI n/a 24% n/a *
Funeral n/a 23% n/a n/a
Accident 26% 49% n/a n/a
^ The claims paid ratio is the dollar amount of claims paid out in the reporting period as a percentage of the
annual premiums receivable in the same period.
# DII has recurring monthly payments. For the purposes of the reported claims ratio, total payments are
approximated using an average 24-month payout period.
Table 12 provides the claims paid ratio by cover type and distribution channel. The agencies
urge caution in interpreting this information as a measure of consumer value or product
profitability. For insurers, claims payments are only one part of the costs associated with an
insurance policy. Other costs, such as administration, acquisition costs and claims reserves,
are not included. Whether and how profitable the product is to the insurer will depend in part
on these factors.
Please note that the claims paid ratio reported in this publication is only a proxy of the loss
ratio, which is normally determined using premiums paid in respect of a period and the cost
of claims being incurred in that same period, regardless of when they are reported or
finalised. For the claims paid ratio reported here, the premiums used are annualised
premiums receivable rather than actual premiums received, and the claims used exclude the
claims reserve as well as changes to the claims reserve. However, this is partially offset by
the inclusion of claims from earlier periods.
In general, Individual products will have higher acquisition costs associated with the policy
compared to Group products. As these costs will make up a larger proportion of the overall
premium income, the claims payments will be a correspondingly lower percentage.
Across all distribution channels except Group Ordinary, DII business has the highest claims
paid ratio, implying that the all-in costs of the products exceed premiums paid. This aligns
with the material losses reported by the Australian life insurance industry from 2014 onwards

AUSTRALIAN PRUDENTIAL REGULATION AUTHORITY 17
for the Individual DII product, and the observations made in APRA’s thematic review into the
sustainability of this product.8
Claims processing duration
Table 13: Claims processing duration by cover type (combines distribution channels)
Cover type 0-2 weeks
>2 weeks
to 2
months
>2 months
to 6
months
>6 months
to 12
months
>12 months
Est. average
duration
(months)
Death 66% 19% 10% 3% 2% 1.8
TPD 15% 21% 36% 18% 10% 5.7
Trauma 39% 41% 15% 3% 1% 1.9
DII 41% 42% 13% 3% 1% 1.7
CCI 58% 30% 9% 2% 1% 1.4
Funeral 95% 4% 1% 0% 0% 0.6
Accident 81% 12% 4% 2% 1% 1.0
Table 13 summarises claims processing durations in respect of finalised claims. This is the
period of time from when a claim is reported to when it is finalised. The table shows, for each
cover type, the distribution of finalised claims across different duration categories, with the
estimated average duration (in months) reported in the final column. TPD has the longest
average claims processing duration, whereas Funeral insurance has the shortest, which
reflects the respective complexity of these products. For Death, CCI, Funeral and Accident,
the majority of claims are finalised within 0-2 weeks.
8 Refer to Seeking sustainability: challenges facing individual disability income insurance, APRA Insight (2018), and the
Quarterly Life Insurance Performance Statistics.

AUSTRALIAN PRUDENTIAL REGULATION AUTHORITY 18
Dispute lodgement ratio
Table 14: Dispute lodgement ratio^ by cover type and distribution channel
Cover type Individual
Advised
Individual
Non-Advised Group Super Group Ordinary
Death 6 13 1 4
TPD 28 71 14 51
Trauma 38 10 n/a 0
DII # 130 219 14 25
CCI n/a 28 n/a *
Funeral n/a 3 n/a n/a
Accident 24 10 n/a n/a
^ The dispute lodgement ratio is the number of disputes lodged during the reporting period per 100,000 lives
insured.
Table 14 provides the dispute lodgement ratio, which is defined as the number of disputes
lodged per 100,000 lives insured. In this publication, a ‘dispute’ can refer to a dispute
managed within the insurer's internal dispute resolution system, a dispute registered with an
external dispute resolution scheme or tribunal, or legal proceedings initiated by the claimant
against the insurer regarding a claim.
The dispute lodgement ratio is indicative of the likelihood of a claims-related dispute
occurring. However, the agencies urge caution in interpreting this information. The dispute
rate per finalised claim could be considered a more appropriate measure of the probability of
a claims-related dispute. However, because both the numerator and denominator are very
small, the resulting ratio would be very volatile, particularly at the entity level. Assuming that
for a fixed number of lives insured the likelihood of a claim is broadly constant over time,
using lives insured as the denominator creates a more stable ratio.
The agencies also note that disputes generally relate to old claims, and even older claim
events; any insurer that has rapidly grown or shrunk its in-force book since then may report
dispute lodgement ratios that significantly differ from the ‘true’ underlying experience. This is
particularly likely for insurers in run-off and for the Group Super channel.
Table 14 shows that more complex products have higher dispute lodgement ratios. TPD and
DII in particular show relatively high ratios. While DII shows higher ratios than TPD, it also
has a higher claims frequency (Table 11). Comparing distribution channels, the Individual
Non-Advised channel generally shows higher dispute ratios.

AUSTRALIAN PRUDENTIAL REGULATION AUTHORITY 19
Disputes outcomes
Table 15: Disputes outcomes by cover type (combines distribution channels)
Disputes
Resolved
Original
decision
maintained
Original
decision
reversed
Other
outcomes
Disputes
Withdrawn
Disputes
Undetermined
^
Cover type % of
lodged#
% of
resolved
% of
resolved
% of
resolved
% of
lodged % of lodged
Death 73% 33% 12% 55% 5% 22%
TPD 65% 32% 10% 57% 3% 33%
Trauma 79% 50% 12% 38% 4% 17%
DII 76% 34% 10% 56% 5% 19%
CCI 93% 6% 5% 89% 0% 3%
Funeral 82% 26% 22% 52% 7% 11%
Accident 85% 33% 11% 56% 1% 13%
# ‘Disputes lodged’ refers to disputes that were undetermined at the start of the reporting period; disputes that
were received during the reporting period; and disputes that insurers re-opened (subsequent to being withdrawn)
during the reporting period.
^ ‘Disputes Undetermined’ refers to all disputes that remain open for assessment at the end of the reporting
period.
Table 15 summarises disputes outcomes by cover type. It includes all claims-related
disputes in the data collection, whether they are internal, external or litigated. Apart from
Trauma, most disputes are resolved by other means. These include, but are not limited to,
those resolved through ex-gratia payment, premium refund, partial payment, settlement or
non-cash benefit and resolved outside jurisdiction (the latter for external disputes only). CCI
has the highest proportion of disputes resolved by other outcomes. The highest rate of claim
reversal decisions is in relation to Funeral at 22 per cent, albeit with a low number of total
disputes resolved (23 – shown in the entity-level publication).
As the number of claims-related disputes will be a fraction of the number of claims, it follows
that there is only a relatively small sample of disputes. A total of 4,521 disputes were
resolved during the reporting period. TPD and DII make up the vast majority of disputes,
representing 31 per cent and 38 per cent of the total, respectively. Two products in particular
have a small number of disputes resolved: Funeral (23 disputes) and Accident (70 disputes).

AUSTRALIAN PRUDENTIAL REGULATION AUTHORITY 20
Table 16: Original decision reversed reasons by cover type (combines distribution channels)
Cover type Original outcome
incorrect
Additional information
received Other reasons
Death 27% 46% 27%
TPD 36% 54% 10%
Trauma 54% 34% 11%
DII 40% 47% 13%
CCI 5% 49% 46%
Funeral 40% 40% 20%
Accident 0% 75% 25%
Table 16 summarises original decision reversed reasons by cover type. Claims outcomes
were mainly reversed due to additional information being received. The main exception is
Trauma policies, where outcomes were primarily changed due to the original outcome having
been determined to be incorrect.
Table 17: Dispute withdrawn reasons by cover type (combines distribution channels)
Cover type Withdrawn by
claimant
Withdrawn by
insurer due to
claimant
inactivity
Withdrawn by
EDR, court or
tribunal
Other reasons
Death 40% 27% 20% 13%
TPD 65% 27% 4% 4%
Trauma 64% 18% 0% 18%
DII 65% 19% 10% 5%
CCI 100% 0% 0% 0%
Funeral 50% 0% 50% 0%
Accident 0% 100% 0% 0%
Table 17 summarises disputes withdrawn reasons by cover type. Note that during the
reporting period, 198 disputes in total were withdrawn across all cover types; the reported
results will therefore be subject to significant margins of error. Possible exceptions are DII
(103 disputes withdrawn) and TPD (57 disputes). At the other extreme, CCI, Funeral and
Accident have 7 withdrawn disputes between them.

AUSTRALIAN PRUDENTIAL REGULATION AUTHORITY 21
Disputes processing duration
Table 18: Disputes processing duration by cover type (combines distribution channels)
Cover type 0-45 days >45 days to
90 days >90 days
Est. average
duration
(months)
Death 65% 13% 21% 4.0
TPD 42% 10% 48% 6.1
Trauma 67% 19% 14% 2.1
DII 72% 10% 18% 2.7
CCI 92% 5% 4% 1.1
Funeral 88% 8% 4% 1.0
Accident 79% 6% 16% 2.5
Table 18 summarises disputes processing duration by cover type. The majority of disputes
were resolved in 0-45 days. TPD has the longest estimated average disputes processing
duration at roughly six months, reflecting the product’s complexity, whereas CCI and Funeral
disputes tend to have significantly shorter processing durations.

AUSTRALIAN PRUDENTIAL REGULATION AUTHORITY 22
Attachment A – List of insurers
The following entities have submitted data for this statistical publication:
Life insurer or Friendly Society Short name
AIA Australia Limited AIAA
Allianz Australia Life Insurance Limited Allianz
AMP Life Limited AMP
ClearView Life Assurance Limited ClearView
The Colonial Mutual Life Assurance Society Limited CMLA
Hallmark Life Insurance Company Ltd Hallmark
Hannover Life Re of Australasia Ltd Hannover Re
H C F Life Insurance Company Pty Ltd HCF
MetLife Insurance Limited MetLife
MLC Limited MLC
NobleOak Life Limited NobleOak
OnePath Life Limited OnePath
QBE Life (Australia) Limited / Integrity Life Australia Limited * QBE / Integrity
QInsure Limited QInsure
St Andrew's Life Insurance Pty Ltd St Andrews
Suncorp Life & Superannuation Limited / Asteron Life & Superannuation
Limited ^ Suncorp / Asteron
Swiss Re Life & Health Australia Limited Swiss Re
TAL Life Limited TAL
Westpac Life Insurance Services Limited # Westpac
Zurich Australia Limited Zurich
* Integrity Group Holdings acquired QBE Life (Australia) Limited in December 2017, and renamed it Integrity Life
Australia Limited.
^ Suncorp Life & Superannuation Limited was renamed Asteron Life & Superannuation Limited in February 2019.
# St. George Life Limited’s business was transferred to Westpac Life Insurance Services Limited in September
2018. For the purposes of this publication, St. George’s data is combined with Westpac’s.

AUSTRALIAN PRUDENTIAL REGULATION AUTHORITY 23
Attachment B – Policy statistics
Table B.1 provides, for each cover type and distribution channel, the key characteristics of the
Australian direct life insurance market: lives insured, annual premium volume, sum insured,
new business written and lapse rate.
Table B.1: Policy statistics by cover type and distribution channel
Death TPD Trauma DII ^ CCI Funeral Accident
Individual Advised
Lives insured (‘000) 2,070 1,216 842 946 n/a n/a 16
Annual premium
($ million) 3,186 1,218 1,365 2,581 n/a n/a 6
Sum insured
($ million) 1,303,079 768,515 213,450 6,312 n/a n/a 6,441
New business # 6% 9% 7% 9% n/a n/a 14%
Lapse rate # 15% 15% 15% 13% n/a n/a 11%
Individual Non-
Advised
Lives insured (‘000) 612 50 332 121 2,972 885 815
Annual premium
($ million) 625 28 72 169 369 492 114
Sum insured
($ million) 225,650 17,317 15,992 560 60,688 8,273 79,545
New business # 17% 26% 20% 26% 19% 23% 14%
Lapse rate # 14% 13% 15% 22% 23% 9% 13%
Group Super
Lives insured (‘000) 13,059 11,968 n/a 4,974 n/a n/a n/a
Annual premium
($ million) 2,486 2,235 n/a 1,788 n/a n/a n/a
Sum insured
($ million) 2,595,465 2,037,677 n/a 17,413 n/a n/a n/a
New business # 11% 8% n/a 12% n/a n/a n/a
Lapse rate # 14% 7% n/a 13% n/a n/a n/a

AUSTRALIAN PRUDENTIAL REGULATION AUTHORITY 24
Death TPD Trauma DII ^ CCI Funeral Accident
Group Ordinary
Lives insured (‘000) 185 239 5 459 101 n/a n/a
Annual premium
($ million) 46 24 2 422 4 n/a n/a
Sum insured
($ million) 33,414 21,156 278 3,174 1,023 n/a n/a
New business # 16% 15% 58% 13% 0% n/a n/a
Lapse rate # 19% 14% 91% 6% 0% n/a n/a
# New business and the lapse rate are as a percentage of average annual premiums.
^ DII sum insured is expressed as a monthly benefit.

AUSTRALIAN PRUDENTIAL REGULATION AUTHORITY 25