Embed Size (px)
Citation preview

June 2020 Quarterly Results
For
per
sona
l use
onl
y

FORWARD LOOKING STATEMENTThese materials prepared by Evolution Mining Limited (or “the Company”) include forward looking statements. Often, but not always, forward looking statements can generally be identified by the use of
forward looking words such as “may”, “will”, “expect”, “intend”, “plan”, “estimate”, “anticipate”, “continue”, and “guidance”, or other similar words and may include, without limitation, statements regarding
plans, strategies and objectives of management, anticipated production or construction commencement dates and expected costs or production outputs.
Forward looking statements inherently involve known and unknown risks, uncertainties and other factors that may cause the Company’s actual results, performance and achievements to differ materially
from any future results, performance or achievements. Relevant factors may include, but are not limited to, changes in commodity prices, foreign exchange fluctuations and general economic conditions,
increased costs and demand for production inputs, the speculative nature of exploration and project development, including the risks of obtaining necessary licenses and permits and diminishing quantities
or grades of reserves, political and social risks, changes to the regulatory framework within which the Company operates or may in the future operate, environmental conditions including extreme weather
conditions, recruitment and retention of personnel, industrial relations issues and litigation.
Forward looking statements are based on the Company and its management’s good faith assumptions relating to the financial, market, regulatory and other relevant environments that will exist and affect
the Company’s business and operations in the future. The Company does not give any assurance that the assumptions on which forward looking statements are based will prove to be correct, or that the
Company’s business or operations will not be affected in any material manner by these or other factors not foreseen or foreseeable by the Company or management or beyond the Company’s control.
Although the Company attempts and has attempted to identify factors that would cause actual actions, events or results to differ materially from those disclosed in forward looking statements, there may be
other factors that could cause actual results, performance, achievements or events not to be as anticipated, estimated or intended, and many events are beyond the reasonable control of the Company.
Accordingly, readers are cautioned not to place undue reliance on forward looking statements. Forward looking statements in these materials speak only at the date of issue. Subject to any continuing
obligations under applicable law or any relevant stock exchange listing rules, in providing this information the Company does not undertake any obligation to publicly update or revise any of the forward
looking statements or to advise of any change in events, conditions or circumstances on which any such statement is based.
Non-IFRS Financial Information
The Company results are reported under International Financial Reporting Standards (IFRS). This presentation also includes non-IFRS information including EBITDA and Underlying Profit. The non-IFRS
information has not been subject to audit or review by the Company’s external auditor and should be used in addition to IFRS information.
This presentation has been authorised for release to the ASX by Executive Chairman Jake Klein
2
For
per
sona
l use
onl
y

Record
cash flow
Cowal Maiden
Underground
reserve
Mine operating
cash flow
39% QoQ1
to A$352M
Supports accelerated Stage 1
mine development
Underground Ore Reserve 804koz2
Underground Mineral Resources 2.9Moz2
Progressing ahead of schedule
RECORD JUNE 2020 QUARTER
3
1. QoQ: Quarter on Quarter
2. This information is extracted from the ASX release entitled “Cowal Maiden Underground Ore Reserve Supports Mine Development” released to the ASX on 23 July 2020. See slides 15 to 16 in the Appendix of this slide deck
Red Lake
transformation
Net mine
cash flow
41% to A$225M
Free
cash flow
69% to A$188M
Cash at
bank
by A$205M
Development metres in excess of 1,000m
per month achieved in May and June
For
per
sona
l use
onl
y

FY20 HIGHLIGHTS
4
192.0 170.9 165.5
218.1
FY20 Q1 FY20 Q2 FY20 Q3 FY20 Q4
Group production (koz)
1. YoY: Year on year
2. Includes C1 cash cost, plus royalties, sustaining capital, general corporate and administration
expense. Calculated per ounce sold
3. Using the average AUD:USD exchange rate of 0.6714 for FY20
1,018 1,069 991 1,088
FY20 Q1 FY20 Q2 FY20 Q3 FY20 Q4
Group AISC (A$ per ounce)
45% YoY1
to A$1,121M
48% to A$736M
Mine operating
cash flow
Net mine
cash flow
86% to A$542MFree
cash flow
Group gold production of 746,463 ounces at
an AISC2 of A$1,043 per ounce (US$700/oz)3
9.38.4
7.2 6.8
FY20 Q1 FY20 Q2 FY20 Q3 FY20 Q4
Group safety performance (TRIF)
For
per
sona
l use
onl
y

5
Acquisition of high-grade, long-life Red Lake gold mine in Ontario, Canada
Cowal Underground Maiden Ore Reserve of 804koz and
Mineral Resource increased to 2.9Moz
Divestment of short life Cracow gold mine in Queensland
Exploration success at Cowal, Red Lake, Mungari and Crush Creek
Group average reserve life of over 10 years
CONTINUED EXECUTION OF PORTFOLIO UPGRADE STRATEGY IN FY20
5
For
per
sona
l use
onl
y

JUNE 2020 OPERATIONS SUMMARY
6
Safety
◼ Proactive reporting culture
◼ Less people hurt
◼ Pre-emptive COVID-19
management
◼ Zero reported cases at our
operations
Sustainability
◼ Annual Sustainability audits
conducted at all operations
◼ Improving water security at Cowal
◼ Assisting local communities during
COVID-19
June 2020
Quarter
Production
(koz)
AISC
(A$/oz)
Mine
Operating
Cash Flow
(A$M)
Net Mine Cash
Flow (A$M)
Cowal 60.6 941 117.4 59.3
Ernest Henry 28.2 (617) 71.3 68.3
Mungari 37.2 1089 53.1 39.8
Mt Rawdon 26.0 1305 34.6 32.3
Mt Carlton 15.0 1325 11.7 0.0
Sub Total 167.0 937 288.1 199.7
Red Lake 27.4 1943 30.8 (2.9)
Sub Total 194.4 1,087 318.9 196.8
Cracow (divested 1 Jul 2020)
23.7 1090 33.2 27.8
Group 218.1 1,088 352.1 224.5
For
per
sona
l use
onl
y

◼ Maiden Underground Ore Reserve of 804koz
◼ Mineral Resources increased to 2.9Moz
◼ Stage 1 underground mine development accelerated
◼ Annual underground mining rates expected to be between
1.5 – 2.0Mtpa
◼ Application for regulatory approval to be submitted early in
the December 2020 quarter
COWAL UNDERGROUND ORE RESERVE
7
661
1,461
603
1,411
1,842
1,451
Dec 2017 Dec 2018 Dec 2019 Apr 2020
Growth of Cowal Underground
Mineral Resources (koz)
Indicated Inferred
3,430
5,045 5,039 6,080
7,415
8,591 9,000
Jun 2015 Dec2015
Dec2016
Dec2017
Dec2018
Dec2019
Apr 2020
Growth of Cowal Total Mineral
Resources (koz)
1,555
2,847 3,201 3,047
3,881 3,633
4,437
Jun2015
Dec2015
Dec2016
Dec2017
Dec2018
Dec2019
Apr2020
Growth of Cowal Total Ore Reserves
(koz)
Section of Cowal GRE-46 Underground area with the red outline showing the Maiden Underground Ore
Reserve area and exploration decline and the yellow showing the updated Mineral Resource as of April
2020
7
For
per
sona
l use
onl
y
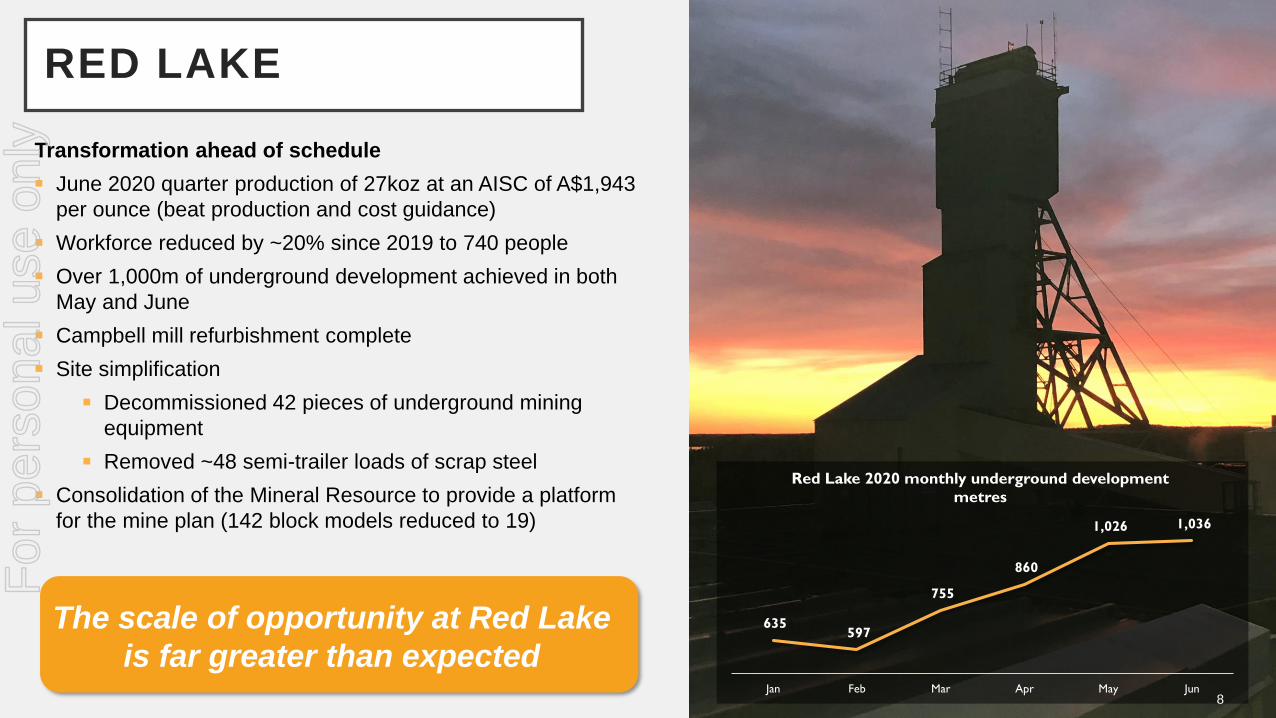
RED LAKE
Transformation ahead of schedule
◼ June 2020 quarter production of 27koz at an AISC of A$1,943
per ounce (beat production and cost guidance)
◼ Workforce reduced by ~20% since 2019 to 740 people
◼ Over 1,000m of underground development achieved in both
May and June
◼ Campbell mill refurbishment complete
◼ Site simplification
◼ Decommissioned 42 pieces of underground mining
equipment
◼ Removed ~48 semi-trailer loads of scrap steel
◼ Consolidation of the Mineral Resource to provide a platform
for the mine plan (142 block models reduced to 19)
635 597
755
860
1,026 1,036
Jan Feb Mar Apr May Jun
Red Lake 2020 monthly underground development
metres
8
The scale of opportunity at Red Lake
is far greater than expected
For
per
sona
l use
onl
y

Best intersections
Red Lake extensional drilling at Cochenour
6.09m (4.67m etw) grading 18.86g/t Au which confirmed extension of the Gold Eagle
Corridor along strike to the north
Cowal underground infill drilling
94m (75.2m etw) grading 5.0g/t Au and 33m (26.4m etw) grading 19.0g/t Au
Mungari infill drilling at Boomer
0.79m (0.67m etw) grading 133.8g/t Au and 0.40m (0.33m etw) grading 98.6g/t Au
Mt Carlton extensional and infill drilling at Crush Creek
31.7m (27.5m etw) grading 5.68g/t Au and 4.0m (4.0m) grading 25.89g/t Au
EXPLORATION HIGHLIGHTS
9
This information is extracted from the ASX release entitled “June 2020 Quarterly Report” released to the ASX on 23
July 2020. Evolution confirms that it is not aware of any new information or data that materially affects information
included in that release and that all material assumptions and technical parameters underpinning the estimates
continue to apply and have not materially changed. The Company confirms that the form and context in which the
Competent Persons’ findings are presented have not been materially modified from the original market
announcement.
Total drilling23,550m (resource definition)
40,587m (discovery)
Exploration drilling at Crush Creek
Boomer ore (Mungari)
For
per
sona
l use
onl
y

FINANCIALS
10
◼ Globally competitive AISC of A$1,043/oz (US$700/oz)
◼ Australian operations at top end of guidance1
◼ Red Lake below bottom end of guidance
◼ All sites cash positive after capital investments
◼ AIC margin of A$765/oz
◼ Record quarterly and full year cash flows2
◼ June 2020 quarter: A$188M
◼ FY20: A$542M
◼ Higher gold price translating to cash in bank
◼ Increased by A$205M during quarter to A$374M
◼ Net bank debt down to A$196M
◼ Cracow proceeds of A$60M received in July 2020
1. AISC in line with revised guidance of A$990 per ounce before the impact of higher gold price
(royalties) and lower copper price (by-product credits)
2. Group free cash flow before dividends, debt and M&A
159
84112
188
Sep 2019 Qtr Dec 2019 Qtr Mar 2020 Qtr Jun 2020 Qtr
Group cash flow (A$M)
1,008
1,943
1,043
Australian operations Red Lake Group
FY20 AISC (A$/oz)
784
253
765
Australian operations Red Lake Group
FY20 AIC margin (A$/oz)
For
per
sona
l use
onl
y

Record cash generation
Cowal underground development accelerated
Red Lake transformation ahead of schedule
SUMMARY
11
For
per
sona
l use
onl
y

APPENDIXFor
per
sona
l use
onl
y
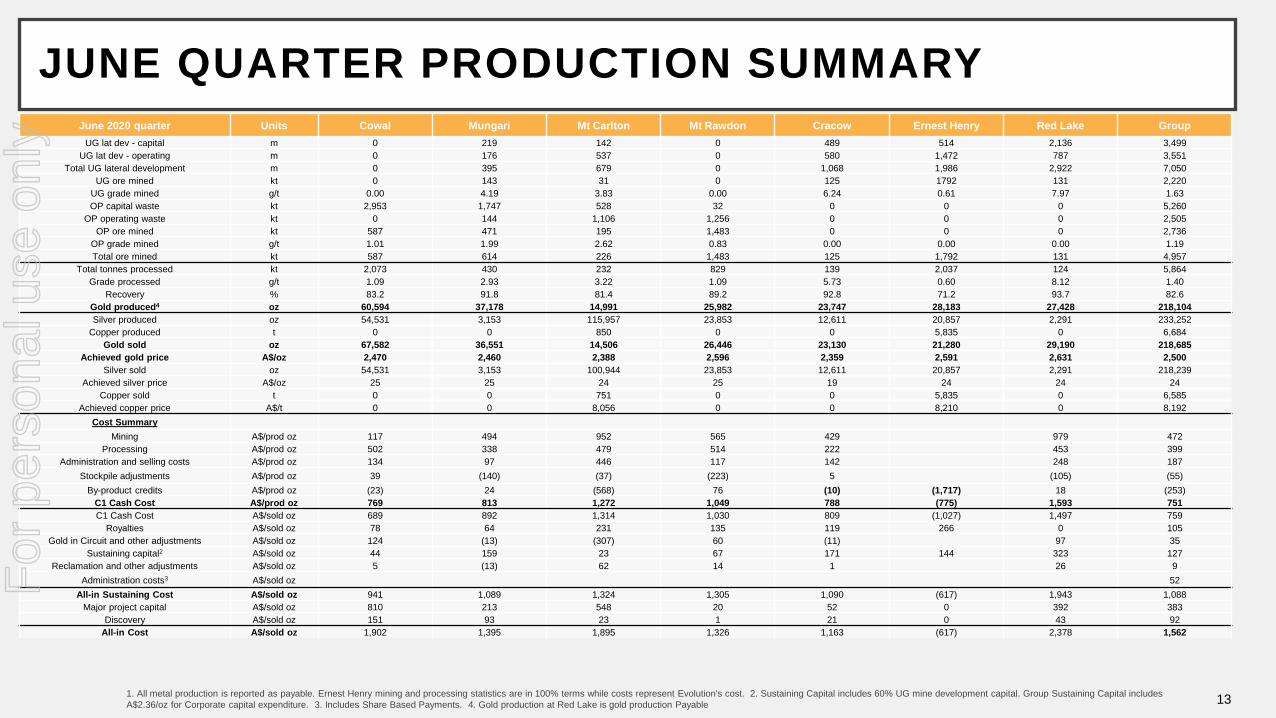
JUNE QUARTER PRODUCTION SUMMARY
131. All metal production is reported as payable. Ernest Henry mining and processing statistics are in 100% terms while costs represent Evolution's cost. 2. Sustaining Capital includes 60% UG mine development capital. Group Sustaining Capital includes
A$2.36/oz for Corporate capital expenditure. 3. Includes Share Based Payments. 4. Gold production at Red Lake is gold production Payable
June 2020 quarter Units Cowal Mungari Mt Carlton Mt Rawdon Cracow Ernest Henry Red Lake Group
UG lat dev - capital m 0 219 142 0 489 514 2,136 3,499
UG lat dev - operating m 0 176 537 0 580 1,472 787 3,551
Total UG lateral development m 0 395 679 0 1,068 1,986 2,922 7,050
UG ore mined kt 0 143 31 0 125 1792 131 2,220
UG grade mined g/t 0.00 4.19 3.83 0.00 6.24 0.61 7.97 1.63
OP capital waste kt 2,953 1,747 528 32 0 0 0 5,260
OP operating waste kt 0 144 1,106 1,256 0 0 0 2,505
OP ore mined kt 587 471 195 1,483 0 0 0 2,736
OP grade mined g/t 1.01 1.99 2.62 0.83 0.00 0.00 0.00 1.19
Total ore mined kt 587 614 226 1,483 125 1,792 131 4,957
Total tonnes processed kt 2,073 430 232 829 139 2,037 124 5,864
Grade processed g/t 1.09 2.93 3.22 1.09 5.73 0.60 8.12 1.40
Recovery % 83.2 91.8 81.4 89.2 92.8 71.2 93.7 82.6
Gold produced4 oz 60,594 37,178 14,991 25,982 23,747 28,183 27,428 218,104
Silver produced oz 54,531 3,153 115,957 23,853 12,611 20,857 2,291 233,252
Copper produced t 0 0 850 0 0 5,835 0 6,684
Gold sold oz 67,582 36,551 14,506 26,446 23,130 21,280 29,190 218,685
Achieved gold price A$/oz 2,470 2,460 2,388 2,596 2,359 2,591 2,631 2,500
Silver sold oz 54,531 3,153 100,944 23,853 12,611 20,857 2,291 218,239
Achieved silver price A$/oz 25 25 24 25 19 24 24 24
Copper sold t 0 0 751 0 0 5,835 0 6,585
Achieved copper price A$/t 0 0 8,056 0 0 8,210 0 8,192
Cost Summary
Mining A$/prod oz 117 494 952 565 429 979 472
Processing A$/prod oz 502 338 479 514 222 453 399
Administration and selling costs A$/prod oz 134 97 446 117 142 248 187
Stockpile adjustments A$/prod oz 39 (140) (37) (223) 5 (105) (55)
By-product credits A$/prod oz (23) 24 (568) 76 (10) (1,717) 18 (253)
C1 Cash Cost A$/prod oz 769 813 1,272 1,049 788 (775) 1,593 751
C1 Cash Cost A$/sold oz 689 892 1,314 1,030 809 (1,027) 1,497 759
Royalties A$/sold oz 78 64 231 135 119 266 0 105
Gold in Circuit and other adjustments A$/sold oz 124 (13) (307) 60 (11) 97 35
Sustaining capital2 A$/sold oz 44 159 23 67 171 144 323 127
Reclamation and other adjustments A$/sold oz 5 (13) 62 14 1 26 9
Administration costs3 A$/sold oz 52
All-in Sustaining Cost A$/sold oz 941 1,089 1,324 1,305 1,090 (617) 1,943 1,088
Major project capital A$/sold oz 810 213 548 20 52 0 392 383
Discovery A$/sold oz 151 93 23 1 21 0 43 92
All-in Cost A$/sold oz 1,902 1,395 1,895 1,326 1,163 (617) 2,378 1,562
For
per
sona
l use
onl
y

FY20 YTD Units Cowal Mungari Mt Carlton Mt Rawdon Cracow Ernest Henry Group (ex Red Lake) Red Lake Group
UG lat dev - capital m 1,935 515 1,530 0 1,810 1,025 6,815 2,136 8,950
UG lat dev - operating m 0 964 1,024 0 2,429 6,702 11,120 787 11,906
Total UG lateral development m 1,935 1,480 2,555 0 4,239 7,727 17,934 2,922 20,857
UG ore mined kt 0 473 54 0 484 7068 8,080 131 8,210
UG grade mined g/t 0.00 3.71 3.58 0.00 5.91 0.59 1.11 7.97 1.22
OP capital waste kt 14,000 1,752 3,776 2,251 0 0 21,779 0 21,779
OP operating waste kt 165 2,443 1,847 4,380 0 0 8,835 0 8,835
OP ore mined kt 2,817 1,852 733 4,323 0 0 9,726 0 9,726
OP grade mined g/t 1.17 1.97 3.04 0.72 0.00 0.00 1.27 0.00 1.27
Total ore mined kt 2,817 2,325 787 4,323 484 7,068 17,805 131 17,936
Total tonnes processed kt 8,486 1,841 894 3,312 527 7,045 22,106 124 22,230
Grade processed g/t 1.17 2.47 3.04 0.87 5.63 0.59 1.23 8.12 1.27
Recovery % 81.9 91.4 83.5 88.5 91.8 74.7 82.2 93.7 82.6
Gold produced oz 262,035 133,388 58,962 82,004 87,744 94,902 719,035 27,428 746,463
Silver produced oz 178,380 12,281 276,284 90,495 40,700 71,255 669,396 2,291 671,687
Copper produced t 0 0 1,783 0 0 20,688 22,471 0 22,471
Gold sold oz 276,170 133,556 62,293 82,308 86,698 94,440 735,465 29,190 764,655
Achieved gold price A$/oz 2,224 2,224 2,354 2,343 2,249 2,286 2,259 2,631 2,274
Silver sold oz 178,380 12,281 261,194 90,495 40,700 71,255 654,305 2,291 656,596
Achieved silver price A$/oz 25 25 25 25 22 25 25 24 25
Copper sold t 0 0 1,681 0 0 20,688 22,369 0 22,369
Achieved copper price A$/t 0 0 8,409 0 0 8,409 8,409 0 8,409
Cost Summary
Mining A$/prod oz 101 674 380 570 452 378 979 400
Processing A$/prod oz 478 348 567 561 241 410 453 412
Administration and selling costs A$/prod oz 129 107 424 143 158 187 248 189
Stockpile adjustments A$/prod oz 123 (76) 36 43 (3) 38 (105) 33
By-product credits A$/prod oz (17) (2) (352) (28) (10) (1,852) (284) 18 (273)
C1 Cash Cost A$/prod oz 815 1,050 1,055 1,289 837 (743) 729 1,593 761
C1 Cash Cost A$/sold oz 773 1,049 999 1,285 847 (747) 713 1,497 743
Royalties A$/sold oz 68 56 191 117 120 197 104 0 100
Gold in Circuit and other adjustments A$/sold oz 46 (4) (36) 8 (6) 14 97 17
Sustaining capital2 A$/sold oz 41 100 259 121 233 119 114 323 122
Reclamation and other adjustments A$/sold oz 6 15 41 16 9 11 26 12
Administration costs3 A$/sold oz 52 50
All-in Sustaining Cost A$/sold oz 933 1,215 1,453 1,546 1,203 (432) 1,008 1,943 1,043
Major project capital A$/sold oz 613 100 1,050 147 57 0 360 392 362
Discovery A$/sold oz 169 132 16 1 30 0 107 43 104
All-in Cost A$/sold oz 1,715 1,447 2,519 1,694 1,290 (432) 1,475 2,378 1,509
Depreciation & Amortisation4 A$/prod oz 335 408 1,004 549 457 1,328 574 411 570
FY2020 PRODUCTION SUMMARY
14
1. All metal production is reported as payable. Ernest Henry mining and processing statistics are in 100% terms while costs represent Evolution's cost and not solely the cost of Ernest Henry's operation. 2. Sustaining Capital includes 60% UG mine
development capital. Group Sustaining Capital includes A$2.36/oz for Corporate capital expenditure. 3. Includes Share Based Payments. 4. Group Depreciation and Amortisation includes non-cash Fair Value Unwind Amortisation of A$24/oz in relation to
Cowal (A$34/oz) and Mungari ($68/oz) and Corporate Depreciation and Amortisation of A$1.96/oz
For
per
sona
l use
onl
y
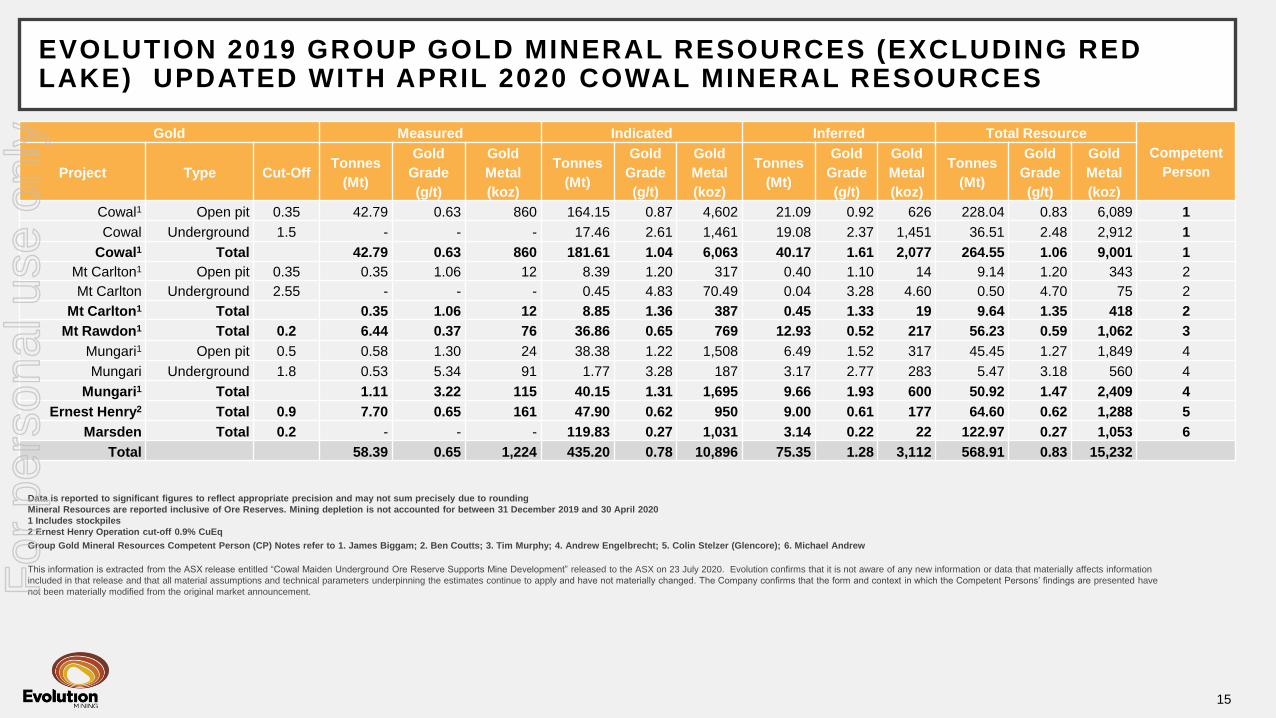
EVOLUTION 2019 GROUP GOLD MINERAL RESOURCES (EXCLUDING RED LAKE) UPDATED WITH APRIL 2020 COWAL MINERAL RESOURCES
15
Data is reported to significant figures to reflect appropriate precision and may not sum precisely due to rounding
Mineral Resources are reported inclusive of Ore Reserves. Mining depletion is not accounted for between 31 December 2019 and 30 April 2020
1 Includes stockpiles
2 Ernest Henry Operation cut-off 0.9% CuEq
Group Gold Mineral Resources Competent Person (CP) Notes refer to 1. James Biggam; 2. Ben Coutts; 3. Tim Murphy; 4. Andrew Engelbrecht; 5. Colin Stelzer (Glencore); 6. Michael Andrew
This information is extracted from the ASX release entitled “Cowal Maiden Underground Ore Reserve Supports Mine Development” released to the ASX on 23 July 2020. Evolution confirms that it is not aware of any new information or data that materially affects information
included in that release and that all material assumptions and technical parameters underpinning the estimates continue to apply and have not materially changed. The Company confirms that the form and context in which the Competent Persons’ findings are presented have
not been materially modified from the original market announcement.
Gold Measured Indicated Inferred Total Resource
Competent
PersonProject Type Cut-OffTonnes
(Mt)
Gold
Grade
(g/t)
Gold
Metal
(koz)
Tonnes
(Mt)
Gold
Grade
(g/t)
Gold
Metal
(koz)
Tonnes
(Mt)
Gold
Grade
(g/t)
Gold
Metal
(koz)
Tonnes
(Mt)
Gold
Grade
(g/t)
Gold
Metal
(koz)
Cowal1 Open pit 0.35 42.79 0.63 860 164.15 0.87 4,602 21.09 0.92 626 228.04 0.83 6,089 1
Cowal Underground 1.5 - - - 17.46 2.61 1,461 19.08 2.37 1,451 36.51 2.48 2,912 1
Cowal1 Total 42.79 0.63 860 181.61 1.04 6,063 40.17 1.61 2,077 264.55 1.06 9,001 1
Mt Carlton1 Open pit 0.35 0.35 1.06 12 8.39 1.20 317 0.40 1.10 14 9.14 1.20 343 2
Mt Carlton Underground 2.55 - - - 0.45 4.83 70.49 0.04 3.28 4.60 0.50 4.70 75 2
Mt Carlton1 Total 0.35 1.06 12 8.85 1.36 387 0.45 1.33 19 9.64 1.35 418 2
Mt Rawdon1 Total 0.2 6.44 0.37 76 36.86 0.65 769 12.93 0.52 217 56.23 0.59 1,062 3
Mungari1 Open pit 0.5 0.58 1.30 24 38.38 1.22 1,508 6.49 1.52 317 45.45 1.27 1,849 4
Mungari Underground 1.8 0.53 5.34 91 1.77 3.28 187 3.17 2.77 283 5.47 3.18 560 4
Mungari1 Total 1.11 3.22 115 40.15 1.31 1,695 9.66 1.93 600 50.92 1.47 2,409 4
Ernest Henry2 Total 0.9 7.70 0.65 161 47.90 0.62 950 9.00 0.61 177 64.60 0.62 1,288 5
Marsden Total 0.2 - - - 119.83 0.27 1,031 3.14 0.22 22 122.97 0.27 1,053 6
Total 58.39 0.65 1,224 435.20 0.78 10,896 75.35 1.28 3,112 568.91 0.83 15,232
For
per
sona
l use
onl
y

EVOLUTION 2019 GROUP GOLD ORE RESERVES (EXCLUDING RED LAKE) UPDATED WITH APRIL 2020 COWAL ORE RESERVES
16
Data is reported to significant figures to reflect appropriate precision and may not sum precisely due to rounding. Mining depletion is not accounted for between 31 December 2019 and 30 April 2020
1 Includes stockpiles
2 Ernest Henry Operation cut-off 0.9% CuEq
Group Gold Ore Reserve Competent Person (CP) Notes refer to 1. Ryan Kare; 2. Joshua Northfield; 3. Anton Kruger; 4. Mark Boon; 5. Ken Larwood; 6. Mike Corbett (Glencore);
This information is extracted from the ASX release entitled “Cowal Maiden Underground Ore Reserve Supports Mine Development” released to the ASX on 23 July 2020. Evolution confirms that it is not aware of any new information or data that materially affects information included in that
release and that all material assumptions and technical parameters underpinning the estimates continue to apply and have not materially changed. The Company confirms that the form and context in which the Competent Persons’ findings are presented have not been materially modified
from the original market announcement.
Gold Proved Probable Total ReserveCompetent
PersonProject Type Cut-OffTonnes
(Mt)
Gold
Grade (g/t)
Gold Metal
(koz)
Tonnes
(Mt)
Gold Grade
(g/t)
Gold Metal
(koz)
Tonnes
(Mt)
Gold
Grade (g/t)
Gold Metal
(koz)
Cowal1 Open pit 0.45 42.79 0.63 860 89.43 0.96 2,773 132.22 0.85 3,634 1
Cowal2 Underground 1.8 - - - 9.96 2.51 804 9.96 2.51 804 2
Cowal3 Total 42.79 0.63 860 99.39 1.12 3,577 142.18 0.97 4,438
Mt Carlton1 Open pit 0.8 0.35 1.06 12 6.35 1.27 259 6.70 1.26 271 3
Mt Carlton Underground 3.2 - - - 0.36 3.44 40 0.36 3.40 40 3
Mt Carlton1 Total 0.35 1.06 12 6.71 1.38 299 7.06 1.37 311 3
Mt Rawdon1 Open pit 0.24 3.73 0.45 53 20.92 0.72 485 24.65 0.68 538 4
Mungari Underground 2.9 0.43 4.05 56 0.07 5.35 12 0.50 4.25 68
Mungari1 Open pit 0.75 0.58 1.28 24 10.55 1.40 476 11.12 1.40 500
Mungari1 Total 1.01 2.47 80 10.62 1.43 489 11.63 1.52 568 5
Ernest Henry2 Underground 0.9 6.10 0.80 156 33.40 0.47 505 39.40 0.52 660 6
Marsden Open pit 0.3 - - - 65.17 0.39 817 65.17 0.39 817 3
Total 53.98 0.67 1,161 236.22 0.81 6,172 290.10 0.79 7,332
For
per
sona
l use
onl
y

Copper Measured Indicated Inferred Total Resource
Competent
PersonProject Type Cut-OffTonnes
(Mt)
Copper
Grade
(%)
Copper
Metal
(kt)
Tonnes
(Mt)
Copper
Grade (%)
Copper
Metal
(kt)
Tonnes
(Mt)
Copper
Grade
(%)
Copper
Metal
(kt)
Tonnes
(Mt)
Copper
Grade
(%)
Copper
Metal
(kt)
Marsden Total 0.2 - - - 119.83 0.46 553 3.14 0.24 7 122.97 0.46 560 1
Ernest Henry2 Total 0.9 2.60 1.17 30 20.90 1.16 243 7.10 1.16 83 30.60 1.16 356 2
Mt Carlton1 Open pit 0.35 0.35 0.21 1 3.55 0.36 13 0.40 0.18 1 4.30 0.33 14 3
Mt Carlton Underground 2.55 - - - 0.45 0.77 3 0.04 0.53 0 0.50 0.75 4 3
Mt Carlton1 Total 0.35 0.21 1 4.01 0.41 16 0.45 0.21 1 4.80 0.38 18 3
Total 2.95 1.04 31 144.74 0.56 812 10.69 0.85 91 158.37 0.59 934
Copper Proved Probable Total Reserve
Competent
PersonProject Type Cut-OffTonnes
(Mt)
Copper
Grade (%)
Copper
Metal (kt)
Tonnes
(Mt)
Copper Grade
(%)
Copper
Metal (kt)
Tonnes
(Mt)
Copper
Grade (%)
Copper
Metal (kt)
Marsden 0.3 - - - 65.17 0.57 371 65.17 0.57 371 1
Ernest Henry2 Total 0.9 1.8 1.50 27 13.2 0.93 123 15.1 1.00 150 2
Mt Carlton1 Open pit 1.8 0.35 0.21 1 1.51 0.61 9 1.86 0.54 10 1
Mt Carlton Underground 3.2 - - - 0.36 0.39 1 0.36 0.39 1 1
Mt Carlton1 Total 0.35 0.21 1 1.88 0.57 11 2.22 0.51 11 1
Total 2.15 1.29 28 80.25 0.63 505 82.49 0.65 532
EVOLUTION 2019 COPPER MINERAL RESOURCES AND ORE RESERVES
17
Data is reported to significant figures to reflect appropriate precision and may not sum precisely due to rounding. Mineral Resources are reported inclusive of Ore Reserves. Mining depletion is not accounted for between 31 December 2019 and 30 April 2020
1 Includes stockpiles 2 Ernest Henry Operation cut-off 0.9% CuEq
Group Ore Reserve Competent Person (CP) Notes refer to: 1. Anton Kruger; 2. Mike Corbett (Glencore). This information is extracted from the ASX release entitled “June 2020 Quarterly Report” released to the ASX on 23 July 2020. Evolution cut-off grades are reported
in g/t gold. Full details of the Ernest Henry Mineral Resources and Ore Reserves are provided in the report entitled “Glencore Resources and Reserves as at 31 December 2019” released 4 February 2020 and available to view at www.glencore.com Evolution Mining has an
economic interest earning rights to 100% of the revenue from future gold production and 30% of future copper and silver produced from an agreed life of mine area, and 49% of future gold, copper and silver produced from the Ernest Henry Resource outside the agreed area.
Ernest Henry Reserve is reported here on the basis of economic interest and not the entire mine reserve. The above reported figures constitute 37.4% of the total Ernest Henry copper resource and 33.9 % of the total Ernest Henry copper reserve. Evolution confirms that it is
not aware of any new information or data that materially affects information included in these releases and that all material assumptions and technical parameters underpinning the estimates continue to apply and have not materially changed. The Company confirms that the
form and context in which the Competent Persons’ findings are presented have not been materially modified from the original market announcements.
Group Mineral Resources Competent Person (CP) Notes refer to: 1. Michael Andrew; 2. Colin Stelzer (Glencore); 3 Ben Coutts
For
per
sona
l use
onl
y