Embed Size (px)
Citation preview
June 3, 2010 [email protected]
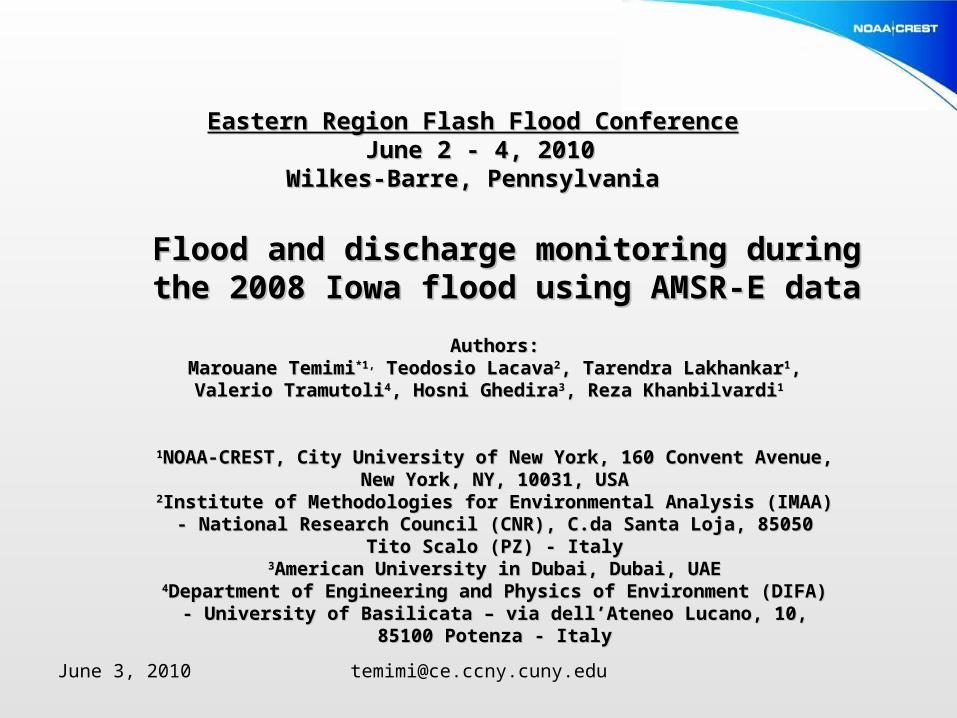
Eastern Region Flash Flood ConferenceEastern Region Flash Flood Conference June 2 - 4, 2010June 2 - 4, 2010
Wilkes-Barre, PennsylvaniaWilkes-Barre, Pennsylvania
Flood and discharge monitoring during the 2008 Flood and discharge monitoring during the 2008 Iowa flood using AMSR-E dataIowa flood using AMSR-E data
Authors:Authors:Marouane TemimiMarouane Temimi*1,*1, Teodosio Lacava Teodosio Lacava22, Tarendra Lakhankar, Tarendra Lakhankar11, Valerio , Valerio
TramutoliTramutoli44, Hosni Ghedira, Hosni Ghedira33, Reza Khanbilvardi, Reza Khanbilvardi11
11NOAA-CREST, City University of New York, 160 Convent Avenue, New York, NOAA-CREST, City University of New York, 160 Convent Avenue, New York, NY, 10031, USANY, 10031, USA
22Institute of Methodologies for Environmental Analysis (IMAA) - National Institute of Methodologies for Environmental Analysis (IMAA) - National Research Council (CNR), C.da Santa Loja, 85050 Tito Scalo (PZ) - ItalyResearch Council (CNR), C.da Santa Loja, 85050 Tito Scalo (PZ) - Italy
33American University in Dubai, Dubai, UAEAmerican University in Dubai, Dubai, UAE44Department of Engineering and Physics of Environment (DIFA) - University Department of Engineering and Physics of Environment (DIFA) - University
of Basilicata – via dell’Ateneo Lucano, 10, 85100 Potenza - Italyof Basilicata – via dell’Ateneo Lucano, 10, 85100 Potenza - Italy
June 3, 2010 [email protected]
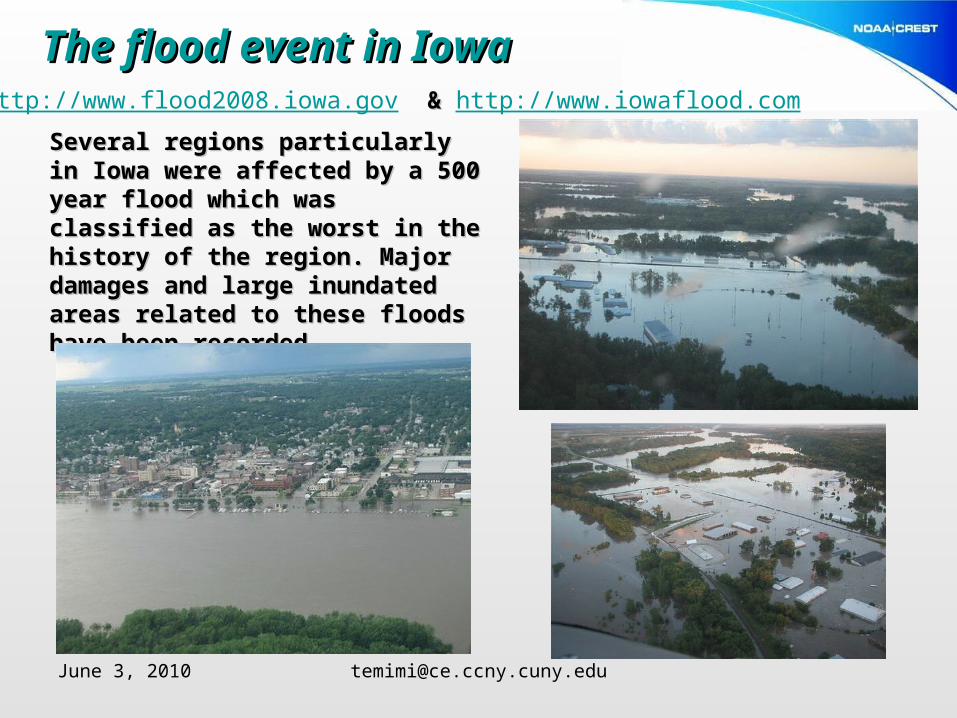
The flood event in Iowa The flood event in Iowa
Several regions particularly in Iowa Several regions particularly in Iowa were affected by a 500 year flood were affected by a 500 year flood which was classified as the worst in which was classified as the worst in the history of the region. Major the history of the region. Major damages and large inundated areas damages and large inundated areas related to these floods have been related to these floods have been recorded. recorded.
http://www.flood2008.iowa.gov & & http://www.iowaflood.com
June 3, 2010 [email protected]
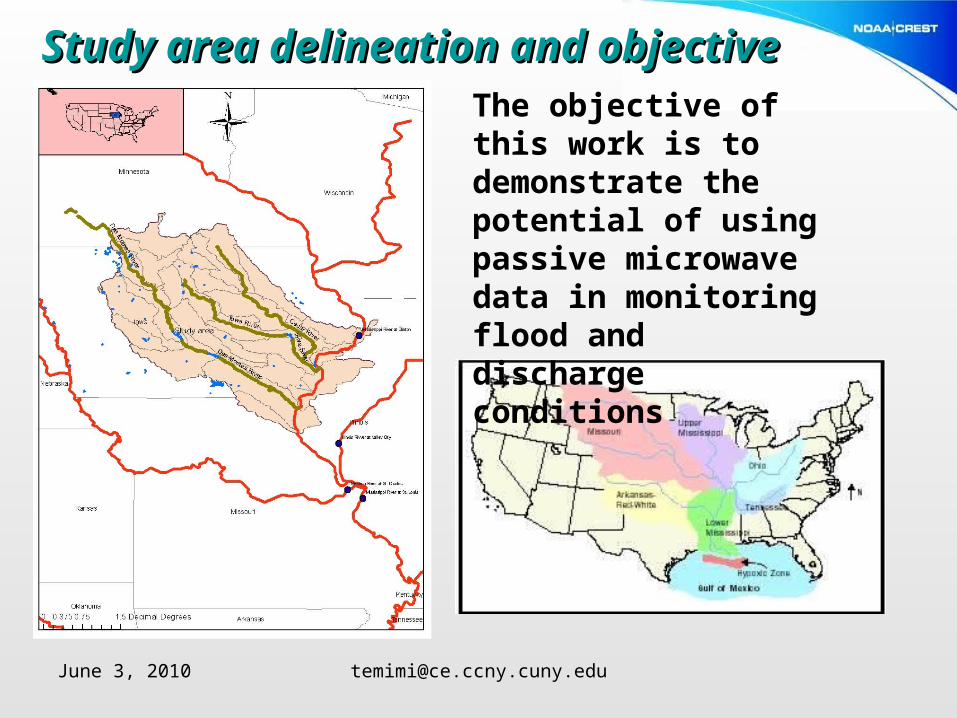
Study area delineation and objectiveStudy area delineation and objectiveThe objective of this work is to demonstrate the potential of using passive microwave data in monitoring flood and discharge conditions
June 3, 2010 [email protected]
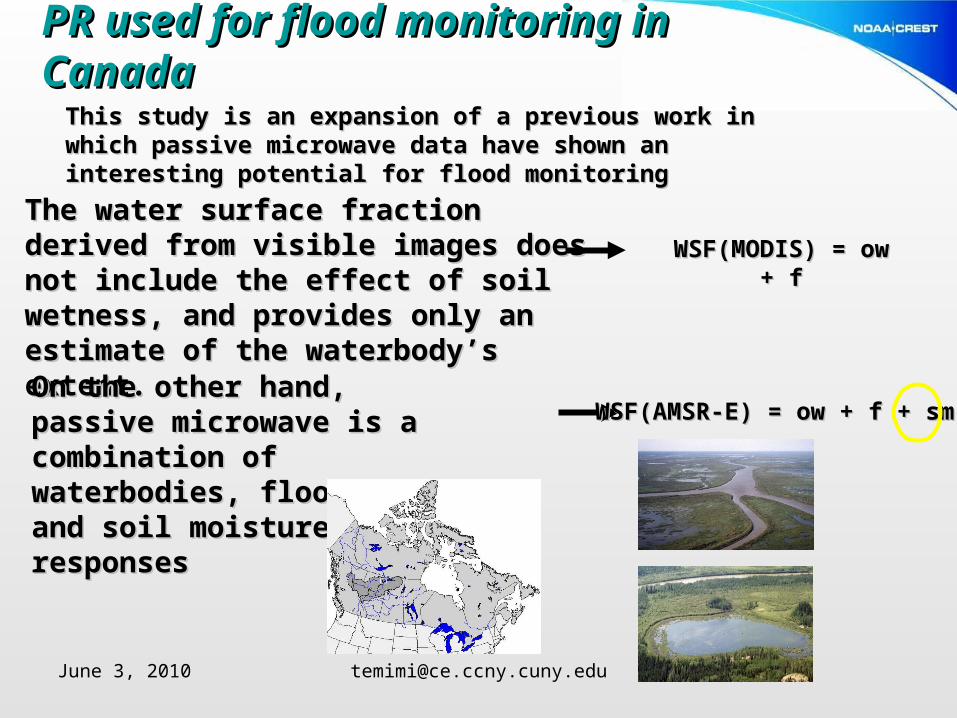
PR used for flood monitoring in CanadaPR used for flood monitoring in CanadaThis study is an expansion of a previous work in which passive This study is an expansion of a previous work in which passive microwave data have shown an interesting potential for flood microwave data have shown an interesting potential for flood monitoringmonitoring
The water surface fraction derived from The water surface fraction derived from visible images does not include the effect of visible images does not include the effect of soil wetness, and provides only an estimate of soil wetness, and provides only an estimate of the waterbody’s extent. the waterbody’s extent.
On the other hand, passive On the other hand, passive microwave is a combination of microwave is a combination of waterbodies, flooded area and soil waterbodies, flooded area and soil moisture responsesmoisture responses
WSF(MODIS) = ow + fWSF(MODIS) = ow + f
WSF(AMSR-E) = ow + f + smWSF(AMSR-E) = ow + f + sm
June 3, 2010 [email protected]
Basin Wetness IndexBasin Wetness Index
WSF(MODIS)
WSF(AMSR-E)
a)a)
WSF(MODIS)
WSF(AMSR-E)
c)c)
WSF(MODIS)
WSF(AMSR-E)
b)b)
WSF(MODIS)
WSF(AMSR-E)
d)d)
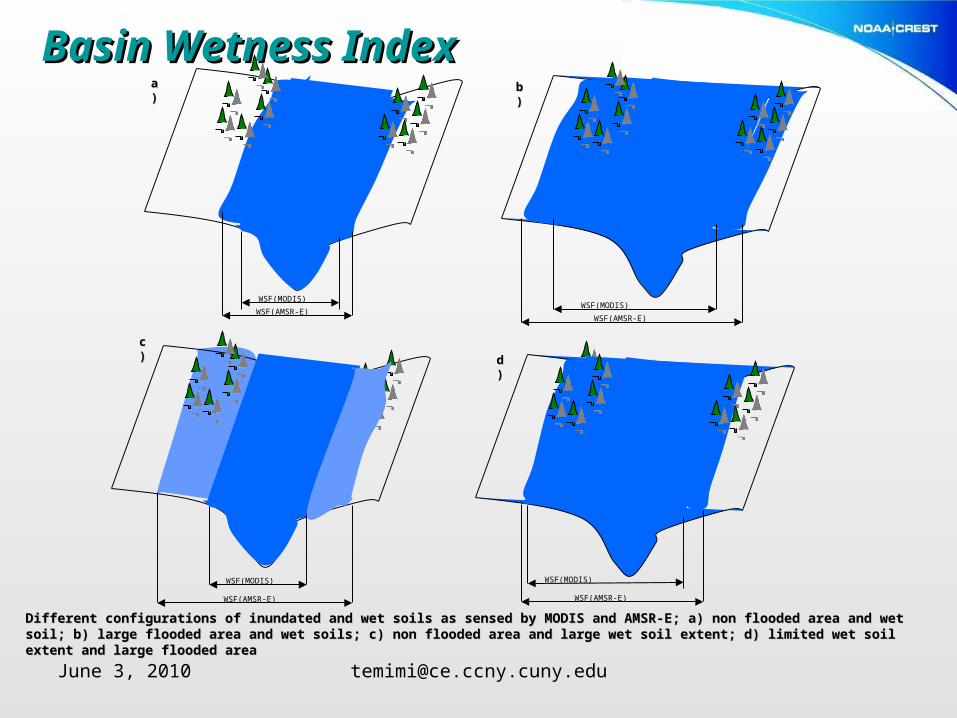
Different configurations of inundated and wet soils as sensed by MODIS and AMSR-E; a) non flooded area and wet soil; b) large flooded area Different configurations of inundated and wet soils as sensed by MODIS and AMSR-E; a) non flooded area and wet soil; b) large flooded area and wet soils; c) non flooded area and large wet soil extent; d) limited wet soil extent and large flooded areaand wet soils; c) non flooded area and large wet soil extent; d) limited wet soil extent and large flooded area
June 3, 2010 [email protected]
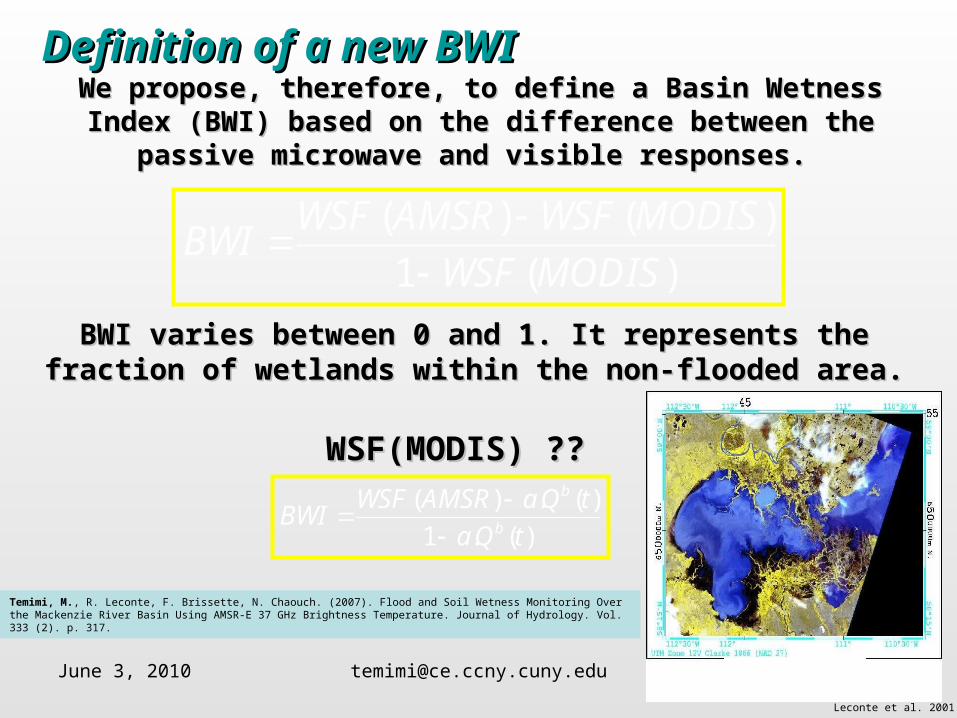
We propose, therefore, to define a Basin Wetness Index (BWI) based on We propose, therefore, to define a Basin Wetness Index (BWI) based on the difference between the passive microwave and visible responses.the difference between the passive microwave and visible responses.
)(1
)()(
MODISWSF
MODISWSFAMSRWSFBWI
BWI varies between 0 and 1. It represents the fraction of wetlands BWI varies between 0 and 1. It represents the fraction of wetlands within the non-flooded area. within the non-flooded area.
WSF(MODIS) ??WSF(MODIS) ??
Definition of a new BWIDefinition of a new BWI
)(.1
)(.)(
tQa
tQaAMSRWSFBWI
b
b
Temimi, M., R. Leconte, F. Brissette, N. Chaouch. (2007). Flood and Soil Wetness Monitoring Over the Mackenzie River Basin Using AMSR-E 37 GHz Brightness Temperature. Journal of Hydrology. Vol. 333 (2). p. 317.
Leconte et al. 2001
June 3, 2010 [email protected]
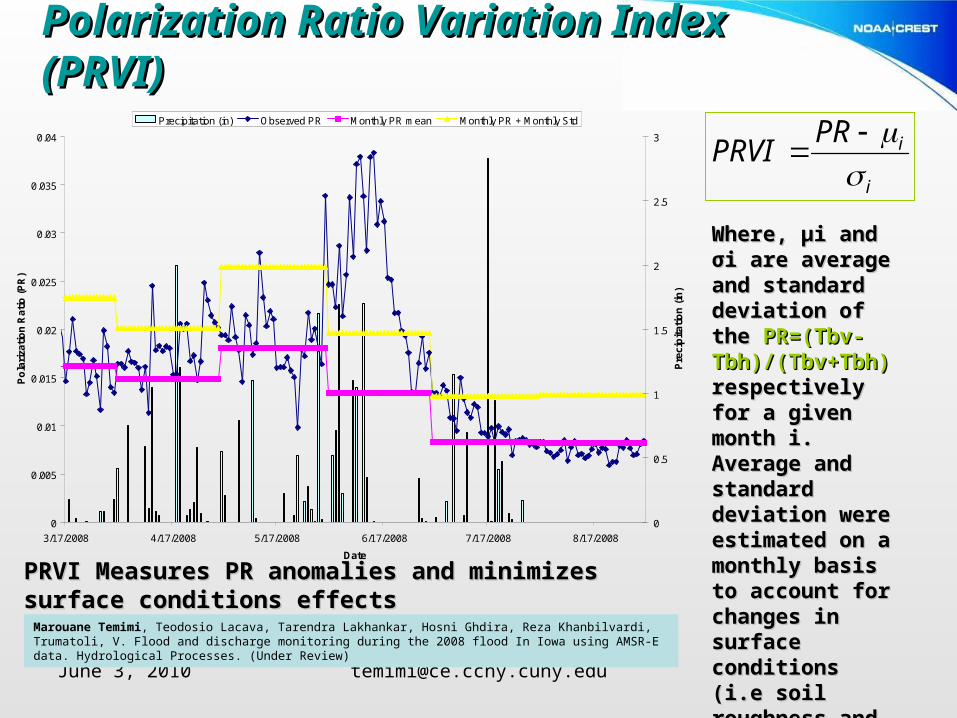
Polarization Ratio Variation Index (PRVI)Polarization Ratio Variation Index (PRVI)
0
0.005
0.01
0.015
0.02
0.025
0.03
0.035
0.04
3/17/2008 4/17/2008 5/17/2008 6/17/2008 7/17/2008 8/17/2008
Date
Po
lari
zati
on
Rat
io (
PR
)
0
0.5
1
1.5
2
2.5
3
Pre
cip
itat
ion
(in
)
Precipitation (in) Observed PR Monthly PR mean Monthly PR + Monthly Std
MarchApril
May
June
July August
i
iPRPRVI
Where, μi and σi Where, μi and σi are average and are average and standard deviation standard deviation of the of the PR=(Tbv-PR=(Tbv-Tbh)/(Tbv+Tbh)Tbh)/(Tbv+Tbh) respectively for a respectively for a given month i. given month i. Average and Average and standard deviation standard deviation were estimated on were estimated on a monthly basis to a monthly basis to account for account for changes in changes in surface conditions surface conditions (i.e soil roughness (i.e soil roughness and vegetation and vegetation density) which density) which might affect the might affect the microwave signal. microwave signal.
PRVI Measures PR anomalies and minimizes surface PRVI Measures PR anomalies and minimizes surface conditions effectsconditions effects
Marouane Temimi, Teodosio Lacava, Tarendra Lakhankar, Hosni Ghdira, Reza Khanbilvardi, Trumatoli, V. Flood and discharge monitoring during the 2008 flood In Iowa using AMSR-E data. Hydrological Processes. (Under Review)
June 3, 2010 [email protected]
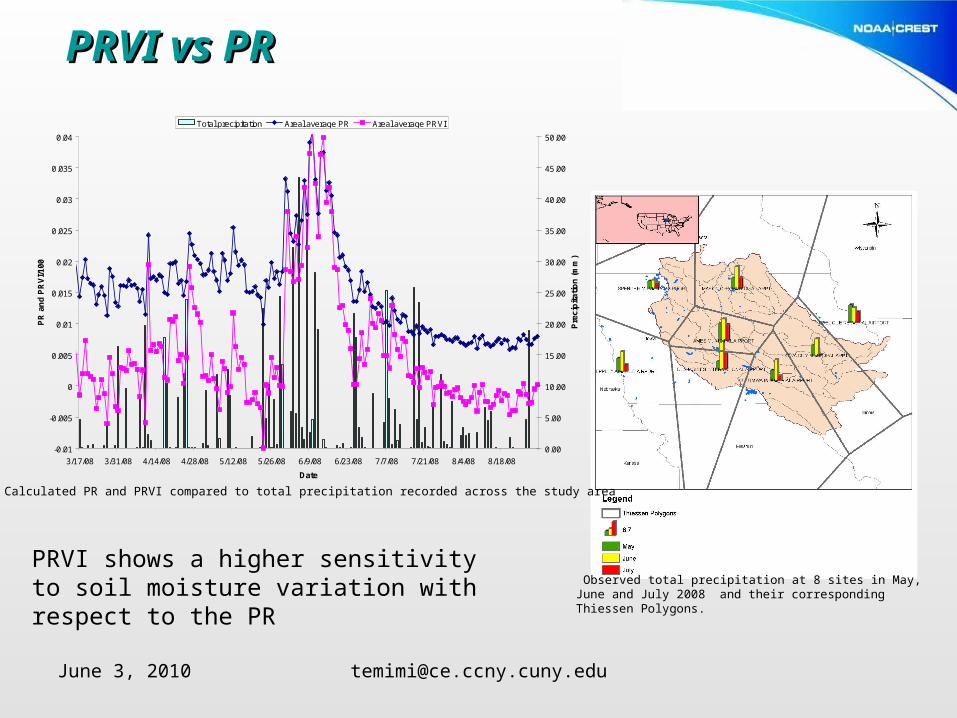
PRVI vs PRPRVI vs PR
-0.01
-0.005
0
0.005
0.01
0.015
0.02
0.025
0.03
0.035
0.04
3/17/08 3/31/08 4/14/08 4/28/08 5/12/08 5/26/08 6/9/08 6/23/08 7/7/08 7/21/08 8/4/08 8/18/08
Date
PR
an
d P
RV
I/100
0.00
5.00
10.00
15.00
20.00
25.00
30.00
35.00
40.00
45.00
50.00
Pre
cip
itat
ion
(m
m)
Total precipitation Areal average PR Areal average PRVI
Observed total precipitation at 8 sites in May, June and July 2008 and their corresponding Thiessen Polygons.
Calculated PR and PRVI compared to total precipitation recorded across the study area
PRVI shows a higher sensitivity to soil moisture variation with respect to the PR
June 3, 2010 [email protected]
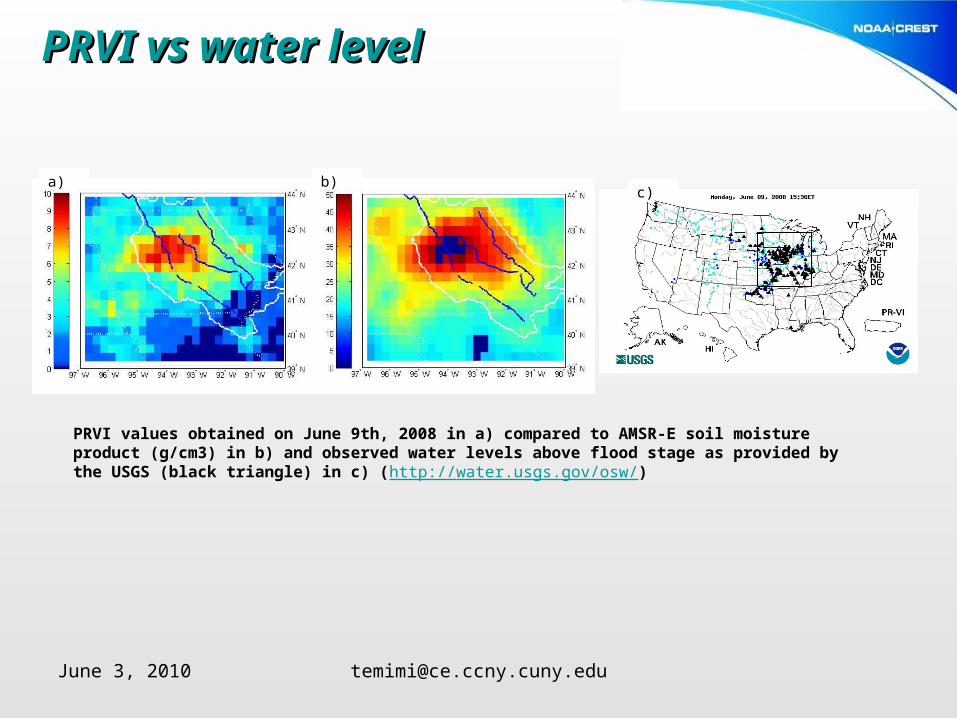
PRVI vs water level PRVI vs water level
a) b)c)
PRVI values obtained on June 9th, 2008 in a) compared to AMSR-E soil moisture product (g/cm3) in b) and observed water levels above flood stage as provided by the USGS (black triangle) in c) (http://water.usgs.gov/osw/)
June 3, 2010 [email protected]
June 3, 2010 [email protected]
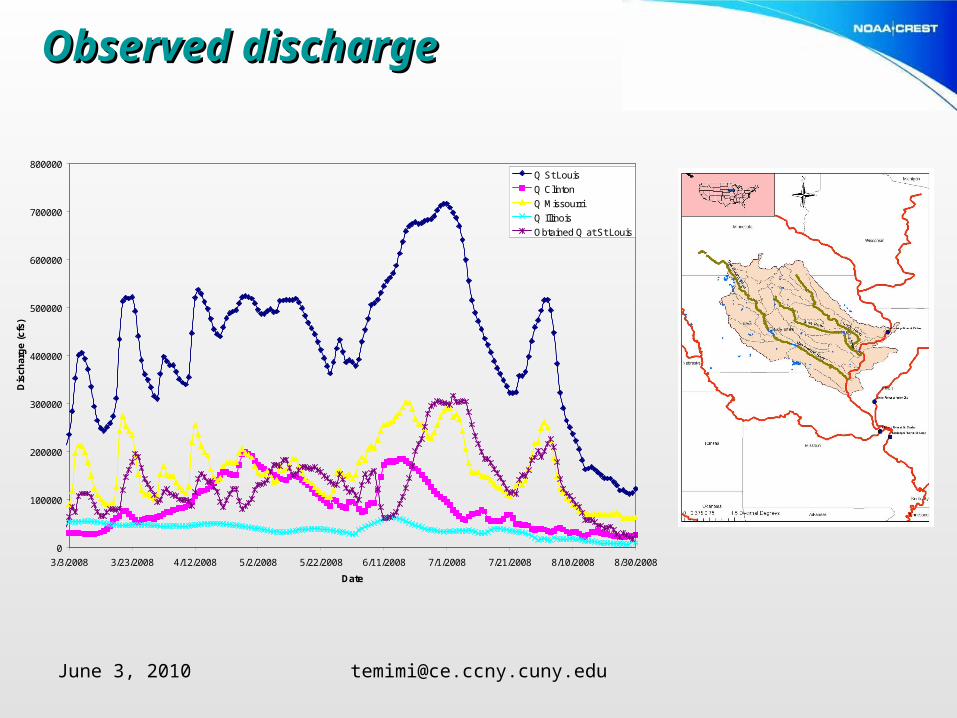
Observed discharge Observed discharge
0
100000
200000
300000
400000
500000
600000
700000
800000
3/3/2008 3/23/2008 4/12/2008 5/2/2008 5/22/2008 6/11/2008 7/1/2008 7/21/2008 8/10/2008 8/30/2008
Date
Dis
char
ge
(cfs
)
Q St Louis
Q Clinton
Q Missourri
Q Illinois
Obtained Q at St Louis
June 3, 2010 [email protected]
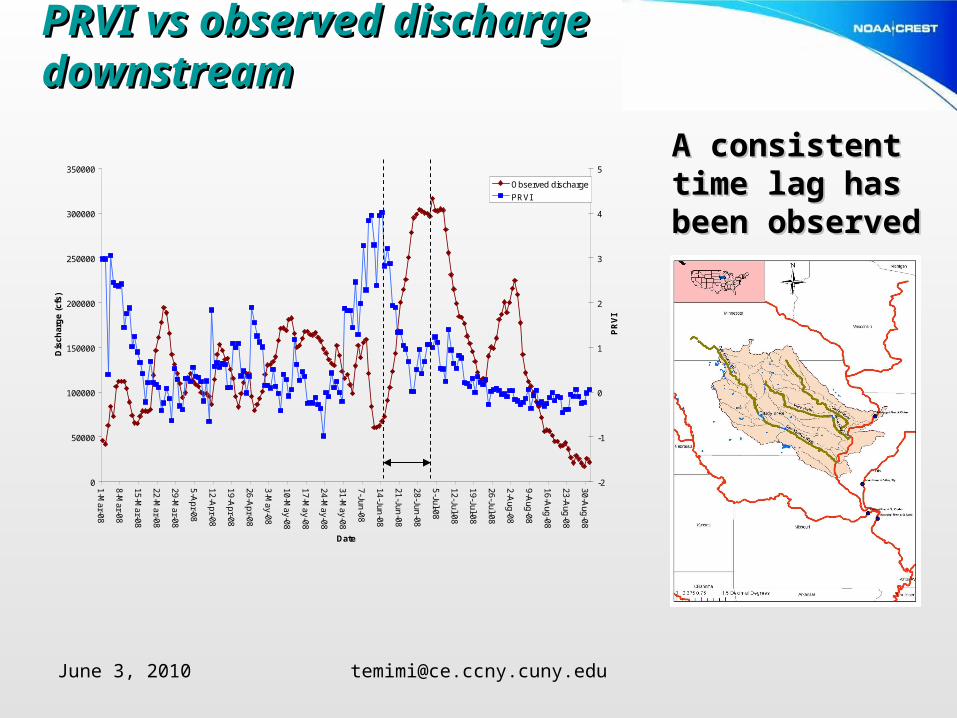
PRVI vs observed discharge downstreamPRVI vs observed discharge downstream
A consistent A consistent time lag has time lag has been observedbeen observed
0
50000
100000
150000
200000
250000
300000
350000
1-Mar-08
8-Mar-08
15-Mar-08
22-Mar-08
29-Mar-08
5-Apr-08
12-Apr-08
19-Apr-08
26-Apr-08
3-May-08
10-May-08
17-May-08
24-May-08
31-May-08
7-Jun-08
14-Jun-08
21-Jun-08
28-Jun-08
5-Jul-08
12-Jul-08
19-Jul-08
26-Jul-08
2-Aug-08
9-Aug-08
16-Aug-08
23-Aug-08
30-Aug-08
Date
Dis
char
ge
(cfs
)
-2
-1
0
1
2
3
4
5
PR
VI
Observed discharge
PRVI
June 3, 2010 [email protected]
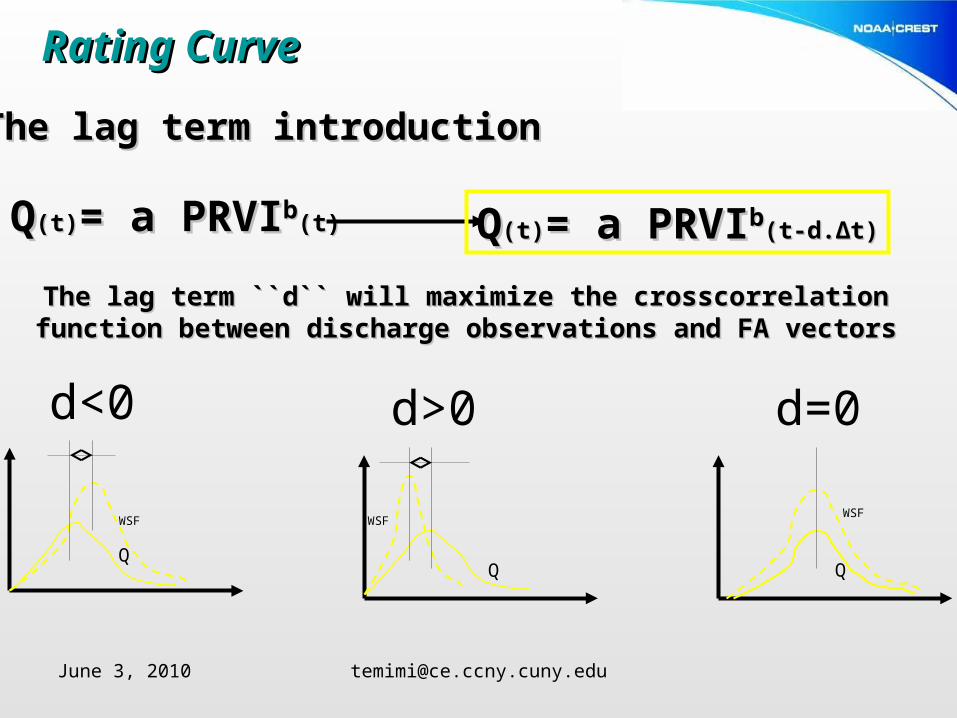
Rating CurveRating Curve
The lag term introductionThe lag term introduction
QQ(t)(t)= a PRVI= a PRVIbb(t)(t) QQ(t)(t)= a PRVI= a PRVIbb(t-d.(t-d.ΔΔtt))
The lag term ``d`` will maximize the crosscorrelation function between The lag term ``d`` will maximize the crosscorrelation function between discharge observations and FA vectorsdischarge observations and FA vectors
WSF WSFWSF
QQ Q
d<0 d>0 d=0
June 3, 2010 [email protected]
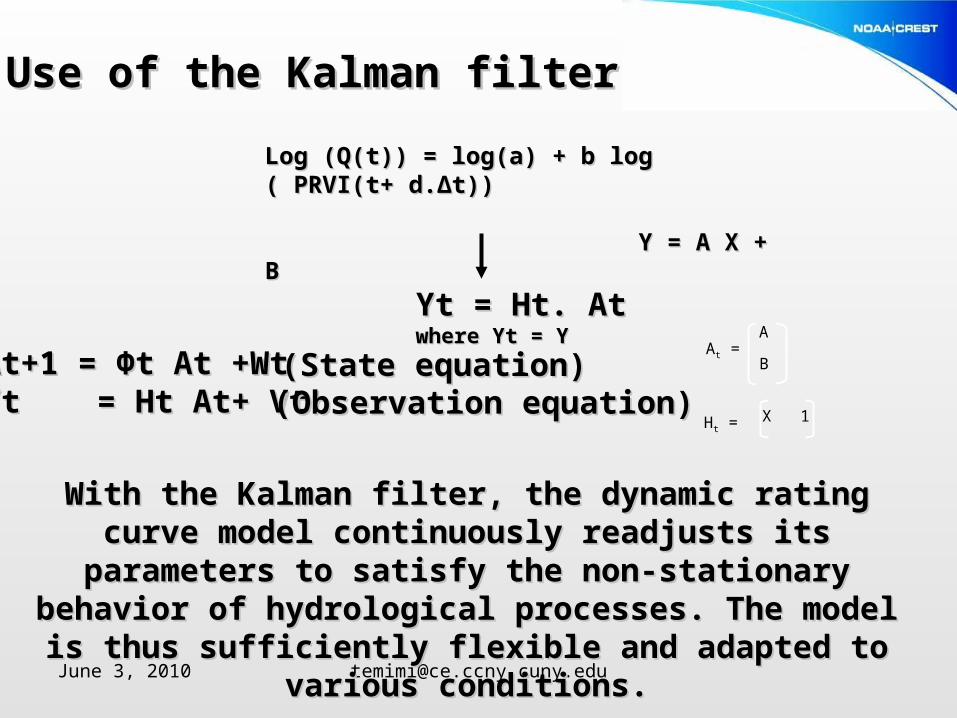
Use of the Kalman filterUse of the Kalman filter
Log (Q(t)) = log(a) + b log ( PRVI(t+ d.Log (Q(t)) = log(a) + b log ( PRVI(t+ d.ΔΔt))t)) Y = A X + B Y = A X + B
Yt = Ht. At Yt = Ht. At where Yt = Ywhere Yt = Y
At+1 = At+1 = ΦΦt At +Wt t At +Wt Yt = Ht At+ Vt Yt = Ht At+ Vt
(State (State equationequation))(Observation equation)(Observation equation)
With the Kalman filter, the dynamic rating curve model With the Kalman filter, the dynamic rating curve model continuously readjusts its parameters to satisfy the non-stationary continuously readjusts its parameters to satisfy the non-stationary behavior of hydrological processes. The model is thus sufficiently behavior of hydrological processes. The model is thus sufficiently
flexible and adapted to various conditions.flexible and adapted to various conditions.
At = A
B
Ht = X 1
June 3, 2010 [email protected]
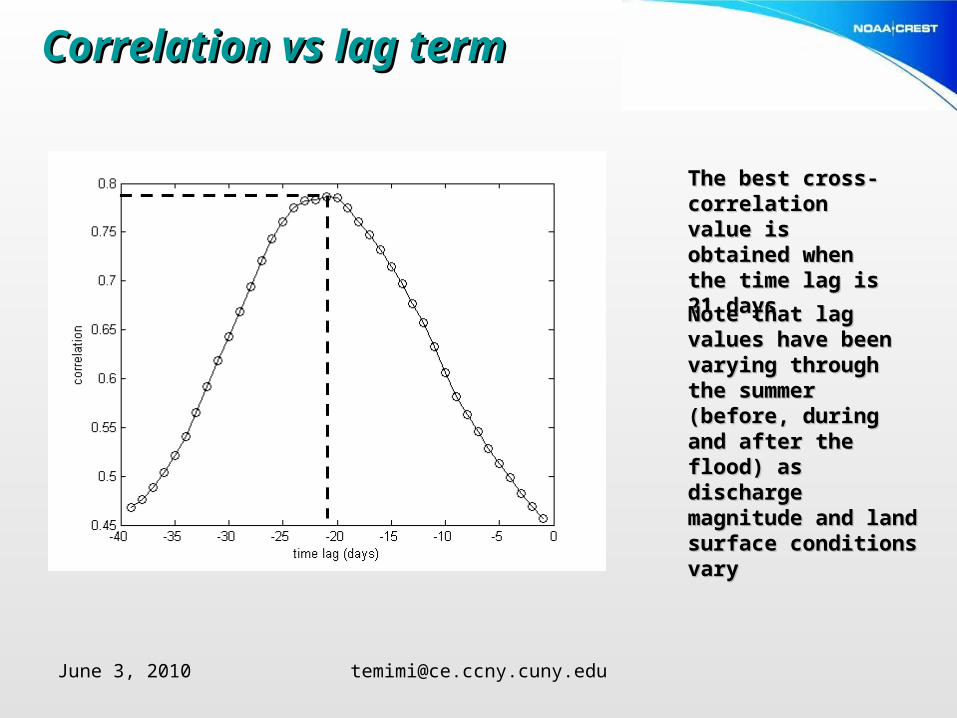
Correlation vs lag termCorrelation vs lag term
The best cross-The best cross-correlation value is correlation value is obtained when the obtained when the time lag is 21 daystime lag is 21 days
Note that lag values Note that lag values have been varying have been varying through the summer through the summer (before, during and (before, during and after the flood) as after the flood) as discharge magnitude discharge magnitude and land surface and land surface conditions vary conditions vary
June 3, 2010 [email protected]
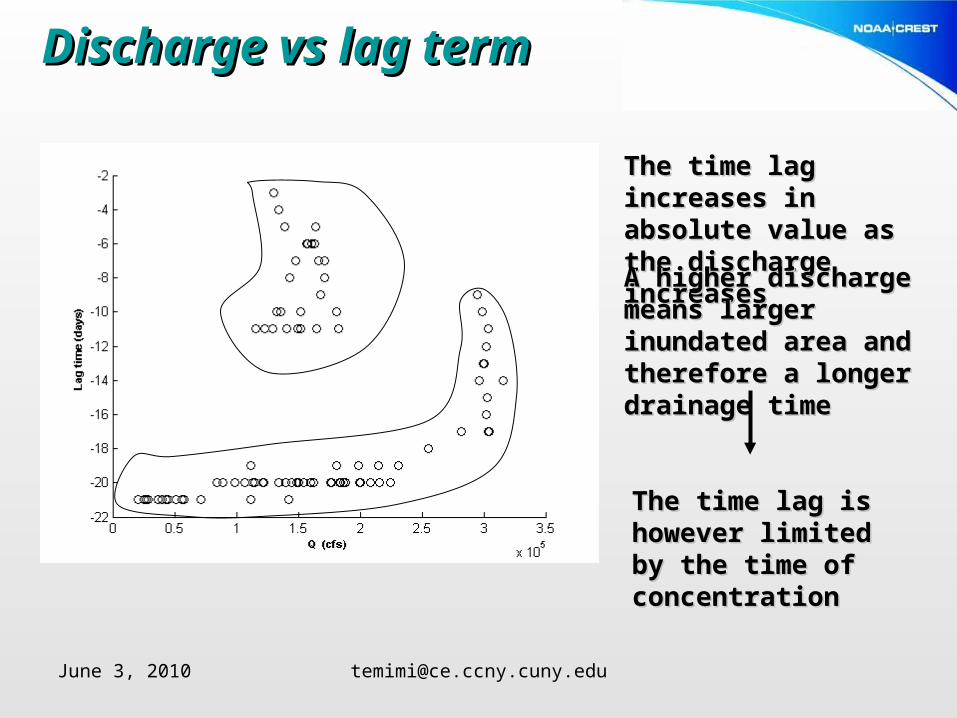
Discharge vs lag termDischarge vs lag term
The time lag increases The time lag increases in absolute value as in absolute value as the discharge the discharge increasesincreasesA higher discharge A higher discharge means larger means larger inundated area and inundated area and therefore a longer therefore a longer drainage timedrainage time
The time lag is The time lag is however limited by however limited by the time of the time of concentrationconcentration
June 3, 2010 [email protected]
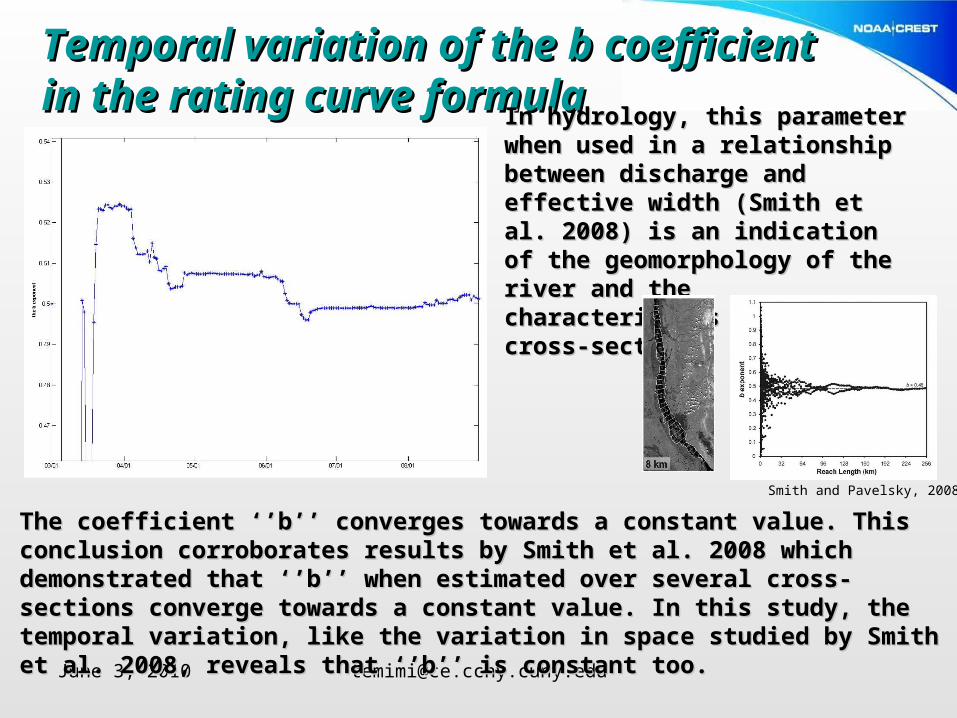
Temporal variation of the b coefficient in Temporal variation of the b coefficient in the rating curve formula the rating curve formula
In hydrology, this parameter when In hydrology, this parameter when used in a relationship between used in a relationship between discharge and effective width discharge and effective width (Smith et al. 2008) is an indication (Smith et al. 2008) is an indication of the geomorphology of the river of the geomorphology of the river and the characteristics of its cross-and the characteristics of its cross-section.section.
The coefficient ‘’b’’ converges towards a constant value. This conclusion The coefficient ‘’b’’ converges towards a constant value. This conclusion corroborates results by Smith et al. 2008 which demonstrated that ‘’b’’ when corroborates results by Smith et al. 2008 which demonstrated that ‘’b’’ when estimated over several cross-sections converge towards a constant value. In this estimated over several cross-sections converge towards a constant value. In this study, the temporal variation, like the variation in space studied by Smith et al. study, the temporal variation, like the variation in space studied by Smith et al. 2008, reveals that ‘’b’’ is constant too. 2008, reveals that ‘’b’’ is constant too.
Smith and Pavelsky, 2008
June 3, 2010 [email protected]
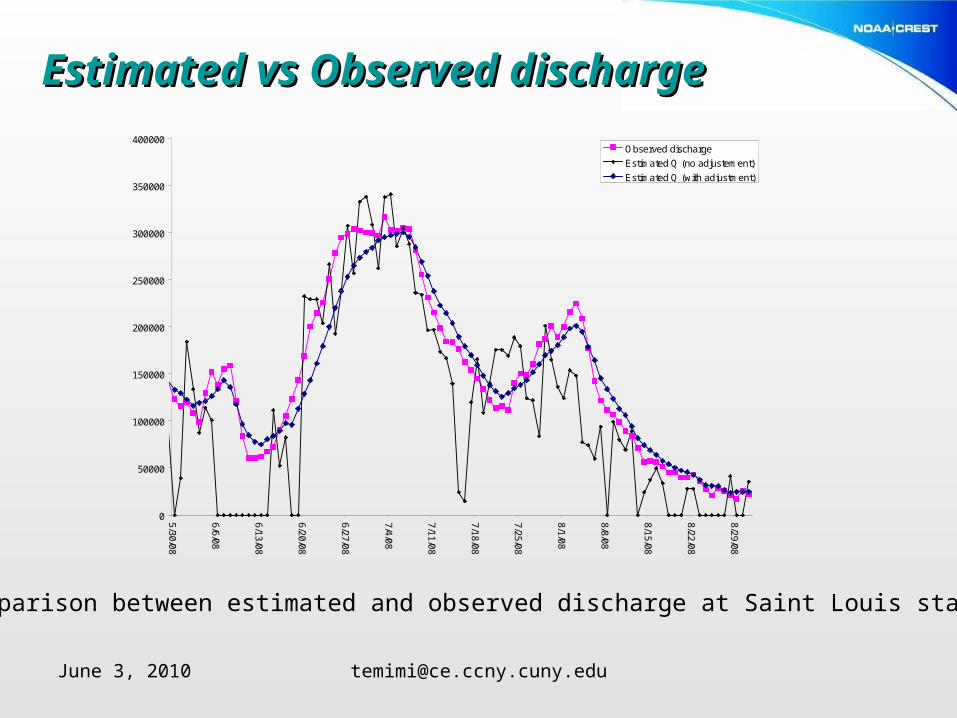
Estimated vs Observed dischargeEstimated vs Observed discharge
0
50000
100000
150000
200000
250000
300000
350000
400000
5/30/08
6/6/08
6/13/08
6/20/08
6/27/08
7/4/08
7/11/08
7/18/08
7/25/08
8/1/08
8/8/08
8/15/08
8/22/08
8/29/08
Observed discharge
Estimated Q (no adjustement)
Estimated Q (with adjustment)
Comparison between estimated and observed discharge at Saint Louis station
June 3, 2010 [email protected]
Conclusions…Conclusions…
•PRVI detects anomalies in soil moisture and can therefore be used PRVI detects anomalies in soil moisture and can therefore be used in flood and discharge monitoringin flood and discharge monitoring
•A time lag term must be introduced in the rating curve formulaA time lag term must be introduced in the rating curve formula
•The lag between flooded area extent and discharge downstream The lag between flooded area extent and discharge downstream seems to be sensitive to discharge magnitude and surface seems to be sensitive to discharge magnitude and surface conditionsconditions
•The time lag seems to be compatible with the time of concentration The time lag seems to be compatible with the time of concentration of the study areaof the study area
•The ‘’b’’ coefficient of the rating curve model when readjusted in The ‘’b’’ coefficient of the rating curve model when readjusted in time converges towards a constant valuetime converges towards a constant value