Embed Size (px)
Citation preview

June 5, 2013MS Healthcare ExecutivesSummer Meeting
Sustaining a Financially Vibrant Healthcare Organization
Kevin D. Gore, CPAPartner
BKD, LLP
Sustaining a Financially Vibrant Healthcare Organization
Kevin D. Gore, CPAPartner
BKD, LLP

The Financial Perspective
• Recap of major changes in health care payment reform history
• Overview of health care sector• Surviving in today’s world• Opportunities that still exist • Outlook for 2014 and Beyond

The Financial Perspective

Historical Changes in Healthcare Reimbursement
• 1966 – Medicare Created– Expanded coverage to the elderly and reimbursed hospital care at “reasonable cost”
• 1984 – Inpatient PPS– How are we going to survive without cost reimbursement?
• 1992 – Physician Fee Schedule (RBRVS)– What are the physicians going to do?
• 1997 – Balanced Budget Act of 1997– Forecast by many organizations to lead to the closure of up to 15% of
the hospitals• 2010 – Patient Protection and Affordable Care Act
– Projected to be most significant change since 1966

Balanced Budget Act of 1997
Created the following changes:•Critical Access Hospitals•Prospective payment systems for:
– Skilled nursing (RUGs in 1998)– Outpatients (APCs in 2000)– Home health (HHRGs in 2000) – Rehab (CMGs in 2002)
•Transfer DRG payment reduction•Rural floor for wage index purposes•Medicare+ Choice

Balanced Budget Act of 1997
• There were forecasts of hospital closures in rural communities throughout the country
• The forecasted savings over a 5-year period by the CBO was $160,000,000,000 (billion) and $394 billion over a 10-year period
• Hospitals focused on three primary areas:– Consolidations– Integration– Cost reductions

Patient Protection and Affordable Care Act (ObamaCare)
• Signed into law on March 23, 2010 (three years ago)• Significant items
– Health insurance exchanges (2014)– ACOs and Medicare Shared Savings Program (in process)– Pre-existing conditions coverage– Individual mandate– Expansion of Medicaid with the ability to opt out
• Impact is likely to be greater on the delivery of health care than the mechanisms of reimbursement when compared to BBA 97

Patient Protection and Affordable Care Act (ObamaCare)

Patient Protection and Affordable Care Act (ObamaCare)
• CBO projects that ObamaCare will reduce spending by a net $109 billion over a 10 year period– Remember BBA 97 was
projected to reduce spending by over $390 billion over a 10 year period

My View on the Health Care Sector Today
• Providers have done well managing costs despite decreasing volumes and reduced reimbursement environment
• Many benchmarks have approached or achieved pre-recession peaks
• Health care reform implementation will continue while many incremental challenges remain
• Heavy investment in information technology, physicians, and integration to continue• Rapid pace of consolidation likely to continue• Next challenge is finding the next level of cost savings

Ongoing Challenges • Relatively high unemployment, reduced health insurance benefits• Medicaid funding pressures and growing enrollment• Medicare: weak update factors, RACs, sequestration, and the quality
provisions (VBP, HAC penalties, readmission penalties, etc.)• Commercial plans offering smaller rate increases, seeking value-based
contracts and pushing high-deductible plans• Many of the “easier” cost cutting tactics already deployed• Inpatient utilization trends remain generally weak• Cost of employing physicians raises fixed costs• Ongoing competition from physician offices and
privately owned treatment centers• Rising average age of plant • Public disclosure of “pricing data” by CMS
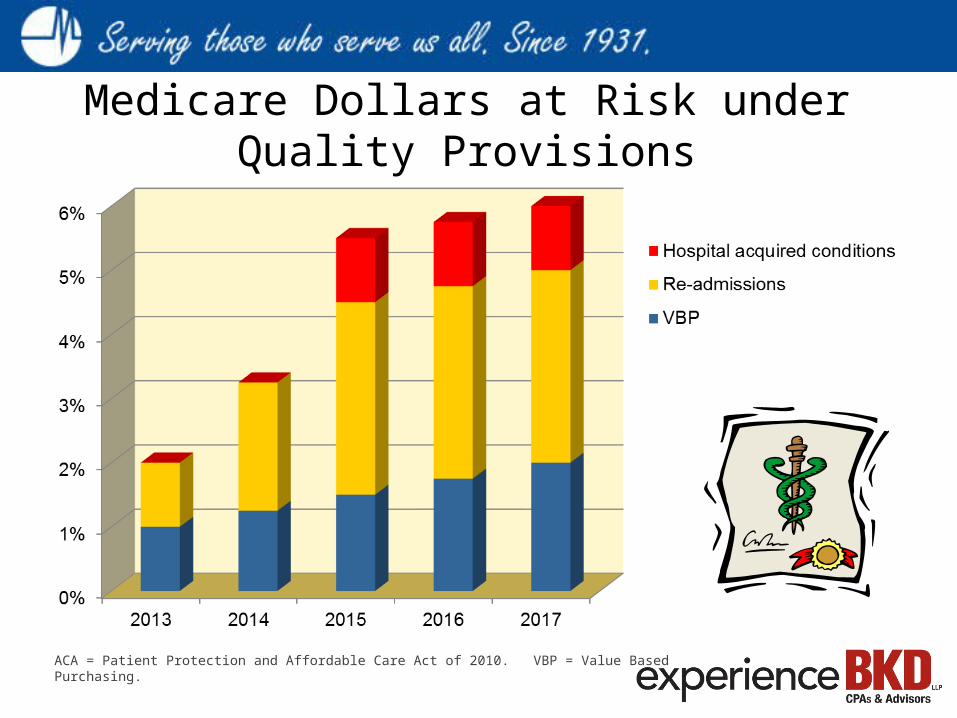
Medicare Dollars at Risk under Quality Provisions
ACA = Patient Protection and Affordable Care Act of 2010. VBP = Value Based Purchasing.

Some Benchmarks Approaching Pre-Recession Levels
130
140
150
160
170
180
2006 2007 2008 2009 2010 20110.02.04.06.08.010.012.014.0
2006 2007 2008 2009 2010 2011
100
125
150
175
2006 2007 2008 2009 2010 20111.0
1.5
2.02.5
3.0
3.5
4.0
2006 2007 2008 2009 2010 2011
Days’ Cash on Hand EBIDA Margin (%)
Capital Exp./ Depreciation (%) Debt Service Coverage (x)

Public Scrutiny of Pricing• IP Charge Data released by CMS on May 8 for 100 procedures• OP Charge Data released by CMS on June 3 for 30 procedures

• Supreme Court ruling gave hospital leadership more confidence to accelerate reform preparation activities
• Reform efforts likely to continue down the path they are on– Lower costs – pressure to lower costs continues unabated– More value-based reimbursement– Continued development of shared risk models– Physician employment trends continue – Focus on improved quality remains– Continued consolidation
• Still ample uncertainty– Political opposition– Which states will opt out of or delay Medicaid expansion?
• Decision will impact the envisioned reduction in uninsured• Could lead to greater variability in state Medicaid programs and cost structures
Affordable Care Act and Organic Change

Transitioning to the New World after ACA • Value-based orientation replacing fee-for-service. A slow process. • Emerging delivery system: incentivize better care coordination, reduction in
practice variation, better quality of care, higher patient satisfaction in lieu of volume-based production
• Incentives of current system still support higher volume, market share, key service line growth; are turned upside down in value-oriented system
• Can you back-fill lost volume though market share growth? Does volume move to high quality, transparent provider or to lower cost provider?
• Moving too quickly to value-based approach costs revenue and pressures margins. Can providers lower costs fast enough to offset revenue loss?
• Moving too slowly to value-based approach may leave you vulnerable when delivery system finally reaches ‘tipping’ point
You will have to be successful while living in two worlds at once

Surviving in today’s world• Monitor and evaluate the financial stability of the
organization• Evaluate the mission and goal of the organization• Consider and discuss the likely merger/consolidation
candidates• Review the current reimbursement opportunities• Plan for cost accounting of some sort• Be able to explain the organization’s strategy and
preparation for addressing health care reform

Financial Stability FactorsBelow are some key indicators that every CEO and CFO should be monitoring
• Days cash on hand• Days revenue in AR• Debt service coverage ratio• Debt to capitalization• EBIDA
Make sure you select the proper benchmark (for-profit vs. not-for-profit, etc.)Develop a trend analysis for your organization

Benchmark Information• Days Cash on Hand
• (Cash + Unrestricted Investments)/Expenses less depreciation and amortization• Increasing values are favorable• Where is the cash going if decreasing
• Internal funding of construction projects• Operating losses• Investment in strategic initiatives
• Days cash on hand – provides flexibility and cushion for error

Benchmark Information• Days Revenue in Patient Receivables
• Net patient accounts receivable/(Net patient service revenues/365)• Decreasing values are favorable• Measures average time to collect patient receivables• Consider breaking break down into segments
• Discharged not final billed• Percent of receivables over 120 days from discharge
• Continuing decreases in days revenue in accounts receivable might actually pose problems for an organization as it puts pressure on liquidity

Benchmark Information• Debt Service Coverage Ratio
• (Net Income + Interest Expense + Depreciation)/(Debt Principal Payments + Interest Expense)• Increasing values are favorable• Affected by profitability and depreciation changes• Consider including a historical (using current year
results) and a maximum annual (using peak debt service)• Maximum annual is a way to project future
cash flow/debt service problems• Useful in planning future financings
• Benchmark indicates how leveraged is the organization? Can you access the capital market to implement strategy if needed?

Benchmark Information• Debt to Capitalization
• Long-term Debt/(Long-term Debt + Net Assets)• Decreasing values are favorable• Higher values indicate a reliance on debt in prior years or a
continuing decrease in net assets• Lower values indicate a historical use of equity/profits to
finance assets• This measurement needs to be evaluated in connection with
these other benchmarks• Debt service coverage ratio• Average age of plant
• Larger organizations tend to have higher ratios due to perception of less overall risk due to size
• Benchmark is often a limitation on future borrowings if too high

Benchmark Information• EBIDA and EBIDA Percentage
• Earnings before interest, depreciation and amortization• Percentage Based on Operating Revenue
• Increasing values are favorable• Makes it easier to analyze overall profitability without the effects
of financing decisions of the past• A good indicator of the ability of the organization to service debt• Often used in mergers/acquisitions to estimate purchase price

Evaluate the Mission and Goals • One thing is certain, change will continue to occur and the
pace is likely to accelerate
• What is the most important issue for the organization:• Remain independent• Keep a full service hospital in the community• Provide the community with the best care possible• Be financially sound and prepared for the future

Merger, Acquisition and Consolidation• In a recent study, 8 out of 10 hospital CEOs indicated their board had
discussed or performed a formal analysis of options for merger, acquisition or consolidation
• If you are not thinking about this issue, then you are behind schedule
• What is merger or acquisition and who is likely to consider?

Merger, Acquisition and Consolidation
Different forms of Merger/Acquisition• Affiliations • Management contract • Lease arrangement• Purchase

Merger, Acquisition and Consolidation
Who is likely to be considering merger, etc.?• Financially challenged organizations• Financially strong organizations• Large health systems• Critical access hospitals• Urban providers• Rural hospitals• Physician practices

Merger, Acquisition and ConsolidationRecent Merger Activity• Ascension Health• University of Arkansas and St. Vincent• Wise Regional and North Texas Community Hospital• FTC now closely scrutinizing deals & rejecting someFor Profit Companies are Stockpiling Cash• Tenet - $364 million (222% increase)• CHS - $388 million (199% increase)• HCA - $705 million (89% increase)Expectations are high for increased merger activity in late 2013
through 2014

Current Reimbursement Opportunities
• Medicare Disproportionate Share payments• Medicare Transfer DRGs• Readmission Reduction Program• Medicare Wage Index • Medicare Bad Debts• 340B Drug Pricing Program• Uncompensated care

Current Reimbursement Opportunities
• Get a copy of your Medicare Cost Report when you go home

Medicare Disproportionate ShareChange in payment method required by ACA• Projected to reduce Medicare DSH payments by
$22.1 billion over 5 years• 75% of the payment will now be based on a new
formula based on uncompensated care• Uncompensated care currently will be defined as
Medicaid eligible and SSI days• This change will shift reimbursement between
providers and create winners and losers– Mississippi projected to lose over $21,000,000 from
the reallocation

Medicare Disproportionate ShareOpportunities (not for CAHs)• Current system
– Review your Medicare cost report• Worksheet E, Part A Lines 30-34
– Ensure you are counting ALL Medicaid eligible days
– Review the SSI percentage on line 30– File a protest on your cost report for the
calculation of the SSI percentage and other DSH calculation issues

Medicare Disproportionate ShareOpportunities (not for CAHs)• New system (starts in FFY14)
– Continue to closely evaluate Medicaid eligibility testing and capturing Medicaid eligible days
– Continue to work on identifying SSI patients– Consider working to get patients to apply for SSI– Develop reporting mechanisms to accurately track
and record charity and bad debt costs
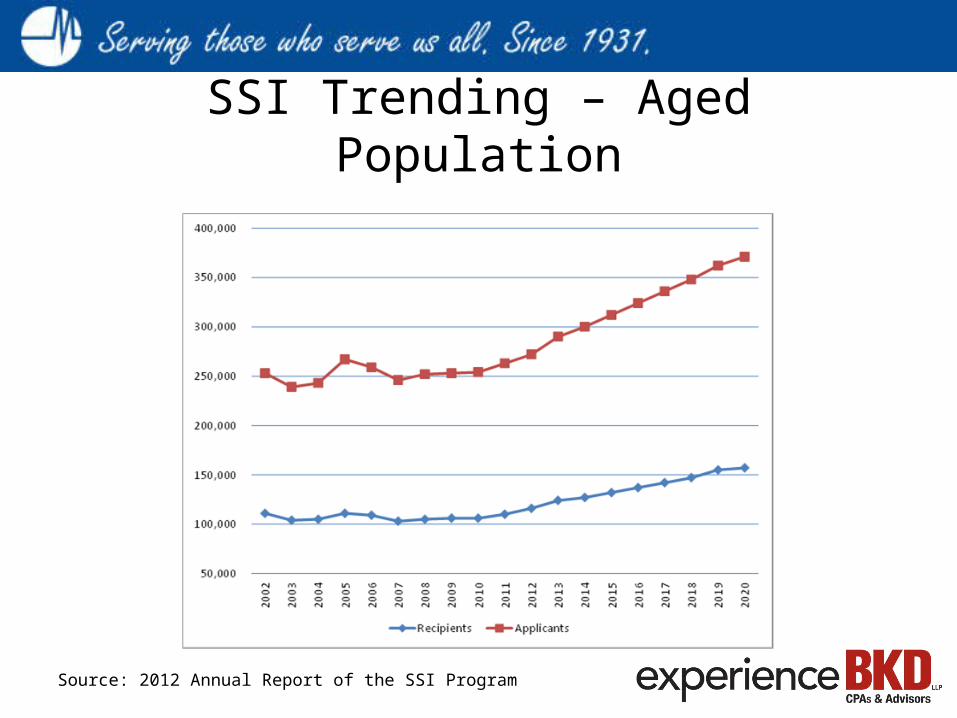
SSI Trending – Aged Population
Source: 2012 Annual Report of the SSI Program

SSI Opportunities for Improvement• Evaluate opportunity by comparing Medicare dual eligible
days compared to your SSI days– Request historical SSI detail from CMS at
[email protected]• Train hospital staff to increase applications by
instructing/assisting Medicare patients requesting charity to apply for SSI
• Attempt to identify those patients that are SSI eligible but that have not applied
• Mississippi is a “front door” SSI state – in other words, one application, enroll in SSI then automatic in Medicaid
• Work with the local SSA office to enroll patient in SSI

Medicare Transfer DRGs• Medicare reduces the DRG payment if the Hospital
transfers a patient to a post acute care setting “too early”– Compares the patient length of stay to the geometric
mean length of stay for the DRG• Key factors in this penalty
– The actual length of stay is less than the average
– The patient actually goes to the post acute care provider
• Does not apply to CAH and SCH paid on hospital specific rate

Medicare DRG Transfer• How to identify how big of an impact this is to
your organization– Obtain a PSR (Provider Statistical and Reimbursement
System) report from your Medicare Administrative Contractor
– Inpatient Part A (Report Type 110)– Compare the DRG Weight to the DRG Weight Fraction
to identify the reduction in Case Mix– To identify the reduction in payments, divide the
Gross Reimbursement by the DRG Weight Fraction and multiply by DRG Weight and compare to Gross Reimbursement

Medicare DRG TransferOpportunities • Review all patients with reduced DRGs under
the transfer rule and make sure the patient actually went to the post acute provider
• Requires matching up of the Hospital’s records and the CMS Public Use File
• Limited time frame based on changes in ACA that limit filing to one calendar year after date of service

Readmission Reduction Program• Reduced reimbursement on Medicare claims if
readmission rates are “excessive”– Started October 1, 2012 and will continue to expand in FFY
2014– Reduced reimbursement is based on your readmission
rate compared to the national average for AMI, Heart Failure and Pneumonia
• Recent CMS study indicates that Readmission Rates showed meaningful decline in 2012– From 2007 to 2011 the average readmit rate was 19%– In 2012, the average readmit rate dropped to 18.4%– In other words, if you are not improving, then you are
losing ground

Readmission Reduction ProgramOpportunities• Ensure your system captures the following
information– Specific location of where the patient was
discharged (not just nursing home or home health)
– Who the discharging physician was and when the discharge occurred

Readmission Reduction ProgramOpportunities• Analyze the data on patients that are readmitted
within 30 days for the following trends– Specific provider patient discharged to– Day of the week patient discharged– Time of the day patient discharged
• Analyze the data by condition and by physician• Follow up with any “repeat” offenders – both
internal ones and external providers

Other Reimbursement Opportunities• Medicare Wage Index (not for CAHs)
– Ensure you are capturing all the appropriate information and pay close attention to this data
• It is probably the most important information on your Medicare cost report under the current system
– Encourage all hospitals in your CBSA to do the same• Medicare Bad Debts
– Continuing reduction in reimbursement % – Compare your Medicare bad debts claimed on your
cost report to the Medicare deductibles and coinsurance on your PSR report
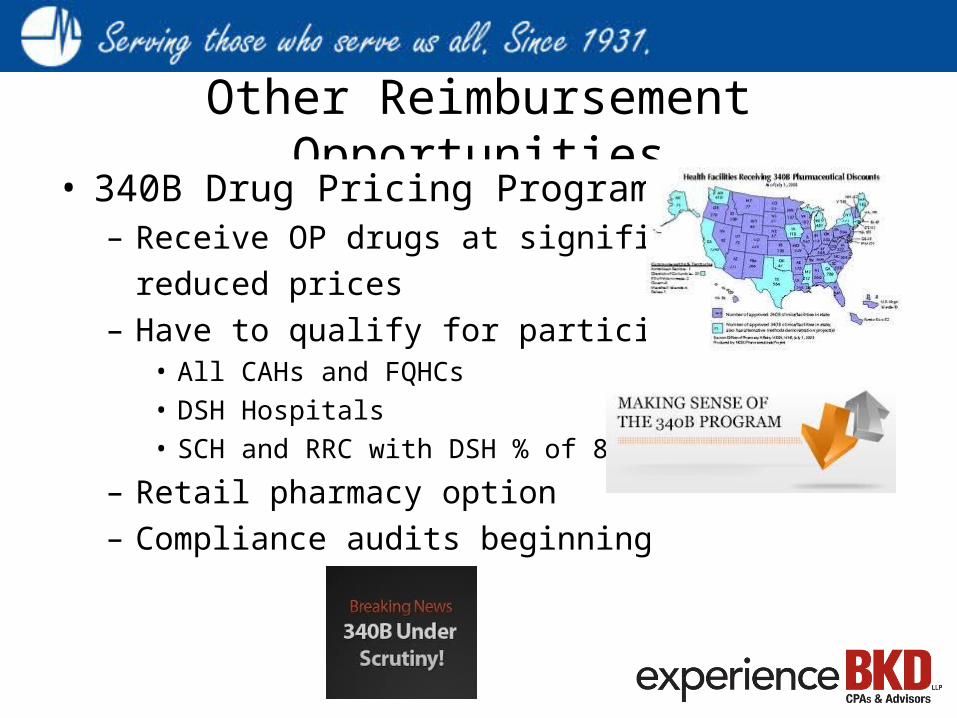
Other Reimbursement Opportunities• 340B Drug Pricing Program
– Receive OP drugs at significantlyreduced prices
– Have to qualify for participation• All CAHs and FQHCs• DSH Hospitals• SCH and RRC with DSH % of 8%
– Retail pharmacy option– Compliance audits beginning

Other Reimbursement Opportunities• Uncompensated Care
– For NFP, important measure in the IRS Form 990 and maintenance of tax exempt status
– Utilized in Medicare EHR Incentive Payment Program– Potentially utilized in DSH in 2014 and beyond
Keys to Sustaining a Financially Vibrant Healthcare Organization
• Strong financial performance due to robust demand for services and careful cost management
• Focus on evidence-based clinical practice built on information resources that are shared across providers within the organization
• Operational excellence that emphasizes efficiency and transparency to all stakeholders
• Unrelenting focus on delivering outstanding value to people who rely upon the organization to provide a range of health care related services

Industry View for 2014 and Beyond• Many substance and implementation issues surrounding reform
– Substance issues:• Uncertainties around the growth or decline of private health insurance• Who will populate the insurance exchanges?• Will the surge of people with insurance in 2014 “flood” providers and boost labor markets? Will
this be a temporary issue? • Longer-term, will inpatient volume plummet due to more effective prevention measures and the
advent of evidence-based medicine?• Impact of local payor mixes will continue to influence view of reform – either positive or negative
– Implementation issues:• Political opposition to the legislation• Which states will participate in Medicaid expansion• Specifics of rules and regulations yet to be published; and• Uncertainty about how health care exchanges will function
• We believe implications of initial implementation of individual mandate likely to take a year or two to settle in; longer-term impact from reform may not be apparent until 2016 or 2017
• We believe that many hospitals and health systems will manage under reform effectively, but even the strongest hospitals are, at best, only likely to hold existing margin and liquidity levels, while weaker providers will likely see ongoing margin and balance sheet pressure leading to rating deterioration