Embed Size (px)
Citation preview
June 9th, 2013 AB SCIEX – Beckman Coulter Partner workshop – ASMS
Complete sequence coverage in one injection followed by posttranslational
modifications and major N-glycosylation characterization of monoclonal
antibodies by sheathless CESI-MS/MS
R. Gahoual1, J-M. Busnel2, J. Chicher3, L. Kuhn3,
P. Hammann3, A. Beck4, Y.N. François1, E. Leize-Wagner1
1Laboratory of Mass Spectrometry of Interactions and Systems, University of Strasbourg (CNRS-UDS UMR 7140)
2Beckman Coulter, Brea (CA, USA)
3IEsplanade Proteomic Facility, IBMC, University of Strasbourg (CNRS-UDS-UPR 9002)
4Centre d’immunologie Pierre Fabre (CIPF)
EUPA – Saint-MaloOctober 17th, 2013

2
Separation in capillary electrophoresis
electrophoretic mobility
electroosmotic mobility
• Analytes are separated depending on their charge and size
• CE provides fast separation
great efficiency
low sample consumption

3
Web of scienceSM search using term “capillary electrophoresis and mass spectrometry”
Num
ber
of p
ublic
atio
nsCE–MS Coupling

4
CE-ESI-MS Coupling
Advantages of CE-MS Great efficiency
Selectivity
Sensitivity
Structural information
Drawbacks of CE-MS Low sample volume (high concentration)
Compatibility of background electrolyte to MS
Difficulty to maintain electrical field
Ultra-low flow rate

5
“sheath liquid” interface is the most common
Addressing CE-MS Limitations
• Over 30 publications describing new interfaces• 3 different categories (sheath liquid, junction liquid, sheathless)

6
CE is a miniaturized technique performing ultra-low flow rates
Decreasing the flow allows for increased sensitivity in the ESI-MS1
“Sheathless” CE-ESI-MS
1Wilm, Mann International Journal of Mass Spectrometry 1994, 136, 167–180
Addressing CE-MS Limitations

7
CESI Interface
30 µm ID separation capillary with outlet portion etched by HF, provides electrical contact
Originally developed by M. Moini at U. of Texas and further developed by Beckman Coulter Inc.

8
CESI Interface
• No sheath liquid is necessary anymore to perform CE-ESI-MS
nano flow rates and increased sensitivity

What are the accessible flow rates?
9

10
CESI Interface Achievable Flow rates
• CESI-MS infusion of intact protein sample
Spray could be obtained using flow rate as low as 4 nL/min
Conditions : Myoglobin 1 μM (in 10% acetic acid), Flow rates 3, 7 - 170 nL/min, Capillary voltage: -1400V, Investigated m/z : 848,94
0 20 40 60 80 100 120 140 160 1800
2
4
6
8
10
12
14
16
18
20
Measured flow rate (nL/min)
CE
sys
tem
ap
pli
ed p
ress
ure
(p
si)
0 5 10 15 20 25
0
1
2
3
Gahoual et al, Analytical and Bioanalytical Chemistry 2013, online available

Conditions : Flowrate 4 - 700 nL/min Capillary voltage : - 1400V, Investigated m/z : 2196
0 300 600 9001E+017
1E+019
1E+021
Flow rate (nL/min)
Sen
siti
vity
(co
un
ts/m
ol)
Infusion of Myoglobin 250nM (in 20mM AceNH4 pH 6,7)
Influence of the flow rate on sensitivity
46 fold increase in sensitivity by decreasing the Flow rate
from 350 to 10 nL/min
Gahoual et al, Analytical and Bioanalytical Chemistry 2013, online available

12
1. Introduction
2. Rapid and multi-level characterization of monoclonal antibody through CESI-MS workflow
Content

13
Monoclonal Antibodies (mAbs)
• Highly specific to the targeted antigen
• Opening new pathways for treatments
• Over 40 mAbs currently approved by FDA (15 in oncology)
• Complex and heterogeneous protein
necessity of precise and high throughput characterization
challenge to analytical sciences

14
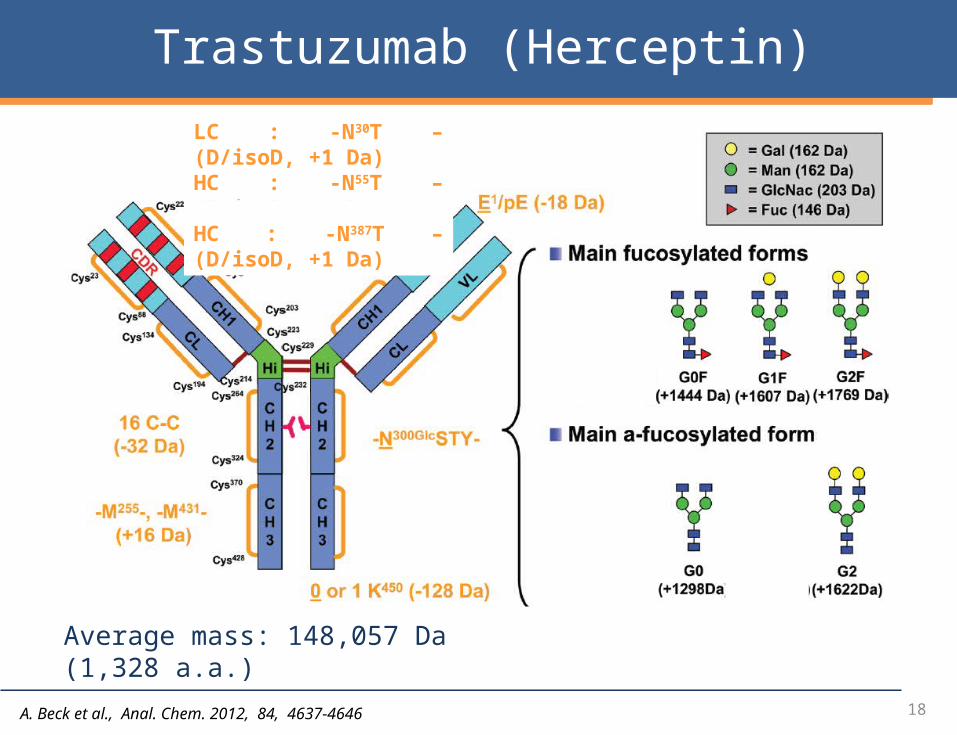
Trastuzumab (Herceptin)
Average mass: 148,057 Da (1,328 a.a.)
IgG1
A. Beck et al., Anal. Chem. 2012, 84, 4637-4646
-N300GlcSTY-

15
Bottom-up Approach
• Peptide separation and detection by NanoLC-MS/MS Eksigent nanoLC™ 2D plus system with cHiPLC® System AB SCIEX TripleTOF® 5600 System
• Peptide identification using search algorithm
Mascot algorithm
• Protein enzymatic digestion
Tryptic digestion (conventional in solution protocol)

16
• Trastuzumab peptide mapping using nanoLC-MS/MS
74.6 % 95.4 %
EVQLVESGGG LVQPGGSLRL SCAASGFNIK DTYIHWVRQA PGKGLEWVAR
IYPTNGYTRY ADSVKGRFTI SADTSKNTAY LQMNSLRAED TAVYYCSRWG
GDGFYAMDYW GQGTLVTVSS ASTKGPSVFP LAPSSKSTSG GTAALGCLVK DYFPEPVTVS WNSGALTSGV HTFPAVLQSS GLYSLSSVVT VPSSSLGTQT
YICNVNHKPS NTKVDKKVEP KSCDKTHTCP PCPAPELLGG PSVFLFPPKP
KDTLMISRTP EVTCVVVDVS HEDPEVKFNW YVDGVEVHNA KTKPREEQYN
STYRVVSVLT VLHQDWLNGK EYKCKVSNKA LPAPIEKTIS KAKGQPREPQ
VYTLPPSREE MTKNQVSLTC LVKGFYPSDI AVEWESNGQP ENNYKTTPPV
LDSDGSFFLY SKLTVDKSRW QQGNVFSCSV MHEALHNHYT QKSLSLSPG
DIQMTQSPSS LSASVGDRVT ITCRASQDVN TAVAWYQQKP GKAPKLLIYS
ASFLYSGVPS RFSGSRSGTD FTLTISSLQP EDFATYYCQQ HYTTPPTFGQ
GTKVEIKRTV AAPSVFIFPP SDEQLKSGTA SVVCLLNNFY PREAKVQWKV
DNALQSGNSQ ESVTEQDSKD STYSLSSTLT LSKADYEKHK VYACEVTHQG
LSSPVTKSFN RGEC
Necessity to perform a different proteolytic digestion and to compile different injections to obtain full sequence coverage
mAb sequence coverage

17
CESI Workflow
18A. Beck et al., Anal. Chem. 2012, 84, 4637-4646
Average mass: 148,057 Da (1,328 a.a.)
Trastuzumab (Herceptin)
LC : -N30T – (D/isoD, +1 Da)HC : -N55T – (D/isoD, +1 Da)HC : -N387T – (D/isoD, +1 Da)

19
Bottom-up Approach
• Peptide separation and detection by CESI-MS/MS
AB SCIEX TripleTOF 5600 System
• Sequence characterization by MS/MS peptide mapping
• Research of glycosylation and posttranslational modifications
• Protein enzymatic digestion
Same Sample of trastruzumab (same protocol)

20
Trastuzumab MS/MS peptide mapping
Amino acid sequence characterization (trastuzumab)
EVQLVESGGG LVQPGGSLRL SCAASGFNIK DTYIHWVRQA PGKGLEWVAR
IYPTNGYTRY ADSVKGRFTI SADTSKNTAY LQMNSLRAED TAVYYCSRWG
GDGFYAMDYW GQGTLVTVSS ASTKGPSVFP LAPSSKSTSG GTAALGCLVK
DYFPEPVTVS WNSGALTSGV HTFPAVLQSS GLYSLSSVVT VPSSSLGTQT
YICNVNHKPS NTKVDKKVEP KSCDKTHTCP PCPAPELLGG PSVFLFPPKP
KDTLMISRTP EVTCVVVDVS HEDPEVKFNW YVDGVEVHNA KTKPREEQYN
STYRVVSVLT VLHQDWLNGK EYKCKVSNKA LPAPIEKTIS KAKGQPREPQ
VYTLPPSREE MTKNQVSLTC LVKGFYPSDI AVEWESNGQP ENNYKTTPPV
LDSDGSFFLY SKLTVDKSRW QQGNVFSCSV MHEALHNHYT QKSLSLSPG
DIQMTQSPSS LSASVGDRVT ITCRASQDVN TAVAWYQQKP GKAPKLLIYS
ASFLYSGVPS RFSGSRSGTD FTLTISSLQP EDFATYYCQQ HYTTPPTFGQ
GTKVEIKRTV AAPSVFIFPP SDEQLKSGTA SVVCLLNNFY PREAKVQWKV
DNALQSGNSQ ESVTEQDSKD STYSLSSTLT LSKADYEKHK VYACEVTHQG
LSSPVTKSFN RGEC
100% sequence coverage could be achieved
in 1 injection through only purely tryptic unmodified peptides

21
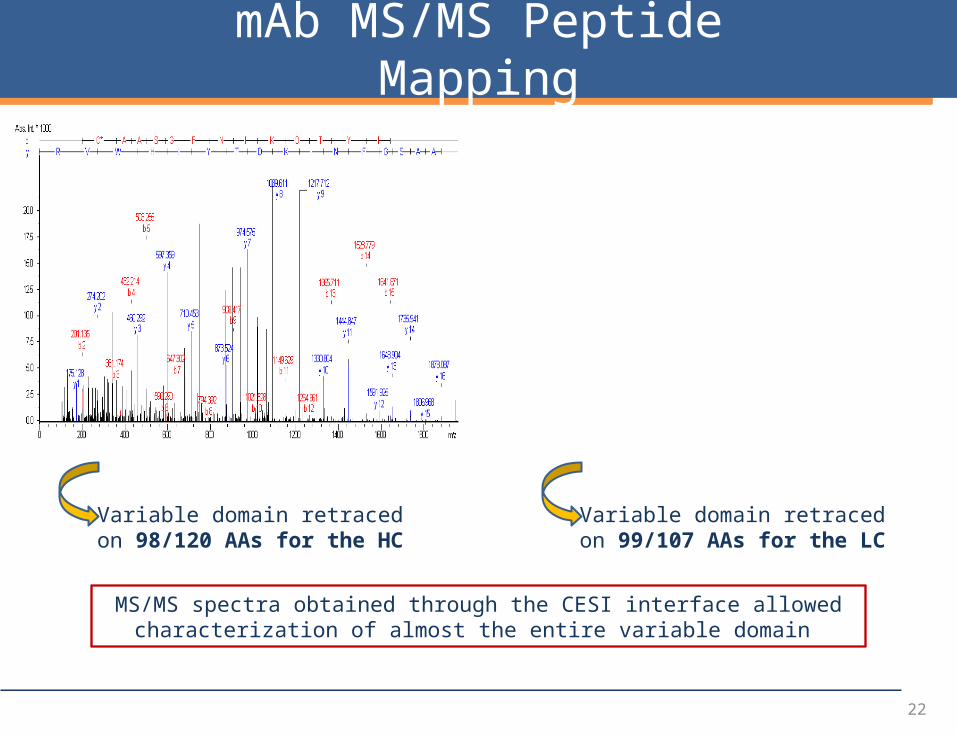
mAb MS/MS Peptide Mapping
MS/MS spectrum of digested peptides HT33
LTVDK(288.182 ; 2+)
MS/MS spectrum of digested peptides HT21
DYFPEPVTVSWNSGALTSGVHTFPAVLQSSGLYSLSSVVTVPSSSLGTQTYICNVNHKPSNTKVDKK(1198.290 ; 6+)
CE allows separation and detection of a wide variety of peptides
22
Variable domain retraced on 98/120 AAs for the HC
Variable domain retraced on 99/107 AAs for the LC
MS/MS spectra obtained through the CESI interface allowed characterization of almost the entire variable domain
mAb MS/MS Peptide Mapping

23A. Beck et al., Anal. Chem. 2012, 84, 4637-4646
Average mass: 148,057 Da (1,328 a.a.)
Trastuzumab (Herceptin)
LC : -N30T – (D/isoD, +1 Da)HC : -N55T – (D/isoD, +1 Da)HC : -N387T – (D/isoD, +1 Da)

24
PTMs Hot-spot Characterization
6 PTMs hot spots characterized on the same CESI-MS/MS analysis
• Hot-spots detected by CESI-MS/MS :
HC E1 cyclization
HC N55 and N387 deamidation
HC M255 and M431 oxidation
LC N30 deamidation
• Peptides detected intact and modified
N*
N

25
E1/pE1 Characterization
EVQLVESGGGLVQPGGSLR
y(16)y(15)
y(13)y(14)
y(11)
b(3)
b(4)
b(2)
100%
50%
0%
E*VQLVESGGGLVQPGGSLR
b(4)
y(6)
y(8)
y(12)
y(13) y(14)
y(16)
y(17)
y(15)
y(11)
y(7)
y(1)
100%
50%
0%

26
N55 Deamidation Characterization
IYPTNGYTR
N
b(8)
y(8)971.476
y(7)808.419
y(6)711.363y(5)
610.312
y(4)496.266
y(3)439.243
y(2)276.175
y(1)175.126
b(7)b(3)
b(2)
100%
50%
0%
IYPTN*GYTR
N*
y(8)972.472
y(7)808.972
y(6)712.367y(5)
611.317
y(4)496.266
y(3)439.243
y(2)276.175
y(1)175.126 b(3)
b(2)
100%
50%
0%

27
M431 Oxydation Characterization
WQQGNVFSCSVM*HEALHNHYTQK
y(16)
M*
y(12)y(5)y(4)
y(3) y(6)y(7)
y(11)
100%
50%
0%
WQQGNVFSCSVMHEALHNHYTQK
y(23)
y(17)
y(18)
y(16)
y(14)y(15)
y(13)y(12)
y(11)
y(9)y(7)
M100%
50%
0%

28
Trastuzumab glycosylation characterization
Structural characterization
204.0854
366.1242
1216.4796 1318.0205
+MS2(1318.0016), 29.5458-29.5458eV, 46.7min #4186
0
20
40
60
80
100
Intens.[%]
200 400 600 800 1000 1200 1400 1600 m/z
2+2+
2+
2+
2+
2+
HT24
Relative abundance 47.5%
MS/MS spectrum of HT24 – G0F (1217.510, 2+)
+MS2(1581.4166), 45-45eV, 47.1min #4212
0
20
40
60
80
100
Intens.[%]
200 400 600 800 1000 1200 1400 1600 m/z
2+2+
Relative abundance 0.71%
HT24
MS/MS spectrum of HT24 – H5N4F1 (1581.190, 2+)
• CESI-MS/MS method in data dependent analysis acquisition allowed to detect 13 different
glycosylations including fragmentation spectra for 9 of them in a single analysis
Trastuzumab
29
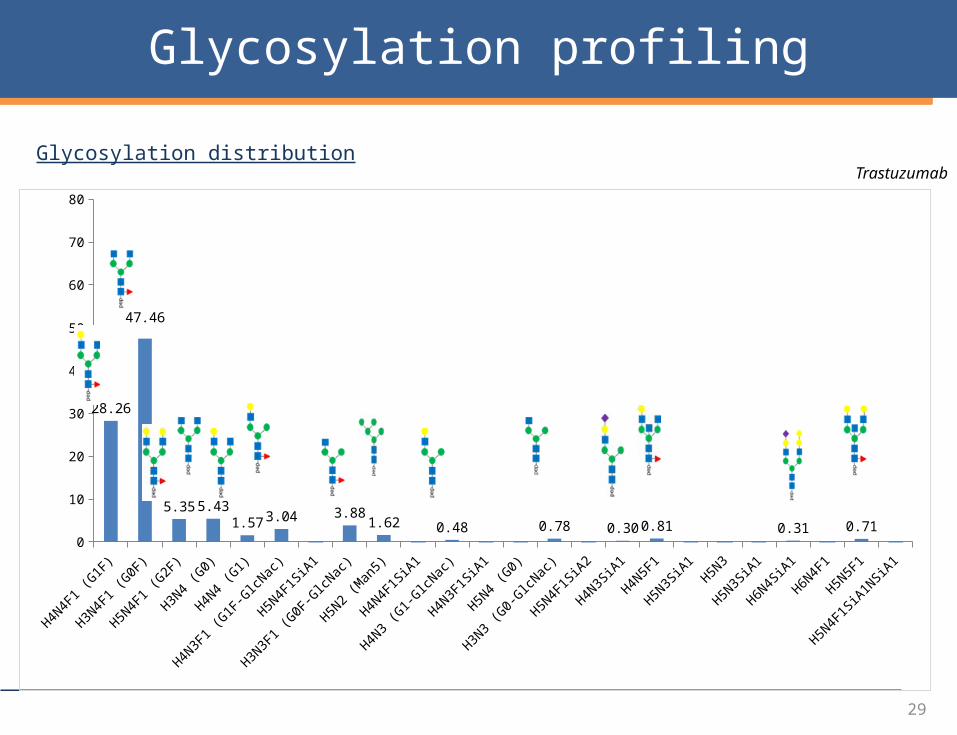
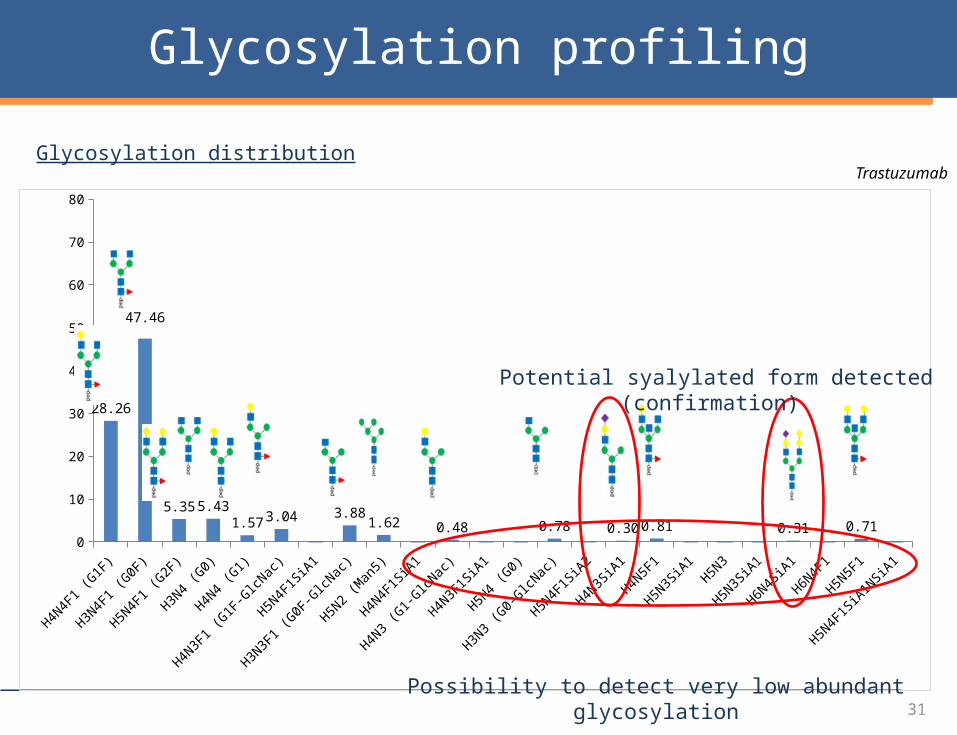
Glycosylation profiling
Glycosylation distribution
H4N4F1 (G
1F)
H3N4F1 (G
0F)
H5N4F1 (G
2F)
H3N4 (G0)
H4N4 (G1)
H4N3F1 (G
1F-GlcN
ac)
H5N4F1SiA
1
H3N3F1 (G
0F-GlcN
ac)
H5N2 (Man
5)
H4N4F1SiA
1
H4N3 (G1-G
lcNac)
H4N3F1SiA
1
H5N4 (G0)
H3N3 (G0-G
lcNac)
H5N4F1SiA
2
H4N3SiA1
H4N5F1
H5N3SiA1
H5N3
H5N3SiA1
H6N4SiA1
H6N4F1
H5N5F1
H5N4F1SiA
1NSiA1
0
10
20
30
40
50
60
70
80
28.26
47.46
5.35 5.431.57 3.04 3.88
1.62 0.48 0.78 0.30 0.81 0.31 0.71
Trastuzumab

30
Glycosylation profiling
Glycosylation distribution
H4N4F1 (G
1F)
H3N4F1 (G
0F)
H5N4F1 (G
2F)
H3N4 (G0)
H4N4 (G1)
H4N3F1 (G
1F-GlcN
ac)
H5N4F1SiA
1
H3N3F1 (G
0F-GlcN
ac)
H5N2 (Man
5)
H4N4F1SiA
1
H4N3 (G1-G
lcNac)
H4N3F1SiA
1
H5N4 (G0)
H3N3 (G0-G
lcNac)
H5N4F1SiA
2
H4N3SiA1
H4N5F1
H5N3SiA1
H5N3
H5N3SiA1
H6N4SiA1
H6N4F1
H5N5F1
H5N4F1SiA
1NSiA1
0
10
20
30
40
50
60
70
80
28.26
47.46
5.35 5.431.57 3.04 3.88
1.62 0.48 0.78 0.30 0.81 0.31 0.71
Trastuzumab
Possibility to detect very low abundant glycosylation
31
Glycosylation profiling
Glycosylation distribution
H4N4F1 (G
1F)
H3N4F1 (G
0F)
H5N4F1 (G
2F)
H3N4 (G0)
H4N4 (G1)
H4N3F1 (G
1F-GlcN
ac)
H5N4F1SiA
1
H3N3F1 (G
0F-GlcN
ac)
H5N2 (Man
5)
H4N4F1SiA
1
H4N3 (G1-G
lcNac)
H4N3F1SiA
1
H5N4 (G0)
H3N3 (G0-G
lcNac)
H5N4F1SiA
2
H4N3SiA1
H4N5F1
H5N3SiA1
H5N3
H5N3SiA1
H6N4SiA1
H6N4F1
H5N5F1
H5N4F1SiA
1NSiA1
0
10
20
30
40
50
60
70
80
28.26
47.46
5.35 5.431.57 3.04 3.88
1.62 0.48 0.78 0.30 0.81 0.31 0.71
Trastuzumab
Possibility to detect very low abundant glycosylation
Potential syalylated form detected (confirmation)

32
Trastu biosimilar MS/MS peptide mapping
EVQLVESGGG LVQPGGSLRL SCAASGFNIK DTYIHWVRQA PGKGLEWVAR
IYPTNGYTRY ADSVKGRFTI SADTSKNTAY LQMNSLRAED TAVYYCSRWG
GDGFYAMDYW GQGTLVTVSS ASTKGPSVFP LAPSSKSTSG GTAALGCLVK
DYFPEPVTVS WNSGALTSGV HTFPAVLQSS GLYSLSSVVT VPSSSLGTQT
YICNVNHKPS NTKVDKKVEP KSCDKTHTCP PCPAPELLGG PSVFLFPPKP
KDTLMISRTP EVTCVVVDVS HEDPEVKFNW YVDGVEVHNA KTKPREEQYN
STYRVVSVLT VLHQDWLNGK EYKCKVSNKA LPAPIEKTIS KAKGQPREPQ
VYTLPPSREE MTKNQVSLTC LVKGFYPSDI AVEWESNGQP ENNYKTTPPV
LDSDGSFFLY SKLTVDKSRW QQGNVFSCSV MHEALHNHYT QKSLSLSPG
DIQMTQSPSS LSASVGDRVT ITCRASQDVN TAVAWYQQKP GKAPKLLIYS
ASFLYSGVPS RFSGSRSGTD FTLTISSLQP EDFATYYCQQ HYTTPPTFGQ
GTKVEIKRTV AAPSVFIFPP SDEQLKSGTA SVVCLLNNFY PREAKVQWKV
DNALQSGNSQ ESVTEQDSKD STYSLSSTLT LSKADYEKHK VYACEVTHQG
LSSPVTKSFN RGEC
Amino acid sequence characterization (Hz5D4)
Each peptide is correctly identified except K217 on the HC
Again complete sequence coverage obtained through tryptic unmodified peptides identification

33
Trastu biosimilar amino acid substitution characterization
175.1235
303.2118
+MS2(517.3055), 32.4557-32.4557eV, 23.4min #2347
0
20
40
60
80
100
Intens.[%]
150 200 250 300 350 400 450 500 m/z
R K D V
VD K R
157.1125
169.1372
211.1573
228.1825
244.1650
256.1768
357.2207
+MS2(314.6916), 20.2997-20.2997eV, 23.5min #2355
0
20
40
60
80
100
Intens.[%]
150 200 250 300 350 400m/z
K V
R V E
y
b
Trastu biosimilar MS/MS peptide mapping
MS/MS spectrum of ion 517.302 (1+) MS/MS spectrum of ion 314.692 (2+)
MS/MS spectra allowed to determine unambiguously Trastu biosimilar
amino acid substitution compared to trastuzumab
V D K R217 V E P K

34
mAb Characterization-Conclusion
• Single analysis of trastuzumab tryptic digest by CESI-MS/MS
Complete sequence coverage on both HC and LC
Characterization of 6 PTMs hot-spots
Structural characterization of 5 major N-glycosylations
100 fmol digested peptides injected
• Use of CE separation mechanism for mAb characterization
Possibility characterize modified and unmodified peptides
In some cases, separation of modified peptide (PTMs)
• This methodology is applicable to various mAbs

Acknowledgments
Emmanuelle Leize-WagnerRabah GahoualMichael Biacchi
Philippe HammannPhilippe Wolf
Lauriane KuhnJohanna Chicher
Esplanade Proteomic Facility(Strasbourg)
Laboratory of Mass Spectrometry of Interactions and System (LSMIS)
Jean-Marc BusnelHans DewaldJeff Chapman
Edna BetgovargezMichel Anselme
Centre d’Immunologie Pierre Fabre
Alain BeckElsa Wagner-Rousset
Marie-Claire Janin-BussatDaniel AyoubOlivier Colas
Acknowledgments
Gary ImpeyJean-Batiste Vincendet
Sujet de thèse déposée à l’EDSC Strasbourg
![Posttranslational Modifications of FERREDOXIN …...Posttranslational Modifications of FERREDOXIN-NADP+ OXIDOREDUCTASE in Arabidopsis Chloroplasts1[W][OPEN] Nina Lehtimäki2, Minna](https://img.pdfslide.net/doc/110x75/5f0d9b3d7e708231d43b3018/posttranslational-modiications-of-ferredoxin-posttranslational-modiications.jpg)