Embed Size (px)
Citation preview
Junk Bonds Versus IT Projects Which Is The Be�er Investment?
Execu�ve Timeslice, LLC www.Execu�veTimeslice.com
Copyright (c) 2013 by John Helm. This work is made available under the terms of the Crea�ve Commons A�ribu�on-‐ShareAlike 3.0 Unsupported license.
John Helm
JHelm Associates, LLC www.JHelmAssociates.com
*Almost…
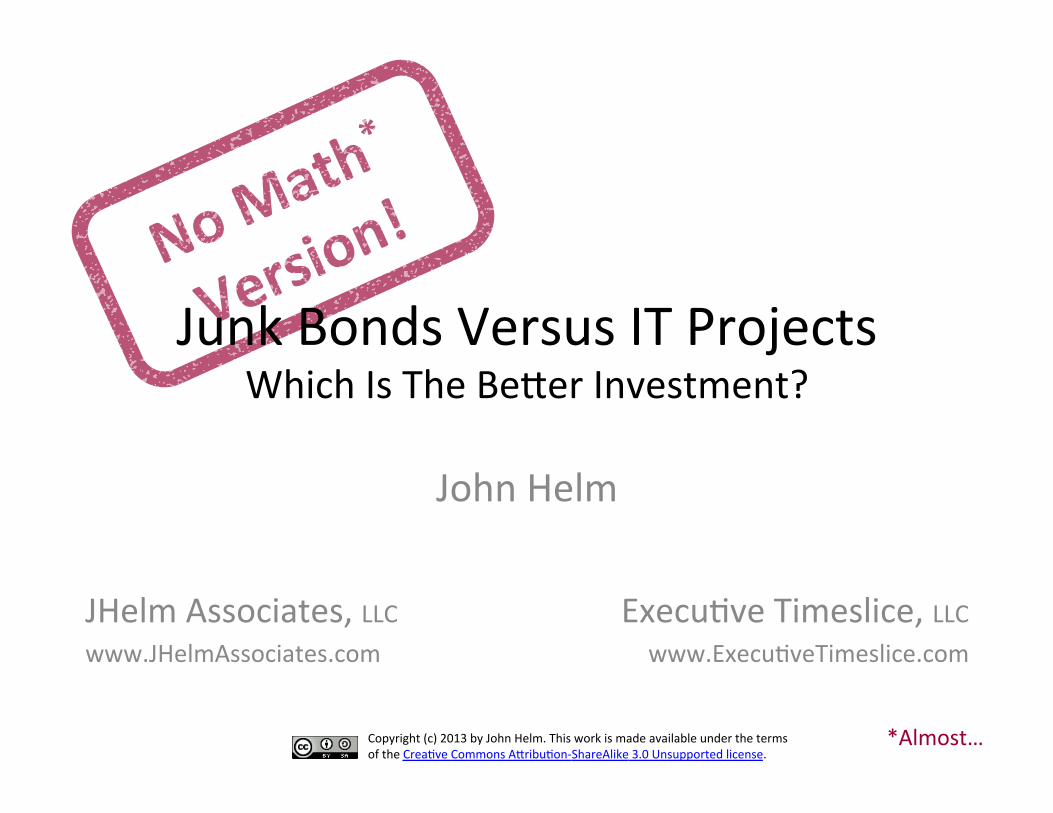
First Of A Series
Junk Bonds versus IT Projects – Which is the be�er investment?
Project Lessons From Space Shu�le Disasters – Fool me twice, shame on me!
Beyond Good and Agile – Breaking free of the hypecycle
1

Denver Airport Baggage System Loss: $620,000,000 Just In Direct Costs
2
Euthanasia Date
Aug, 2005
Planned Opening Date Oct 31, 1993
$1,000,000/Mo
$1,000,000/Day
Actual Opening Date Feb 28, 1995
Cumula�ve Loss
$500,000,000
United Airlines Loss
$120,000,000 1962-‐2002
BAE Automated Systems
RIP
$2.8Bn $4.8Bn
Es�mated Airport Cost: Actual Airport Cost:
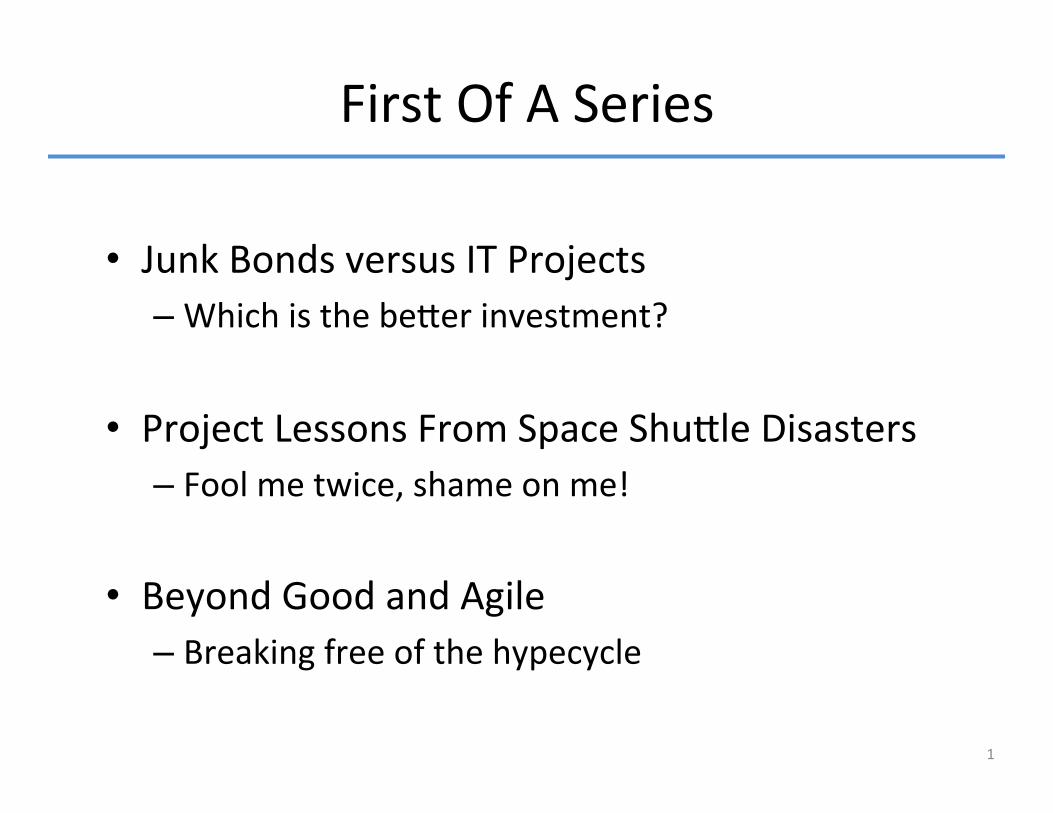
Say “Good Knight” Loss: $10,000,000/Minute For 46 Minutes
$460 Million Loss, 4 x previous year’s income
3 For more, see: SEC (2013). Administra�ve Proceeding, File No. 3-‐15570, h�p://www.sec.gov/li�ga�on/admin/2013/34-‐70694.pdf
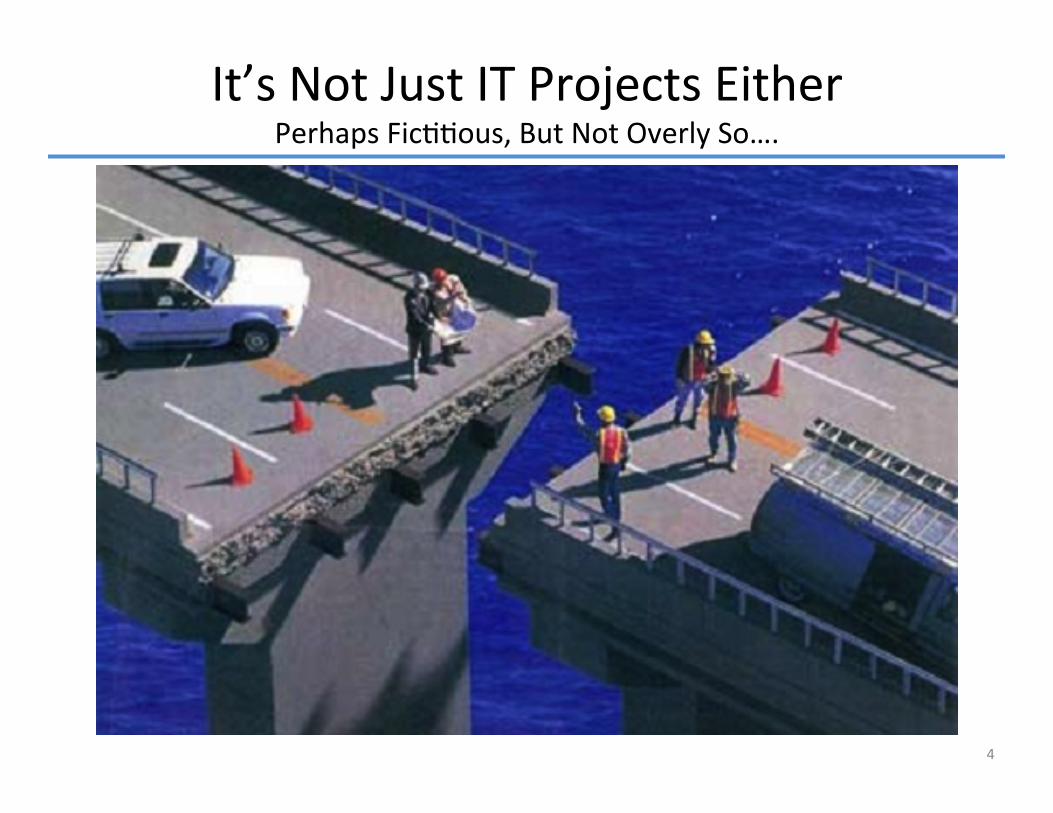
It’s Not Just IT Projects Either Perhaps Fic��ous, But Not Overly So….
4

How Long Ago Was This Published?
“It seems almost automa�c that so�ware is never produced on �me, never meets specifica�on, and always exceeds its es�mated cost. This conference is in fact predicated on this alarming situa�on.”
5
1968
So�ware Engineering: A Report on a conference sponsored by the NATO Science Commi�ee. Garmisch, Germany. 07-‐11 Oct 1968. Peter Naur and Brian Randell, Eds.
The statements on the previous slide were published in
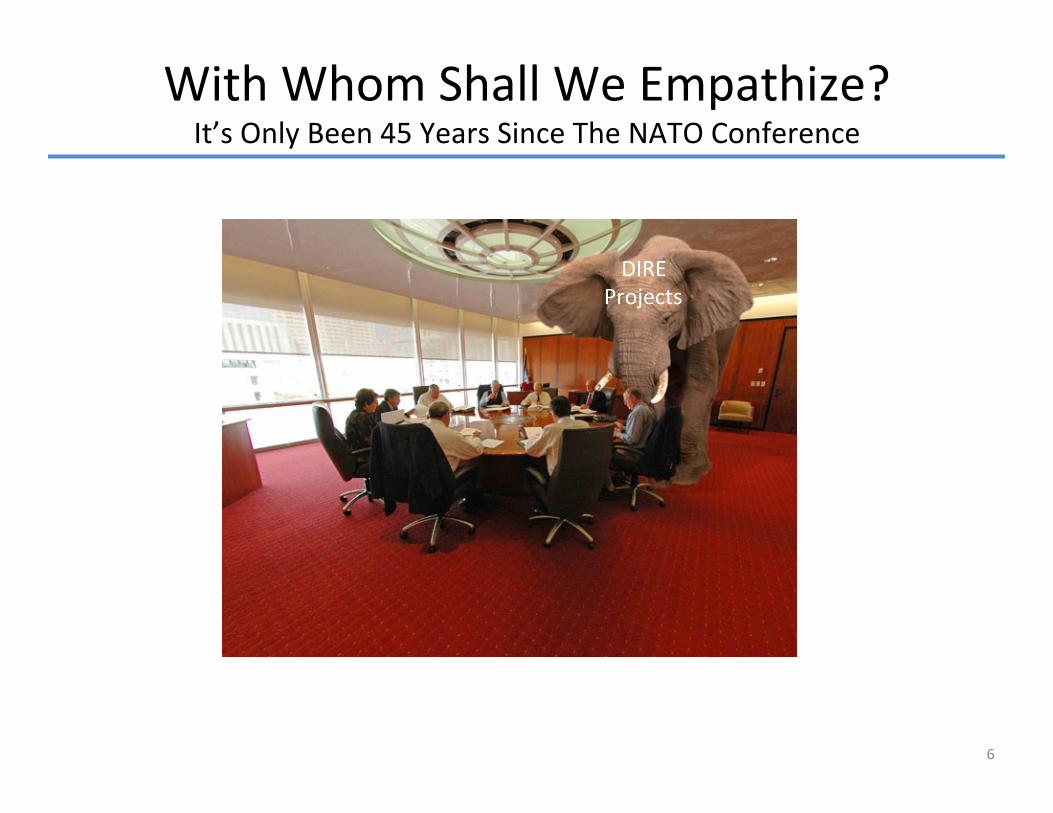
With Whom Shall We Empathize? It’s Only Been 45 Years Since The NATO Conference
6
DIRE Projects

With Whom Shall We Empathize? Secretly, I’m DAMN Glad I’m Not The Elephant…
7
Our Journey So Far 1. IT Project performance poor for 45 years
8
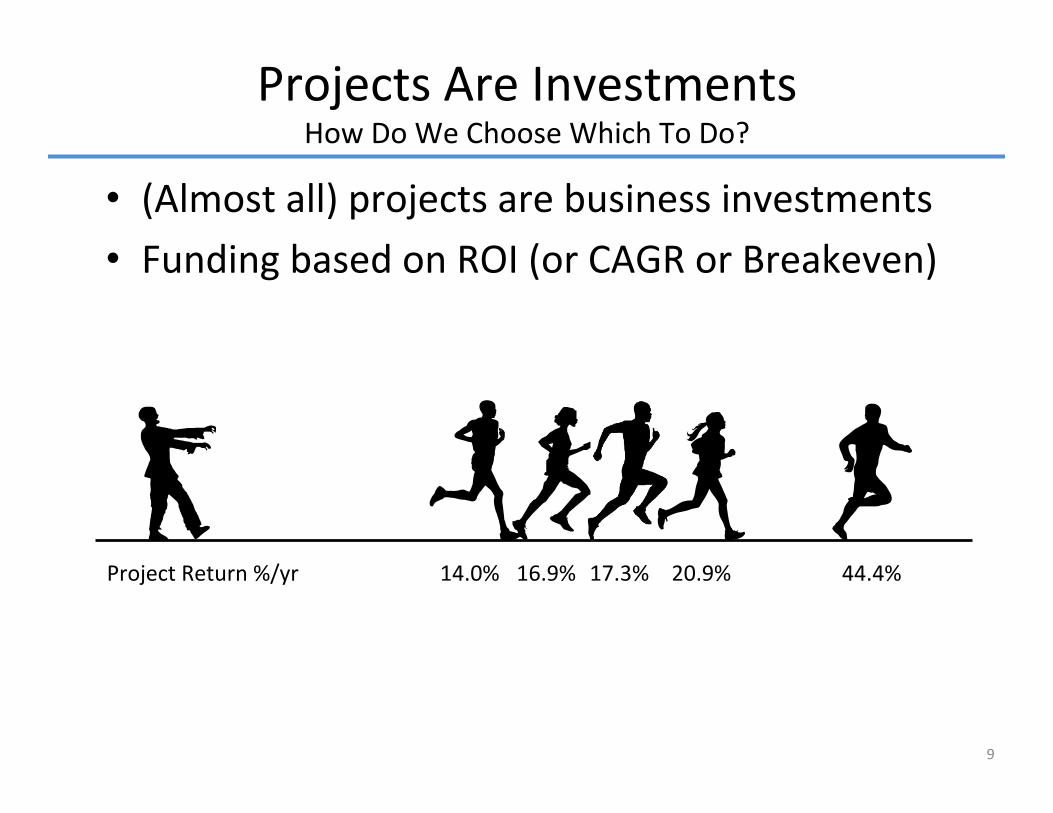
(Almost all) projects are business investments Funding based on ROI (or CAGR or Breakeven)
Projects Are Investments How Do We Choose Which To Do?
9
16.9% 17.3% 20.9% 44.4% 14.0% Project Return %/yr
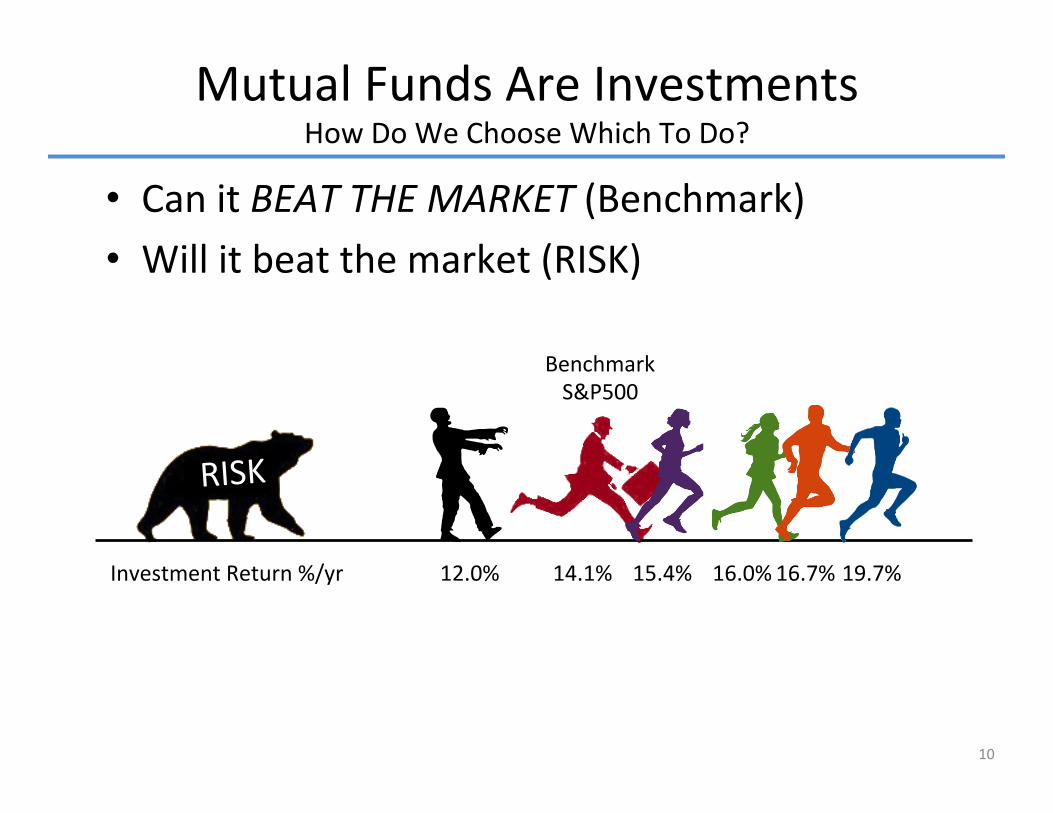
Can it BEAT THE MARKET (Benchmark) Will it beat the market (RISK)
Mutual Funds Are Investments How Do We Choose Which To Do?
10
15.4% 16.0% 16.7% 19.7% 14.1% Investment Return %/yr 12.0%
RISK
Benchmark S&P500
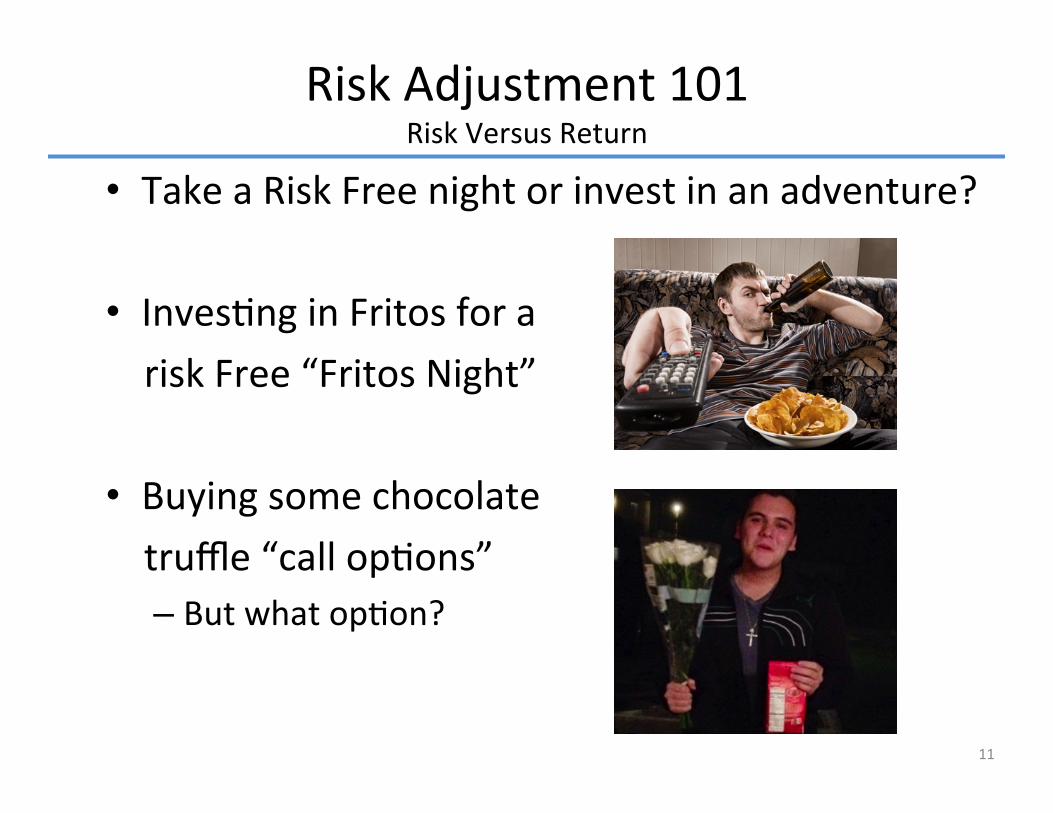
Take a Risk Free night or invest in an adventure? Inves�ng in Fritos for a risk Free “Fritos Night” Buying some chocolate truffle “call op�ons”
– But what op�on?
Risk Adjustment 101 Risk Versus Return
11
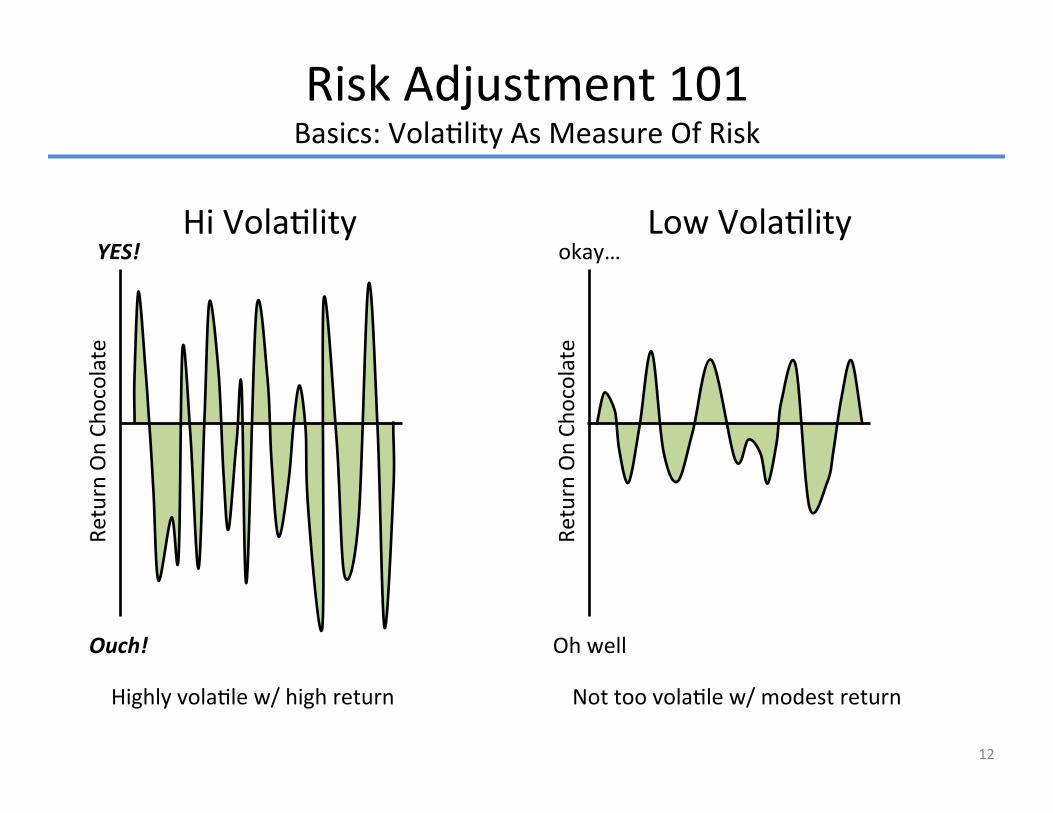
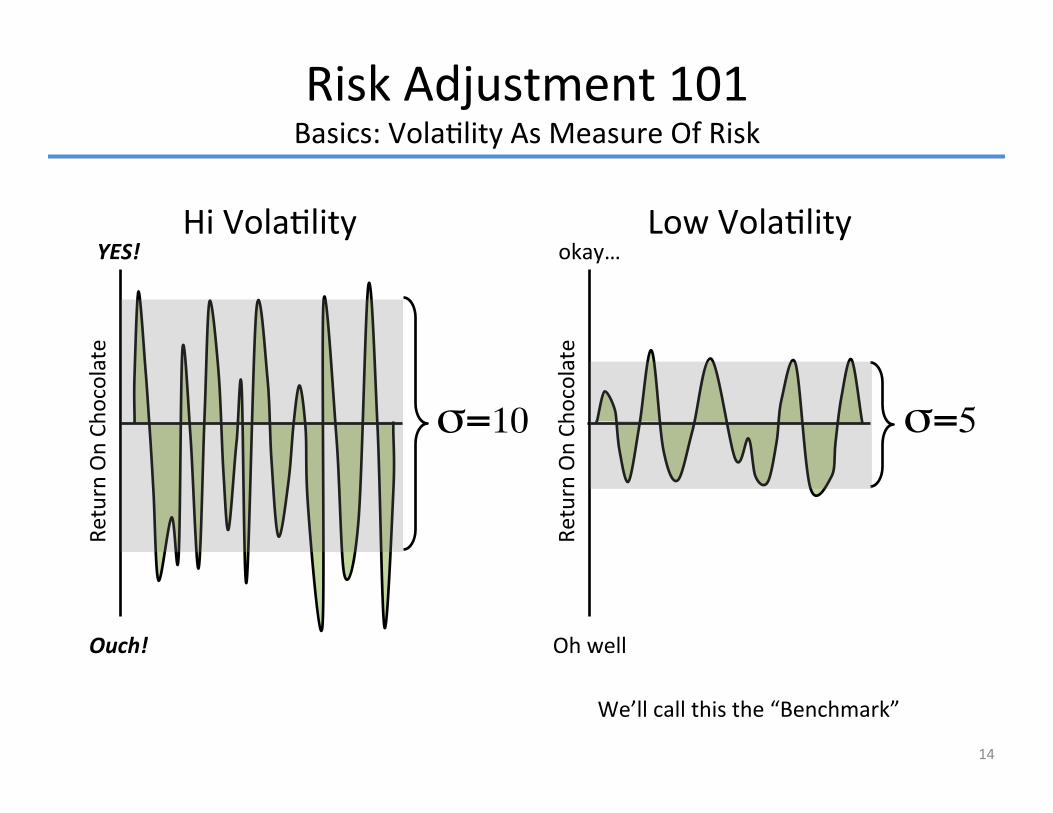
Risk Adjustment 101 Basics: Vola�lity As Measure Of Risk
12
Return On Ch
ocolate
Oh well
okay…
Return On Ch
ocolate
Ouch!
YES! Low Vola�lity Hi Vola�lity
Not too vola�le w/ modest return Highly vola�le w/ high return
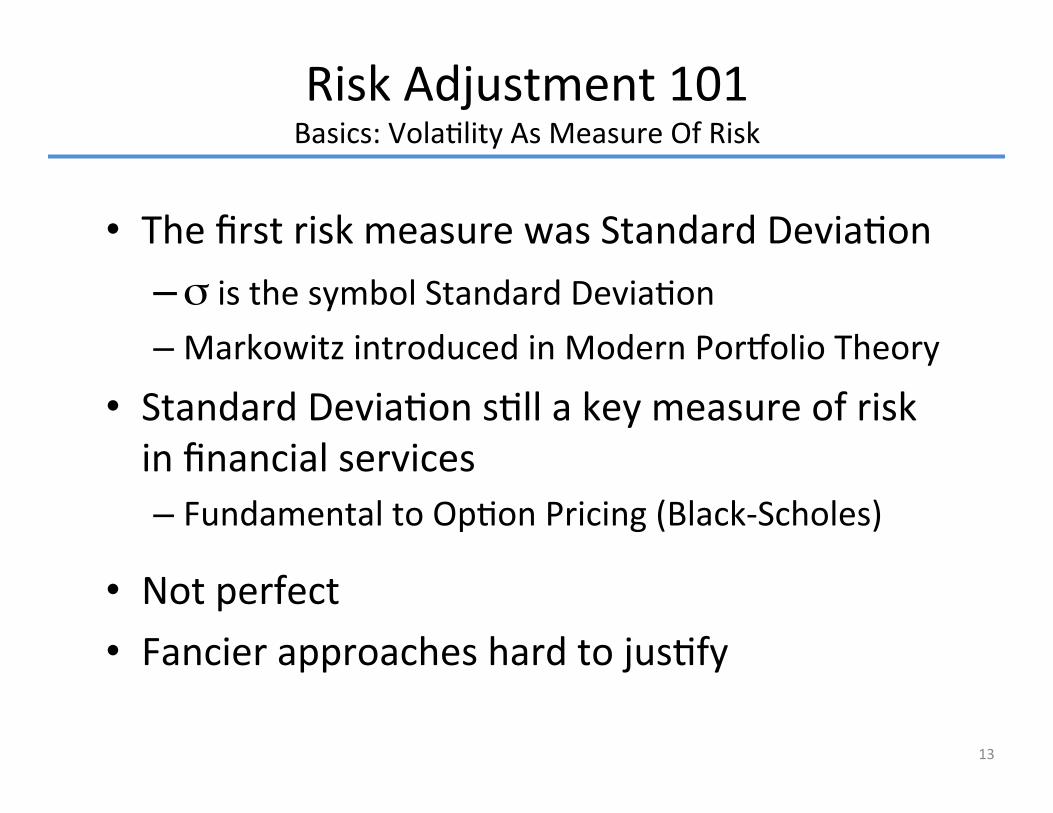
The first risk measure was Standard Devia�on – σ is the symbol Standard Devia�on – Markowitz introduced in Modern Por�olio Theory
Standard Devia�on s�ll a key measure of risk in financial services – Fundamental to Op�on Pricing (Black-‐Scholes)
Not perfect Fancier approaches hard to jus�fy
Risk Adjustment 101 Basics: Vola�lity As Measure Of Risk
13
Risk Adjustment 101 Basics: Vola�lity As Measure Of Risk
14
Return On Ch
ocolate
Oh well
okay…
Return On Ch
ocolate
Ouch!
YES! Low Vola�lity Hi Vola�lity
σ=10 σ=5
We’ll call this the “Benchmark”
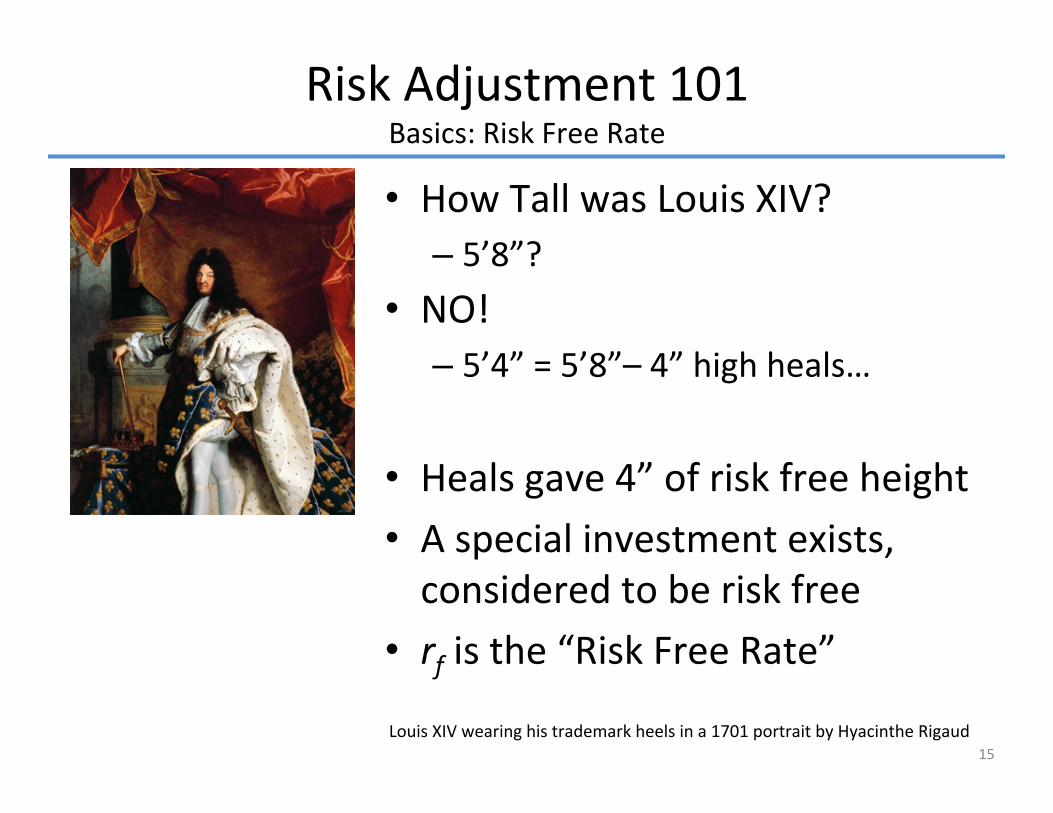
Risk Adjustment 101 Basics: Risk Free Rate
NO! – 5’4” = 5’8”– 4” high heals…
Heals gave 4” of risk free height
15 Louis XIV wearing his trademark heels in a 1701 portrait by Hyacinthe Rigaud
How Tall was Louis XIV? – 5’8”?
A special investment exists, considered to be risk free rf is the “Risk Free Rate”

Risk Adjustment 101 Basics: Excess Return
rf is the “risk free rate” of U.S. Debt [%/yr] ri – rf is “excess return” of the investment i
16
Believe it or not….
US Treasury debt is considered RISK FREE!!!

RAP expressed as adjusted return (CAGR) Adjusts excess return by risk ra�o
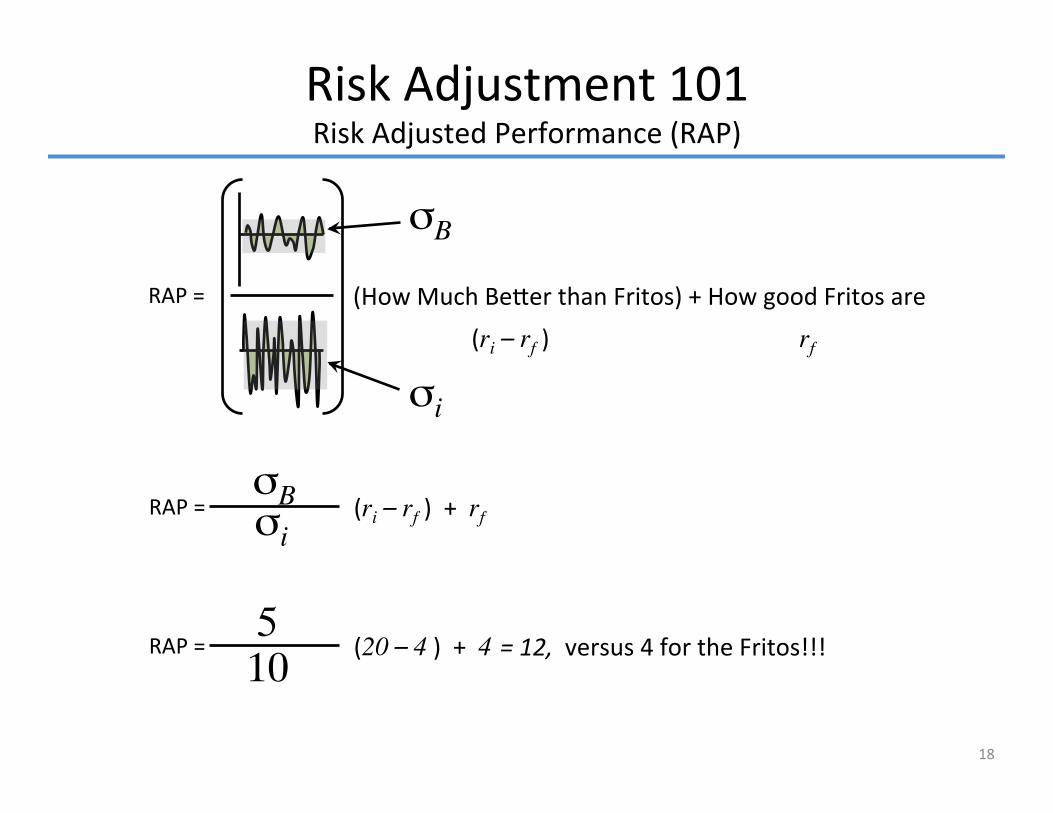
Risk Adjustment 101 Risk Adjusted Performance (RAP)
17
RAP = (How Much Be�er than Fritos) + How good Fritos are
Investment Risk
Benchmark Risk
Risk Free Investment
Risk Adjustment 101 Risk Adjusted Performance (RAP)
18
RAP = (ri – rf ) + rf
RAP = (20 – 4 ) + 4 10 5
= 12, versus 4 for the Fritos!!!
RAP = (How Much Be�er than Fritos) + How good Fritos are
σi
σB
(ri – rf ) rf
σB σi
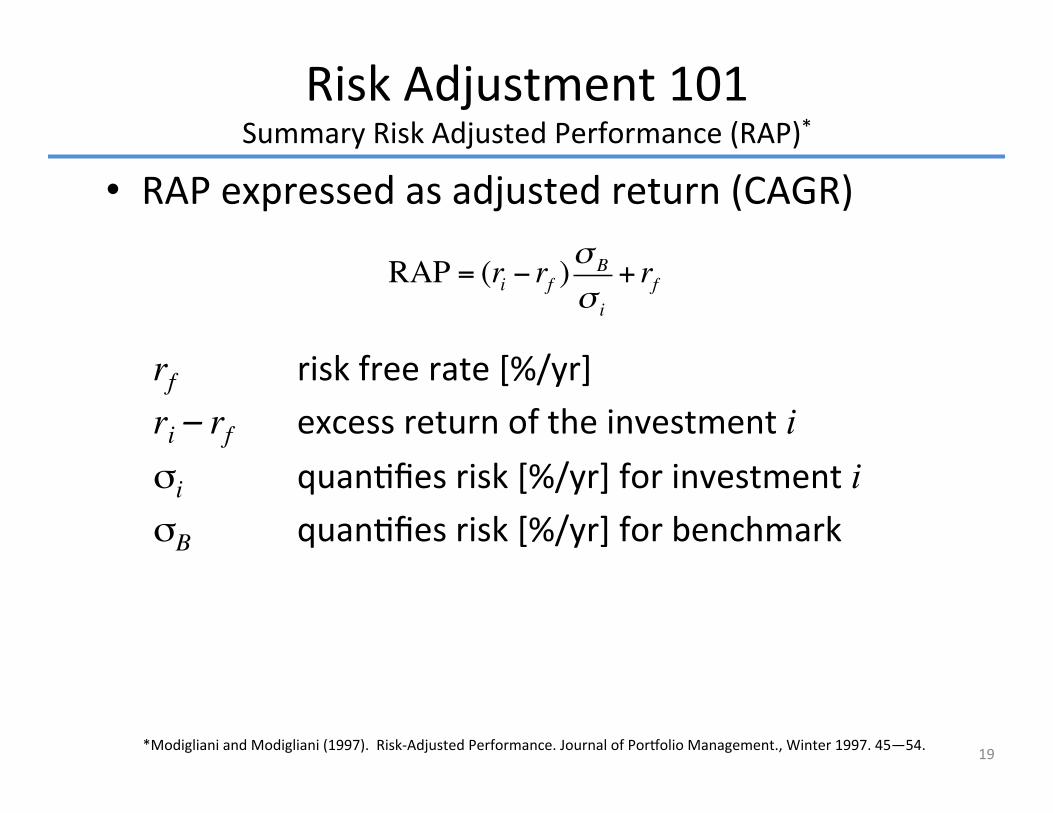
RAP expressed as adjusted return (CAGR)
rf risk free rate [%/yr] ri – rf excess return of the investment i σi quan�fies risk [%/yr] for investment i σB quan�fies risk [%/yr] for benchmark
Risk Adjustment 101 Summary Risk Adjusted Performance (RAP)*
RAP = (ri − rf )σ B
σ i
+ rf
19
*Modigliani and Modigliani (1997). Risk-‐Adjusted Performance. Journal of Por�olio Management., Winter 1997. 45—54.
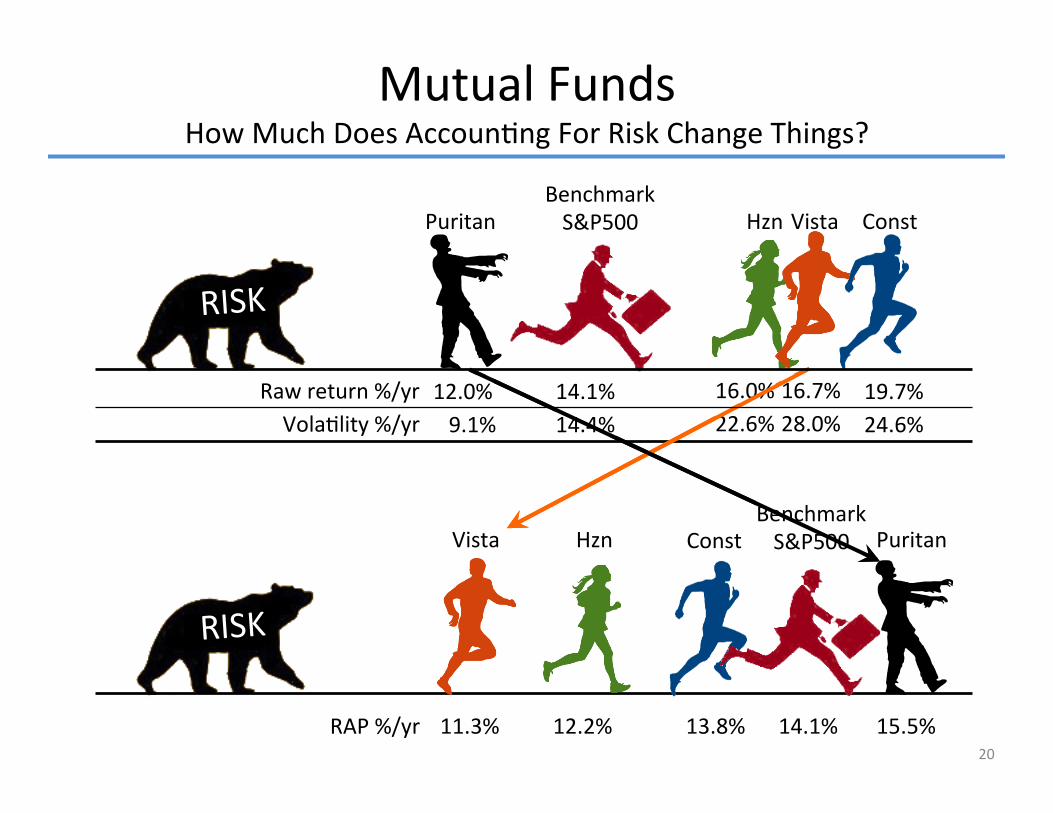
Mutual Funds How Much Does Accoun�ng For Risk Change Things?
20
RAP %/yr
RISK
Vola�lity %/yr
Benchmark S&P500
RISK
Puritan Const Vista Hzn
Const Puritan Hzn Vista
16.0% 16.7% 19.7% 14.1% 12.0%
Benchmark S&P500
28.0% 24.6% 14.4% 9.1% 22.6% Raw return %/yr
13.8% 14.1% 15.5% 12.2% 11.3%
Our Journey So Far 1. IT Project performance poor for 45 years 2. Accoun�ng for risk can make large adjustments
21
1. Set up project model 2. Define benchmark 3. Obtain price and risk data 4. Don the green visor (and calculate)
Basics How To Do RAP For Projects
22
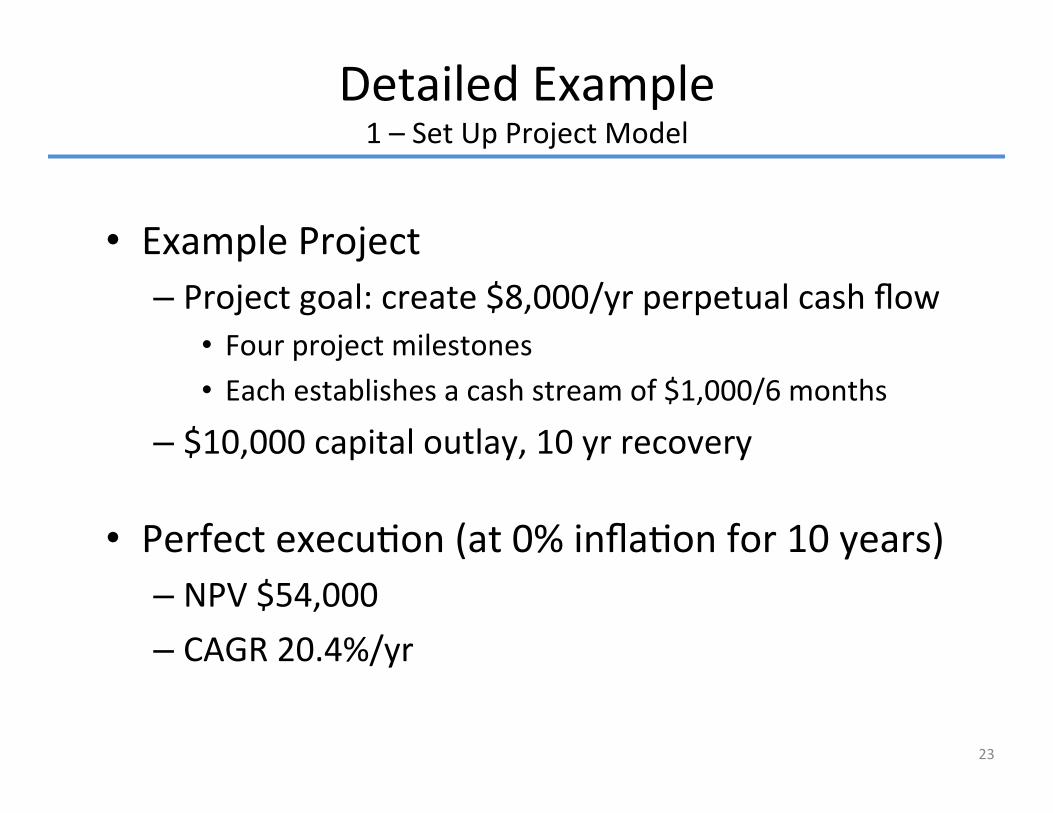
Example Project – Project goal: create $8,000/yr perpetual cash flow
Four project milestones Each establishes a cash stream of $1,000/6 months
– $10,000 capital outlay, 10 yr recovery
Perfect execu�on (at 0% infla�on for 10 years) – NPV $54,000 – CAGR 20.4%/yr
Detailed Example 1 – Set Up Project Model
23
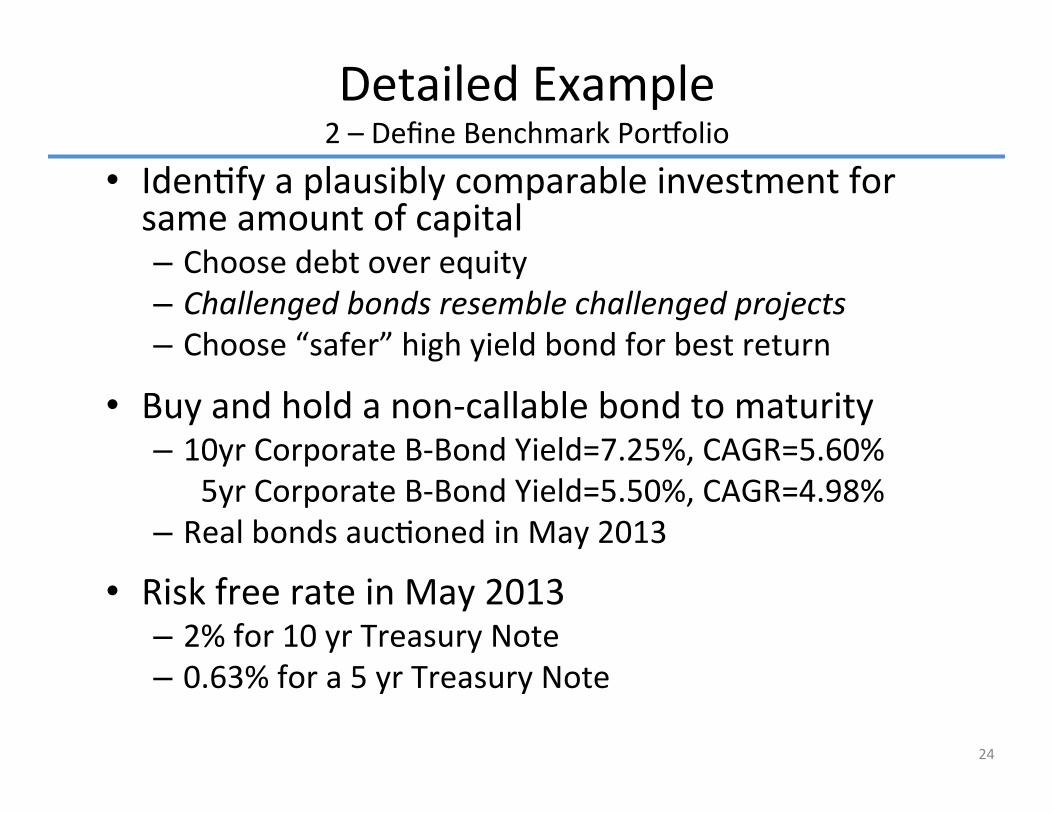
Iden�fy a plausibly comparable investment for same amount of capital – Choose debt over equity – Challenged bonds resemble challenged projects – Choose “safer” high yield bond for best return
Buy and hold a non-‐callable bond to maturity – 10yr Corporate B-‐Bond Yield=7.25%, CAGR=5.60% – 05yr Corporate B-‐Bond Yield=5.50%, CAGR=4.98% – Real bonds auc�oned in May 2013
Risk free rate in May 2013 – 2% for 10 yr Treasury Note – 0.63% for a 5 yr Treasury Note
Detailed Example 2 – Define Benchmark Por�olio
24
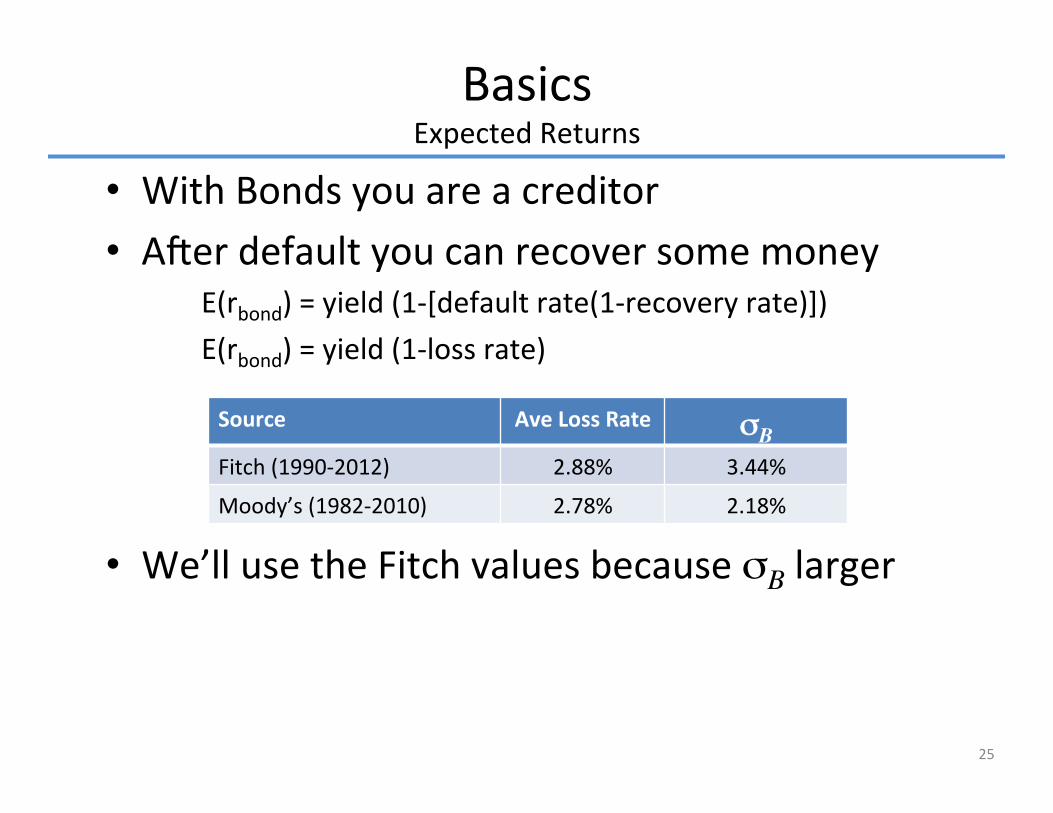
With Bonds you are a creditor A�er default you can recover some money
E(rbond) = yield (1-‐[default rate(1-‐recovery rate)]) E(rbond) = yield (1-‐loss rate)
We’ll use the Fitch values because σB larger
Basics Expected Returns
Source Ave Loss Rate σσB Fitch (1990-‐2012) 2.88% 3.44%
Moody’s (1982-‐2010) 2.78% 2.18%
25
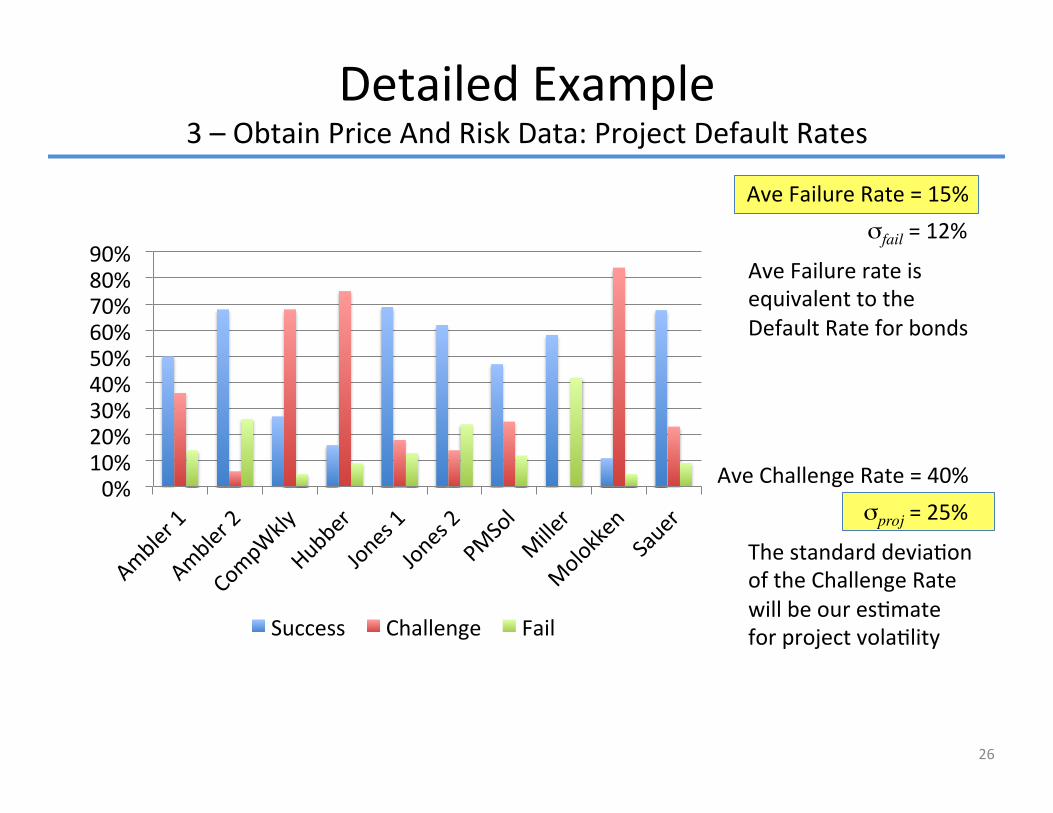
Detailed Example 3 – Obtain Price And Risk Data: Project Default Rates
σproj = 25% Ave Challenge Rate = 40%
The standard devia�on of the Challenge Rate will be our es�mate for project vola�lity
σfail = 12% Ave Failure Rate = 15%
Ave Failure rate is equivalent to the Default Rate for bonds
26
0% 10% 20% 30% 40% 50% 60% 70% 80% 90%
Success Challenge Fail
Example 1 4 – Calculate: $10,000 Capital Outlay; 10 Yr Recovery
27
Risk Adjusted Performance %/yr
Successful Project
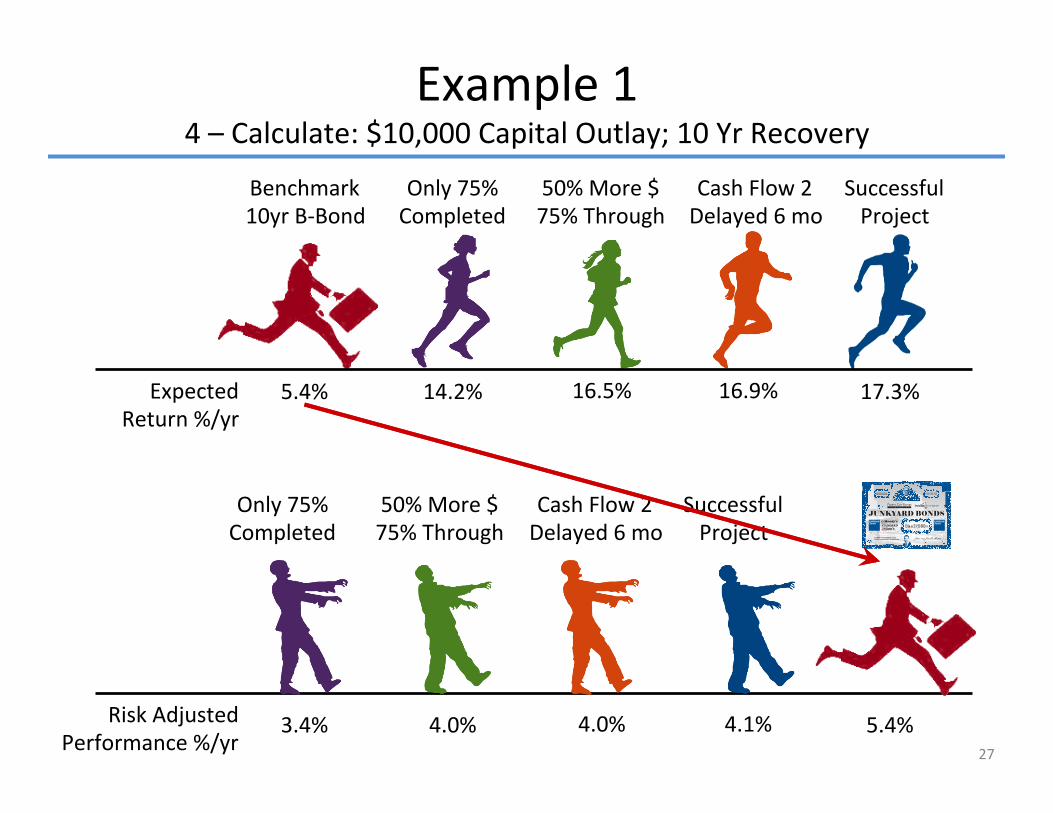
4.0% 4.1% 5.4% 3.4% 4.0%
Expected Return %/yr
Cash Flow 2 Delayed 6 mo
50% More $ 75% Through
Only 75% Completed
Benchmark 10yr B-‐Bond
16.5% 16.9% 17.3% 5.4% 14.2%
Successful Project
Cash Flow 2 Delayed 6 mo
50% More $ 75% Through
Only 75% Completed
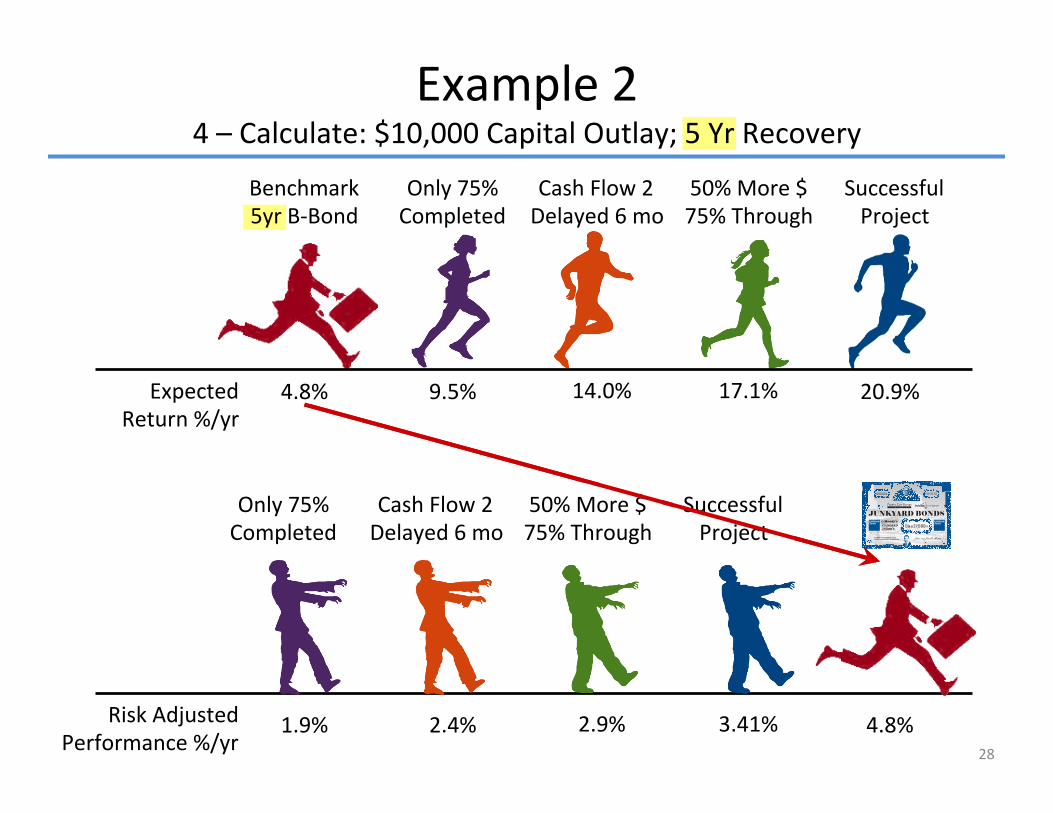
Example 2 4 – Calculate: $10,000 Capital Outlay; 5 Yr Recovery
28
Risk Adjusted Performance %/yr
Successful Project
2.9% 3.41% 4.8% 1.9% 2.4%
Expected Return %/yr
Cash Flow 2 Delayed 6 mo
50% More $ 75% Through
Only 75% Completed
Benchmark 5yr B-‐Bond
14.0% 17.1% 20.9% 4.8% 9.5%
Successful Project
Cash Flow 2 Delayed 6 mo
50% More $ 75% Through
Only 75% Completed
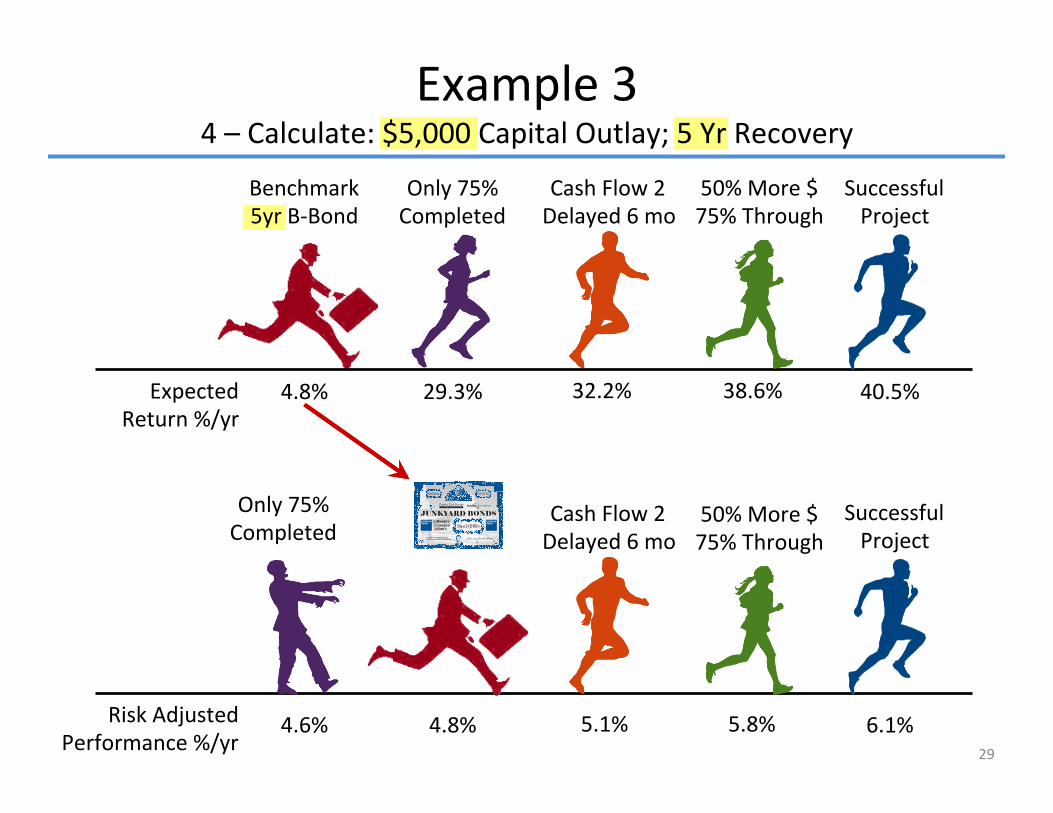
Example 3 4 – Calculate: $5,000 Capital Outlay; 5 Yr Recovery
29
Risk Adjusted Performance %/yr
5.1% 5.8% 6.1% 4.6% 4.8%
Expected Return %/yr
Only 75% Completed
Benchmark 5yr B-‐Bond
32.2% 38.6% 40.5% 4.8% 29.3%
Successful Project
Cash Flow 2 Delayed 6 mo
50% More $ 75% Through
Only 75% Completed
Successful Project
Cash Flow 2 Delayed 6 mo
50% More $ 75% Through

Our Journey So Far 1. IT Project performance poor for 45 years 2. Accoun�ng for risk can make large adjustments 3. As investments, projects underperform rela�ve
to junk bonds when adjusted for risk
30

So What?
31
Categorically, is a very poor measure of risk – Widely accepted doesn’t mean it’s right – It’s really a heuris�c introduced by Markowitz*
“… that the investor does (or should) consider expected return a desirable thing and variance of return an undesirable thing. (p 77)”
Using assumes an underlying distribu�on Project and bond risk is asymmetric, isn’t
Models and Measures of Risk Risk Models Especially Challenging
σ
σ
* Markowitz, H.M. (1952). “Por�olio Selec�on”. Journal of Finance, 7(1) (March), 77-‐91.
σ
32
Issue is unpredictability, of which risk is part – Risk: known unknowns, can es�mate probability – Uncertainty: unknown unknowns, es�mate what? – Bias: systema�c errors in thinking or measurements
Model difficul�es are significant and pervasive – Always simplifica�ons of real world – Premised on assump�ons, es�mates and guesses – Only can model what one can think of
Models and Measures of Risk How Accurate And Useful Are The Models?
33
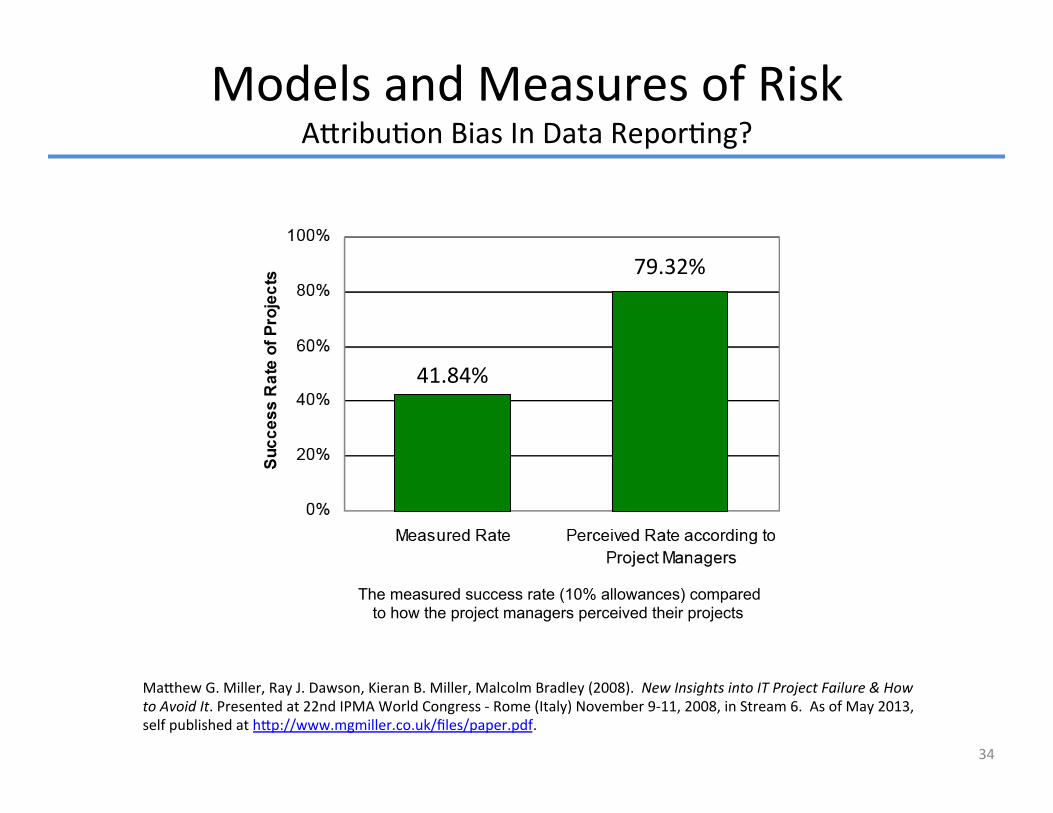
Ma�hew G. Miller, Ray J. Dawson, Kieran B. Miller, Malcolm Bradley (2008). New Insights into IT Project Failure & How to Avoid It. Presented at 22nd IPMA World Congress -‐ Rome (Italy) November 9-‐11, 2008, in Stream 6. As of May 2013, self published at h�p://www.mgmiller.co.uk/files/paper.pdf.
Models and Measures of Risk A�ribu�on Bias In Data Repor�ng?
34
The measured success rate (10% allowances) compared to how the project managers perceived their projects
41.84%
79.32%
Models and Measures of Risk How Does One Manage Emergent Behaviors?
35 Ring Road Traffic Simula�on, 10 and then 11 vehicles/km-‐lane
Models and Measures of Risk How Does One Manage Emergent Behaviors (24)?
36 Ring Road Traffic Simula�on, 24 vehicles/km-‐lane
Emergent Complexity YouTube Ring Road Phantom Traffic Jam
– h�p://www.youtube.com/watch?v=Suugn-‐p5C1M
NYSE Crash(?), 1989 Flash Crash, 2010 BATS Debacle, Mar 2012 NASDAQ Facebook IPO, May 2012 Goldman Sachs, Aug 20, 2013
37
Our Journey So Far 1. IT Project performance poor for 45 years 2. Accoun�ng for risk can make large adjustments 3. As investments, projects underperform rela�ve
to junk bonds when adjusted for risk 4. Emergent, unpredictable behavior may be
more common than we think
38
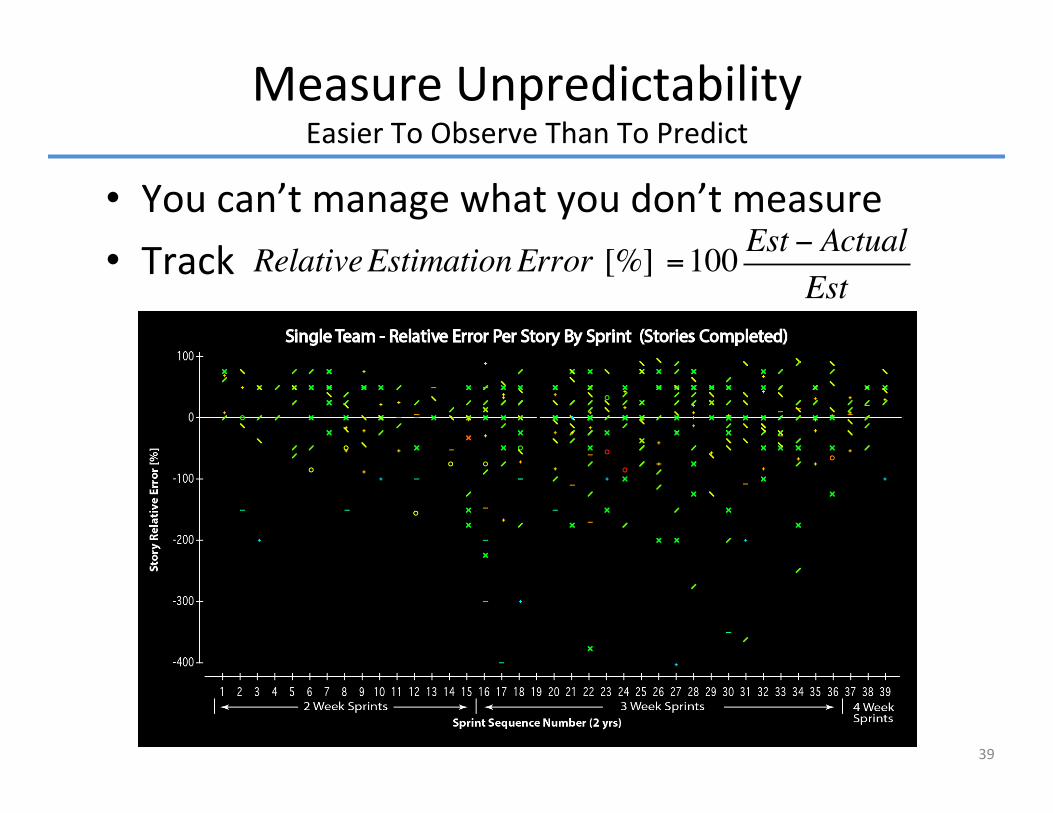
Measure Unpredictability Easier To Observe Than To Predict
You can’t manage what you don’t measure
Track
39
RelativeEstimationError [%] =100 Est − ActualEst

Measure Unpredictability Underrepresents Long-‐Tail Risks σ
40
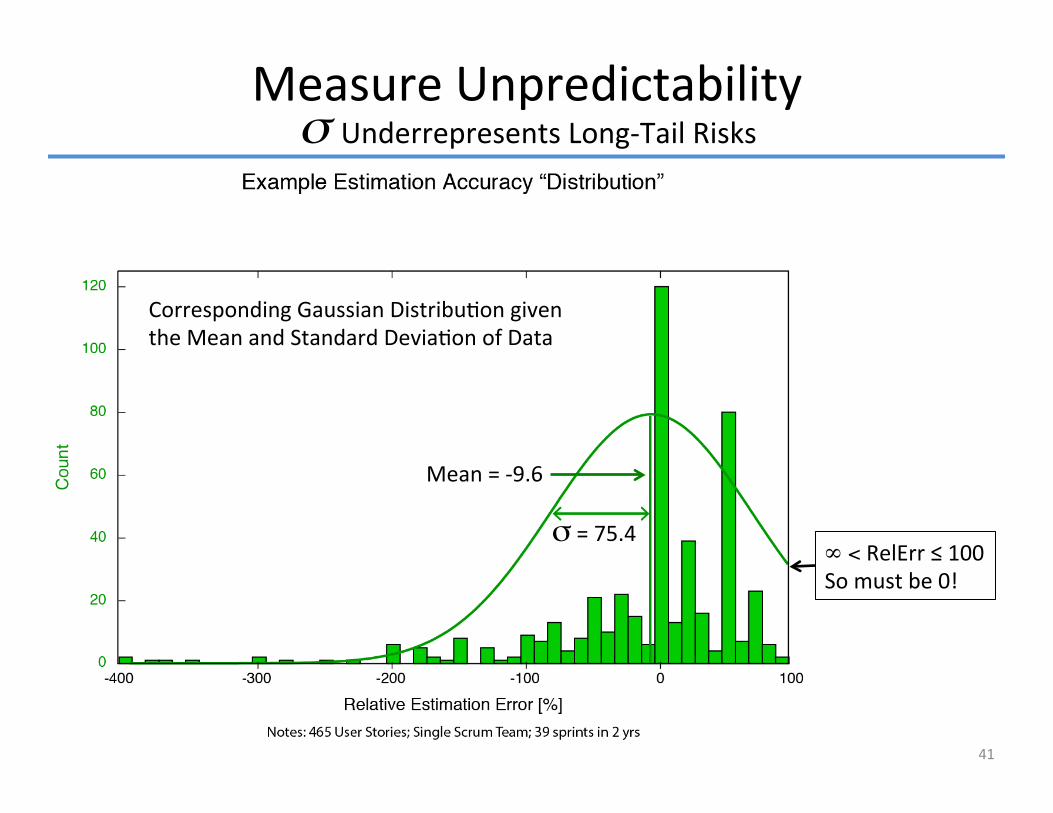
Measure Unpredictability Underrepresents Long-‐Tail Risks σ
Mean = -‐9.6
σ = 75.4
Corresponding Gaussian Distribu�on given the Mean and Standard Devia�on of Data
41
∞ < RelErr ≤ 100 So must be 0!

Measure Unpredictability Underrepresents Long-‐Tail Risks σ
42
A Long Tail Gaussian data should have 1 or 2 cases (0.35%)
Actually have 40 cases (8.6%)
Black Swans Black Swans live in long tails Each Black Swan is an off balance sheet liability Each Black Swan is an off balance sheet liability
Our Journey So Far 1. IT Project performance poor for 45 years 2. Accoun�ng for risk can make large adjustments 3. As investments, projects underperform rela�ve
to junk bonds when adjusted for risk 4. Emergent, unpredictable Black Swans pose
significant project risk
43
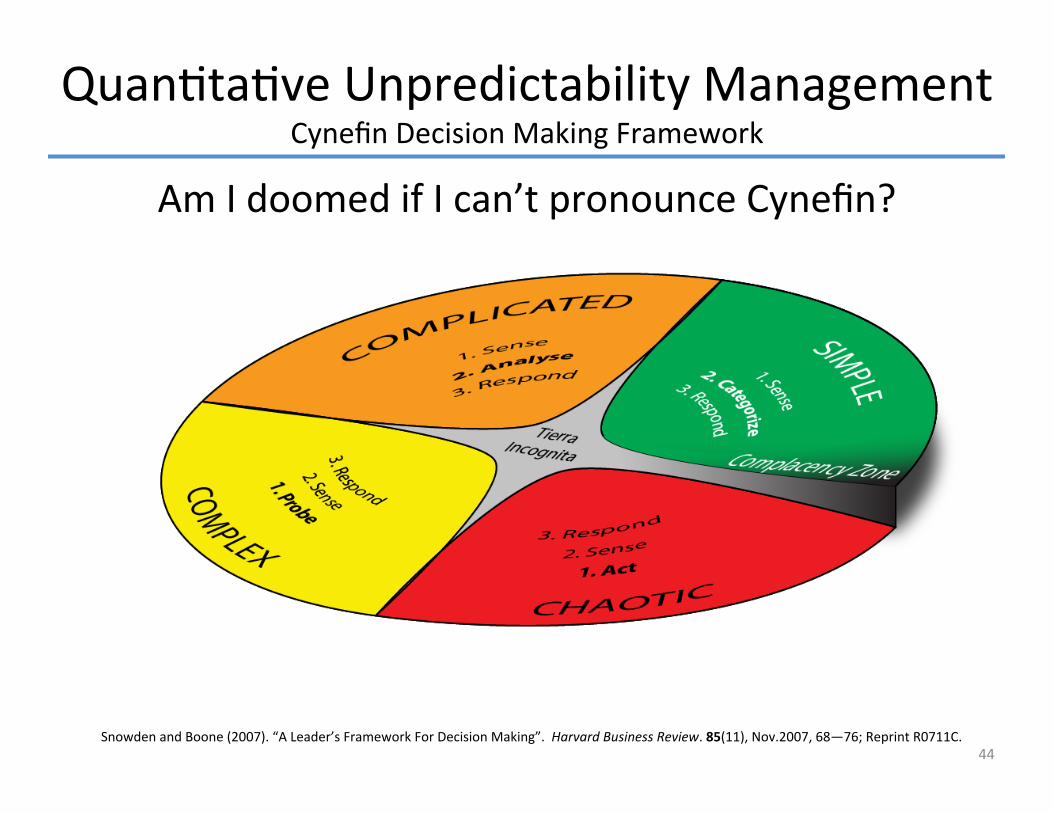
Quan�ta�ve Unpredictability Management Cynefin Decision Making Framework
Am I doomed if I can’t pronounce Cynefin?
44 Snowden and Boone (2007). “A Leader’s Framework For Decision Making”. Harvard Business Review. 85(11), Nov.2007, 68—76; Reprint R0711C.
45
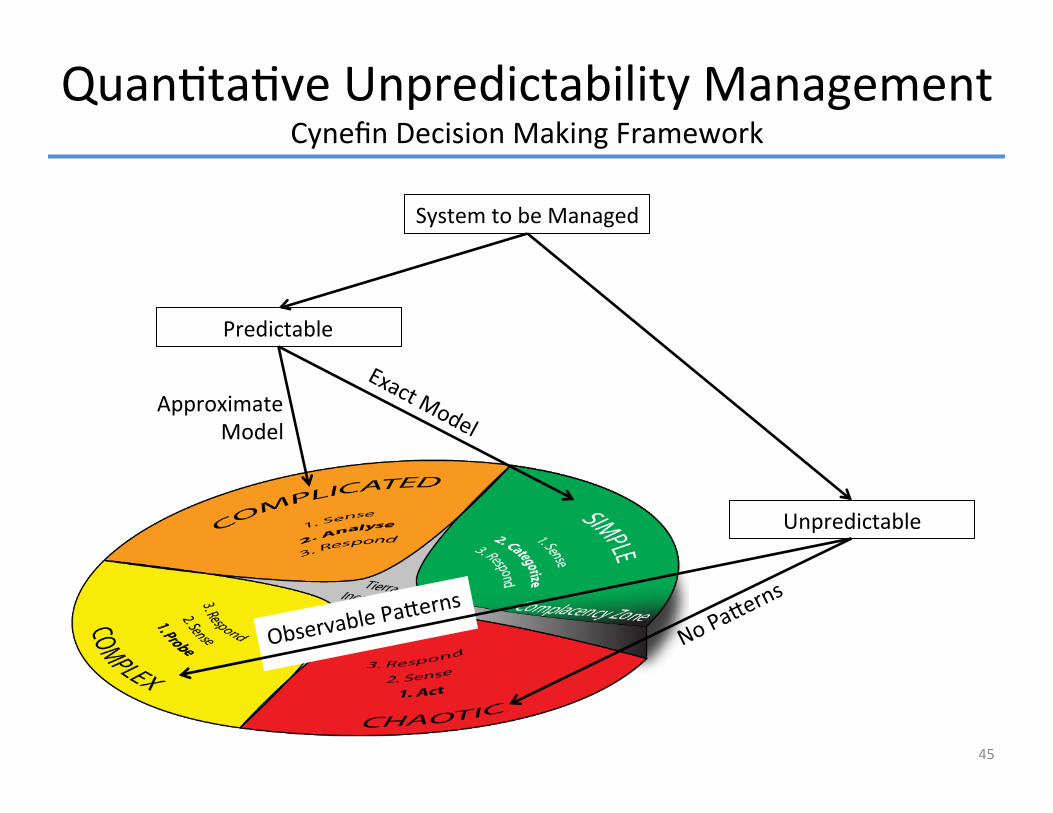
Predictable
Unpredictable
System to be Managed
Observable Pa�e
rns
Approximate Model
Quan�ta�ve Unpredictability Management Cynefin Decision Making Framework

Quan�ta�ve Unpredictability Management Extended Cynefin Framework
Based on
– Normal Accident Theory (Charles Perrow) – Complex Systems Theory (many)
46
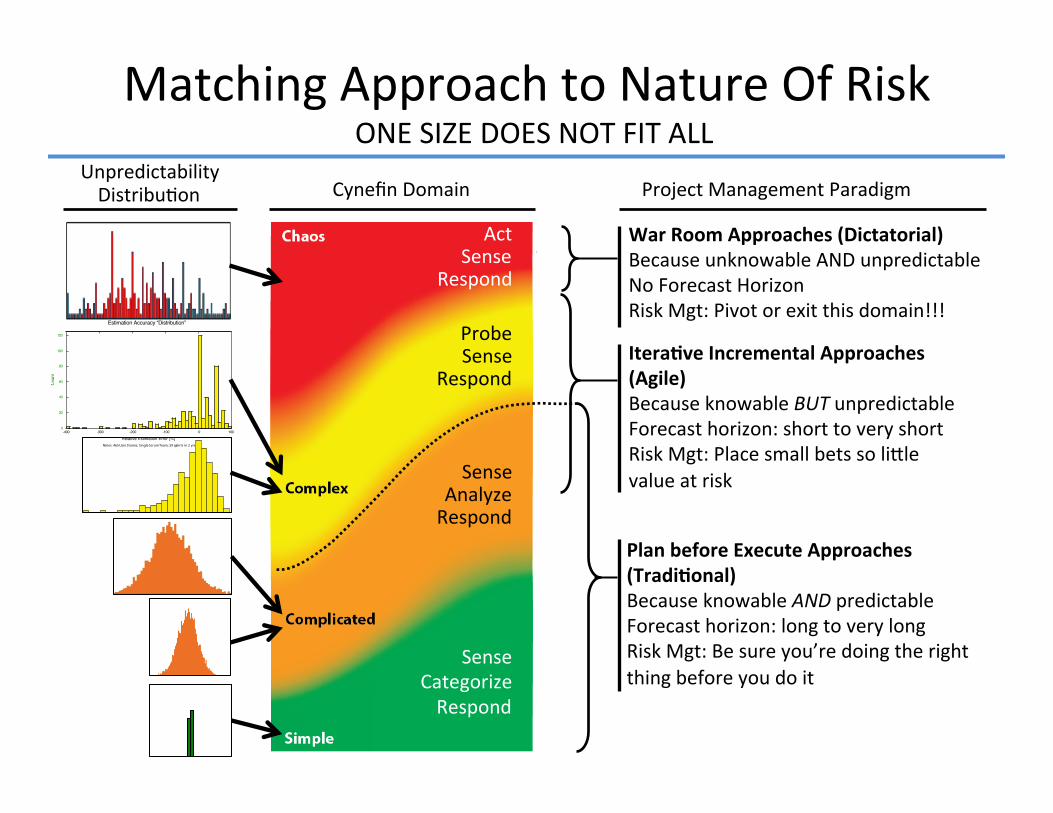
War Room Approaches (Dictatorial) Because unknowable AND unpredictable No Forecast Horizon Risk Mgt: Pivot or exit this domain!!!
Plan before Execute Approaches (Tradi�onal) Because knowable AND predictable Forecast horizon: long to very long Risk Mgt: Be sure you’re doing the right thing before you do it
Itera�ve Incremental Approaches (Agile) Because knowable BUT unpredictable Forecast horizon: short to very short Risk Mgt: Place small bets so li�le value at risk
Probe Sense
Respond
Sense Categorize Respond
Sense Analyze Respond
Act Sense
Respond
Project Management Paradigm Unpredictability Distribu�on Cynefin Domain
-400 -300 -200 -100 0 100 0
20
40
60
80
100
120
Relative Estimation Error [%]
Estimation Accuracy “Distribution”
Not es: 465 User Stories; Single Scrum Team; 39 sprin ts in 2 yrs
Matching Approach to Nature Of Risk ONE SIZE DOES NOT FIT ALL

Our Journey 1. IT Project performance poor for 45 years 2. Accoun�ng for risk can make large adjustments 3. As investments, projects underperform rela�ve
to junk bonds when adjusted for risk 4. Emergent, unpredictable Black Swans pose
significant project risk 5. Mi�gate Black Swan risks by
5.1 Measuring Unpredictability 5.2 Choose an apt project management method
48
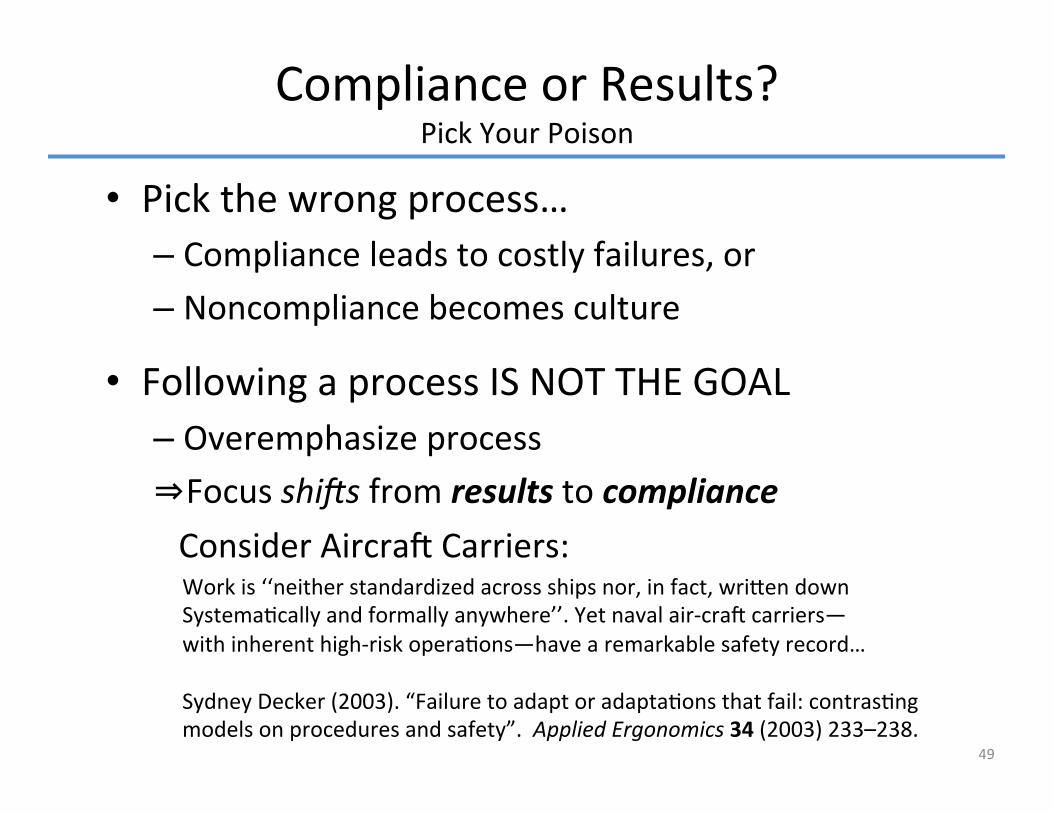
Pick the wrong process… – Compliance leads to costly failures, or – Noncompliance becomes culture
Following a process IS NOT THE GOAL – Overemphasize process ⇒ Focus shi�s from results to compliance Consider Aircra� Carriers:
49
Compliance or Results? Pick Your Poison
Work is ‘‘neither standardized across ships nor, in fact, wri�en down Systema�cally and formally anywhere’’. Yet naval air-‐cra� carriers— with inherent high-‐risk opera�ons—have a remarkable safety record… Sydney Decker (2003). “Failure to adapt or adapta�ons that fail: contras�ng models on procedures and safety”. Applied Ergonomics 34 (2003) 233–238.

Customary project evalua�on ignores risk Risk adjustment shows junk bonks o�en be�er Key problem is unacknowledged “long tails” Time to address this explicitly
– Include risk adjustment in project evalua�on – Measure unpredictability – Select management prac�ces that match
Presenta�on Copies: – This talk: h�p://jhelmassociates.com/resources.html?item=junkProjNoMath – More Math version: h�p://jhelmassociates.com/resources.html?item=junkProj
Summary
50 ~/itMgt/proj/ppts/junkBonds_Versus_Projects-‐lessMath-‐JohnHelm-‐V1p6.pptx (jlh) 2013:11:04 18:09 -0700
Ques�ons?
51

Appendix Detailed RAP Calcula�ons Results Risk Anomaly (counter heuris�c)
52
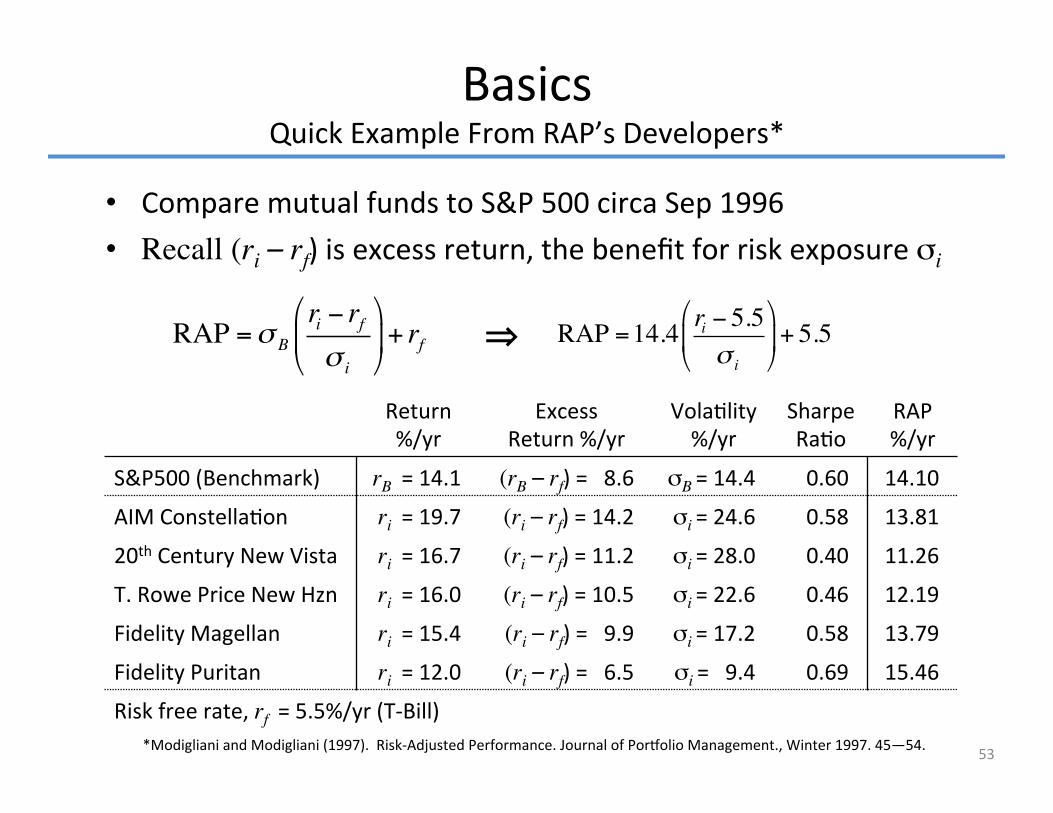
Compare mutual funds to S&P 500 circa Sep 1996 Recall (ri – rf) is excess return, the benefit for risk exposure σi
Basics Quick Example From RAP’s Developers*
Return %/yr
Excess Return %/yr
Vola�lity %/yr
Sharpe Ra�o
RAP %/yr
S&P500 (Benchmark) rB = 14.1 (rB – rf) = 8.6 σB = 14.4 0.60 14.10
AIM Constella�on ri = 19.7 (ri – rf) = 14.2 σi = 24.6 0.58 13.81
20th Century New Vista ri = 16.7 (ri – rf) = 11.2 σi = 28.0 0.40 11.26
T. Rowe Price New Hzn ri = 16.0 (ri – rf) = 10.5 σi = 22.6 0.46 12.19
Fidelity Magellan ri = 15.4 (ri – rf) = 9.9 σi = 17.2 0.58 13.79
Fidelity Puritan ri = 12.0 (ri – rf) = 6.5 σi = 9.4 0.69 15.46
Risk free rate, rf = 5.5%/yr (T-‐Bill) *Modigliani and Modigliani (1997). Risk-‐Adjusted Performance. Journal of Por�olio Management., Winter 1997. 45—54. 53
⇒ RAP =14.4 ri − 5.5σ i
"
#$
%
&'+ 5.5RAP =σ B
ri − rfσ i
"
#$
%
&'+ rf
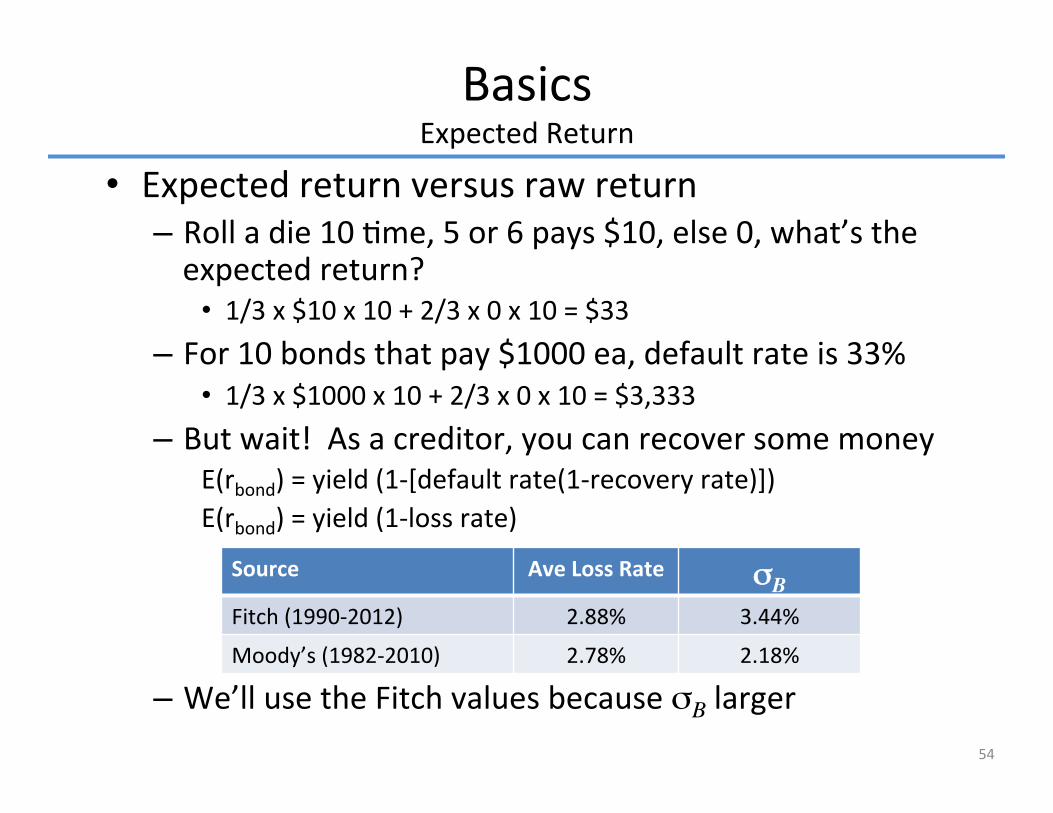
Expected return versus raw return – Roll a die 10 �me, 5 or 6 pays $10, else 0, what’s the expected return? 1/3 x $10 x 10 + 2/3 x 0 x 10 = $33
– For 10 bonds that pay $1000 ea, default rate is 33% 1/3 x $1000 x 10 + 2/3 x 0 x 10 = $3,333
– But wait! As a creditor, you can recover some money E(rbond) = yield (1-‐[default rate(1-‐recovery rate)]) E(rbond) = yield (1-‐loss rate)
– We’ll use the Fitch values because σB larger
Basics Expected Return
Source Ave Loss Rate σσB Fitch (1990-‐2012) 2.88% 3.44%
Moody’s (1982-‐2010) 2.78% 2.18%
54
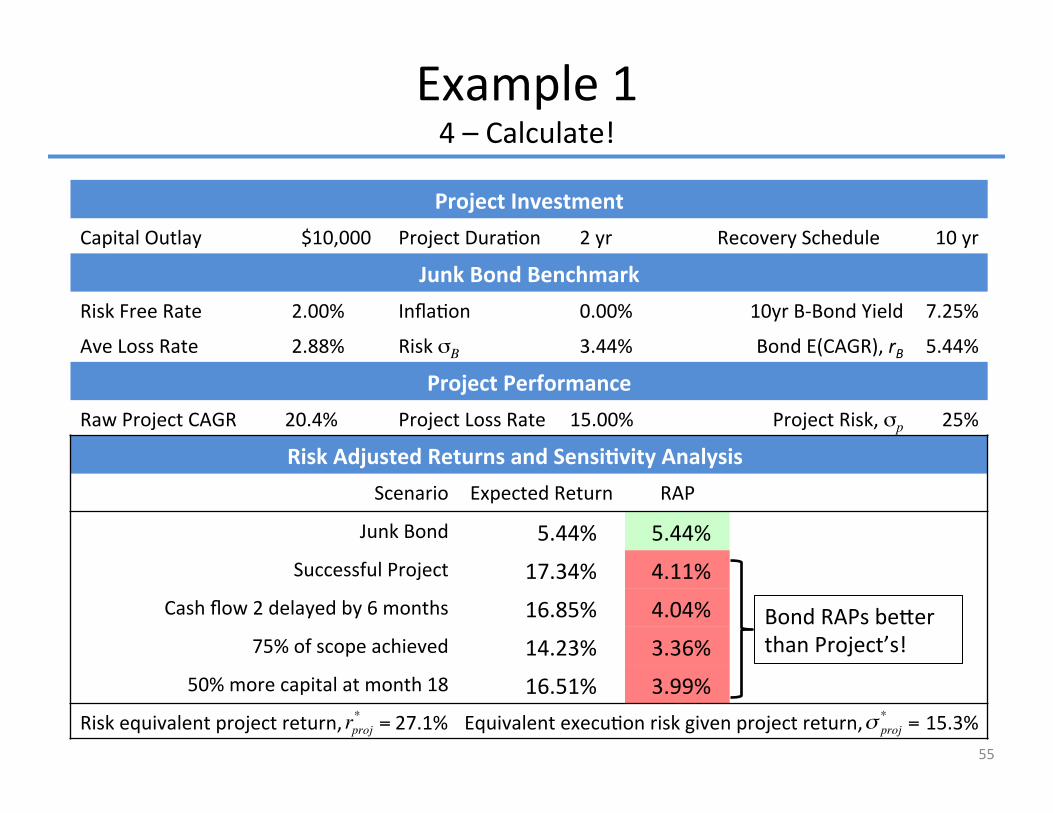
Project Investment Capital Outlay $10,000 Project Dura�on 2 yr Recovery Schedule 10 yr
Junk Bond Benchmark Risk Free Rate 2.00% Infla�on 0.00% 10yr B-‐Bond Yield 7.25%
Ave Loss Rate 2.88% Risk σB 3.44% Bond E(CAGR), rB 5.44%
Project Performance Raw Project CAGR 20.4% Project Loss Rate 15.00% Project Risk, σp 25%
Risk Adjusted Returns and Sensi�vity Analysis Scenario Expected Return RAP
Junk Bond 5.44% 5.44% Successful Project 17.34% 4.11%
Cash flow 2 delayed by 6 months 16.85% 4.04% 75% of scope achieved 14.23% 3.36%
50% more capital at month 18 16.51% 3.99% Risk equivalent project return, 27.1% Equivalent execu�on risk given project return, 15.3%
Bond RAPs be�er than Project’s!
Example 1 4 – Calculate!
rproj* = σ proj
* =
55
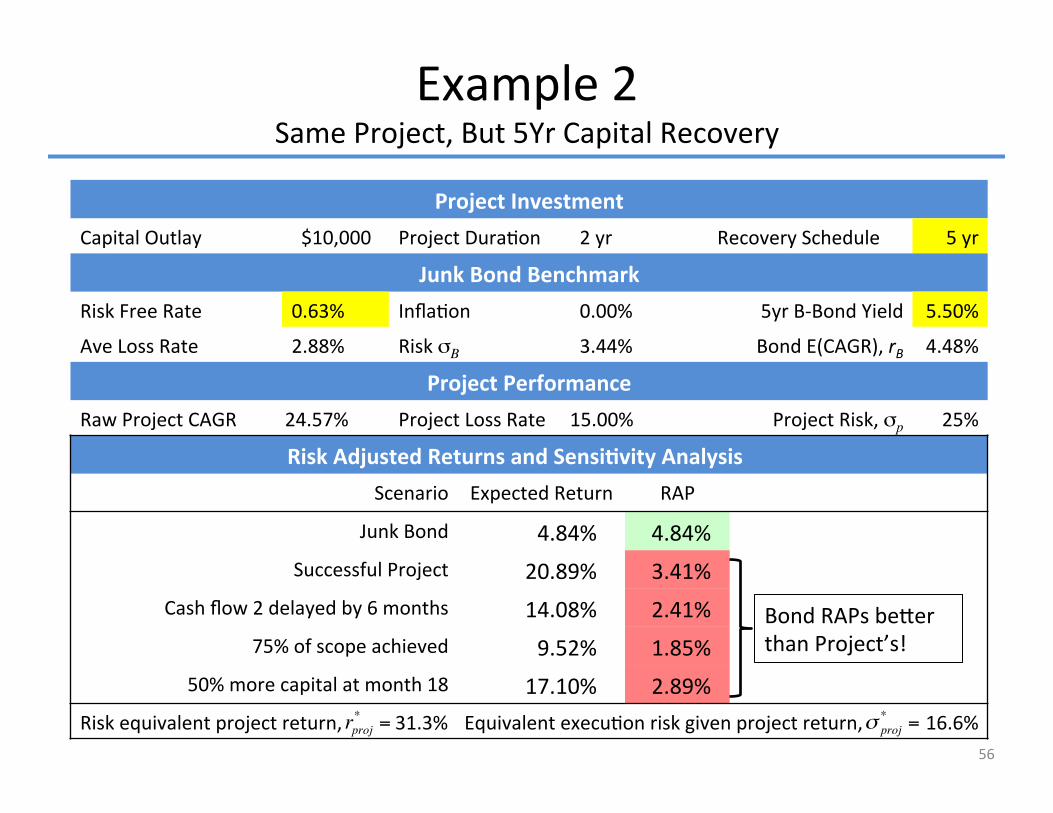
Project Investment Capital Outlay $10,000 Project Dura�on 2 yr Recovery Schedule 5 yr
Junk Bond Benchmark Risk Free Rate 0.63% Infla�on 0.00% 5yr B-‐Bond Yield 5.50%
Ave Loss Rate 2.88% Risk σB 3.44% Bond E(CAGR), rB 4.48%
Project Performance Raw Project CAGR 24.57% Project Loss Rate 15.00% Project Risk, σp 25%
Risk Adjusted Returns and Sensi�vity Analysis Scenario Expected Return RAP
Junk Bond 4.84% 4.84% Successful Project 20.89% 3.41%
Cash flow 2 delayed by 6 months 14.08% 2.41% 75% of scope achieved 9.52% 1.85%
50% more capital at month 18 17.10% 2.89% Risk equivalent project return, 31.3% Equivalent execu�on risk given project return, 16.6%
Bond RAPs be�er than Project’s!
rproj* = σ proj
* =
Example 2 Same Project, But 5Yr Capital Recovery
56
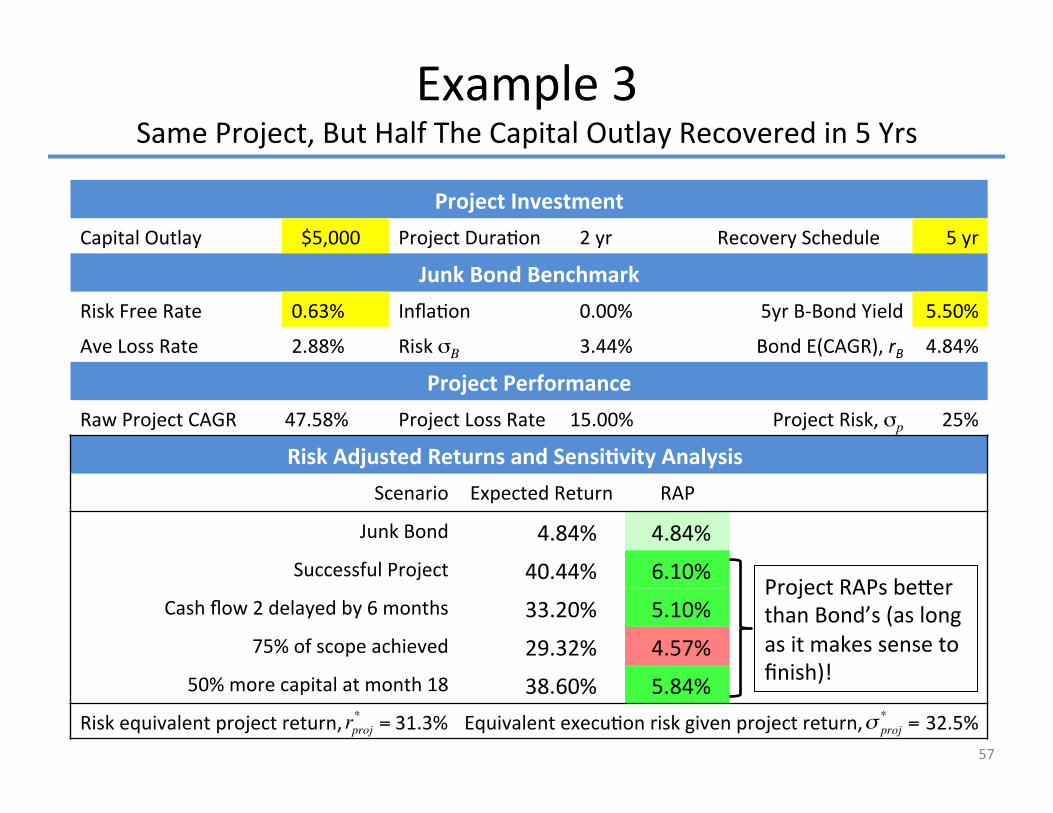
Project Investment Capital Outlay $5,000 Project Dura�on 2 yr Recovery Schedule 5 yr
Junk Bond Benchmark Risk Free Rate 0.63% Infla�on 0.00% 5yr B-‐Bond Yield 5.50%
Ave Loss Rate 2.88% Risk σB 3.44% Bond E(CAGR), rB 4.84%
Project Performance Raw Project CAGR 47.58% Project Loss Rate 15.00% Project Risk, σp 25%
Risk Adjusted Returns and Sensi�vity Analysis Scenario Expected Return RAP
Junk Bond 4.84% 4.84% Successful Project 40.44% 6.10%
Cash flow 2 delayed by 6 months 33.20% 5.10% 75% of scope achieved 29.32% 4.57%
50% more capital at month 18 38.60% 5.84% Risk equivalent project return, 31.3% Equivalent execu�on risk given project return, 32.5%
Project RAPs be�er than Bond’s (as long as it makes sense to finish)!
Example 3 Same Project, But Half The Capital Outlay Recovered in 5 Yrs
rproj* = σ proj
* =
57
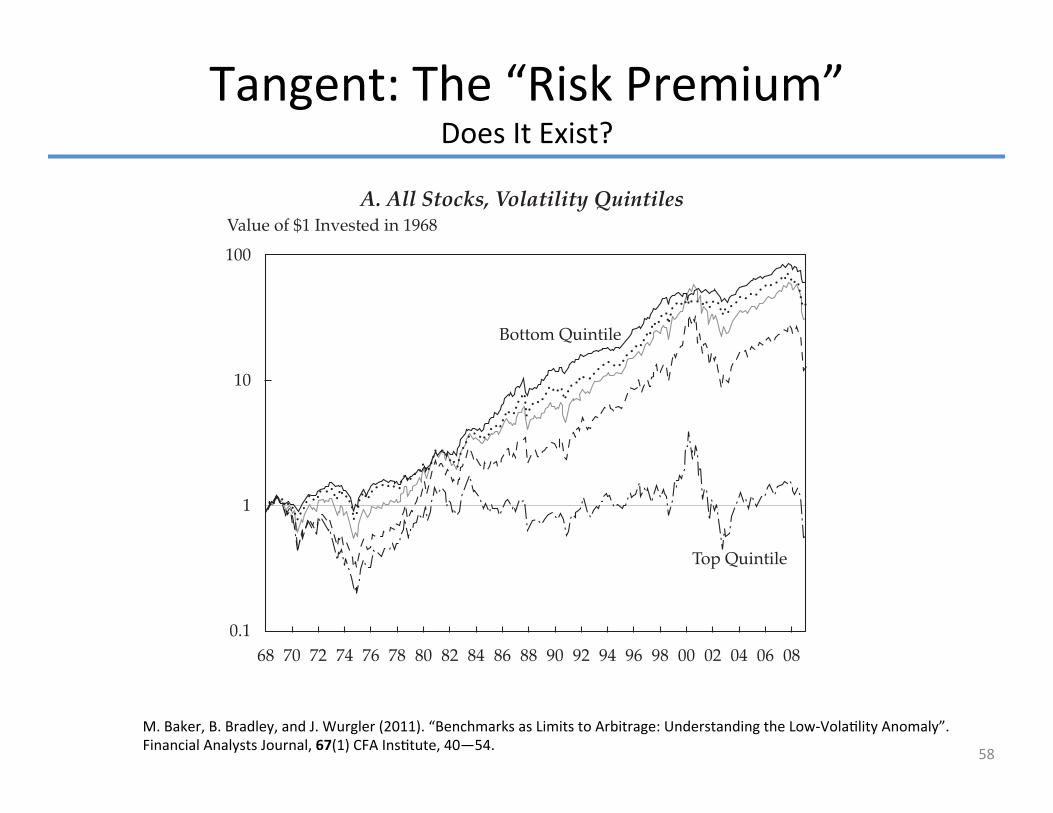
Tangent: The “Risk Premium” Does It Exist?
58
1
Value of $1 Invested in 1968A. All Stocks, Volatility Quintiles
100
10
0.168 7870 72 74 76 80 82 84 86 90 92 94 96 00 02 04 06 0888 98
Top Quintile
Bottom Quintile
M. Baker, B. Bradley, and J. Wurgler (2011). “Benchmarks as Limits to Arbitrage: Understanding the Low-‐Vola�lity Anomaly”. Financial Analysts Journal, 67(1) CFA Ins�tute, 40—54.

Random Goodies
59
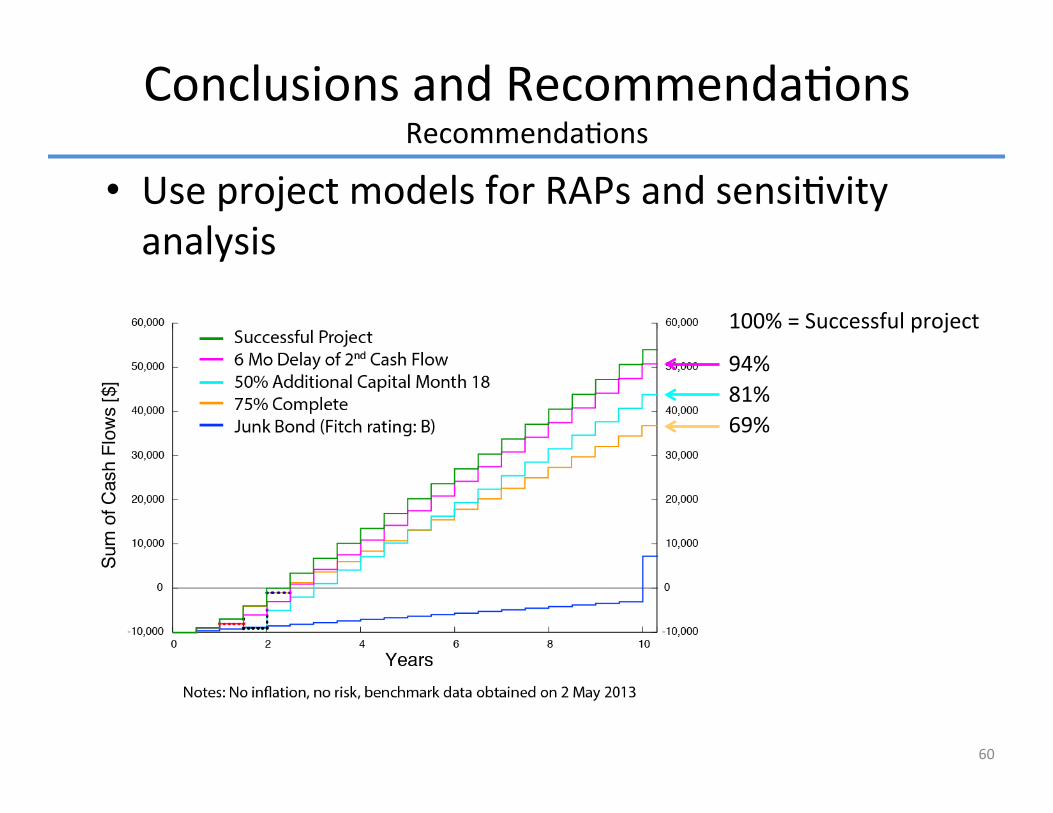
Use project models for RAPs and sensi�vity analysis
Conclusions and Recommenda�ons Recommenda�ons
100% = Successful project
94% 81% 69%
60
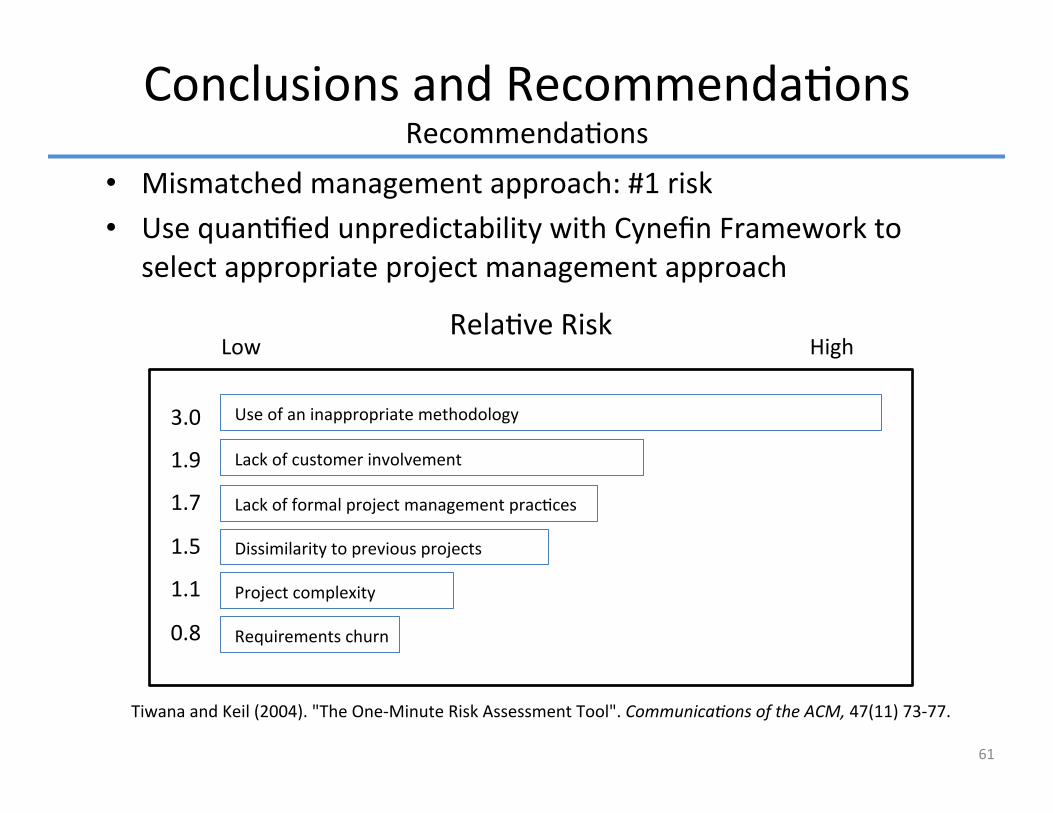
Mismatched management approach: #1 risk Use quan�fied unpredictability with Cynefin Framework to select appropriate project management approach
Conclusions and Recommenda�ons Recommenda�ons
3.0
1.9
1.7
1.5
1.1
0.8
Lack of customer involvement
Lack of formal project management prac�ces
Dissimilarity to previous projects
Project complexity
Requirements churn
Use of an inappropriate methodology
Rela�ve Risk High Low
Tiwana and Keil (2004). "The One-‐Minute Risk Assessment Tool". Communica�ons of the ACM, 47(11) 73-‐77.
61
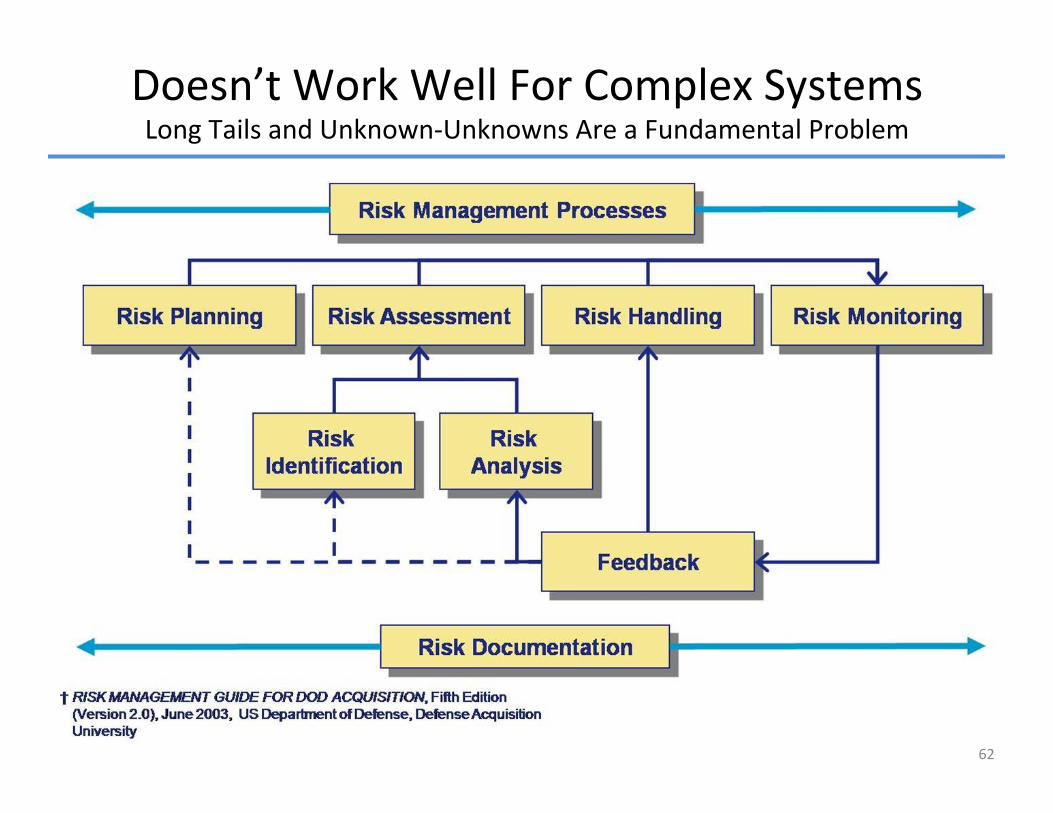
Doesn’t Work Well For Complex Systems Long Tails and Unknown-‐Unknowns Are a Fundamental Problem
62
12 Infamous Project Failures State of Texas partnered with IBM to consolidate data centers across the state
– See more at: h�p://www.baselinemag.com/c/a/IT-‐Management/Dirty-‐Dozen-‐Inside-‐12-‐IT-‐Disasters-‐874085/#sthash.jPXsasDn.dpuf
The ambi�ous plan to arm U.S. Census Bureau employees with handheld computers to compile and transmit 2010 census informa�on to headquarters was mostly scrapped a�er almost two years of work. $595 Million taxpayer loss.
– See more at: h�p://www.baselinemag.com/c/a/IT-‐Management/Dirty-‐Dozen-‐Inside-‐12-‐IT-‐Disasters-‐874085/#sthash.jPXsasDn.dpuf
A rocky ERP ini�a�ve by firetruck-‐maker American La France set off enough inventory problems at the company to cause shortages in parts and disrup�on in produc�on of new trucks. Out of business.
– See more at: h�p://www.baselinemag.com/c/a/IT-‐Management/Dirty-‐Dozen-‐Inside-‐12-‐IT-‐Disasters-‐874085/#sthash.jPXsasDn.dpuf
The Denver-‐based retail jewelry ou�it Shane Co. experienced such a troubled ERP upgrade that costs ballooned from an es�mated $10 million to over $36 million, causing major inventory problems in the process. Filed for Bankruptcy
See more at: h�p://www.baselinemag.com/c/a/IT-‐Management/Dirty-‐Dozen-‐Inside-‐12-‐IT-‐Disasters-‐874085/#sthash.jPXsasDn.dpuf
63
12 Infamous Project Failures Difficul�es merging commission-‐payment systems at Sprint and Nextel following
their merger prevented thousands of employees from being paid their cut of sales for years. Class ac�on lawsuit for $5 Million
– See more at: h�p://www.baselinemag.com/c/a/IT-‐Management/Dirty-‐Dozen-‐Inside-‐12-‐IT-‐Disasters-‐874085/#sthash.jPXsasDn.dpuf
A botched $95 million payroll system upgrade to SAP triggered errors on paychecks of thousands of LA Unified School District employees for months on end in 2007. More than $35 Million over budget + angry teachers
– See more at: h�p://www.baselinemag.com/c/a/IT-‐Management/Dirty-‐Dozen-‐Inside-‐12-‐IT-‐Disasters-‐874085/#sthash.jPXsasDn.dpuf
Hardware malfunc�ons in a decades-‐old core processing system at HSBC bank in August 2008 caused a close to a week of banking disrup�on for US-‐based customers. (Not too different than Knight Capital)
– See more at: h�p://www.baselinemag.com/c/a/IT-‐Management/Dirty-‐Dozen-‐Inside-‐12-‐IT-‐Disasters-‐874085/#sthash.jPXsasDn.dpuf
The London Stock Exchange went down for almost an en�re day on Sept. 8, 2008 due to network connec�vity issues associated with its computerized trading pla�orm. Brokers lost millions of pounds in commissions
– See more at: h�p://www.baselinemag.com/c/a/IT-‐Management/Dirty-‐Dozen-‐Inside-‐12-‐IT-‐Disasters-‐874085/#sthash.jPXsasDn.dpuf
64

12 Infamous Project Failures Poor informa�on management and system migra�on procedures at the Kaiser
Kidney Transplant Center delayed hundreds of pa�ents from receiving life-‐saving transplant surgeries. Less than two years a�er opening, Kaiser was forced to close its transplant center, amid a regulatory crackdown and exposure by a whistle-‐blowing former employee.
– See more at: h�p://www.baselinemag.com/c/a/IT-‐Management/Dirty-‐Dozen-‐Inside-‐12-‐IT-‐Disasters-‐874085/#sthash.jPXsasDn.dpuf
A so�ware calibra�on problem in 2005-‐2008 Ford Mustangs inflated airbags forcefully enough to cause serious injury to small females not wearing seatbelts. 500,000 vehicles recalled.
– See more at: h�p://www.baselinemag.com/c/a/IT-‐Management/Dirty-‐Dozen-‐Inside-‐12-‐IT-‐Disasters-‐874085/#sthash.jPXsasDn.dpuf
Inadequate security at the credit card processor Heartland Payment Systems allowed hackers to steal sensi�ve informa�on from more than 100 million credit card accounts. Faces sanc�ons & lawsuits for millions
– See more at: h�p://www.baselinemag.com/c/a/IT-‐Management/Dirty-‐Dozen-‐Inside-‐12-‐IT-‐Disasters-‐874085/#sthash.jPXsasDn.dpuf
The �cke�ng system built to handle public sales for the 2008 Summer Olympics broke two �mes in the run-‐up to the event. Dir of Tk�ng lost job
– See more at: h�p://www.baselinemag.com/c/a/IT-‐Management/Dirty-‐Dozen-‐Inside-‐12-‐IT-‐Disasters-‐874085/#sthash.jPXsasDn.dpuf
65
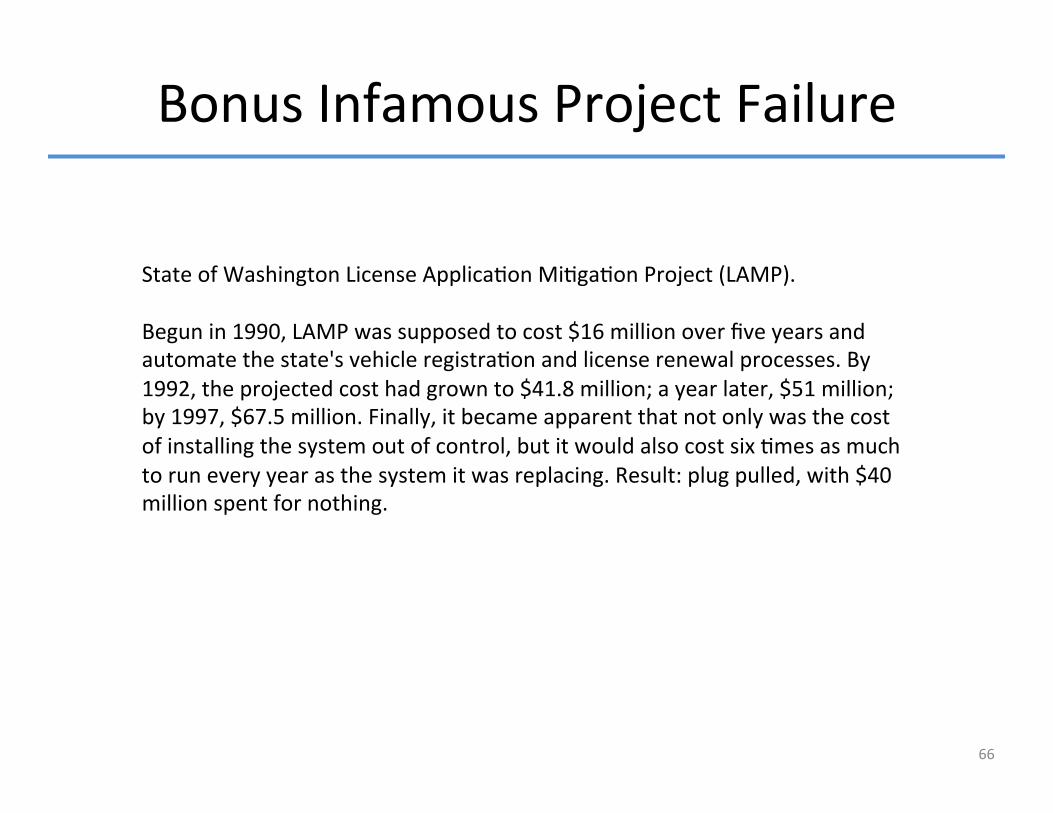
Bonus Infamous Project Failure
66
State of Washington License Applica�on Mi�ga�on Project (LAMP). Begun in 1990, LAMP was supposed to cost $16 million over five years and automate the state's vehicle registra�on and license renewal processes. By 1992, the projected cost had grown to $41.8 million; a year later, $51 million; by 1997, $67.5 million. Finally, it became apparent that not only was the cost of installing the system out of control, but it would also cost six �mes as much to run every year as the system it was replacing. Result: plug pulled, with $40 million spent for nothing.

Say “Good Knight” Loss: $10,000,000/Minute For 46 Minutes
Deployed new so�ware that woke up old tes�ng harness
67
Irony: Thomas Joyce, CEO – Vocal cri�c of Facebook public offering (May, 2012)
– Company trades delayed by NASDAQ for hours.
– Knight suffered $35.4 million in losses


![Junk Bonds & Bridge Loans Presentation[1]](https://img.pdfslide.net/doc/110x75/577d33f61a28ab3a6b8c38a6/junk-bonds-bridge-loans-presentation1.jpg)