Embed Size (px)
Citation preview

117
Just Who Should Pay for What? Vertical Equity, Transit Subsidy and Road Pricing
Just Who Should Pay for What? Vertical Equity, Transit Subsidy
and Road Pricing: The Case of New York City
Jonathan R. Peters, Ph.D. The College of Staten Island
Jonathan K. Kramer, Ph.D.
Kutztown University of Pennsylvania
Abstract
In this paper, equity and cross-subsidization issues associated with the congestion pricing scheme proposed as part of New York City’s PlaNYC are examined, as are initial usage patterns, user income distribution, and revenue distribution. We find that equity concerns surrounding the proposal are supported by economic analysis. If New York City is to revisit congestion pricing in the future and make it more politi-cally palatable, it will need to find a way to mitigate these equity concerns.
IntroductionGovernments at all levels across the United States are searching for new revenue sources to finance the maintenance, repair, and expansion of transportation infra-structure. Gasoline taxes have been the traditional source of funding for such work. However, as Puentes and Prince (2003) report, federal and state gas tax revenues have been decreasing when inflation is taken into consideration. With the public

Journal of Public Transportation, Vol. 15, No. 2, 2012
118
generally unreceptive to increases in taxes, road pricing has become an integral part of many of the proposals to fund transportation infrastructure. One high-profile example of this is the congestion pricing scheme proposed by the mayor of New York City (NYC) in the spring of 2007. As one part of a sweeping master plan to make the city “greener” and more livable (PlaNYC 2007), Mayor Bloomberg proposed the creation of a cordon pricing system similar to the one implemented in London in 2003. While the mayor’s proposal had a “burgeoning coalition of civic and business organizations in support of congestion pricing” (Schaller 2010, p. 267), the legislation failed to garner enough support in the State Assembly to come to a vote. Lacking this authorization, the proposed congestion pricing system could not be implemented. The reasons for the failure of the plan to gain enough political support to successfully pass through the legislative process have been well docu-mented by Schaller (2010) and Peters and Gordon (2009). One of the primary rea-sons cited for the failure of the plan to be implemented is related to social equity.
It is very difficult to accurately measure the equity implications of a proposed road pricing scheme because of the complexities of the transportation networks involved. This is especially true in New York City, where so many people are com-peting for a limited supply of routes into the Central Business District in Manhat-tan. It is also challenging to measure equity considerations because” … equity can be defined in many different and legitimate ways” (Ecola and Light 2009, p. 35). While other measures of equity are important—such as horizontal equity—in this paper, we focus on the vertical equity considerations of NYC’s proposed conges-tion pricing system. Vertical equity examines whether or not members of different income groups are treated differently. In a comprehensive review of why NYC’s congestion pricing scheme failed to gain enough support to be implemented, Schaller (2010) concludes that,
The short answer is that a relatively small group of users believed that con-gestion pricing was against their best interests. As with many large high-way construction projects in the 1970s and 1980s, the extensive approval process required for congestion pricing offered auto users an avenue to block action. The intensive interests of one group were thus able to over-come widespread public support (p. 270).
These concerns led to successful political obstruction “… motivated by individual-level impacts on auto users” (Schaller 2010, p. 270). The auto users referred to were primarily from the outer boroughs, particularly eastern Queens and southern Brooklyn (see Figure 1).
119
Just Who Should Pay for What? Vertical Equity, Transit Subsidy and Road Pricing
A key component of the proposed pricing scheme was that it would generate additional revenue (roughly $420 million per year) (TCMC 2008) to fund improve-ments in transportation infrastructure. This revenue was to be managed by a spe-cial agency called “A Smart Authority” that would allocate the money to selected regional transportation projects, including roads and mass transit. The Metropoli-tan Transportation Authority (MTA), the major mass transit provider, proposed eight major mass transit capital projects valued at $951 million for initial funding from Smart Authority resources (TCMC 2008). Since funds would be generated from users of one mode of travel/corridor and used to subsidize users of another mode and/or another corridor, it is important to examine both the equity and cross-subsidization issues of the proposal. In this paper, we use data from a variety of sources to examine the validity of the vertical equity concerns surrounding NYC’s proposed congestion pricing scheme.
Literature ReviewThe academic literature on equity and congestion pricing is voluminous and focuses much of its attention on how to measure equity and ways to remedy ineq-uities so that proposals can be implemented. (For three surveys of this literature, see Levinson [2010], Ecola and Light [2009], and TRB Special Report 303 [2011].) One impediment to implementing congestion pricing, especially in the United States, is that new proposals are generally subject to the legislative process. It is interesting to note that the most high-profile implementation of congestion pric-ing is London, and that proposal was not subject to legislative approval process (Schaller 2010). As a result of having to pass the legislative hurdle, a great deal of attention has been given to how to make congestion pricing politically palatable.
Goodwin (1990) was among the first to emphasize the importance of using effec-tive compensation schemes to overcome equity issues that fuel public/political resistance. The importance of effective compensation is now widely accepted in the literature. However, “Since so many factors determine the impacts of conges-tion pricing, revenue redistribution cannot solve all equity and fairness concerns” (Giuliano 1994, p. 275). Therefore, in addition to revenue redistribution, Oberhol-zer-Gee and Wech-Hannemann (2002) and Ison (1998) advocate focusing on the environmental goals of the program to motivate citizens to support the proposal.
Eliasson and Mattsson (2006) conclude that the two most important factors that determine equity impacts are how revenues will be used and initial travel patterns.

Journal of Public Transportation, Vol. 15, No. 2, 2012
120
That is, the people currently making most of the trips will be the ones most affected by any change. Once again, comparing London to New York City, London had virtu-ally no road tolls at the time of the implementation of its Congestion Pricing Scheme,1 whereas NYC has a mix of “free” and tolled bridges that “… has been imposed on a piecemeal basis without overall performance goals in mind” (Peters and Gordon 2009, p. 113). It is, therefore, important to study the characteristics of the current users of these facilities. This paper focuses specifically on users of the NYC facili-ties and their travel patterns and demographic characteristics to draw conclusions regarding the equity perceptions of the proposed congestion pricing scheme.
Ison (1998) recognized that the key issues surrounding any proposal ”… must be addressed at the local level if the policy is to be saleable” (p. 21). As Schaller (2010) notes, although there was broad support for NYC’s congestion pricing proposal, Democratic Assembly members from the outer boroughs were deeply skeptical that “… the MTA would use the funds to make the promised service improvements” (p. 269). As a result, “With strong opposition from most of its NYC members, Assembly Democrats blocked a vote …” (Schaller 2010, p. 269) and the proposal died. To over-come such local resistance King, Manville, and Shoup (2007) recommend redistribu-tion efforts that concentrate the benefits and create “strong advocates” for a pro-posal. They contend that congestion pricing schemes with concentrated benefits and widely-dispersed costs are more likely to succeed. In “Interim Report: An Inquiry into Congestion Pricing as Proposed in PlaNYC and S. 6068,” (Brodsky 2007), Assembly-man Brodsky concludes that “The Mayor’s congestion pricing proposal is a regressive tax whose burden is borne disproportionately by middle income New Yorkers, largely from the Bronx, Brooklyn, and Queens” (p. 10). This is consistent with Schaller’s (2010) observation that “… elected official support was strongest in Manhattan, the borough that is least auto-dependent…,” (p. 268) and that “the most vocal opposi-tion came from elected officials and civic groups in the four NYC boroughs outside Manhattan” (p. 269). NYC’s congestion pricing scheme was perceived to have a broad range of benefits defused over a large population of commuters (including those from other states) with the middle class from the outer boroughs footing the bill.
Eliasson and Mattsson (2006) point out that there are many theoretical studies regarding the issues surrounding congestion pricing but few studies that make a quantitative assessment of the issues involved. This paper helps fill this gap in the literature by examining some of the equity concerns surrounding NYC’s proposed congestion pricing scheme using economic data collected by the Triborough Bridge and Tunnel Authority (TBTA), the NYC Independent Budget Office (IBO),

121
Just Who Should Pay for What? Vertical Equity, Transit Subsidy and Road Pricing
New Jersey Transit, and Rutgers University. In particular, we examine the impact of initial travel patterns, user income distribution, and revenue distribution on the political salability of the NYC congestion pricing proposal.
Data CollectionThe TBTA—a.k.a. MTA Bridges & Tunnels—is the largest collector of tolls in the United States. In 2010, it collected $1.42 billion in tolls via 292 million transactions, with an average per vehicle fee of $4.86 (passenger vehicles and trucks combined) (URS 2011). Automobile users represent more than 90 percent of the total vehicles on its facilities (URS 2011).
In 2004, the TBTA conducted an origin-destination survey of its bridge and tunnel users. It typically conducts this type of survey every 8 to 10 years. In 2004, it distrib-uted 304,000 surveys at cash toll lanes and mailed surveys to 329,000 E-ZPass (the local electronic toll collection [ETC] system) customers. (See Spitz et al. [2007] for a further description of the data.) Through a Freedom of Information Act request, the raw survey data from the TBTA was obtained, which contains 61,201 observa-tions of passenger car usage on the 9 TBTA facilities in NYC.
Drivers from 44 states are represented in the data, but the vast majority of the tolls (97.2%) were collected from drivers from New York, New Jersey, and Connecticut. In addition, the data from the 2004 survey indicate that people living within 10 miles of a particular TBTA facility pay about one half of all of the tolls collected at that facility (Table 1). Almost two-thirds of all tolls are collected by users residing within 15 miles of the facility. This provides strong evidence that people who live near a facility are the primary users/toll payers of that facility. This is particularly important in the case of NYC, where regional equity concerns are an important issue.
The second set of data that we use in this study comes from the NYC IBO. In 2003, the IBO reported the results of its analysis of the 1998 New York Metropolitan Transportation Council’s Regional Travel–Household Interview Survey conducted by the regional metropolitan planning organizations (MPOs) on transit users and automobile users of the un-tolled Harlem and East River bridges (IBO Fiscal Brief 2003). The IBO study was conducted to determine how much revenue would be collected and who would pay, both in terms of place of residence and household income, if the City started tolling these “free” bridges. The study did not examine congestion pricing alternatives nor did it look at the effect of tolls on traffic. How-ever, the tolling of these “free” bridges became an integral part of NYC’s congestion

Journal of Public Transportation, Vol. 15, No. 2, 2012
122
pricing proposal in 2007 (in that the potential to toll these facilities was considered as an alternative to developing a pricing zone). Examining the data provided by this study alongside the data from TBTA’s origin-destination survey allowed us to develop a baseline profile of tolling in NYC prior to the proposed implementation of congestion pricing. This shed new light on why perceptions of regional inequity were so strong.
Table 1. Percent of Tolls Collected from Users Who Live Within 5, 10, and 15 Miles of a TBTA Facility
Facility* 5 miles (%) 10 miles (%) 15 miles (%)
Verrazano-Narrows Bridge 27.8 52.4 62.8Throgs Neck Bridge 13.5 38.9 54.9Triborough Manhattan Bridge 35.4 57.4 72.4Triborough Bronx Bridge 24.1 54.3 69.7Queens Midtown Tunnel 23.1 40.8 54.5Marine Parkway Bridge 65.3 85.2 93.9Henry Hudson Bridge 19.9 50.2 67Cross Bay Bridge 19.4 60.3 82.5Brooklyn Battery Tunnel 21.8 71.2 87.3Bronx Whitestone Bridge 18.7 44.7 60.6All Facilities 24.0 50.4 64.4
*See Figure 1 for facility locations
Data on other classes of commuters into the central business district also was examined, in particular, data on New Jersey-based commuter rail travelers (New Jersey Transit’s 2005 Rail User Origin-Destination Survey) and New Jersey-based toll bridge, tunnel, and highway users (Yanmaz-Tuzel et al. 2010). In both cases, it was found that the New Jersey-based commuter rail users and toll facility users exhibited characteristics very similar to those of users on the New York side of the metro region.
Bridges, Tunnels, and PlaNYCThe proposed congestion pricing zone for NYC was very similar in design to the London Congestion Charging Scheme launched in 2003. Similar to London, one of the cornerstones of NYC’s congestion pricing proposal was a daily fee ($8 in the case of NYC) for autos traveling into Manhattan (south of 86th Street) on weekdays between 6 a.m. and 6 p.m. However, unlike London, drivers would be given credits for tolls paid on bridges and tunnels in the city. Thus, according to the proposal,

123
Just Who Should Pay for What? Vertical Equity, Transit Subsidy and Road Pricing
at the then-existing toll rates, no driver would have paid more than $8 per day in fees to drive in the zone. From Figure 1, it is easy to speculate why this proposal caused serious regional equity concerns. As Schaller (2010) points out, “… New Jersey commuters would pay little or nothing in congestion fees (due to the toll offsets), while commuters from Queens, Brooklyn, and the Bronx who use the free bridges would pay the full $8 fee” (p. 269). Schaller (2010) also points out that regional equity concerns were “… amplified by outerborough residents’ and elected officials’ traditional resentment of Manhattan-based elites” (p. 269). Manhattan residents are the least reliant on automobile transportation and most likely to benefit from expanded public transportation. They would also benefit the most from the reduction of environmental externalities caused by automobile commut-ing into the central business district.
Figure 1. Proposed congestion pricing zone for New York City with free and toll facilities

Journal of Public Transportation, Vol. 15, No. 2, 2012
124
Initial Usage PatternsAs mentioned previously, Eliasson and Mattsson (2006) point to initial travel pat-terns as being very important for determining equity impacts because the people making most of the trips will be the ones most affected by any change. King et al. (2007) provide a succinct framework in which to measure congestion pricing’s win-ners and losers based on initial travel patterns:
Even before considering the use of the revenue, congestion pricing will create a net benefit for two groups because of improved traffic flow:
1. Drivers whose time saved is worth more than the tolls they pay.2. People who already use transit and will not pay tolls but will travel faster.
Again, before considering the use of the revenue, congestion pricing will create a net loss for three other groups:
3. Drivers whose time saved is worth less than the tolls they pay.4. Drivers who switch to a less convenient route to avoid the tolls.5. People on non-tolled routes whose traffic increases when drives from Group
4 switch to their roads. (p. 113)
While this framework ignores the impact of revenue distribution, we consider that in the next section.
In the case of NYC’s congestion pricing proposal, enough people perceived them-selves to be in categories 3–5 above to impede implementation. At the time of deliberation on the proposal, there was not a great deal of publicly-available quantitative analysis of “net gainers” and “net losers.” One exception was found in Brodsky (2007), who cited statistics based on the average citizen (not user) from Manhattan and the outer boroughs. He reports that the average person paying the congestion fee would pay approximately $2,000 per year in order to commute at an increased speed of 0.6 miles per hour within the zone (Brodsky 2007). This represents 4.2 percent of the annual income of a resident of the Bronx, Brooklyn, and Queens (Brodsky 2007), but only 2.5 percent of the annual income of a resident of Westchester or Manhattan. Thus, he found the congestion pricing scheme to be regressive in nature. Further, he states that even if lower-income people benefit disproportionately from improvements in mass transit funded by new revenue, “the revenues are largely raised from people of moderate income” (Brodsky 2007, p. 12). Many of these people would be “free” bridge users who the IBO (2003) also identifies as “… moderate-and middle-income suburbanites who are more likely to drive than take transit” (p. 1).

125
Just Who Should Pay for What? Vertical Equity, Transit Subsidy and Road Pricing
Extending Brodsky’s (2007) analysis, we are able to deduce the following regard-ing potential impacts on the average person. First, users of facilities that currently charge tolls would receive a daily credit towards the congestion fee equal to the tolls paid each day. In some cases (e.g., the Verrazano-Narrows Bridge serving Staten Island), these credits would completely offset the congestion fee. These individuals (those who currently use facilities with a net increase of zero in Table 2) would likely consider themselves in Category 1 of King et al.’s (2007) classification and, thus, net beneficiaries of the congestion pricing scheme.
Table 2. Hourly Cost of Time Savings Based on Initial Usage Patterns
Facility Congestion Fee
Round Trip Toll Credit (Cash toll)
Net Increase
Hourly Cost
Equivalent Annual Salary
(After-Tax)
No. of Bridges
Harlem River $8.00 $0.00 $8.00 $113.48 $236,046 9
East River $8.00 $0.00 $8.00 $113.48 $236,046 4
Cross Bay $8.00 $4.50 $3.50 $49.65 $103,270 1
Marine Parkway $8.00 $4.50 $3.50 $49.65 $103,270 1
Henry Hudson $8.00 $4.50 $3.50 $49.65 $103,270 1
Verrazano- Narrows $8.00 $9.00 $0 $0 $0 1
Triborough Bronx $8.00 $9.00 $0 $0 $0 1
Triborough Manhattan $8.00 $9.00 $0 $0 $0 1
Bronx Whitestone $8.00 $9.00 $0 $0 $0 1
Throgs Neck $8.00 $9.00 $0 $0 $0 1
Brooklyn Battery Tunnel $8.00 $9.00 $0 $0 $0 1
Queens Midtown Tunnel $8.00 $9.00 $0 $0 $0 1
Second, some users would receive only a partial or no offset of the congestion fee from tolls. Whether or not these individuals would realize a net benefit or net loss depends on the speed and length of their trip within the zone and the value of their time. To further understand the speed conditions in the proposed pricing zone, the new GPS tracking data from the NYC Taxi and Limousine Commission were used to estimate existing travel speeds and distances within the proposed zone.

Journal of Public Transportation, Vol. 15, No. 2, 2012
126
Based on a sample of 500,000 taxi trips in NYC in February 2010, we find that 101,187 of these trips both originated and terminated within the proposed zone during peak hours and that the average speed for taxis within the zone was 11.00305 mph. As an outer bound on distance, we assume that a person drives from one end of the zone to the other and back each day (15 miles). While this is unlikely to be the case, if individuals with such a lengthy commute (thus benefiting greatly from reduced congestion) consider themselves to be in Category 3 of King et al.’s (2007) classification, then almost all of those following the same route into the zone will as well. Table 2 shows that users receiving a partial offset from tolls would be paying $49.65 in after-tax dollars per hour of time savings. Those receiv-ing no offset would be paying $113.48 in after-tax dollars per hour of time savings. According to Brodsky (2007), the average before-tax income of someone from the Bronx, Brooklyn, and Queens is $23/hour. Thus, even with a very long commute within the zone and ignoring taxes, the average person commuting from the outer boroughs across the “free” bridges into Manhattan would consider themselves to be in Category 3.
The hourly savings of $49.65 and $113.48 roughly equate to annual after-tax salaries of $103,270 and $236,046, respectively. According to the IBO (2003) survey results, only 26 percent of NYC resident auto drivers who reported their income on the survey of “free” bridge users earn a before-tax income in excess of $100,000 per year. That means that even with a long commute in the zone (15 miles) and ignor-ing taxes, at least three-quarters of the NYC drivers using the “free” bridges would view themselves, before considering the benefits of distribution of the revenue, as net losers from the congestion pricing proposal.2
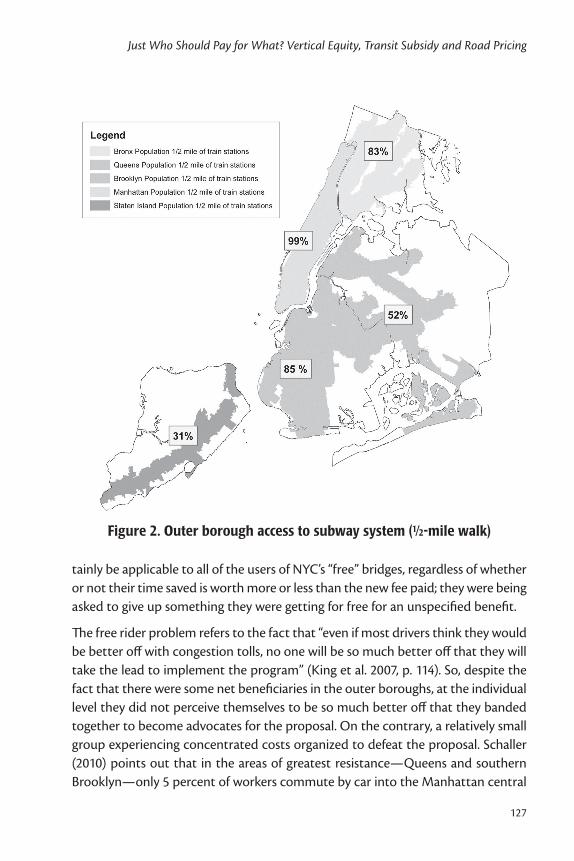
Since the outer boroughs are relatively underserved by mass transit3 relative to Manhattan (Figure 2), many current bridge users would also perceive themselves as falling into Category 4 (drivers who switch to a less convenient route to avoid the tolls). From these statistics, it is easy to understand why middle-class people from the outer boroughs currently served by “free” bridges were unlikely to be advocates of the NYC congestion pricing proposal. Most would perceive themselves in cat-egories 3–5 (net losers) of King et al.’s (2007) framework.
King et al. (2007) point out that the economic stumbling blocks cited above are compounded by the psychological considerations of loss aversion and the free rider problem. Loss aversion is “… the reluctance to part with a benefit one already has, and the tendency to view a new benefit-even one of equal or greater value-as less desirable than the one given up.” (King et al. 2007, p. 114). This would most cer-
127
Just Who Should Pay for What? Vertical Equity, Transit Subsidy and Road Pricing
tainly be applicable to all of the users of NYC’s “free” bridges, regardless of whether or not their time saved is worth more or less than the new fee paid; they were being asked to give up something they were getting for free for an unspecified benefit.
The free rider problem refers to the fact that “even if most drivers think they would be better off with congestion tolls, no one will be so much better off that they will take the lead to implement the program” (King et al. 2007, p. 114). So, despite the fact that there were some net beneficiaries in the outer boroughs, at the individual level they did not perceive themselves to be so much better off that they banded together to become advocates for the proposal. On the contrary, a relatively small group experiencing concentrated costs organized to defeat the proposal. Schaller (2010) points out that in the areas of greatest resistance—Queens and southern Brooklyn—only 5 percent of workers commute by car into the Manhattan central
Figure 2. Outer borough access to subway system (½-mile walk)

Journal of Public Transportation, Vol. 15, No. 2, 2012
128
business district. This ability of a small group to wield great influence is not entirely surprising since King et al. (2007) point out that small groups are actually easier to organize and, if organized properly, can outmaneuver large but poorly-organized groups of opponents. Therefore, in order to create strong advocates who will per-suade people of the need for congestion pricing, King et al. (2007) recommend concentrating benefits. However, as Schaller (2010) reports, opponents were skep-tical that “… the MTA would use the funds to make the promised service improve-ments” (p. 270). This skepticism, combined with the short amount of time available for public discussion and dissemination of the revenue distribution plan (October 2007–April 2008 [Gordon and Flanagan 2012]), made the free rider problem dif-ficult to overcome.
Facility Users vs. the Background PopulationIn this study, Lorenz curves and Gini coefficients were used to assess the vertical equity and cross-subsidization concerns relating to income. Lorenz curves provide a graphical representation of the extent of inequality between the actual distribu-tions of resources and perfect proportionality. Figure 3 shows the income profiles of the background populations within 15 miles of each TBTA facility. The straight line that extends from the origin represents proportional equity. Each Lorenz curve depicts the degree of income inequality of the background populations surround-ing each facility (within 15 miles of each facility). The further to the right that a Lorenz curve bows, the less equitable is the income distribution. Since NYC is a relatively concentrated area—27,012 people per square mile, 309 times the national average (U.S. Census 2010)—there is little difference in the demographic makeup of the background populations when measured in this way.
Figure 4 shows that the Lorenz curves for the users of the nine tolled TBTA facilities relative to the background population of each facility. Measured this way, signifi-cant differences between users and residents are observable. Gordon and Peters (2011) conclude that this occurs because income becomes a more important determinant of who uses a facility when untolled alternatives are available (e.g., Queens Midtown Tunnel), and that when there are no, or poor, alternatives (e.g., Verrazano-Narrows bridge), proximity to the facility becomes a more important determinant of usage. While general observations can be made by looking at Lorenz curves, Gini coefficients facilitate comparisons.

129
Just Who Should Pay for What? Vertical Equity, Transit Subsidy and Road Pricing
Figure 3. Income profiles of background populations
Figure 4. Income profiles of users of tolled TBTA bridges

Journal of Public Transportation, Vol. 15, No. 2, 2012
130
Gini coefficients are calculated by determining the area below the equity line and above the corresponding Lorenz curve. Using the sources listed above, Gini coeffi-cients were calculated based upon the reported income distributions for the “free” bridges, as well as New York transit users and New York and New Jersey commuter rail users. The resulting coefficients (and median incomes) are presented in Table 3. A Gini coefficient of 0 represents complete equity, whereas a coefficient of 1 represents complete inequity. Since the background characteristics of users are so similar (Figure 3), we are able to compare across facilities based on their individual Gini coefficients.
The Gini coefficients in Table 3 range from 0.2665 for NYC residents using public transportation to cross the Harlem River to 0.7952 for users of the Queens Mid-town Tunnel. The Gini coefficients for the U.S. and New York State are 0.4689 and 0.4985, respectively. Based on this analysis, we can further explore the relative impact of various pricing and subsidy proposals on different income groups. For example, NYC resident users of the “free” bridges are generally of more moderate income than users of the tolled facilities. These are the users who would be most significantly impacted by the proposed congestion pricing scheme since they cur-rently pay zero but would have to pay the full congestion fee without any toll offset. They are neither the highest nor lowest income cohort, but, as suggested by other studies, they are in the middle of the income distribution. They would either have to pay a fee that, as the previous example in this paper illustrates, is greater than their time saved or switch to a less convenient mode (mass transit) to avoid the fees. In both instances, they would be more likely to perceive themselves to be “net losers” as characterized by King et al.’s (2007) classification scheme and unlikely to support the congestion pricing proposal.
Revenue DistributionNumerous studies have pointed to the importance of the allocation of the toll revenue to making congestion pricing politically palatable. Santos and Rojey (2004) show that road pricing can be progressive, regressive, or neutral depending on where people live, where they work, and how they get to work. They also find “… that towns that suffer regressive impacts from a congestion charging scheme, could reverse the situation with an appropriate use of revenues” (Santos and Rojey 2004, p.38). The Gini coefficients in Table 3 support Brodsky’s (2007) contention that the congestion charge revenue would be raised largely from people of moderate income. It is less clear that allocating revenues to public transportation will make

131
Just Who Should Pay for What? Vertical Equity, Transit Subsidy and Road Pricing
Table 3. Gini Coefficients for All Bridges and Public Transit
Public Transit Users
NYC Resident Users
GINI Coeff.
GINIRank
MedianIncome
IncomeRank Agency
Harlem River 0.2665 1 $34,615 1 NYC Transit
East River 0.4033 2 $48,370 2 NYC Transit
Non-NYC Resident Users
Harlem River 0.6940 15 $98,750 16 Metro North
East River 0.6939 14 $100,001 17 LIRR
NJ Transit North Rail (Hudson River) 0.6951 16 $101,795 18 NJ Transit
“Free” Bridge/Tunnel Users
NYC Resident Drivers
Harlem River 0.5471 5 $63,000 4 NYC DOT
East River 0.4928 3 $56,731 3 NYC DOT
Non-NYC Resident Drivers
Harlem River 0.5826 6 $76,724 9 NYC DOT
East River 0.6122 7 $81,618 11 NYC DOT
Tolled Bridge/Tunnel Users
All Drivers
Cross Bay Bridge 0.5338 4 $65,275 5 TBTA
Verrazano-Narrows Bridge 0.6233 8 $72,369 6 TBTA
Marine Parkway Bridge 0.6357 9 $76,040 8 TBTA
Triborough Bridge Bronx 0.6550 10 $73,597 7 TBTA
Port Authority Tunnels 0.6668 11 $93,935 14Port Auth. of
NY & NJ
Bronx Whitestone Bridge 0.6719 12 $79,903 10 TBTA
Throgs Neck Bridge 0.6857 13 $85,701 12 TBTA
Brooklyn Battery Tunnel 0.7529 17 $91,689 13 TBTA
Triborough Bridge Manhattan 0.7677 18 $96,558 15 TBTA
Henry Hudson Bridge 0.7806 19 $110,765 20 TBTA
Queens Midtown Tunnel 0.7952 20 $106,713 19 TBTA

Journal of Public Transportation, Vol. 15, No. 2, 2012
132
the results less regressive. Net proceeds from road pricing activities are often allo-cated in some part to mass transit (NYC agencies currently allocate over 50 percent of existing road toll revenue to mass transit) for the purposes of improving the environment, reducing congestion, and making the proposal less regressive. While the first two of these arguments may be valid for the NYC congestion pricing pro-posal, the third does not seem to hold in all cases. Columns 3 and 5 of Table 3 rank the various systems that one can use to reach Manhattan based on their potential strength to reduce the regressivity of the proposal. The lower the number ranking, the greater the potential a particular route has to reduce the regressive nature of the proposal. As the rankings indicate, funding mass transit across the Harlem and East River bridge corridors for NYC residents would contribute significantly to the goal of making the scheme less regressive for NYC residents. However, this could be offset largely by the benefits to high-income, non-NYC residents who are entering the city via mass transit. As the IBO (2003) report points out: “City residents who drive across the free bridges have higher average incomes than city residents who enter Manhattan via subways and buses. In contrast, suburban residents who enter Manhattan by mass transit are generally more affluent than suburban drivers” (p. 1).
The data support the contention that revenue would be raised largely from NYC residents of moderate income. Without a detailed plan and commitment for rev-enue allocation, it is unclear whether the plan would ultimately be progressive, regressive, or neutral. Therefore, any revenue redistribution scheme would have to take into account the income disparities outlined in Table 3 if it hoped to build the kind of political support necessary for implementation.
ConclusionThe vertical equity impacts of congestion pricing schemes are largely dependent upon initial usage patterns, how the revenue raised is allocated, and environmen-tal impacts. Congestion pricing schemes with concentrated benefits and widely-dispersed costs are more likely to be implemented. The NYC congestion pricing proposal included in PlaNYC was perceived to concentrate the costs and disperse the benefits, which contributed to its failure to garner enough political support to be implemented. We show that these perceptions are supported by economic analysis of data from various sources. If NYC is to revisit congestion pricing in the future, it will need to find a way to spread out the costs and/or concentrate the benefits to those bearing significant burdens.
133
Just Who Should Pay for What? Vertical Equity, Transit Subsidy and Road Pricing
This paper also explores the complex question of cross-subsidization of mass tran-sit services. Pricing automobile travel and using the revenue to fund mass transit services can both encourage a reduction in automobile use and create a more equitable source of funding for mass transit. However, as the results of this study indicate, it is important to consider what route is priced as well as what transit system is going to be subsidized to evaluate the potential equity outcomes from a road pricing and transit subsidy program. In this case, subsidization from the East River and Harlem River bridge users to New York or New Jersey commuter rail sys-tems would result in a net reduction in the social equity.
With careful analysis, the potential exists to develop a pricing scheme that targets the burden of the tolls more heavily on facilities that have a preponderance of users who have high incomes. The fact that you can fine-tune prices to generate given amounts of revenue from a target base of users is one of the great advantages of road pricing. For example, by targeting facilities with higher-income users such as the Henry Hudson Bridge and using that revenue to subsidize transit services that serve mostly moderate-income users, such as MTA’s Subway service, the potential exists to cross-subsidize in a progressive way using road fees.
Existing and proposed taxation systems have varying ranges of progressivity or regressivity in terms of vertical equity. As such, a detailed analysis of any proposed pricing and subsidy program should be considered, and the environmental, traffic, and social equity measures can be examined and balanced to produce a more just, sustainable, and efficient system of pricing and operations.
Endnotes1 London had an extensive system of toll gates on major turnpikes in the 18th and 19th centuries. These were almost completely eliminated in favor of other revenue mechanisms in the late 19th century. One notable exception is the toll gate on the Dulwich Estate, which was established in 1789 and still operating today (how-ever, its function today is more to control traffic flow and is historic in nature, as opposed to a major revenue source). In addition, London City bridges are built and maintained by The City Bridge Trust, a public trust that dates to the 12th century. The Trust maintains these facilities without currently charging tolls, thanks to an endowment that was generated from tolls, real estate investments, and other funds.

Journal of Public Transportation, Vol. 15, No. 2, 2012
134
2 It is likely that time savings would be realized outside of the zone as well. The Report to the Traffic Congestion Mitigation Commission & Recommended Imple-mentation Plan (2008) includes estimates of VMT reduction by sub-region. How-ever, the estimated reductions in VMT outside of the zone are considerably smaller than inside the zone (6.7% reduction for Manhattan South of 86th St. vs. 1.9%, 2%, 1.5%, and 1.3% for the Bronx, Brooklyn, Queens, and Staten Island, respectively); it is not clear how much of this reduction in VMT would accrue to those actually paying the congestion fee.
3 We show the existing metro rail network as our primary measure of transit ser-vices. Commuting to the Zone from the outer boroughs represents a very long commute, and local bus service is less likely to be a good substitute for auto travel.
References
Brodsky, R. 2007. Interim report: An inquiry into congestion pricing as proposed in PlaNYC 2030 and S. 6068. New York: 1–20. Full text available at http://www.nytimes.com/packages/pdf/nyregion/city_room/20070409_BrodskyConges-tionReport.pdf.
City of New York. 2007. PlaNYC: A greener, greater New York. Full text avail-able at http://nytelecom.vo.llnwd.net/o15/agencies/planyc2030/pdf/full_report_2007.pdf.
Ecola, L., and T. Light. 2009. Equity and congestion pricing. Rand Corporation: 1–45.
Eliasson, J., and L. Mattsson. 2006. Equity effects of congestion pricing quantitative methodology and a case study for Stockholm. Transportation Research Part A 40(7): 602–620.
Giuliano, G. 1994. Equity and fairness considerations of congestion pricing. Trans-portation Research Board Special Report 242: 250–279.
Goodwin, P. 1990. How to Make Road Pricing Popular. Economic Affairs 10: 6–7.
Gordon, C., and R. Flanagan. 2012. The politics of urban congestion pricing: cau-tionary tales from New York. Washington, D.C.: Transportation Research Board Annual Meeting.
Gordon, C., and J. Peters. 2011. Measuring toll burdens: Applying Lorenz Curves to a detailed dataset of users of MTA bridges in New York City. Transportation Research Record (forthcoming).

135
Just Who Should Pay for What? Vertical Equity, Transit Subsidy and Road Pricing
Ison, S. 1998. The saleability of urban road pricing. Economic Affairs 18(4): 21–25.
King, D., M. Manville, and D. Shoup. 2007. The political calculus of congestion pric-ing. Transport Policy 14 (2): 111–123.
Levinson, D. 2010. Equity effects of road pricing: A review. Transport Reviews 30(1): 33–57.
New Jersey Transit. 2005. NJ TRANSIT Origin-Destination Survey 2005. NJTRANSIT Corporation, Newark, New Jersey.
New York City Independent Budget Office (IBO) Fiscal Brief. 2003. Bridge tolls: Who would pay? And how much? New York, NY. Full text available at http://www.ibo.nyc.ny.us/iboreports/bridgetolls.pdf.
Oberholzer-Gee, F., and H. Wech-Hannemann. 2002. Pricing road use: Politico-economic and fairness considerations. Transportation Research Part D 7(5): 357-371.
Peters, J., and C. Gordon. 2009. Results not guaranteed: A tale of road pricing in New York and London. Journal of Urban Technology 16(1): 113–131.
Puentes, R., and R. Prince. 2003. Fueling transportation finance: A primer on the gas tax. The Brookings Institution Series on Transportation Reform: 1–19.
Santos, G., and L. Rogey. 2004. Distributional impacts of road pricing: The truth behind the myth. Transportation 31(1): 21–42.
Schaller, B. 2010. New York City’s congestion pricing experience and implications for road pricing acceptance in the United States. Transport Policy 17: 266–273.
Spitz, G., J. Lobb, D. Jacobs, and W. Bennion. 2007. GIS Applications for origin-des-tination surveys. Presented at the 11th TRB National Transportation Planning Conference. May 6-10, Daytona Beach, Florida.
Traffic Congestion Mitigation Commission (TCMC). 2008. Report to the traffic congestion mitigation commission & recommended implementation plan. Albany, NY: New York State Department of Transportation. Full text available at https://www.dot.ny.gov/programs/repository/TCMC-Final-Report.pdf.
Traffic Congestion Mitigation Commission. 2008. Report to the Traffic Congestion Mitigation Commission & recommended implementation plan–Appendix d2–MTA report. Albany, NY: New York State Department of Transportation.

Journal of Public Transportation, Vol. 15, No. 2, 2012
136
Transportation Research Board. 2011. Special Report 303: Equity of evolving trans-portation finance mechanisms. Washington, DC: Transportation Research Board.
URS Corporation. 2011. History and projection of traffic, toll revenues and expenses and review of physical conditions of the facilities of the Triborough Bridge and Tunnel Authority. New York: Metropolitan Transit Authority. Full text available at http://www.mta.info/mta/investor/pdf/2011/APPENDIX%20E%202011%20URS%20REPORT.PDF.
U.S. Bureau of the Census. 2010. State and county quickfacts. http://quickfacts.census.gov/qfd/states/36/3651000.html (accessed Feb. 14, 2012).
Yanmaz-Tuzel O., K. Ozbay, and J. Holguin-Veras. 2010. Value of travel time estima-tion for PANYNJ and NJ Turnpike facilities via Hierarchical Bayesian Mixed Logit Approach. Transportation Research Record: Journal of the Transportation Research Board 2187: 85–96.
About the Authors
Jonathan R. Peters ([email protected]) is a professor of finance in the Business Department at The College of Staten Island of The City University of New York and a member of the Doctoral Faculty in the Ph.D. Program in Earth and Environmental Science and the Ph.D. Program in Economics at the CUNY Gradu-ate School. He is also a Research Fellow at the University Transportation Research Center at The City College of New York. He currently conducts research in the areas of regional planning, road and mass transit financing, corporate and public sector performance metrics, capital costs, and performance management.
Jonathan K. Kramer ([email protected]) is a professor of finance at Kutz-town University of Pennsylvania. His research interests include the shareholder wealth effects of strikes, the reliability of corporate performance metrics, and community bank CEO compensation.