Embed Size (px)
Citation preview

Time Event Estimate Date Act.vs. Est. S&P
8:30 Non Farm Payrolls 165 1/4 128 3.43
8:30 Unemployment Rate 3.9 1/4 0.2 3.43
8:30 Avg Hourly Earnings 0.3 1/4 0.1 3.43
8:30 Avg Weekly Hours 34.5 1/4 0.0 3.43
10:00 ISM Manufact. 54.0 1/3 -3.4 -2.48
10:00 Michigan Sentiment 90.7 1/18 -6.1 1.32
Last Report
Time Event Estimate Date Est Act. Diff. S&P Best Worst
8:30 ECI 0.8 10/31 0.7 0.8 0.1 1.09 Tech Util
8:30 Initial Claims 215 1/24 218 199 -2 0.14 Tech C St.
8:30 Continuing Claims 1720 1/24 1730 1713 -2 0.14 Tech C St.
9:45 Chicago PMI 61.5 12/28 60.2 65.4 -1.7 -0.12 C Disc Ener
10:30 EIA Natural Gas Inventories
Last Report
Upgrades
Ticker Firm From To
ES Goldman Neutral Buy
HP Merrill Neutral Buy
OSK Merrill Neutral Buy
PFE Credit Suisse Neutral Outperf
SMG JP Morgan Underwgt Neutral
TROW Evercore Inline Outperf
Downgrades
Ticker Firm From To
AGN Credit Suisse Outperf Neutral
HRB Goldman Neutral Sell
IVZ Barclays Overwgt Mkt Wgt
OUT Citigroup Buy Neutral
SITE RBC Capital Outperf Mkt Perf
USCR SunTrust Buy Hold
Initiations/Reiterations
Ticker Firm Action Rating
BABA Ray James Reiterated Outperf
BILI Citigroup Initiated Buy
ICPT Credit Suisse Initiated Outperf
NOW BMO Capital Reiterated Outperf
WDAY Wlm Blair Reiterated Outperf
WYNN Telsey Reiterated Mkt Perf
- Gold Rallies to Highest Level Since Last May.
- US equity Futures Modestly Lower Following Wednesday FOMC Rally.
- Trump Will Reportedly Meet With China's Xi in Late February.
h 1.1 %
h 0.3
i -0.1
h 0.5
Oil 54.16 i -$0.1
Gold 1322.8 h $12.9
$/Euro 0.870 i 0.00
$/Yen 108.66 i -0.4
10-Yr 2.67 i -0.01
Japan
China
Germany
UK
Trading Up ($):
AMZN (33.07), CHTR (21.43), FB (17.21), NOW (16.5), WDAY (8.18), MLNX (5.66)
Trading Down ($):
TSLA (-13.27), RTN (-5.46), DWDP (-5.27), NOC (-4.82), PYPL (-4.19), DATA (-4.17)-0.10
0.00
0.10
0.20
0.30
0.40
0.50
0.60
0.70
0.80
0.90
16:00 18:00 20:00 22:00 0:00 2:00 4:00 6:00
Pe
rce
nt
Ch
ange
Asia Opens
Europe Opens
Today’s Events
Stock Specific News of Note
Noteworthy Macro EventsOther MarketsOvernight Trading
Tomorrow
Overnight Trading
Analyst Actions
Indicators/EventsMarket Timing Model
© Copyright 2019, Bespoke Investment Group, LLC. The information herein was obtained fromsources which Bespoke Investment Group, LLC believes to be reliable, but we do not guarantee itsaccuracy. Neither the information, nor any opinions expressed, constitute a solicitation of thepurchase or sale of any securities or related instruments. Bespoke Investment Group, LLC is notresponsible for any losses incurred from any use of this information.
Earnings Reports
Ticker Date TOD EPS Revs.
AON 2/1/19 AM 2.13 2820
BAH 2/1/19 AM 0.59 1604
CI 2/1/19 AM 2.49 11384
CVX 2/1/19 AM 1.88 43552
D 2/1/19 AM 0.92 3273
HON 2/1/19 AM 1.89 9731
ITW 2/1/19 AM 1.82 3615
JCI 2/1/19 AM 0.25 5476
LYB 2/1/19 AM 2.30 9593
MRK 2/1/19 AM 1.03 10930
SF 2/1/19 AM 1.47 766
WY 2/1/19 AM 0.12 1711
XOM 2/1/19 AM 1.09 78939
ZBH 2/1/19 AM 2.17 2062
Estimate
9:45 Fed's Kaplan Speaks in Austin
13:00 Baker Hughes Rig Count
All day Total Vehicle Sales (17.2 mln est)
Conferences & Meetings
Economic Indicators & Events
Dividends & Splits
CZR Will replace DRQ in the S&P 400 effective 2/4.
DRQ Will replace ESND in the S&P 600 effective 2/4.
CONN Will replace ESIO in the S&P 600 effective 2/4.
Index Changes
PGR 2.51 WABC 0.40
NSC 0.86 SXT 0.36
C 0.45 PETS 0.27
BespokePremium.com
For Personal Use Only—Do Not Forward1
Ticker News
ABC Beat EPS forecasts by 9 cents (1.60 vs 1.51) on stronger revenues; raised guidance.
BC Beat EPS forecasts by 8 cents (0.98 vs 0.90) on inline revenues; lowered guidance.
BLL Missed EPS forecasts by 1 cent (0.55 vs 0.56) on stronger revenues.
DWDP Beat EPS forecasts by 1 cent (0.88 vs 0.87) on weaker revenues; lowered guidance.
FB Beat EPS forecasts by 20 cents (2.38 vs 2.18) on stronger revenues; MAUs higher than expected.
GE Missed EPS forecasts by 5 cents (0.17 vs 0.22) on stronger revenues.
MA Beat EPS forecasts by 3 cents (1.55 vs 1.52) on inline revenues.
MDC Missed EPS forecasts by 19 cents (0.95 vs 1.14) on stronger revenues.
MDLZ Reported inline EPS (0.63) on inline revenues.
MSFT Beat EPS forecasts by 1 cent (1.10 vs 1.09) on stronger revenues; lowered sales guidance.
MTH Beat EPS forecasts by 39 cents (1.91 vs 1.52) on stronger revenues.
NOC Beat EPS forecasts by 48 cents (4.93 vs 4.45) on inline revenues; lowered guidance.
NOW Beat EPS forecasts by 14 cents (0.77 vs 0.63) on inline revenues.
PYPL Beat EPS forecasts by 2 cents (0.69 vs 0.67) on inline revenues; guided inline to lower.
QCOM Beat EPS forecasts by 11 cents (1.20 vs 1.09) on inline revenues; guided to high end of range.
SHW Missed EPS forecasts by 1 cent (3.54 vs 3.55) on inline revenues; lowered guidance.
TSLA Missed EPS forecasts by 9 cents (1.93 vs 2.02) on stronger revenues.
UPS Beat EPS forecasts by 3 cents (1.94 vs 1.91) on inline revenues; lowered guidance.
V Beat EPS forecasts by 5 cents (1.30 vs 1.25) on stronger revenues; reaffirmed guidance.
WYNN Missed EPS forecasts by 29 cents (1.06 vs 1.35) on stronger revenues.
Bearish Bullish
Category One Week Two Weeks One Month
Sentiment 0.05 0.29 0.41
Technicals 0.04 0.18 0.40
Fundamental 0.13 0.13 0.46
Overall 0.05 0.18 0.42
Average (all days) 0.13 0.13 0.13
Expected S&P 500 Return (%)
Neutral
-0.15
-0.10
-0.05
0.00
0.05
0.10
0.15
Jan-18 Mar-18 May-18 Jul-18 Sep-18 Nov-18 Jan-19
Bonds Outperforming Stocks
Stocks Outperforming Bonds
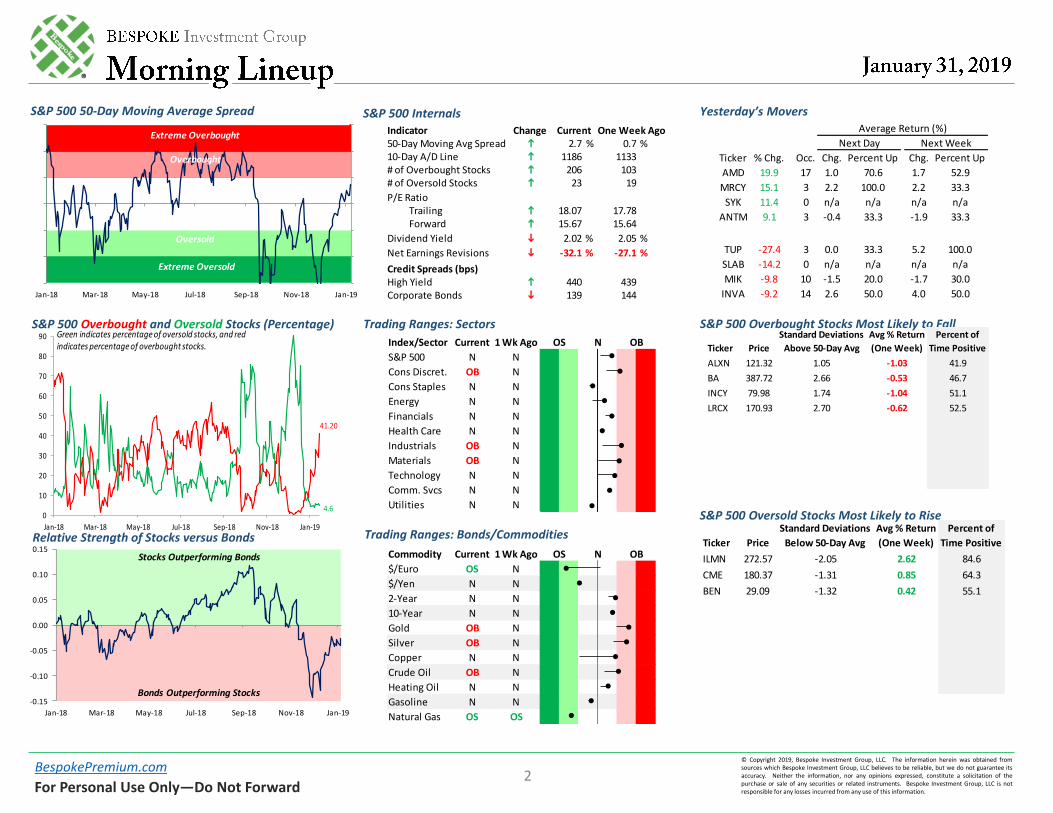
Ticker % Chg. Occ. Chg. Percent Up Chg. Percent Up
AMD 19.9 17 1.0 70.6 1.7 52.9
MRCY 15.1 3 2.2 100.0 2.2 33.3
SYK 11.4 0 n/a n/a n/a n/a
ANTM 9.1 3 -0.4 33.3 -1.9 33.3
IRDM
TUP -27.4 3 0.0 33.3 5.2 100.0
SLAB -14.2 0 n/a n/a n/a n/a
MIK -9.8 10 -1.5 20.0 -1.7 30.0
INVA -9.2 14 2.6 50.0 4.0 50.0
Average Return (%)
Next Day Next Week
Index/Sector Current 1 Wk Ago
S&P 500 N N
Cons Discret. OB N
Cons Staples N N
Energy N N
Financials N N
Health Care N N
Industrials OB N
Materials OB N
Technology N N
Comm. Svcs N N
Utilities N N
OS N OB
S&P 500 50-Day Moving Average Spread S&P 500 Internals Yesterday’s Movers
Relative Strength of Stocks versus Bonds
S&P 500 Overbought and Oversold Stocks (Percentage) Trading Ranges: Sectors
Trading Ranges: Bonds/Commodities
S&P 500 Overbought Stocks Most Likely to Fall
S&P 500 Oversold Stocks Most Likely to Rise
Jan-18 Mar-18 May-18 Jul-18 Sep-18 Nov-18 Jan-19
Extreme Overbought
Overbought
Oversold
Extreme Oversold
4.6
41.20
0
10
20
30
40
50
60
70
80
90
Jan-18 Mar-18 May-18 Jul-18 Sep-18 Nov-18 Jan-19
Green indicates percentage of oversold stocks, and red indicates percentage of overbought stocks.
Commodity Current 1 Wk Ago
$/Euro OS N
$/Yen N N
2-Year N N
10-Year N N
Gold OB N
Silver OB N
Copper N N
Crude Oil OB N
Heating Oil N N
Gasoline N N
Natural Gas OS OS
OS N OB
Indicator Change50-Day Moving Avg Spread h 2.7 % 0.7 %10-Day A/D Line h 1186 1133# of Overbought Stocks h 206 103# of Oversold Stocks h 23 19
P/E Ratio Trailing h 18.07 17.78 Forward h 15.67 15.64
Dividend Yield i 2.02 % 2.05 %
Net Earnings Revisions i -32.1 % -27.1 %
Credit Spreads (bps)High Yield h 440 439Corporate Bonds i 139 144
Current One Week Ago
© Copyright 2019, Bespoke Investment Group, LLC. The information herein was obtained fromsources which Bespoke Investment Group, LLC believes to be reliable, but we do not guarantee itsaccuracy. Neither the information, nor any opinions expressed, constitute a solicitation of thepurchase or sale of any securities or related instruments. Bespoke Investment Group, LLC is notresponsible for any losses incurred from any use of this information.
BespokePremium.com
For Personal Use Only—Do Not Forward2
Ticker Price
ALXN 121.32 1.05 -1.03 41.9
BA 387.72 2.66 -0.53 46.7
INCY 79.98 1.74 -1.04 51.1
LRCX 170.93 2.70 -0.62 52.5
Standard Deviations
Above 50-Day Avg
Avg % Return
(One Week)
Percent of
Time Positive
Ticker Price
ILMN 272.57 -2.05 2.62 84.6
CME 180.37 -1.31 0.85 64.3
BEN 29.09 -1.32 0.42 55.1
Standard Deviations
Below 50-Day Avg
Avg % Return
(One Week)
Percent of
Time Positive

Gold Future: Last Six Months
Gold Front Month Future: Last 15 Trading Days
1150
1170
1190
1210
1230
1250
1270
1290
1310
1330
1350
7/31 8/28 9/26 10/24 11/21 12/20 1/22
1150
1170
1190
1210
1230
1250
1270
1290
1310
1330
1350
7/31 8/28 9/26 10/24 11/21 12/20 1/22
1282
1292
1302
1312
1322
1332
1/9 1/11 1/15 1/17 1/22 1/24 1/28 1/30
200-DMA: 1256
50-DMA: 1270
1324
S&P 500: Last Six Months
S&P 500: Last 15 Trading Days
2300
2400
2500
2600
2700
2800
2900
3000
7/30 8/27 9/25 10/23 11/20 12/20 1/22
2300
2400
2500
2600
2700
2800
2900
3000
7/30 8/27 9/25 10/23 11/20 12/20 1/22
2555
2575
2595
2615
2635
2655
2675
2695
1/9 1/11 1/15 1/17 1/22 1/24 1/28 1/30
200-DMA: 2741
50-DMA: 2610
2681
Russell 2000: Last Six Months
Russell 2000: Last 15 Trading Days
1250
1350
1450
1550
1650
1750
7/30 8/27 9/25 10/23 11/20 12/20 1/22
200-DMA: 1590
1420
1440
1460
1480
1500
1/9 1/11 1/15 1/17 1/22 1/24 1/28 1/30
50-DMA: 1437
1487
Nasdaq Composite: Last Six Months
Nasdaq Composite: Last 15 Trading Days
6150
6450
6750
7050
7350
7650
7950
8250
7/30 8/27 9/25 10/23 11/20 12/20 1/22
6100
6400
6700
7000
7300
7600
7900
8200
7/30 8/27 9/25 10/23 11/20 12/20 1/22
50-DMA: 6944
200-DMA: 7453
6850
6950
7050
7150
7250
1/9 1/11 1/15 1/17 1/22 1/24 1/28 1/30
7183
Oil Future: Last Six Months
Oil Future: Last 15 Trading Days
7/31 8/28 9/26 10/24 11/21 12/20 1/22
41.5
45.5
49.5
53.5
57.5
61.5
65.5
69.5
73.5
77.5
7/31 8/28 9/26 10/24 11/21 12/20 1/22
200-DMA: 64
50.3
51.3
52.3
53.3
54.3
55.3
1/9 1/11 1/15 1/17 1/22 1/24 1/28 1/30
50-DMA: 51
54
BBG US Dollar Index: Last Six Months
BBG US Dollar Index: Last 15 Trading Days
1150
1160
1170
1180
1190
1200
1210
1220
8/7 9/4 10/2 10/30 11/27 12/25 1/22
1150
1160
1170
1180
1190
1200
1210
1220
8/7 9/4 10/2 10/30 11/27 12/25 1/22
50-DMA: 1198
200-DMA: 1186
1176
1180
1184
1188
1192
1196
1/10 1/14 1/16 1/18 1/22 1/24 1/28 1/30
1180
© Copyright 2019, Bespoke Investment Group, LLC. The information herein was obtained fromsources which Bespoke Investment Group, LLC believes to be reliable, but we do not guarantee itsaccuracy. Neither the information, nor any opinions expressed, constitute a solicitation of thepurchase or sale of any securities or related instruments. Bespoke Investment Group, LLC is notresponsible for any losses incurred from any use of this information.
BespokePremium.com
For Personal Use Only—Do Not Forward3
DJ Transports: Last Six Months
DJ Transports: Last 15 Trading Days
8400
8900
9400
9900
10400
10900
11400
11900
7/30 8/27 9/25 10/23 11/20 12/20 1/22
8400
8900
9400
9900
10400
10900
11400
11900
7/30 8/27 9/25 10/23 11/20 12/20 1/22
200-DMA: 10574
9350
9550
9750
9950
10150
1/9 1/11 1/15 1/17 1/22 1/24 1/28 1/30
50-DMA: 9800
10079
Long Bond Future: Last Six Months
Long Bond Future Intraday: Last 15 Trading Days
134
136
138
140
142
144
146
148
150
8/2 8/30 9/28 10/26 11/26 12/26 1/25
134
136
138
140
142
144
146
148
150
8/2 8/30 9/28 10/26 11/26 12/26 1/25
200-DMA: 142
144.0
144.5
145.0
145.5
146.0
146.5
1/9 1/11 1/15 1/17 1/22 1/24 1/28 1/30
50-DMA: 144
146

For Personal Use Only—Do Not Forward
BespokePremium.com © Copyright 2019, Bespoke Investment Group, LLC. The information herein was obtained from
sources which Bespoke Investment Group, LLC believes to be reliable, but we do not guarantee its
accuracy. Neither the information, nor any opinions expressed, constitute a solicitation of the
purchase or sale of any securities or related instruments. Bespoke Investment Group, LLC is not
responsible for any losses incurred from any use of this information.
4
Overview: US equity markets are up about 20 bps headed into the open, though it should be noted
that thanks to some negative data from Europe the market is off overnight highs. The dollar is at four
month lows, UST rates continue to fall, curves are still steepening, but 2s10s has run up against re-
sistance. Commodity prices are mostly higher, while credit spreads are plunging both in the US and
Europe in response to yesterday’s dovish Fed. Gold continues to run and run hard, up four days in a
row for a total gain of 3.34%, the best since the yellow metal’s post-Brexit rally.
Yesterday, the BEA announced a partial timeline for economic data delayed by the shutdown; you can
view BEA’s here and the Census one here. It will probably be awhile before all the data is back to its
normal schedule. In the meantime, US data today includes ECI at 8:30, new home sales for November
at 10:00 AM, jobless claims (8:30), and Chicago PMI (9:45). Economic scorecard.
APAC Markets: Markets
roared higher in response to
the extremely dovish pivot by
the Fed, led by H-shares
(+1.3%) and India (+1.9%). A-
shares and Indonesia were
also up over 1%. In FX, virtual-
ly everything is up versus USD.
While AUD and NZD have the
biggest moves versus the dol-
lar since Tuesday’s close
(+1.7% and +1.2%), EM cross-
es have really broken out. In
addition, Chinese yuan is in
full blown rally mode with
USDCNH crashing below its
200-DMA in dramatic fashion
during the day yesterday.
Europe Markets: European
indices are less ecstatic this
morning than in the US with
Italy’s FTSE MIB down almost
half a percent on very large
volumes (more than double typical for this time of the session). The source of angst is Q4 GDP, which
showed the economy in recession. We’ll discuss European GDP more in the subsequent pages, but
suffice to say Italy remains a shockingly terrible grower relative to other Eurozone economies. Rates
are mostly unchanged, EURUSD is up for a 5th day running, but credit is rallying dramatically, with
iTraxx Xover (high yield) down over 12 bps in spread today thanks to the dovish Fed yesterday. It’s hard
to worry about Europe too much with that kind of credit price action!
Morning Commentary
USDCNH: Past Year
6.20
6.30
6.40
6.50
6.60
6.70
6.80
6.90
7.00
200-DMA
50-DMA
Bespoke EMFX Index (Spot)
58
60
62
64
66
68
70Equal-weight CLP, ZAR, BRL, COP, RUB, PHP,
PEN, ARS, IDR, MYR, MXN, TWD, INR, SGD, CNH, KRW, CZK, PLN, HUF, and TRY

For Personal Use Only—Do Not Forward
BespokePremium.com © Copyright 2019, Bespoke Investment Group, LLC. The information herein was obtained from
sources which Bespoke Investment Group, LLC believes to be reliable, but we do not guarantee its
accuracy. Neither the information, nor any opinions expressed, constitute a solicitation of the
purchase or sale of any securities or related instruments. Bespoke Investment Group, LLC is not
responsible for any losses incurred from any use of this information.
5
Global Data: Similar to last
night, there was a huge swath of
global data released overnight
that we will recap at length this
morning.
South Korea Leading Indicators:
For the last seven months
(ending in December), leading
indicators in South Korea have
dropped sequentially, the worst
such run since the 13 months
ended January of 2009. While a
better coincident than leading
indicator in our view, this series
has been unhappy for a long
time and continues to suggest
weak growth in Korea.
South Korea IP: Industrial pro-
duction missed by a wide margin
in South Korea with a 1.4% drop
rather than the 0.2% forecast;
manufacturing was down 1.8%
MoM in December, the worst
since September’s 2.3% drop.
The only good news—if you can
call it that—is that capacity has
been declining of late, reducing
slack as output continues its
sluggish climb higher.
Italian Sentiment: Japanese in-
dustrial production numbers
actually beat (along with hous-
ing starts) but still dropped on
the month. As shown at left, the
current sluggish pace of manu-
facturing production growth is
pretty consistent with surveys.
Morning Commentary
South Korea: Leading Indicators At New Lows Despite Q4 GDP
South Korea: Manufacturing Output Slows Once Again
Japanese Manufacturing Also Slow, As Tankan Suggests
-4
-2
0
2
4
6
8
10
12
14
16
-5
0
5
10
15
20
South Korea Leading Index YoY
South Korea GDP YoY
80
100
120
140
160
180
200
220
240
260
Production (1999 Avg = 100)
Capacity (1999 Avg = 100)
80
85
90
95
100
105
-70
-60
-50
-40
-30
-20
-10
0
10
20
30
Tankan Business Conditions - LargeManufacturing
Japan Industrial Production(Manufacturing)

For Personal Use Only—Do Not Forward
BespokePremium.com © Copyright 2019, Bespoke Investment Group, LLC. The information herein was obtained from
sources which Bespoke Investment Group, LLC believes to be reliable, but we do not guarantee its
accuracy. Neither the information, nor any opinions expressed, constitute a solicitation of the
purchase or sale of any securities or related instruments. Bespoke Investment Group, LLC is not
responsible for any losses incurred from any use of this information.
6
China PMI: Shifting gears to
Chinese PMI, both manufactur-
ing and Services PMIs beat ex-
pectations and rose this month.
For manufacturing PMIs in Chi-
na, new export orders have
been a huge drag in the recent
deceleration. As shown at right,
in December new export orders
were reported to be shrinking
at roughly the same pace as Q1
of ‘16 when they bottomed.
Recent reports have showed a
bottoming process may be play-
ing out; MoM new export or-
ders were the most improved
versus last month since May.
Other indicators like output
also ticked up.
For right now, it’s hard to get
too excited about PMI data
from China but it at least gives
hopes that “green shoots” may
start sprouting in that part of
the global economy again soon.
For now, the rapid slowing of
Chinese profits is confirmation
that PMIs are still in tough
shape, although definitely not
in the same kind of trouble they
were in 2015-2016.
Finally, we note that while
manufacturing PMI has deterio-
rated a lot, Services has held up
much better. The result is a big
outperformance of Services
over Manufacturing, the big-
gest in more than half a decade
in fact.
Morning Commentary
China: Man'f PMI New Export Orders Improve Most Since May
China: Back To 2015 Territory And Slowing Further
China: At Least Services Is Outperforming (By A Lot!)
44
46
48
50
52
54
56
58
60
62Manufacturing Total, 49.5Output, 50.9New Orders, 49.6New Export Orders, 46.9Employment, 47.8
-15
-10
-5
0
5
10
15
20
25
30
35
48
49
50
51
52
53
54 China Manufacturing PMI
China Industrial Profits Cum. YoY
-2
0
2
4
6
8
10
12
14
China Services PMI - ChinaManufacturing PMI

For Personal Use Only—Do Not Forward
BespokePremium.com © Copyright 2019, Bespoke Investment Group, LLC. The information herein was obtained from
sources which Bespoke Investment Group, LLC believes to be reliable, but we do not guarantee its
accuracy. Neither the information, nor any opinions expressed, constitute a solicitation of the
purchase or sale of any securities or related instruments. Bespoke Investment Group, LLC is not
responsible for any losses incurred from any use of this information.
7
Eurozone GDPs: Yesterday,
French GDP beat estimates.
Today, it was the turn of Spain,
where growth picked up to
0.7% QoQ. As shown at left, of
the “core four” Eurozone econ-
omies which account for 80% of
the bloc’s output, only Italian
GDP has worsened sequentially.
Italy’s GDP is now down a sec-
ond quarter in a row, making it
three recessions (by that com-
mon definition) since the global
financial crisis.
At least the rest of the Euro-
zone is in better shape. In the
chart at left we show QoQ
growth rates by economy re-
ported so far, along with an
implied growth rate for the
46.2% of the zone by output
that has not yet reported
growth for Q4. Of that remain-
ing chunk, about two-thirds is
Germany. Given that, it’s un-
likely German growth was neg-
ative again in Q4 after a brutal
Q3 where it even lagged Italy!
Eurozone Labor: Italy, Germa-
ny, and the broad Eurozone all
released December unemploy-
ment data today, and while the
German methodology differs
from the other two, we can say
all three show ongoing im-
provement in labor markets
even as growth has slowed at
the margin over the last two
quarters.
Morning Commentary
Italian Recession, Germany Likely Grew In Q4
Eurozone GDP Growth QoQ (%)
December Labor Data Shows Nothing But Good News In EZ
-2
-1
0
1
2
3
4
5 FranceSpainItalyEurozoneGermany
0.30.2
1.1
1.6
0.3
0.7
-0.2
0.20.1
-0.4
-0.2
0.0
0.2
0.4
0.6
0.8
1.0
1.2
1.4
1.6
1.853.8% of EZ total output already
reported, Germany is 63.3% of remaining.
4
5
6
7
8
9
10
11
12
13
14 Italy ILO Unemployment (Prelim)Germany Unemployment Claims RateEurozone ILO Unemployment

For Personal Use Only—Do Not Forward
BespokePremium.com © Copyright 2019, Bespoke Investment Group, LLC. The information herein was obtained from
sources which Bespoke Investment Group, LLC believes to be reliable, but we do not guarantee its
accuracy. Neither the information, nor any opinions expressed, constitute a solicitation of the
purchase or sale of any securities or related instruments. Bespoke Investment Group, LLC is not
responsible for any losses incurred from any use of this information.
8
Standout Spain: Despite a
weakening of the backdrop
across the Eurozone, Spain’s
GDP growth has not fallen out
of the bottom of its 2.2%-3.9%
QoQ SAAR growth range of the
past few years. We note that
range tracks pretty well to the
range the Spanish economy oc-
cupied during the “boom” years
of the 2000s when investment
exploded thanks to massive cap-
ital inflows. This time, though,
Spanish growth looks much
more sustainable.
As shown at right, the huge and
growing current account deficits
of the 2000s (representing the
mirror image of capital inflows)
have disappeared, with the cur-
rent account running a persis-
tent but small surplus since
2013. That surplus has dropped
recently, but even still looks to-
tally reasonable and nothing like
the imbalances of the 2000s.
Tourism growth has been una-
ble to accelerate over the past
year after surging from 2013
onward. That, along with higher
oil prices and slower global de-
mand overall are an explanation
of the weaker Spanish current
account surplus over the last
few quarters. If tourism returns
to growth, so will Spanish cur-
rent account surpluses but at
worst small deficits are not a
significant concern.
Morning Commentary
Spain's Economy Much More Balanced Than During 2000s Boom
Source of Current Account Downtick: Tourism Growth Stops
Spain: Growth In-Line With 2000s, Sustainably This Time
-12
-10
-8
-6
-4
-2
0
2
4
Spain Current Account(bn EUR, SA byBespoke)
3.0
3.5
4.0
4.5
5.0
5.5
6.0
6.5
7.0
Tourist Arrivals (mmpersons, SA byBespoke)
-8
-6
-4
-2
0
2
4
6
8
Spain GDP QoQ SAAR

For Personal Use Only—Do Not Forward
BespokePremium.com © Copyright 2019, Bespoke Investment Group, LLC. The information herein was obtained from
sources which Bespoke Investment Group, LLC believes to be reliable, but we do not guarantee its
accuracy. Neither the information, nor any opinions expressed, constitute a solicitation of the
purchase or sale of any securities or related instruments. Bespoke Investment Group, LLC is not
responsible for any losses incurred from any use of this information.
9
US Earnings: Facebook (FB) shook off privacy concerns to report a blow-out Q4 last night, and is up
11% on massive revenues and margins. Tesla (TSLA) is down almost 5% after the CFO retired last night
in the wake of a big EPS miss. In energy, ConocoPhillips (COP) smashed estimates and raised its divi-
dend more than expected. With the 40% of the S&P 500 having reported, every sector is reporting rev-
enue growth of over 1% YoY, and only 1 sector (Materials) is reporting an EPS decline versus last year.
Economic scorecard. Interactive Earnings Calendar.
Morning Commentary
Asset Level Change 5d Chg 3m Chart Asset Level Change 5d Chg 3m Chart
S&P 500 2685.75 12.1 184.9 Gold 1328.20 96.5 327.3
Russell 1490.50 12.8 191.5 Silver 16.12 121.2 518.8
VIX Fut 17.91 -36.2 -696.1 WTI 54.23 0.0 197.4
TSX 925.90 16.2 124.7 Copper 278.75 72.3 532.8
2 Year 250.20 -0.6 -6.2 Nikkei 20773.49 105.5 96.7
5 Year 248.33 0.0 -6.7 CSI 300 3201.63 104.6 135.7
10 Year 267.38 -0.4 -4.2 ASX 200 5864.65 -37.5 -1.8
30 Year 302.69 -0.5 -0.7 Stoxx 600 358.19 -8.9 70.9
2s10s 16.98 0.2 2.0 BBG USD 1178.41 -15.1 -111.0
5s30s 54.20 -0.5 6.0 EURUSD 1.1486 5.2 161.0
5 Yr BE 169.80 0.3 168.2 USDJPY 108.65 -35.8 -90.3
10 Yr BE 183.37 0.5 181.6 EM FX 64.34 35.6 132.0
Mar '19 97.35 0.5 3.0 CDX IG 67.51 0.5 -6.6
Jun '19 97.35 2.0 6.0 iTraxx IG 70.54 2.0 -6.2
Sep '19 97.34 2.0 5.5 CDX HY 355.80 2.0 -28.2
Dec '19 97.33 2.0 6.5 iTraxx HY 308.65 2.0 -20.5
Euro
do
llar
s
Cre
dit
Major Asset Class Dashboard
Equ
ity
Futs
Co
mm
od
ity
Trsy
Yie
lds
Int'
l Eq
uit
y
Cu
rve
s/B
E
FX
(bps)(bps)