Embed Size (px)
Citation preview

1
Hints for a systematic b3 in the TI8 main bends
K. Fuchsberger
2009-06-29
2
Kick response measurements
Dispersion measurement
2009-06-29
Contents
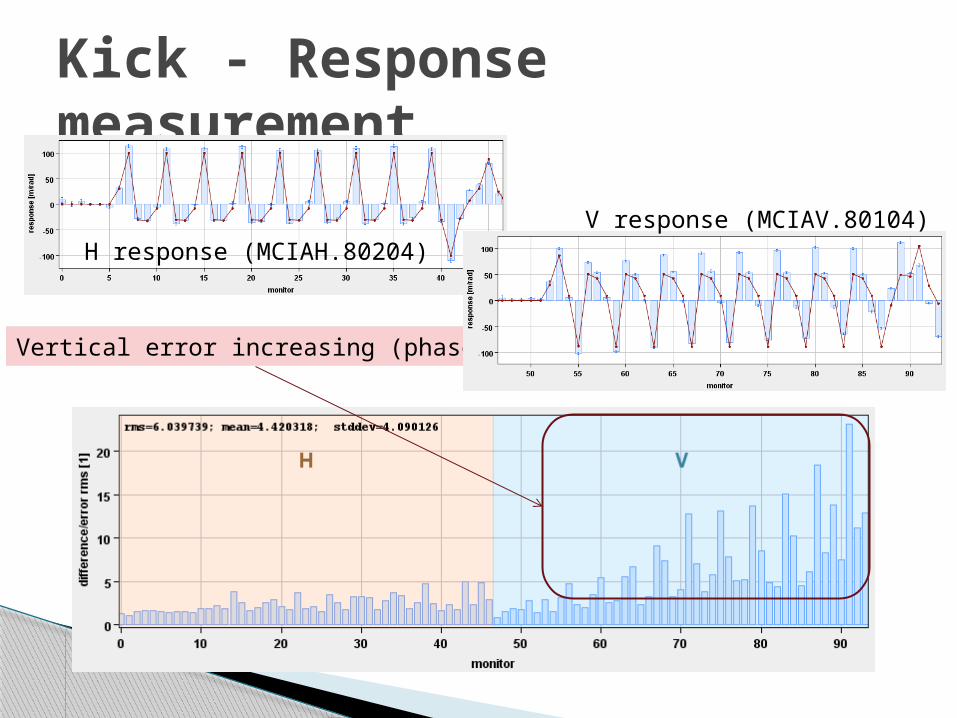
Kick - Response measurement
Vertical error increasing (phase)
H response (MCIAH.80204)V response (MCIAV.80104)
42009-06-29
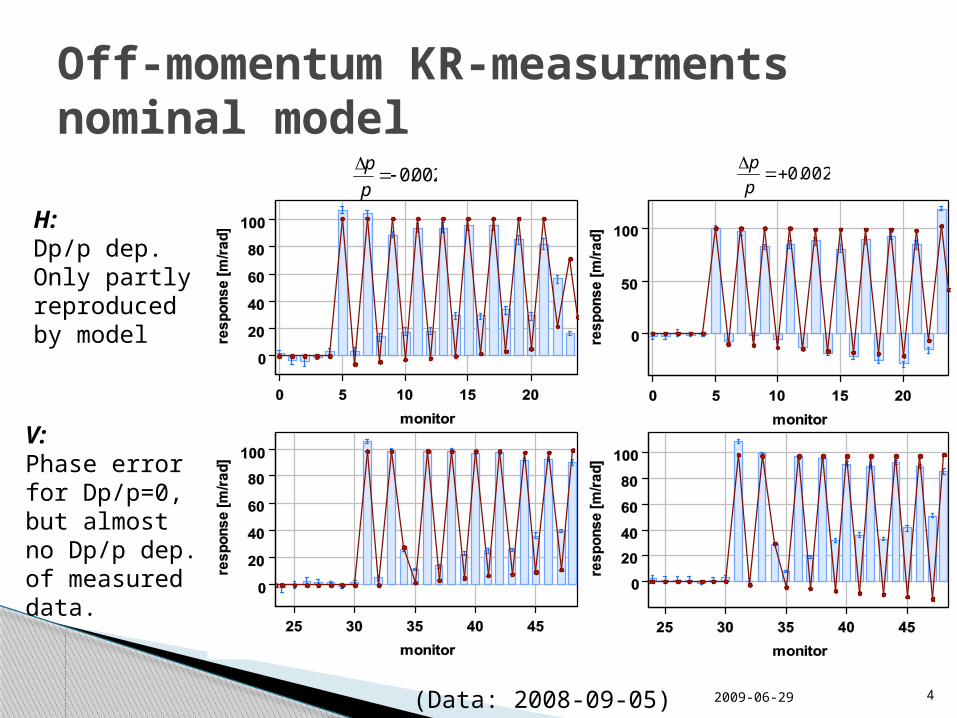
Off-momentum KR-measurmentsnominal model
H:Dp/p dep.Only partly reproduced by model
V:Phase error for Dp/p=0, but almost no Dp/p dep. of measured data.
002.0p
p002.0
p
p
(Data: 2008-09-05)
52009-06-29
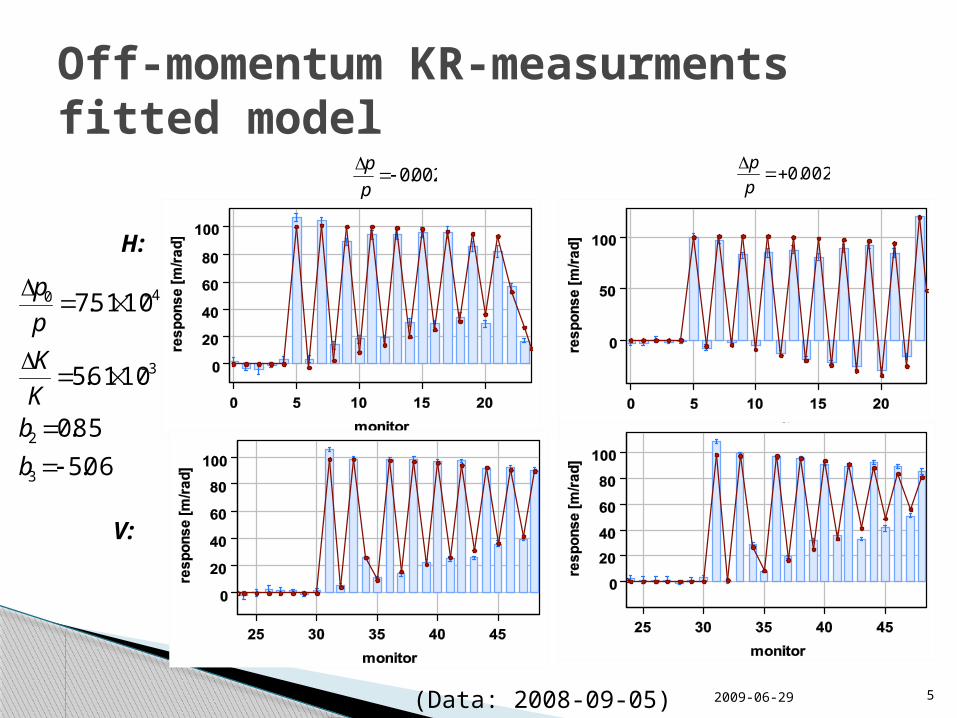
Off-momentum KR-measurmentsfitted model
H:
V:
002.0p
p002.0
p
p
06.5
85.0
1061.5
1051.7
3
2
3
40
b
bK
K
p
p
(Data: 2008-09-05)
6
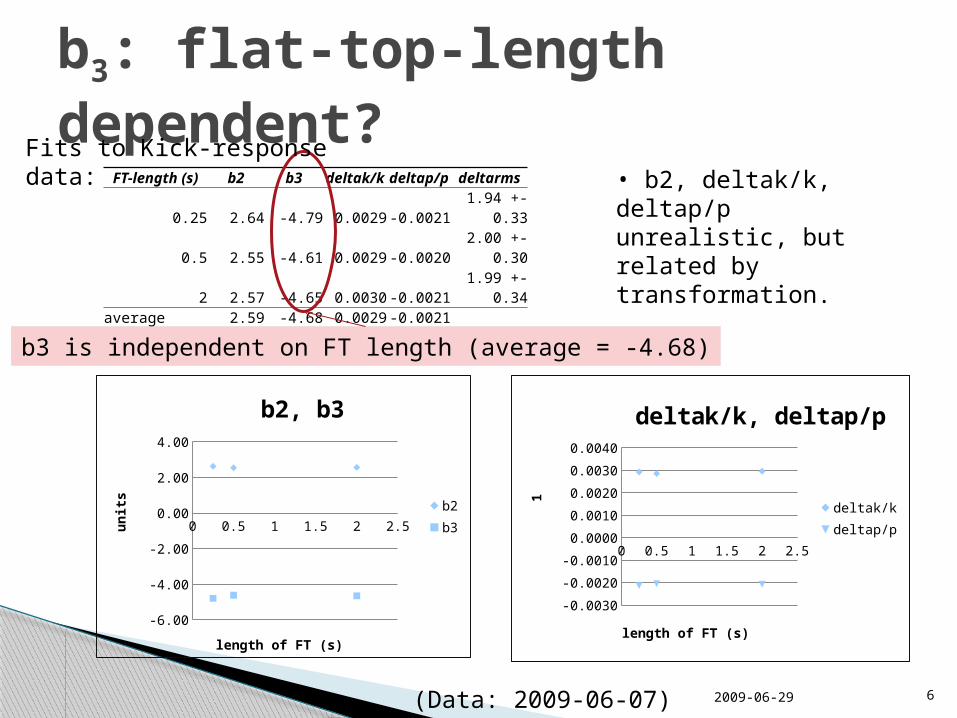
b3: flat-top-length dependent?
FT-length (s) b2 b3 deltak/k deltap/p deltarms0.25 2.64 -4.79 0.0029 -0.0021 1.94 +- 0.33
0.5 2.55 -4.61 0.0029 -0.0020 2.00 +- 0.302 2.57 -4.65 0.0030 -0.0021 1.99 +- 0.34
average 2.59 -4.68 0.0029 -0.0021stddev 0.04 0.09 0.0001 0.0000
0 0.5 1 1.5 2 2.5
-6.00-5.00-4.00-3.00-2.00-1.000.001.002.003.004.00
b2, b3
b2b3
length of FT (s)
unit
s
0 0.5 1 1.5 2 2.5
-0.0030
-0.0020
-0.0010
0.0000
0.0010
0.0020
0.0030
0.0040
deltak/k, deltap/p
deltak/kdeltap/p
length of FT (s)
1
b3 is independent on FT length (average = -4.68)
• b2, deltak/k, deltap/p unrealistic, but related by transformation.
(Data: 2009-06-07)
Fits to Kick-response data:
2009-06-29
7
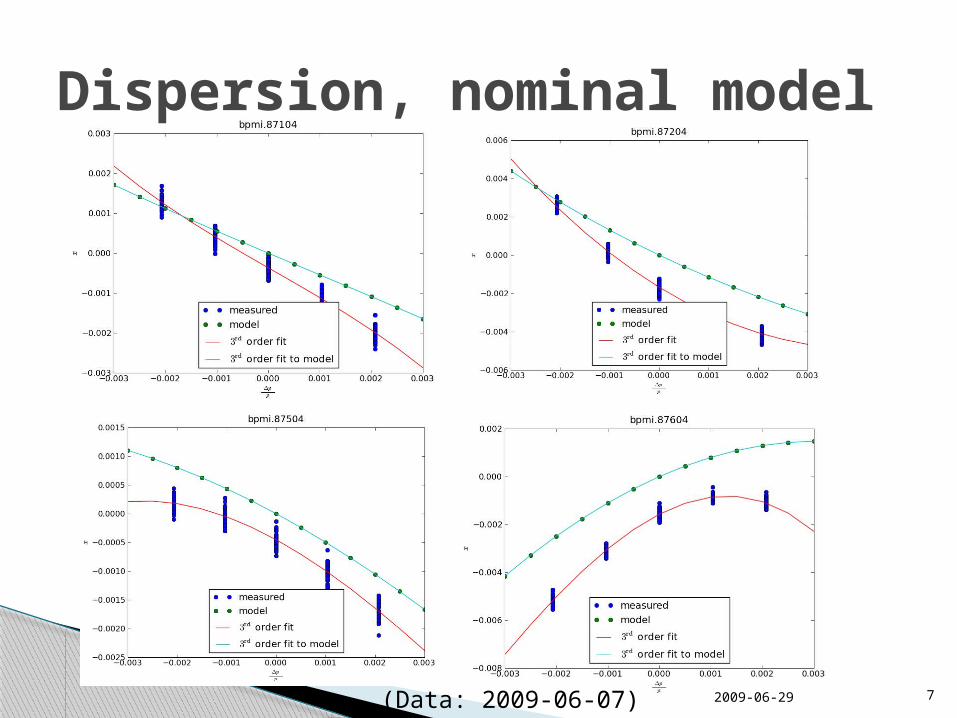
Dispersion, nominal model
(Data: 2009-06-07) 2009-06-29
8
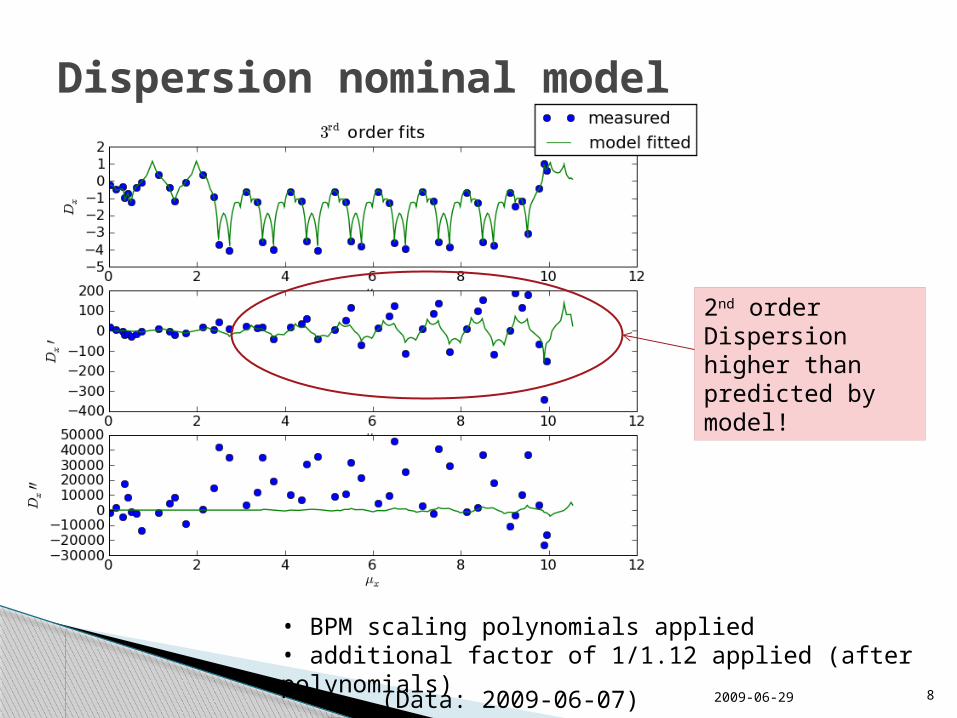
Dispersion nominal model
• BPM scaling polynomials applied• additional factor of 1/1.12 applied (after polynomials)
2nd order Dispersion higher than predicted by model!
(Data: 2009-06-07) 2009-06-29
9
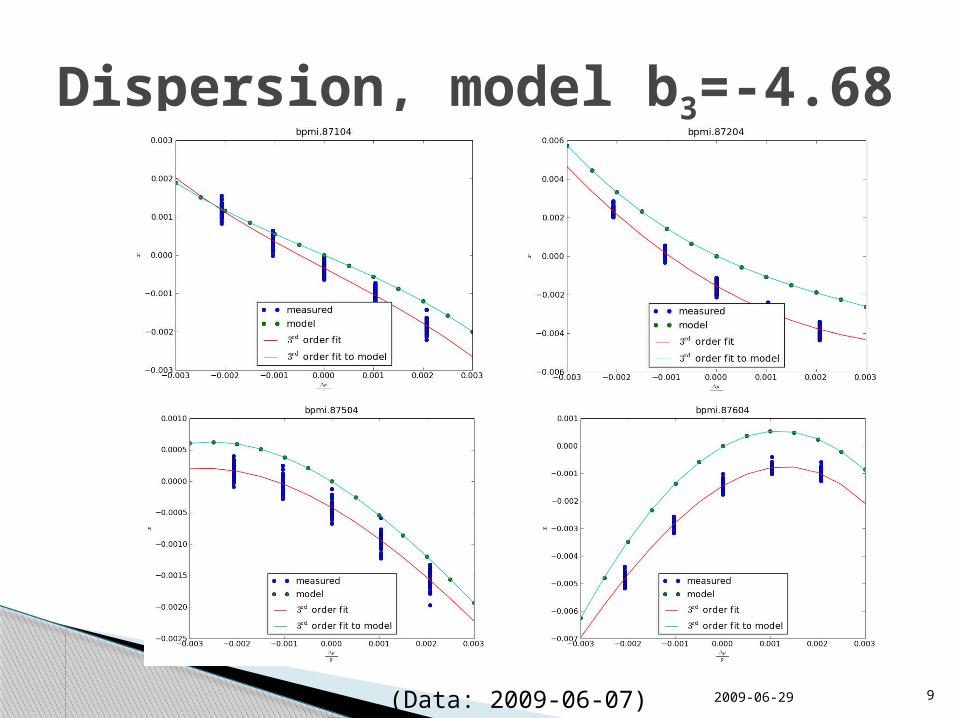
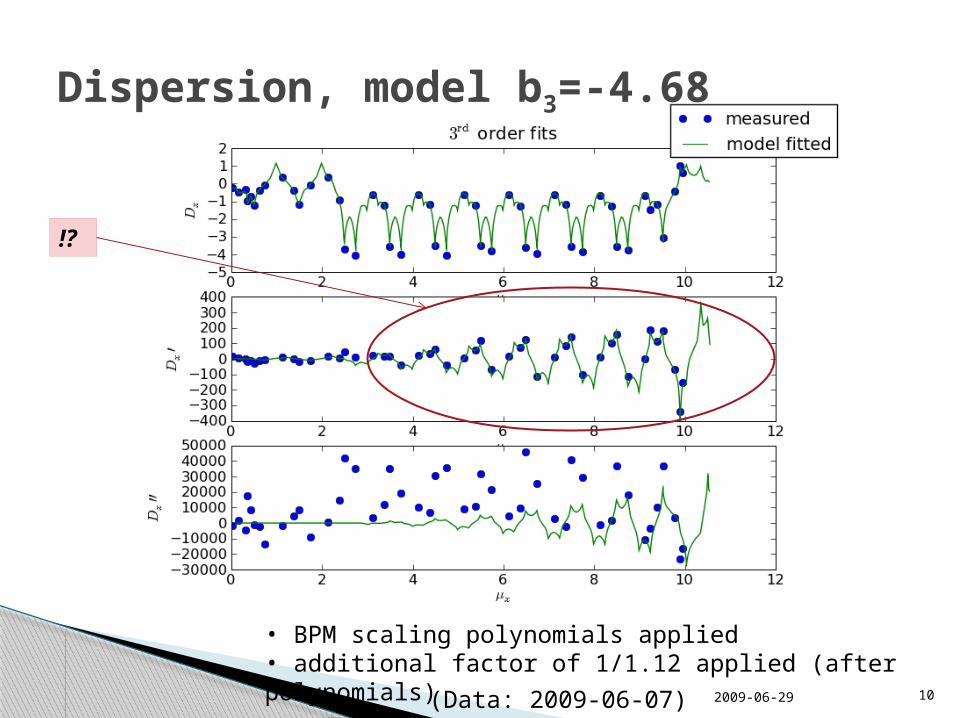
Dispersion, model b3=-4.68
2009-06-29(Data: 2009-06-07)
10
Dispersion, model b3=-4.68
• BPM scaling polynomials applied• additional factor of 1/1.12 applied (after polynomials)
!?
(Data: 2009-06-07) 2009-06-29
11
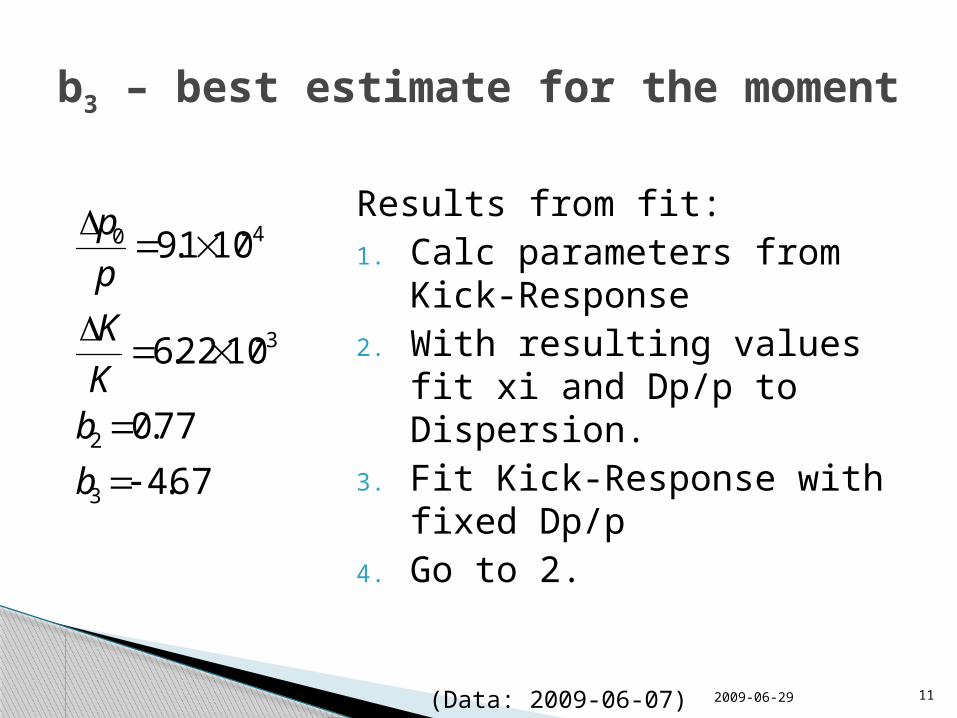
Results from fit:1. Calc parameters from Kick-
Response2. With resulting values fit xi
and Dp/p to Dispersion.3. Fit Kick-Response with fixed
Dp/p4. Go to 2.
2009-06-29
b3 – best estimate for the moment
67.4
77.0
1022.6
101.9
3
2
3
40
b
bK
K
p
p
(Data: 2009-06-07)
12
Preliminary Conclusions: A model including b3 (between about -4 and -5
units) reproduces very well both the measured dispersion- and kick-response- data.
The effect is independent on the flat-top length.
Questions: What is a realistic (measured) average value for
a b3 the MBIs used in TI8? What else could be the source of the observed
effects?
Conclusions and Questions
2009-06-29

132009-06-29
Thank You!
14
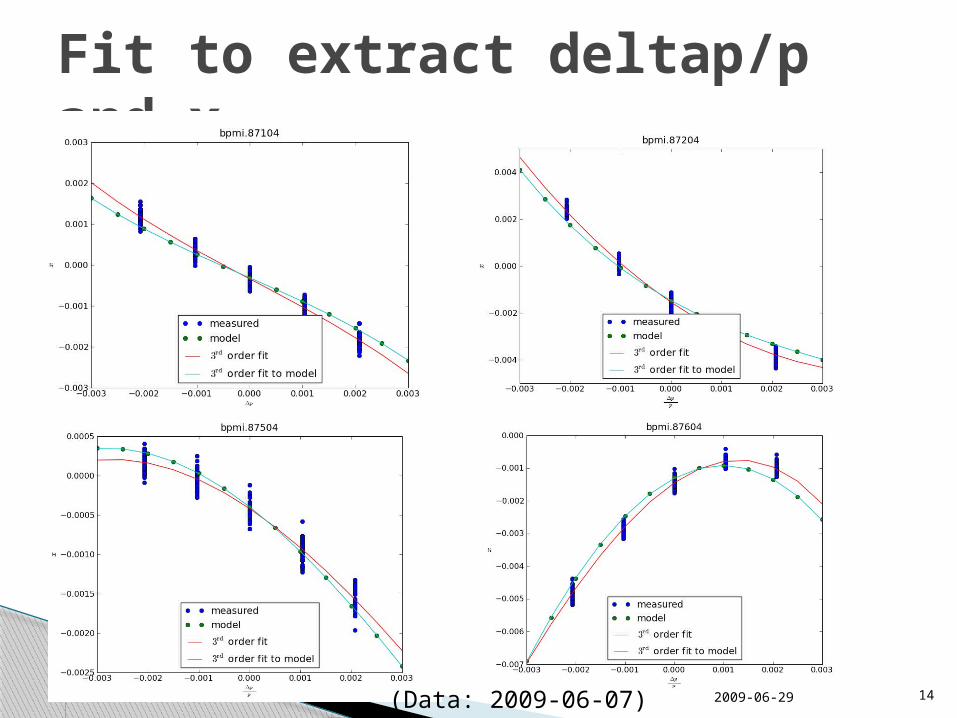
Fit to extract deltap/p and xi
2009-06-29(Data: 2009-06-07)
15
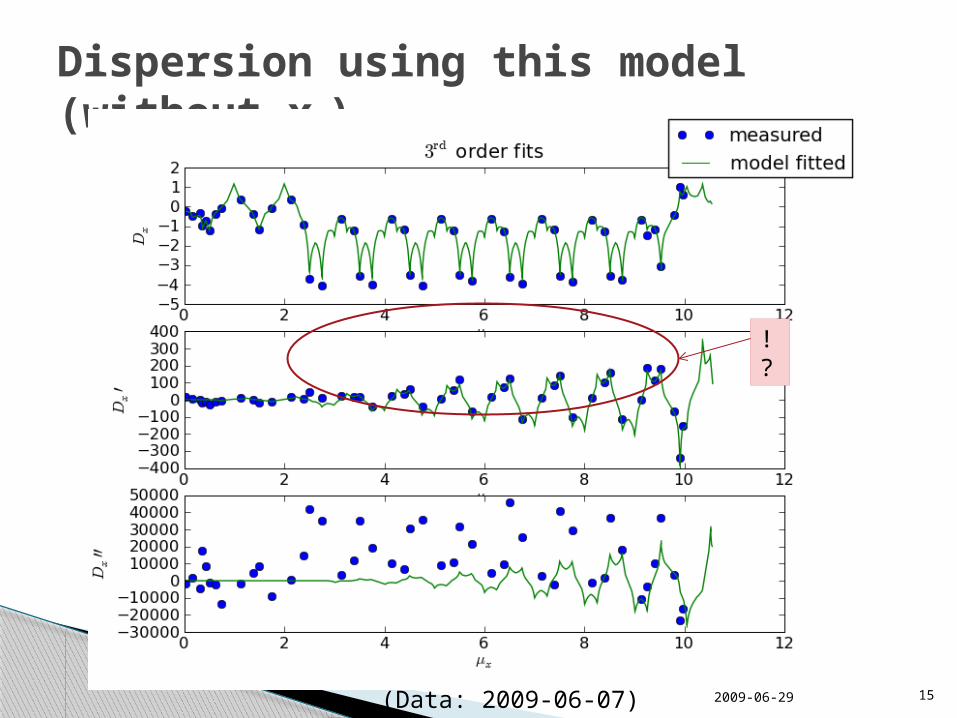
Dispersion using this model (without xi)
2009-06-29(Data: 2009-06-07)
!?
162009-06-29
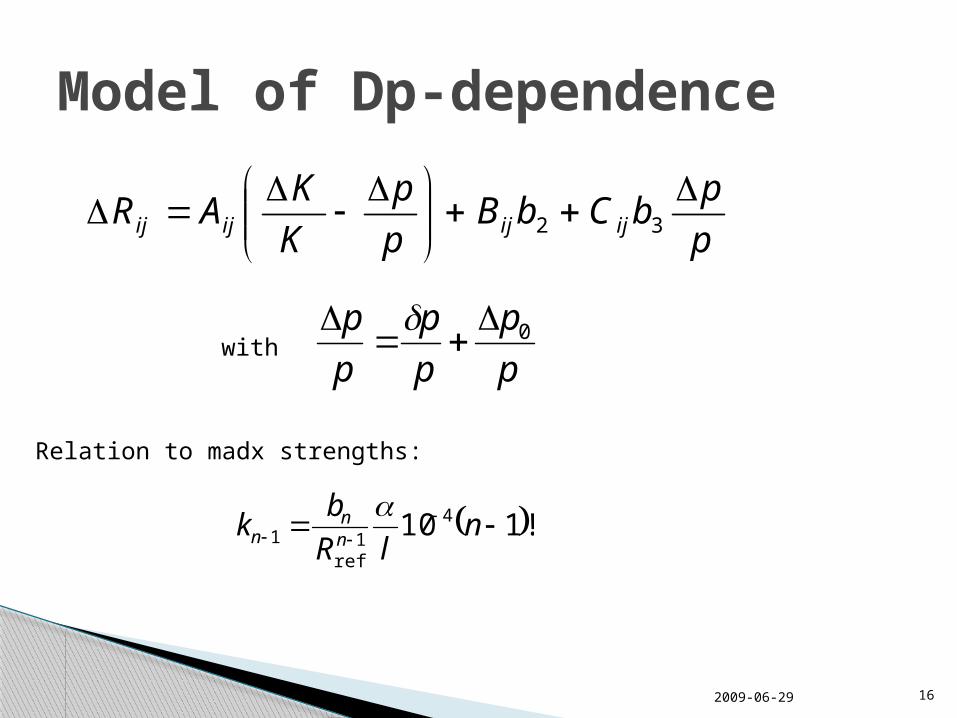
Model of Dp-dependence
p
pbCbB
p
p
K
KAR ijijijij
32
p
p
p
p
p
p 0
with
Relation to madx strengths:
!110 41
ref1
nlR
bk
nn
n

![Roland Fuchsberger - theorie1.physik.uni-erlangen.de€¦ · [Fuel Cell Today, Industry Review 2011] Technische Universität München Katalysator: Platinum [Fuel Cell Today, Industry](https://img.pdfslide.net/doc/110x75/5f06e0ae7e708231d41a2f01/roland-fuchsberger-fuel-cell-today-industry-review-2011-technische-universitt.jpg)