Embed Size (px)
Citation preview
HA–‘O– ‘U–
HA–MOA
HA–NA
HO–
KU–‘ULA
KA‘ELEKU–
KA–KI‘O
KAUPO–
KE‘ANAE
KI–PAHULU
KOALI
MOKULAU
MU–‘OLEA
NA–HIKU
PU‘UIKI
PUKA‘AUHUHU
WAILUA
A–
NA AREAHC O M M U N I T Y P R O F I L E
CENTER
ON THE
FAMILYAloha United Way

NTRODUCTIONI
The median age of the 1,855 people in the Hana Area is slightly lower than the median for theState. Nearly one-third of the population is 19 or younger, and the percentage of senior citizens
is lower than the State average. The ethnic makeup is unique. This area has the lowest percentageStatewide of Asians (6.3%) and the second-highest percentage (after Ni‘ihau) of Native Hawaiians(34.5%). Almost two-thirds of the multiracial people of Hana identify themselves as Part-Hawaiian.
For a community as small as Hana, it is important to keep in mind that a few unusual cases in thedata can skew the results, causing the percentages to move to the high or low extremes. The percapita income of this area is almost 25% lower than the State as a whole, and approximately 30% ofthe children ages 4 and younger are living in poverty. Consequently, the percentages of families par-ticipating in food stamp and Temporary Assistance to Needy Families (TANF) programs are highcompared to the rest of the State. The percentage of those with disabilities is also high: Hana ranksfourth-highest in the State for elderly with disabilities and highest for the percentage of children inspecial education programs. Hana has the highest percentage Statewide of 3rd graders who scorebelow average on the SAT and the third-highest percentage of "idle teens" (not in school and notworking).
On other indicators of child and family well-being, the Hana Area fares better. This community hasthe second-highest level of residential stability (living in the same home for 5 years or more), andthe percentage of home ownership is higher than the State average. The percentage of 8th graderswho feel safe at school is second-highest in the State. In a Statewide student survey, more than halfof the adolescents responding in the Hana Area felt connected to their neighborhoods and reportedclose family ties. All of the high school seniors graduate, and most have plans for higher education.The percentage who gain acceptance to college is among the highest Statewide.
Hawai‘i no– ka ‘oi—Hawai‘i the best—is a sentiment shared by many people in our islandstate. Those who have left and yearn to return home speak movingly about missing the bestbeaches in the world, delicious local grinds found no-where else, a mix of ethnicities at
school, play, and work, and the aloha spirit that infuses even the smallest act. There are so manyother things we can point to with pride:
• Hawai‘i has the lowest rates of child deaths and teen deaths in the nation
• Life expectancy is higher in Hawai‘i than anywhere else in the nation
• Three-fourths of Hawai‘i’s families eat dinner together 5 or more times a week
• More than 80% of Hawai‘i’s people feel they can rely on others in their community for help
• The average donation to charity is higher in Hawai‘i at every income level when compared to mainland giving.
There are, of course, many serious problems that require our attention and action. Some of thesemay seem monumental and insurmountable, such as the problem of drug abuse, but Hawai‘i’s people, working together, have overcome major obstacles in the past and can do so in the future.
This is one of 43 community profiles developed by the Center on the Family that can be used as aresource to improve conditions for children and families in your neighborhood. The profiles providedata and information about the people who live in specific geographic areas encompassed by a public high school and all of its feeder intermediate and elementary schools. Factual informationprovides a good starting point for making informed decisions and plans for strategic action. We hopethat this first-ever presentation of data at the school/community-complex level will provide you witha better understanding of your community and spur you to take action to keep Hawai‘i no– ka ‘oi.
A–NA AREAH
Total PopulationMedian age
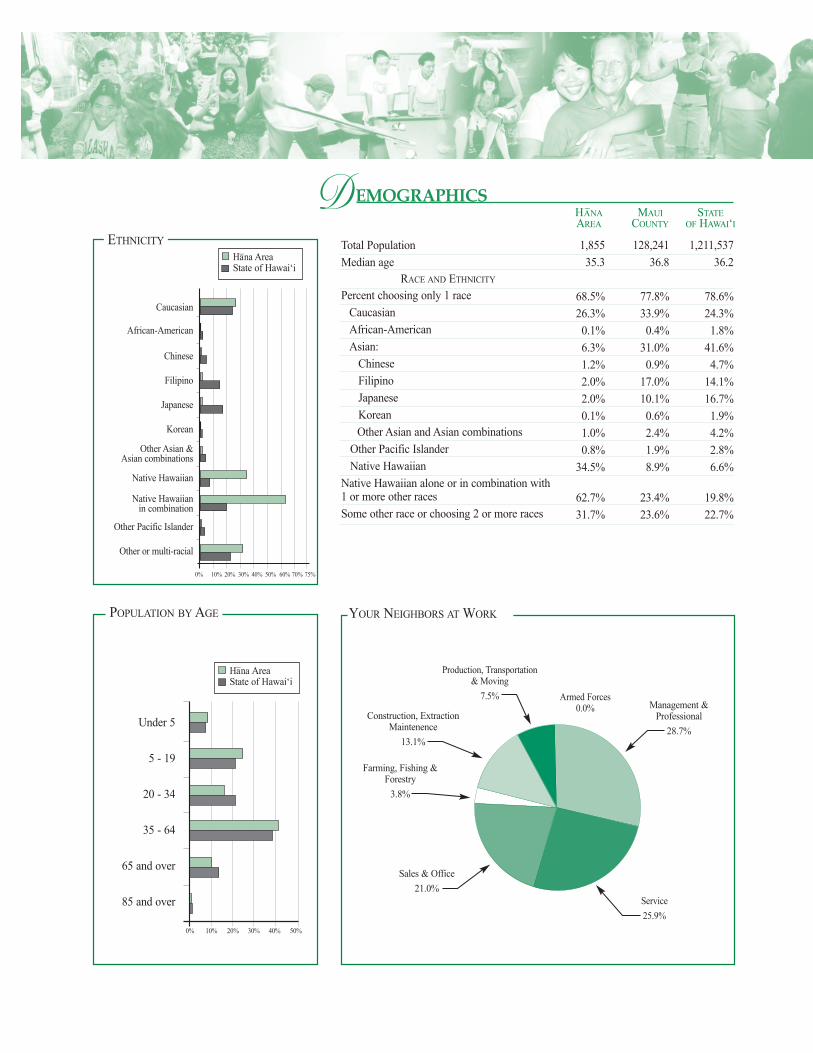
EMOGRAPHICSDHA–NAAREA
MAUICOUNTY
STATEOF HAWAI‘I
Percent choosing only 1 race Caucasian African-American Asian:
Chinese Filipino Japanese Korean Other Asian and Asian combinations
Other Pacific Islander Native HawaiianNative Hawaiian alone or in combination with 1 or more other racesSome other race or choosing 2 or more races
1,85535.3
68.5%26.3%0.1%6.3%1.2%2.0%2.0%0.1%1.0%0.8%
34.5%
62.7%31.7%
128,24136.8
77.8%33.9%0.4%
31.0%0.9%
17.0%10.1%0.6%2.4%1.9%8.9%
23.4%23.6%
1,211,53736.2
78.6%24.3%1.8%
41.6%4.7%
14.1%16.7%1.9%4.2%2.8%6.6%
19.8%22.7%
RACE AND ETHNICITY
POPULATION BY AGE
Under 5
5 - 19
20 - 34
35 - 64
65 and over
85 and over
0% 10% 20% 30% 40% 50%
Ha–na AreaState of Hawai‘i
YOUR NEIGHBORS AT WORK
ETHNICITY
Caucasian
African-American
Chinese
Filipino
Japanese
Korean
Other Asian & Asian combinations
Native Hawaiian
Native Hawaiian in combination
Other Pacific Islander
Other or multi-racial
0% 10% 20% 30% 40% 50% 60% 70% 75%
Ha–na AreaState of Hawai‘i
Management &Professional
28.7%
Service
25.9%
Sales & Office
21.0%
Construction, ExtractionMaintenence
13.1%
Production, Transportation& Moving
7.5% Armed Forces0.0%
Farming, Fishing &Forestry
3.8%
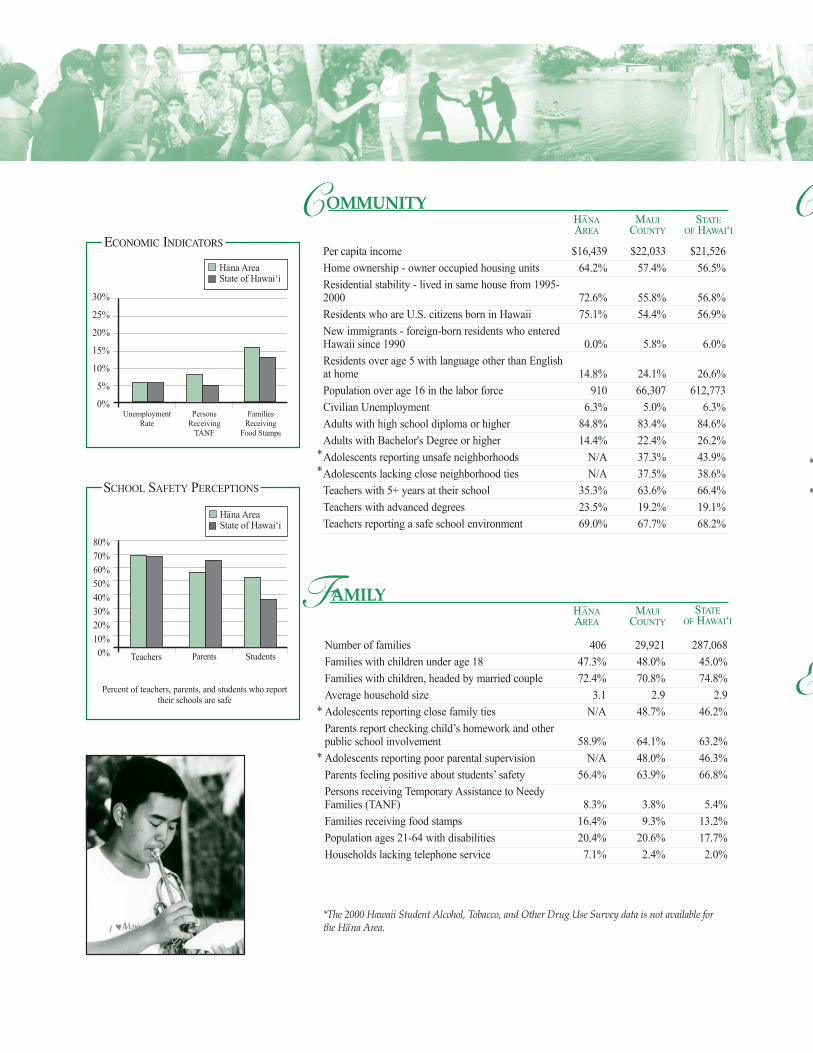
C
E
*
*
Number of familiesFamilies with children under age 18Families with children, headed by married coupleAverage household sizeAdolescents reporting close family ties Parents report checking child’s homework and otherpublic school involvementAdolescents reporting poor parental supervision Parents feeling positive about students’ safetyPersons receiving Temporary Assistance to NeedyFamilies (TANF)Families receiving food stampsPopulation ages 21-64 with disabilitiesHouseholds lacking telephone service
40647.3%72.4%
3.1N/A
58.9%N/A
56.4%
8.3%16.4%20.4%7.1%
29,92148.0%70.8%
2.948.7%
64.1%48.0%63.9%
3.8%9.3%
20.6%2.4%
287,06845.0%74.8%
2.946.2%
63.2%46.3%66.8%
5.4%13.2%17.7%2.0%
AMILYF
Per capita incomeHome ownership - owner occupied housing unitsResidential stability - lived in same house from 1995-2000Residents who are U.S. citizens born in HawaiiNew immigrants - foreign-born residents who enteredHawaii since 1990Residents over age 5 with language other than Englishat homePopulation over age 16 in the labor forceCivilian UnemploymentAdults with high school diploma or higherAdults with Bachelor's Degree or higherAdolescents reporting unsafe neighborhoodsAdolescents lacking close neighborhood ties Teachers with 5+ years at their schoolTeachers with advanced degreesTeachers reporting a safe school environment
$16,43964.2%
72.6%75.1%
0.0%
14.8%910
6.3%84.8%14.4%
N/AN/A
35.3%23.5%69.0%
$22,03357.4%
55.8%54.4%
5.8%
24.1%66,307
5.0%83.4%22.4%37.3%37.5%63.6%19.2%67.7%
$21,52656.5%
56.8%56.9%
6.0%
26.6%612,773
6.3%84.6%26.2%43.9%38.6%66.4%19.1%68.2%
OMMUNITYCHA–NAAREA
MAUICOUNTY
STATEOF HAWAI‘I
HA–NAAREA
MAUICOUNTY
STATEOF HAWAI‘I
80%70%60%50%40%30%20%10%0% Teachers Parents Students
SCHOOL SAFETY PERCEPTIONS
Ha–na AreaState of Hawai‘i
Percent of teachers, parents, and students who reporttheir schools are safe
**
*
*
*The 2000 Hawaii Student Alcohol, Tobacco, and Other Drug Use Survey data is not available forthe Ha–na Area.
30%
25%
20%
15%
10%
5%
0%Unemployment
RatePersons
ReceivingTANF
FamiliesReceiving
Food Stamps
Ha–na AreaState of Hawai‘i
ECONOMIC INDICATORS

K - 8 students with health insuranceChild abuse rate per 1000 childrenChildren ages 0-4 living in povertyChildren ages 0-5 with all parents in the labor forceChildren ages 3-5 enrolled in nursery school, pre-school, or kindergartenChildren ages 6-8 with untreated tooth decayStudents in public school program for limitedEnglish proficiencySAT Reading: 3rd graders scoring below average SAT Math: 3rd graders scoring below average Public school students in Special EducationPublic school 8th graders who feel safe at schoolAdolescents reporting exposure to illicit drug use intheir school and community Adolescents reporting a lack of interest in schoolTeens age 16-19, not in school and not workingPublic school attendanceGraduation rates of public school seniorsPublic school seniors with plans for 2 or 4 year college Percent accepted of the seniors with plans for college
N/A9
30.2%60.1%
78.9%N/A
0.2%57.6%42.4%19.8%52.2%
N/AN/A
16.5%91.3%
100.0%
79.3%
82.6%
86.8%10
17.4%65.6%
70.5%36.0%
5.4%17.2%17.1%13.2%36.2%
18.3%47.6%10.7%92.3%95.0%
72.0%
45.8%
90.3%11
15.4%61.8%
72.7%36.0%
6.3%17.8%18.1%11.0%37.6%
14.5%45.3%8.6%
93.4%94.6%
74.8%
58.5%
HILDRENCHA–NAAREA
MAUICOUNTY
STATEOF HAWAI‘I
Individuals age 65 & older living aloneIndividuals age 65 & older living in povertyIndividuals age 65 & older with a disabilityGrandparents who live in the same household as their grandchildren under age 18Grandparents responsible for the care of grandchildren with whom they live
19.3%5.8%
49.2%
97
25.8%
18.9%7.5%
42.2%
5,060
28.1%
17.8%7.4%
40.6%
49,237
28.5%
LDERLYEHA–NAAREA
MAUICOUNTY
STATEOF HAWAI‘I
Ha–naArea
State
Ha–naArea
State
Below AverageAverageAbove Average
3RD GRADE SAT
MAT
HR
EAD
ING
*
*
57.6% 33.3% 9.1%
17.8% 60.5% 21.7%
42.4% 45.5% 12.1%
18.1% 54.5% 27.4%

CENTER
ON THE
FAMILY
There are various ways to assess the strength of a community. For thisreport, nine indicators of child, family, and community strengths wereselected. Standard scores were derived for each of the nine indicators andsummarized into a cumulative score for each of 42 school complex areas.A 43rd community, Ni‘ihau, was omitted from the index because somedata were unavailable. Those communities that scored highest on the protection index are more likely to have children who are nurtured anddoing well in school, families that are healthy, and communities which are economically vital.
ROTECTION INDEXP
Klingle, R.S. (2001). Ka leo o na– keiki: The 2000 Hawai‘i student alcohol,tobacco, and other drug use study. Kapolei, HI: State of Hawai‘i,Department of Health, Alcohol and Drug Abuse Division.
State of Hawai‘i, Department of Education, Planning and EvaluationBranch, Evaluation Section, (2001). School quality survey. (2001).School status and improvement reports. [Online:] http://arch.k12.hi.us/(April 15, 2002).
_____. (2002). Senior exit plans survey. [Online:] http://arch.k12.hi.us/(October 25, 2002).
State of Hawai‘i, Department of Health, Dental Health Division. (2002).Statewide public school oral health assessment.
State of Hawai‘i, Department of Human Services. (1999). TANF and foodstamps data. Unpublished raw data.
State of Hawai‘i, Department of Labor and Industrial Relations. (2001).Labor force and unemployment data. Unpublished raw data.
U.S. Census Bureau. (2000). Census 2000. [Online:] http://www.census.gov/ census2000/ states/ hi.html (September 30, 2002).
Wood, D. William (2001). Hawai‘i Covering Kids data project.Unpublished raw data.
EFERENCESR
CENTER ON THE FAMILY
COLLEGE OF TROPICAL AGRICULTURE & HUMAN RESOURCES
UNIVERSITY OF HAWAI‘I
2515 CAMPUS ROAD, MILLER HALL 103HONOLULU, HI 96822
PH: 808.956.4132 FX: 808.956.4147VISIT OUR WEBSITE AT www.uhfamily.hawaii.edu
-2 -1.5 -1 -.5 0 .5 1
PROTECTION INDEX
KalaniKaiserCastleKailua
‘AieaLa–na‘i
RooseveltMililaniKahukuKala–heo
Pearl CityLaupa–hoehoe
King KekaulikeHonoka‘a
KapoleiNorth Kona
Central Kaua‘iSouth Kona
BaldwinWest Kaua‘i
Waialua
Central HiloHiloKaimuki
-
MoanaluaEast Kaua‘iWaipahuMoloka‘iMauiCampbellLahainalunaRadfordHanaKea‘auKohalaPahoaNa–na–kuliMcKinleyWai‘anaeLeilehuaFarringtonKa‘u
-2 -1.5 -1 -.5 0 .5 1
COF 2003, November (Version 1.1)


![road-to-hana-highway-guideofus-maui · Kula Hwy 37 K po Waiuha Bay Mile Marker Legend Rest Area Kula Botanical Gardens End graded gravel road Haleakala (10,023 ft) [3,055 m] Manawainui](https://img.pdfslide.net/doc/110x75/5e3f3c57796d2635fe04af43/road-to-hana-highway-guideofus-maui-kula-hwy-37-k-po-waiuha-bay-mile-marker-legend.jpg)