Embed Size (px)
Citation preview

K-Miner: Uncovering Memory Corruption in Linux
David Gens,∗ Simon Schmitt,∗ Lucas Davi,† Ahmad-Reza Sadeghi∗∗CYSEC/Technische Universitat Darmstadt, Germany.
{david.gens,simon.schmitt,ahmad.sadeghi}@trust.tu-darmstadt.de†University of Duisburg-Essen, Germany. [email protected]
Abstract—Operating system kernels are appealing attack tar-gets: compromising the kernel usually allows attackers to bypassall deployed security mechanisms and take control over theentire system. Commodity kernels, like Linux, are written inlow-level programming languages that offer only limited typeand memory-safety guarantees, enabling adversaries to launchsophisticated run-time attacks against the kernel by exploitingmemory-corruption vulnerabilities.
Many defenses have been proposed to protect operatingsystems at run time, such as control-flow integrity (CFI). However,the goal of these run-time monitors is to prevent exploitation asa symptom of memory corruption, rather than eliminating theunderlying root cause, i.e., bugs in the kernel code. While findingbugs can be automated, e.g., using static analysis, all existingapproaches are limited to local, intra-procedural checks, and facesevere scalability challenges due to the large kernel code base.Consequently, there currently exist no tools for conducting globalstatic analysis of operating system kernels.
In this paper, we present K-Miner, a new framework toefficiently analyze large, commodity operating system kernelslike Linux. Our novel approach exploits the highly standard-ized interface structure of the kernel code to enable scalablepointer analysis and conduct global, context-sensitive analysis.Through our inter-procedural analysis we show that K-Minersystematically and reliably uncovers several different classes ofmemory-corruption vulnerabilities, such as dangling pointers,user-after-free, double-free, and double-lock vulnerabilities. Wethoroughly evaluate our extensible analysis framework, whichleverages the popular and widely used LLVM compiler suite, forthe current Linux kernel and demonstrate its effectiveness byreporting several memory-corruption vulnerabilities.
I. INTRODUCTION
Operating system kernels form the foundation of practicallyall modern software platforms. The kernel features manyimportant services and provides the interfaces towards userapplications. It is usually isolated from these applicationsthrough hardware mechanisms such as memory protection anddifferent privilege levels in the processor. However, memory-corruption vulnerabilities in the kernel code open up thepossibility for unprivileged users to subvert control flow ordata structures and take control over the entire system [32],[70], [72], [47]. For this reason, many defenses have been
proposed in the past [25], [37], [49], [16], [57], [5], [23],[63], [20]. These defenses are designed specifically for run-time protection of operating system kernels. Their goal is toprovide countermeasures and secure the kernel against attacksexploiting memory corruption. Most of these approaches canbe loosely categorized as run-time monitors [49], [16], [57],[5], [23], [63], [19].
Run-time Monitors vs. Compile-time Verification.Typically, adversaries are modeled according to their capa-bilities, and reference monitors are then designed to defendagainst a specific class of attacks. For instance, control-flow integrity (CFI) is tailored towards control-flow hijackingattacks. However, CFI is not designed to protect against data-only adversaries resulting in a protection gap that allows forcrucial attacks despite the presence of run-time monitors,such as CFI, in the kernel [11], [32], [70], [20]. Thus, acombination of many different defenses is required to protectthe kernel against multiple classes of adversaries. Conse-quently, commodity operating systems will remain vulnerableto new types of software attacks as long as memory-corruptionvulnerabilities are present in the code [60].
An alternative approach to employing run-time monitors isto ensure the absence of memory-corruption vulnerabilities byanalyzing the system before deployment. This was shown to befeasible for small microkernels with less than 10,000 lines ofcode [6], [44], [64], by building a formal model of the entirekernel and (manually) proving the correctness of the imple-mentation with respect to this model. The invariants that holdfor the formal model then also hold for the implementation.However, the formal correctness approach is impractical forcommodity monolithic kernels due to their size and extensiveuse of machine-level code [43], which provides no safetyguarantees. Even for small microkernels formulating such amodel and proving its correctness requires more than 10 personyears of work [44], [6]. While dynamic analyses are used todetect vulnerabilities in OS kernels rather successfully [34],[35], [22], static approaches have a major advantage: soundstatic analysis safely over-approximates program execution,allowing for strong statements in the case of negative analysisresults. In particular, if no report is generated for a certaincode path by a sound analysis, one can assert that no memory-corruption vulnerability is present. Hence, static analysis isalso a practical and pragmatic alternative to formal verification,as it is able to offer similar assurances for real-world softwareby means of automated compile-time checks [15].
Static analysis of commodity kernels.However, static analysis faces severe scalability challenges,and hence, all analysis frameworks for kernel code are limitedto intra-procedural analysis, i.e., local checks per function.
Network and Distributed Systems Security (NDSS) Symposium 201818-21 February 2018, San Diego, CA, USAISBN 1-1891562-49-5http://dx.doi.org/10.14722/ndss.2018.23326www.ndss-symposium.org
In particular, there are five popular analysis frameworks tar-geting Linux: Coccinelle [52], Smatch [9], TypeChef [38],APISAN [74], and EBA [1]. None of these support inter-procedural data-flow analyses, which are required to conser-vatively approximate program behavior, and reliably uncovermemory corruption caused by global pointer relationships. Themain reason why precise data-flow analysis for kernel coderepresents a huge challenge for all existing approaches, isthe huge size and complexity of its monolithic code base:currently, Linux comprises over 24 million lines of code [14].Just compiling a common distribution kernel takes severalhours, even on top-of-the-line hardware. While some of theexisting tools allow for the static analysis of kernel code, theseare conceptually limited to local intra-procedural (i.e., per-function) or simple file-based analysis. This limitation is due tothe fact that the number of possible paths grows exponentiallywith the code size, and hence, static analysis approaches facesevere scalability problems [29], [28], [65]. At the same time,analysis methods have to take all paths and states into accountto remain sound, and hence, pruning or skipping certain partsof the code would lead to unreliable results. This is whythe resource requirements for conducting such analyses in theLinux kernel quickly outgrows any realistic thresholds. As aresult, global and inter-procedural analyses, which are requiredto uncover memory corruption reliably, remain out of reach ofthese existing approaches.
Goals and Contribution.In this paper, we propose to exploit a distinct and uniqueproperty of kernel software: its interface to user space is highlystandardized [33]. Our idea is to partition the kernel codealong separate execution paths using the system call interfaceas a starting point. We show that this significantly reducesthe number of relevant paths, allowing us to conduct evencomplex, inter-procedural data-flow analysis in the kernel. Tothis end, we present the design and implementation of K-Miner, the first static analysis framework that enables complexdata-flow analysis for Linux to reliably detect vulnerabilitiesin kernel code.
Partitioning the kernel code comes with a number ofchallenges, such as the frequent reuse of global data structures,the synchronization between the per-system call and globalmemory states (contexts), and complicated and deeply nestedaliasing relationships of pointers. As we will show, our frame-work tackles all of these challenges, providing a number ofdifferent analysis passes that analyze system calls simultane-ously, and reporting a number of real-world vulnerabilities.
Further, scalable static analysis designed for user spaceprograms cannot simply be applied in kernel setting: data-flow analysis expects an initial state from which analysispasses propagate value flows, which is naturally satisfied bya program’s main function in user space. K-Miner is tailoredtowards this requirement and enables data-flow analysis in thekernel setting.
To summarize our contributions are as follows:
• Enable global static analysis for kernel code: we presentK-Miner, a novel approach to conduct global static analysesof the Linux kernel. Our framework allows to systematicallyanalyze the kernel’s user-space interface and detect possiblememory corruption. To enable precise inter-procedural static
analysis of modern OS kernels we tackle a number ofchallenges, such as dealing with the large code base, com-plex inter-dependencies, and aliasing relationships betweenglobal kernel pointers and memory objects.
• Prototype framework implementation: we provide mul-tiple analyses for finding classes of vulnerabilities in theLinux kernel that are typically exploited, and demonstratetheir effectiveness in analyzing many different kernel ver-sions, using different configurations. Our presented frame-work is extensible and adding additional analysis passes isstraightforward. K-Miner includes a web-based user inter-face to ease reporting and collaboration. It also providesextensive graph-based analysis overviews and statistics onthe number of alerts and performance. We release ourimplementation of K-Miner as an open source project [24]that is built on top of LLVM [46].
• Extensive evaluation: we rigorously evaluate our staticanalysis framework implemenation for the Linux kernelby applying it to all system calls across many differentLinux versions and highlight the effectiveness of our frame-work through detailed reports and statistics. We demon-strate the importance of automated and scalable analysisof commodity kernel code by reliably uncovering severalknown memory-corruption vulnerabilities, which previouslyrequired manual inspection of the code, and were usedto conduct real-world kernel exploits against dissidentsand activists [50], [62]. Using K-Miner these bug classescan now be found automatically through our precise andreliable static analysis passes. We reported two use-after-return vulnerabilities that K-Miner uncovered in the kernel.
II. BACKGROUND
In this section we explain the concepts behind static data-flow analysis and present a classification of memory-corruptionvulnerabilities.
A. Data-Flow Analysis
The general idea of static analysis is to take a program anda list of pre-compiled properties as input, and find all the pathsfor which a given property is true. Examples of such propertiesare liveness analysis, dead-code analysis, typestate analysis,or nullness analysis [41]. For instance, a nullness analysis forthe program a) in Figure 1 could be answered by looking atits pointer-assignment graph (PAG) depicted in c): since thereis a path in which variable b is assigned a NULL value (bpoints to NULL in the PAG) a report will be issued. Anothercommonly used data structure is the inter-procedural control-flow graph (ICFG) in b) — limited to the procedures mainand f for brevity — which propagates control flow globally.This can be used to conduct path-sensitive analysis. Finally,taint and source-sink analysis may track individual memoryobjects through their associated value-flow graph (VFG) in d).
Static analysis for tracking individual values in a program iscalled data-flow analysis. Most data-flow analysis approachesfollow a general concept, or framework, to analyze programssystematically. The naive approach is to enumerate all possibleprogram paths and test each graph for a given property. Thisis commonly referred to as the Meet Over all Paths (MOP).In Figure 1, the MOP would be calculated by testing a
2
void *a = alloc();if (cond(a)) { free(a); return NULL;}return a;
void *f() {
}
void *b = f();printf("%p\n",b);return 1;
int main(void) {
}
123456
789
a = alloc();
cond(a)
free(a);
return;
b = f();
printf("%p\n",b);
return;
b
NULL
allocnode
a
alloc node
a = alloc();
b = f();
a) Program Code b) Inter-procedural Control-Flow Graph c) Pointer Assignment Graph d) Value-Flow Graph
p1p2
Figure 1: Data-flow analyses utilize graphs to reason about program behavior at compile time.
property against the two alternative program paths p1 and p2.Unfortunately, in the general case the MOP solution was shownto be undecidable by reduction to the post correspondenceproblem [36].
However, the MOP can be approximated through a so-called Monotone Framework, which is a set of mathematicallydefined objects and rules to analyze program behavior. At theheart of the monotone framework is a lattice, i.e., a partialorder with a unique least upper bound that must be defined overthe domain of all possible values during program execution.Further, the analysis framework must specify monotone flowfunctions that define how program statements effect latticeelements (the monotony requirement ensures termination ofthe analysis). Finally, sets of domain elements (i.e., values)must be combined using a merge operator. A commonlyused definition for points-to analysis is the domain of points-to sets for all pointers in a program. The flow functionsthen select all program statements, which potentially modifyany pointer relations and specify their target transitions inthe lattice. The merge operator defines how to combine theresulting points-to sets for such a transition. The notion of themonotone framework is significant for static program analysis:for any monotone framework, there exists a Maximum FixedPoint (MFP) solution, which safely approximates the MOPsolution [36]. If the flow functions are distributive under themerge operator that is defined by the lattice, the MFP solutionis identical to the MOP solution. The montone framework isthen called a distributive framework, and data-flow analysisproblems can be solved efficiently by solving a correspondinggraph reachability problem [54].
B. Memory-corruption vulnerabilities
Memory-corruption vulnerabilities represent a vast num-ber of security relevant bugs for operating system software(e.g., [12], [10]). Run-time attacks exploit such bugs to injectmalicious code, reuse existing code with a malicious input,or corrupt integral data structures to obtain higher privileges.Memory-corruption vulnerabilities are often classified accord-ing to their root defect: integer overflows (IO), use-after-
free (UAF), dangling pointers (DP), double free (DF), bufferoverflow (BO), missing pointer checks (MPC), uninitializeddata (UD), type errors (TE), or synchronization errors (SE) arecommonly listed classes of memory corruption [11], [60]. Anyinstance of memory corruption leaves the program vulnerableto run-time attacks: each class represents a violation of well-defined program behavior as specified by the programming-language standard or the compiler, and hence, the violatingprogram can exhibit arbitrary behavior at run time. For thisreason an adversary with knowledge about any such vulner-ability can exploit the program by deliberately triggering theerror to achieve unintended, malicious behavior.
For an operating system, the main interface which exposeskernel code to a user space adversary are system calls [61].In our approach we combine different data-flow analysispasses for the classes listed above to report potential bugs inkernel code, which are accessible to a user space programthrough the system call interface. Since memory-corruptionvulnerabilities account for many real-world exploits [60], wefocus on reporting instances of dangling pointers (DP), user-after-free (UAF), and double free (DF) in our proof-of-conceptimplementation. For instance, dangling-pointer vulnerabilitiesoccur when a memory address is assigned to a pointer vari-able, and the memory belonging to that address subsequentlybecomes unavailable, or invalid. For heap allocations this canhappen, e.g., when a memory location is freed but the pointeris still accessible. For stack-based allocations this happenswhen the stack frame containing the allocated object becomesinvalid, e.g., due to a nested return statement in or below thescope of the allocation. Our framework is extensible such thatnew analyses passes can be integrated to search for additionalvulnerability classes (cf., Section VI).
III. K-MINER
In this section, we explain our threat model, introducethe high-level design of K-Miner, and elaborate on challengesto enable precise, inter-procedural static analysis of complex,real-world kernels.
3
A. Goals and assumptions
With K-Miner we aim to identify and report potentialmemory-corruption bugs in the kernel’s user-space interface, sothat developers can fix them before shipping code that includessuch vulnerabilities. Regarding potential malicious processes atrun time we make the following standard assumptions:
• The attacker has control over a user-space process andcan issue all system calls to attack the kernel through thesubverted process.
• The operating system is isolated from user processes,e.g., through virtual memory and different privilege levels.Common platforms like x86 and ARM meet this require-ment.
• An adversary cannot insert malicious code into the kernelthrough modules, because modern operating systems re-quire kernel modules to be cryptographically signed [45],[48], [3].
• K-Miner should reliably report memory-corruption vul-nerabilities that can be triggered by a malicious process.
Our assumptions force the attacker to exploit a memory-corruption vulnerability in the kernel code to gain kernelprivileges through a purely software-based attack. The goalof K-Miner is to systematically scan the system call interfacefor these vulnerabilities.
Since real-world adversaries are not limited to softwarevulnerabilities, it is important to note that even with a com-pletely verified kernel (e.g., seL4) hardware attacks such asrowhammer [42], [55] still pose a serious threat to the integrityof the kernel. However, for our work we consider hardwareimplementation defects to be an orthogonal problem [7].
B. Overview
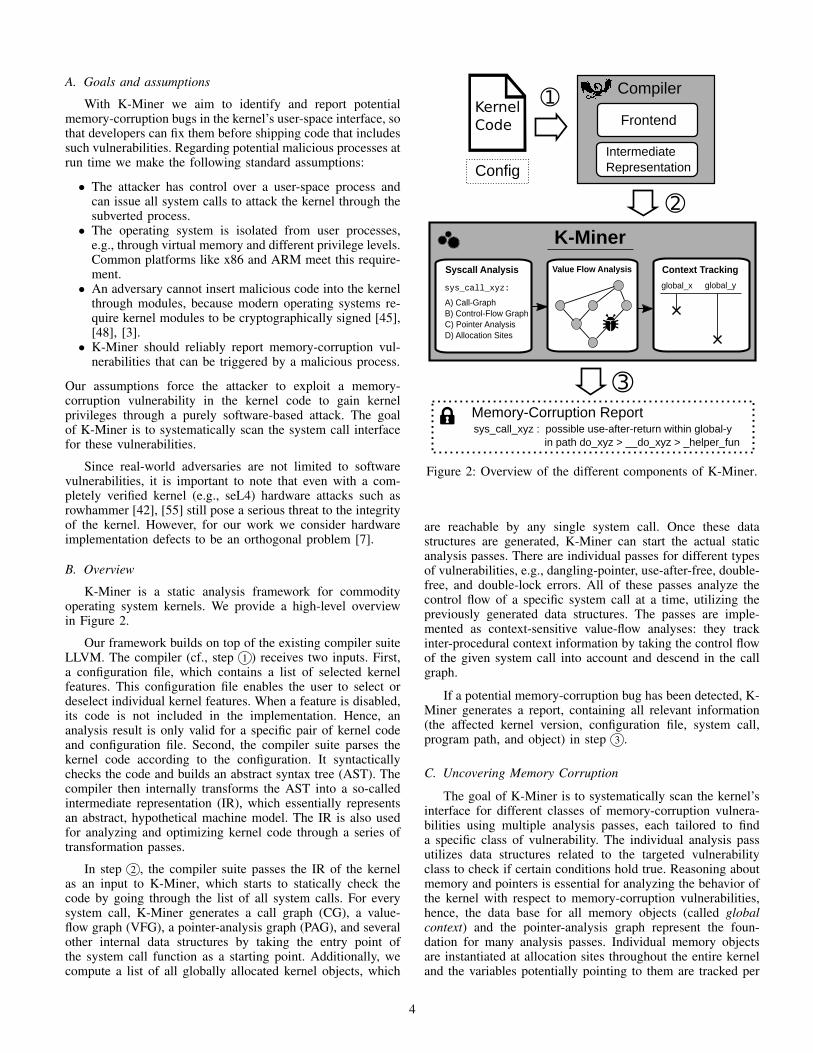
K-Miner is a static analysis framework for commodityoperating system kernels. We provide a high-level overviewin Figure 2.
Our framework builds on top of the existing compiler suiteLLVM. The compiler (cf., step 1 ) receives two inputs. First,a configuration file, which contains a list of selected kernelfeatures. This configuration file enables the user to select ordeselect individual kernel features. When a feature is disabled,its code is not included in the implementation. Hence, ananalysis result is only valid for a specific pair of kernel codeand configuration file. Second, the compiler suite parses thekernel code according to the configuration. It syntacticallychecks the code and builds an abstract syntax tree (AST). Thecompiler then internally transforms the AST into a so-calledintermediate representation (IR), which essentially representsan abstract, hypothetical machine model. The IR is also usedfor analyzing and optimizing kernel code through a series oftransformation passes.
In step 2 , the compiler suite passes the IR of the kernelas an input to K-Miner, which starts to statically check thecode by going through the list of all system calls. For everysystem call, K-Miner generates a call graph (CG), a value-flow graph (VFG), a pointer-analysis graph (PAG), and severalother internal data structures by taking the entry point ofthe system call function as a starting point. Additionally, wecompute a list of all globally allocated kernel objects, which
KernelCode
Compiler
Frontend
Config
➀
K-Miner
Value Flow AnalysisSyscall Analysis
sys_call_xyz:
A) Call-GraphB) Control-Flow GraphC) Pointer AnalysisD) Allocation Sites
Context Tracking
global_x global_y
➁
sys_call_xyz : possible use-after-return within global-y in path do_xyz > __do_xyz > _helper_fun
Memory-Corruption Report
➂
IntermediateRepresentation
Figure 2: Overview of the different components of K-Miner.
are reachable by any single system call. Once these datastructures are generated, K-Miner can start the actual staticanalysis passes. There are individual passes for different typesof vulnerabilities, e.g., dangling-pointer, use-after-free, double-free, and double-lock errors. All of these passes analyze thecontrol flow of a specific system call at a time, utilizing thepreviously generated data structures. The passes are imple-mented as context-sensitive value-flow analyses: they trackinter-procedural context information by taking the control flowof the given system call into account and descend in the callgraph.
If a potential memory-corruption bug has been detected, K-Miner generates a report, containing all relevant information(the affected kernel version, configuration file, system call,program path, and object) in step 3 .
C. Uncovering Memory Corruption
The goal of K-Miner is to systematically scan the kernel’sinterface for different classes of memory-corruption vulnera-bilities using multiple analysis passes, each tailored to finda specific class of vulnerability. The individual analysis passutilizes data structures related to the targeted vulnerabilityclass to check if certain conditions hold true. Reasoning aboutmemory and pointers is essential for analyzing the behavior ofthe kernel with respect to memory-corruption vulnerabilities,hence, the data base for all memory objects (called globalcontext) and the pointer-analysis graph represent the foun-dation for many analysis passes. Individual memory objectsare instantiated at allocation sites throughout the entire kerneland the variables potentially pointing to them are tracked per
4

system call using the PAG. Forward analysis then reasonsabout the past behaviour of an individual memory location,whereas a backward analysis determines future behaviour(since a forward analysis processes past code constructs beforeprocessing future code and vice versa).
We can also combine such analysis passes, for instance,to find double-free vulnerabilities: first, we determine sourcesand sinks for memory objects, i.e., allocation sites and thecorresponding free functions respectively. We then processthe VFG in the forward direction for every allocation site todetermine reachable sinks. Second, we reconstruct the resultingpaths for source-sink pairs in the execution by following sinksin the backward direction. Finally, we analyze the forwardpaths again to check for additional sinks. Since any pathcontaining more than one sink will report a duplicate de-allocation this approach suffers from a high number of falsepositives. For this reason, we determine if the first de-allocationinvocation dominates (i.e., is executed in every path leading to)the second de-allocation invocation in the validation phase.
In similar vein we provide passes that are checking forconditions indicating dangling pointers, use-after-free, anddouble-lock errors. We provide more detailed examples forthe implementation of such passes in Section IV.
D. Challenges
Creating a static analysis framework for real-world operat-ing systems comes with a series of difficult challenges, whichwe briefly describe in this section. In Section IV we explainhow to tackle each challenge in detail.
Global state.Most classes of memory-corruption vulnerabilities deal withpointers, and the state or type of the objects in memory thatthey point to. Conducting inter-procedural pointer analysesposes a difficult challenge regarding efficiency. Because inter-procedural analysis allows for global state, local pointer ac-cesses may have non-local effects due to aliasing. Since ouranalyses are also flow-sensitive, these aliasing relationships arenot always static, but can also be updated while traversingthe control-flow graph. To enable complex global analyses,we make use of sparse program representations: we only takevalue flows into account that relate to the currently analyzedcall graph and context information.
Huge codebase.The current Linux kernel comprises more than 24 millionlines of code [14], supporting dozens of different architectures,and hundreds of drivers for external hardware. Since K-Minerleverages complex data-flow analysis, creating data structuresand dependence graphs for such large amounts of programcode ultimately results in an explosion of resource require-ments. We therefore need to provide techniques to reduce theamount of code for individual analysis passes without omittingany code, and allowing reuse of intermediate results. Bypartitioning the kernel according to the system call interface,we are able to achieve significant reduction of the number ofanalyzed paths, while taking all the code into account, andallowing reuse of important data structures (such as the kernelcontext).
False positives.False positives represent a common problem of static analysis,caused by too coarse-grained over approximation of possibleprogram behavior. Such over approximation results in a highnumber of reports that cannot be handled by developers. K-Miner has to minimize the number of false positives to anabsolute minimum. As the number of false positives dependsgreatly on the implementation of the individual analysis passeswe carefully design our analyses to leverage as much infor-mation as possible to eliminate reports that require impossiblecases at run time, or make too coarse-grained approximations.Moreover, we sanitize, deduplicate, and filter generated reportsbefore displaying them for developers in a collaborative, web-based user interface.
Multiple analyses.A comprehensive framework needs to be able to eliminate allpossible causes of memory corruption. This is why K-Minermust be able to combine the results of many different analyses.Additionally, individual analyses may depend on intermediateresults of each other. Hence, our framework has to be able tosynchronize these with respect to the currently inspected codeparts. To this end we leverage the modern pass infrastructureof LLVM to export intermediary results and partially re-importthem at a later point in time.
IV. IMPLEMENTATION
In this section we describe our implementation of K-Miner,and how we tackle the challenges mentioned in Section III-D.Our framework builds on the compiler suite LLVM [46] andthe analysis framework SVF [59]. The former provides the ba-sic underlying data structures, simple pointer analysis, a pass-infrastructure, and a bitcode file format which associates thesource language with the LLVM intermediate representation(IR). The latter comprises various additional pointer analysesand a sparse representation of a value-flow dependence graph.
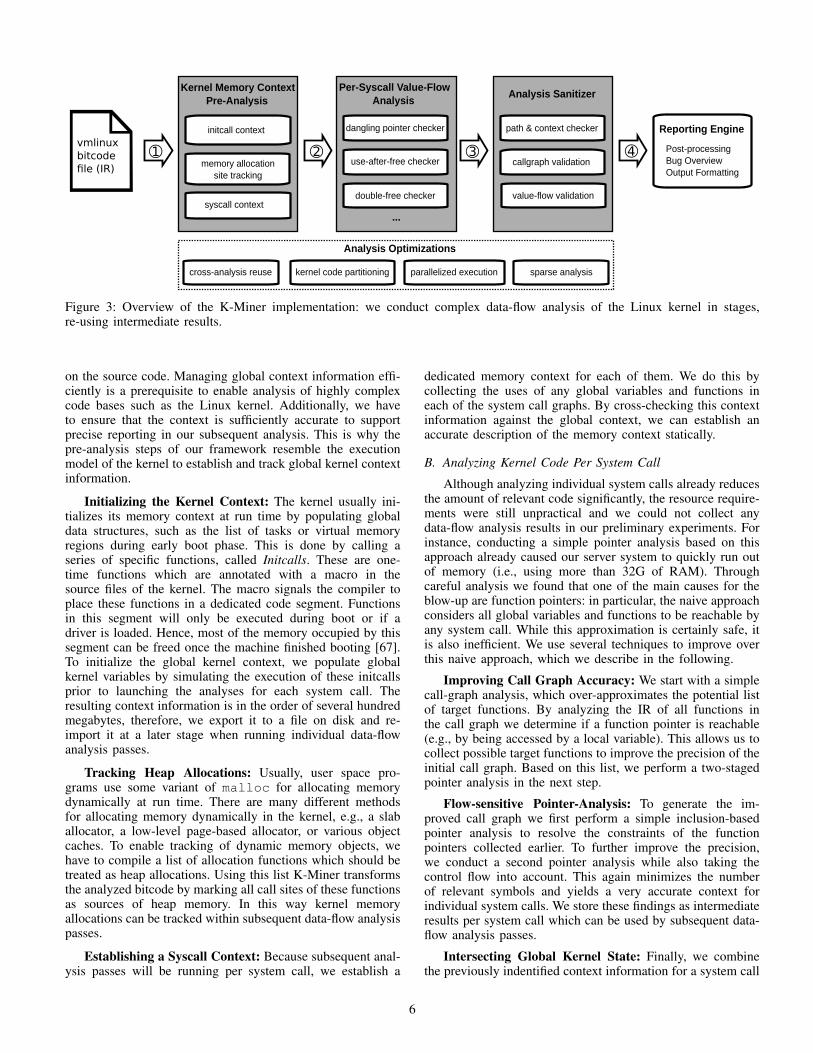
Since it is possible to compile the Linux kernel withLLVM [69], we generate the required bitcode files by modi-fying the build process of the kernel, and link them togetherto generate a bitcode version of the kernel image. This imagefile can then be used as input for K-Miner. Figure 3 depictsthe structure of our framework implementation. In particular,it consists of four analysis stages: in step 1 , the LLVM-IR ispassed to K-Miner as a vmlinux bitcode image to start a pre-analysis, which will initialize and populate the global kernelcontext. In step 2 , this context information is used to analyzeindividual system calls. It is possible to run multiple analysispasses successively, i.e., our dangling pointer, use-after-free,and double-free checkers, or run each of them independently.In step 3 , bug reports are sanitized through various validationtechniques to reduce the number of false positives. In step 4 ,the sorted reports are rendered using our vulnerability reportingengine. In the following, we describe each of the steps in moredetail and explain how each of them tackles the challengesidentified in the previous section.
A. Global Analysis Context
The global context stored by K-Miner essentially representsa data base for all the memory objects that are modeled based
5
➂ ➃➀ ➁memory allocation
site tracking
Kernel Memory Context Pre-Analysis
dangling pointer checker
use-after-free checker
double-free checker
Per-Syscall Value-Flow Analysis
initcall context
syscall context...
path & context checker
callgraph validation
value-flow validation
cross-analysis reuse kernel code partitioning parallelized execution sparse analysis
Analysis Sanitizer
Analysis Optimizations
vmlinuxbitcodefile (IR)
Reporting Engine
Post-processingBug OverviewOutput Formatting
Figure 3: Overview of the K-Miner implementation: we conduct complex data-flow analysis of the Linux kernel in stages,re-using intermediate results.
on the source code. Managing global context information effi-ciently is a prerequisite to enable analysis of highly complexcode bases such as the Linux kernel. Additionally, we haveto ensure that the context is sufficiently accurate to supportprecise reporting in our subsequent analysis. This is why thepre-analysis steps of our framework resemble the executionmodel of the kernel to establish and track global kernel contextinformation.
Initializing the Kernel Context: The kernel usually ini-tializes its memory context at run time by populating globaldata structures, such as the list of tasks or virtual memoryregions during early boot phase. This is done by calling aseries of specific functions, called Initcalls. These are one-time functions which are annotated with a macro in thesource files of the kernel. The macro signals the compiler toplace these functions in a dedicated code segment. Functionsin this segment will only be executed during boot or if adriver is loaded. Hence, most of the memory occupied by thissegment can be freed once the machine finished booting [67].To initialize the global kernel context, we populate globalkernel variables by simulating the execution of these initcallsprior to launching the analyses for each system call. Theresulting context information is in the order of several hundredmegabytes, therefore, we export it to a file on disk and re-import it at a later stage when running individual data-flowanalysis passes.
Tracking Heap Allocations: Usually, user space pro-grams use some variant of malloc for allocating memorydynamically at run time. There are many different methodsfor allocating memory dynamically in the kernel, e.g., a slaballocator, a low-level page-based allocator, or various objectcaches. To enable tracking of dynamic memory objects, wehave to compile a list of allocation functions which should betreated as heap allocations. Using this list K-Miner transformsthe analyzed bitcode by marking all call sites of these functionsas sources of heap memory. In this way kernel memoryallocations can be tracked within subsequent data-flow analysispasses.
Establishing a Syscall Context: Because subsequent anal-ysis passes will be running per system call, we establish a
dedicated memory context for each of them. We do this bycollecting the uses of any global variables and functions ineach of the system call graphs. By cross-checking this contextinformation against the global context, we can establish anaccurate description of the memory context statically.
B. Analyzing Kernel Code Per System Call
Although analyzing individual system calls already reducesthe amount of relevant code significantly, the resource require-ments were still unpractical and we could not collect anydata-flow analysis results in our preliminary experiments. Forinstance, conducting a simple pointer analysis based on thisapproach already caused our server system to quickly run outof memory (i.e., using more than 32G of RAM). Throughcareful analysis we found that one of the main causes for theblow-up are function pointers: in particular, the naive approachconsiders all global variables and functions to be reachable byany system call. While this approximation is certainly safe, itis also inefficient. We use several techniques to improve overthis naive approach, which we describe in the following.
Improving Call Graph Accuracy: We start with a simplecall-graph analysis, which over-approximates the potential listof target functions. By analyzing the IR of all functions inthe call graph we determine if a function pointer is reachable(e.g., by being accessed by a local variable). This allows us tocollect possible target functions to improve the precision of theinitial call graph. Based on this list, we perform a two-stagedpointer analysis in the next step.
Flow-sensitive Pointer-Analysis: To generate the im-proved call graph we first perform a simple inclusion-basedpointer analysis to resolve the constraints of the functionpointers collected earlier. To further improve the precision,we conduct a second pointer analysis while also taking thecontrol flow into account. This again minimizes the numberof relevant symbols and yields a very accurate context forindividual system calls. We store these findings as intermediateresults per system call which can be used by subsequent data-flow analysis passes.
Intersecting Global Kernel State: Finally, we combinethe previously indentified context information for a system call
6

a) Pseudo Systemcall b) Pointer Assignment Graph (PAG)
global_o
local_x
p
global_p
local_o
1
2
3
4
5
6 local_x
4
2
5
6
do_foo
remove_x
add_x
1
global_p
3
c) Value-Flow Graph (VFG)
void sys_foo() {
}
1 do_foo();2 return;
void do_foo() {
}
3 int local_x = 1;4 add_x(&local_x);5 if (cond())6 remove_x();7 return;
void add_x(int *p) {
}
8 global_p = p;
void remove_x() {
}
9 global_p = NULL;
null
null
Figure 4: Example of a Dangling Pointer vulnerability in a (simplified) system call definition.
with the global kernel context. We do this by determiningthe global variables of a system call that contain missingreferences and intersecting these with the list of variables ofthe global kernel context populated earlier. While possiblyincreasing the context information our precision improventsprevent an infeasible blow-up in this last step.
C. Minimizing False Positives
False positives are a common problem in static analysis andfrequently occur when over-approximating program behavior:for instance, an analysis may assume an alias relationshipbetween pointers that do not co-exist at run time, if the controlflow is not taken into account. In the following, we explain howwe designed our analysis to be precise and reduce the numberof false positives, using dangling pointers as an example. Wealso provide details on how K-Miner sanitizes the resultingbug reports to further limit the number of false positives.
Precise Data-Flow Analysis: Figure 4 a) shows the codeof a pseudo system call with a dangling pointer bug. In step 1 ,the address of the local variable in do_foo is copied into theparameter p of add_x and subsequently stored in the globalpointer global_p in step 2 . In step 3 , we can see thatremove_x will only be called conditionally. Hence, there is apath for which global_p still points to the address of a localvariable after execution of do_foo has returned. Looking atthe PAG in Figure 4b) reveals that local_o and global_orepresent the abstract memory objects behind these possiblepointer values. The (simplified) VFG in Figure 4c) shows thecorresponding value flows. Our algorithm to find these kindsof bugs consists of two phases: first, we traverse the VFG inforward order starting from local nodes. A reference to a localnode leaves its valid scope, if the number of function exits isgreater than the number of function entries after traversing the
entire path. For the node local_x we can see, that there isone entry to add_x, an exit from add_x, and an exit fromdo_foo at the end of the path. Consequently, there is a pathfor which local_x leaves its valid scope, i.e., local_x→1 → 2 → 3 → 5 → 6 .
In the second phase we traverse the VFG in backwarddirection to find (global or local) references to this node,since any such reference represents a dangling pointer. In thiscase the second phase yields the path 6 → 5 → 3 →2 → global_p. By querying the PAG dynamically during
backward traversal we avoid visiting edges that do not belongto the currently tracked memory location such as 5 → 4 .This allows us to minimize inaccuracies resulting from over-approximation. We store the respective path information alongwith the list of nodes and contexts they were visited in asmemory-corruption candidate for sanitizing and future report-ing.
Sanitizing Potential Reports: Upon completion of thedata-flow analysis, we cross-check the resulting candidates forimpossible conditions or restrictions which would prevent apath from being taken during run-time execution. Examplesfor such conditions include impossible call graphs (e.g., callto function g preceding return from function f ), or invalidcombinations of context and path information. Additionally,we eliminate multiple reports that result in the same nodes fordifferent contexts by combining them into a single report.
D. Efficiently Combining Multiple Analyses
To enable the efficient execution of multiple data-flow anal-yses, our framework makes heavy use of various optimizationsand highly efficient analysis techniques as we describe below.
Using Sparse Analysis: An important data structure inour data-flow analysis is the value-flow graph, which is a di-
7

Magnitude of Analysis Report Results
Version MLOC Bitcode Avg. Run Time #Functions #Variables #Pointers DP UAF DF
3.19 15.5 280M 796.69s 99K 433K >5M 7 (40) 3 (131) 1 (13)
4.2 16.3 298M 1435.62s 104K 466K >6M 11 (46) 2 (106) 0 (19)
4.6 17.1 298M 1502.54s 105K 468K >6M 3 (50) 2 (104) 0 (31)
4.10 22.1 353M 1312.41s 121K 535K >7M 1 (30) 2 (105) 0 (22)
4.12 24.1 364M 2164.96s 126K 558K >7.4M 1 (24) 0 (27) 1 (24)
Table I: Overview of the specifications, resource requirements, and results for the different kernel versions and data-flow passeswe used in our evaluation of K-Miner.
rected inter-procedural graph tracking any operations related topointer variables. The VFG captures the def-use chains of thepointers inside the kernel code to build a sparse representationfor tracking these accesses. The graph is created in four steps:first, a pointer analysis determines the points-to information ofeach variable. Second, the indirect definitions and uses of theaddress-taken variables are determined for certain instructions(e.g. store, load, callsite). These instructions are then annotatedwith a set of variables that will be either defined or used bythis instruction. Third, the functions are transformed into StaticSingle Assignment form using a standard SSA conversionalgorithm [17]. Finally, the VFG is created by connecting thedef-use for each SSA variable and made partially context-sensitive by labeling the edges of the callsites. Using thissparse VFG representation in a partially context-sensitive wayenables us to conduct precise analysis while reducing theamount of code.
Revisiting Functions: Using different analysis passes,functions are potentially visited multiple times with differentvalues as an input. However, one function might call dozens ofother functions and forwarding all the resulting nodes multipletimes in the same way would be very inefficient. Our analysisreduces the amount of nodes that have to be forwarded byprocessing a function only once for all of its possible contextsand storing the intermediate results. If a function entry nodeis requested by an analysis with a given context, the analysischecks if this node was already visited and re-uses the pre-computed results.
Parallelizing Execution: Because certain analysis stepscan actually run independently from each other, we imple-mented another optimization by parallelizing the forwardingand backwarding processes using OpenMP [4]. OpenMP pro-vides additional compiler directives that allow the definition ofparallel regions in the code. In this way, we process some ofthe heavy container objects used during the analysis in parallel.
V. EVALUATION
In this section, we evaluate and test our static analysisframework for real-world operating system kernels. We runour memory-corruption checkers against five different ver-sions of the Linux kernel, using the default configuration(defconfig). Our test system running K-Miner features anIntel Xeon E5-4650 with 8 cores clocked at 2.4GHz and 32G
of RAM. Table I shows an overview of the analyzed Linuxkernel specifications and results: on average, our frameworkneeds around 25 minutes to check a single system call (cf.,Avg. Time in Table I). This means that a check of the entiresystem call interface on this server with all three analyses takesbetween 70 and 200 hours for a single kernel version. 1 Inour experiments, K-Miner found 29 possible vulnerabilities,generating 539 alerts in total, most of which were classified asfalse positives (total alerts are given in parenthesis in Table I). 2
Next, we will evaluate the coverage and impact of those reportsand afterwards also discuss the performance of our frameworkin more detail.
A. Security
Since K-Miner aims to uncover memory-corruption vul-nerabilities in the context of system calls, we investigateits security guarantees by inspecting the coverage of theunderlying graph structures. To demonstrate practicality, wealso present some of the publicly known vulnerabilities wewere able to find statically using our framework.
Coverage: Our goal is to uncover all possible sourcesof memory corruption that are accessible via the system callinterface that the kernel exposes to user processes. Hence, wehave to ensure that the analysis passes for a certain class ofvulnerabilities have access to all relevant information requiredto safely approximate run-time behavior of the kernel. At thetime of writing, our framework contains passes for DP, DF,and UAF, hence, other sources of memory corruption are notcovered in this evaluation. However, K-Miner is designed tobe extensible and we are working on implementing furtheranalysis passes to cover all remaining vulnerability classes.
The most important factors for the coverage of our threeanalysis passes are their underlying analysis structures, i.e.,PAG, VFG, and context information. Because the inter-procedural value-flow graph and the context information arederived from the pointer-analysis graph, their accuracy directlydepends on the construction of the PAG. Our pointer analysismakes two assumptions: 1) partitioning the kernel code alongits system call graph is sound, and 2) deriving kernel context
1Largely depending on the respective kernel version as seen in the averagetime per system call in Table I.
2Additionally, we are still investigating 158 memory-corruption alerts forthe most recent version of Linux.
8

Figure 5: Wall-clock time per analysis phase for system calls requiring more than 30 Minutes within K-Miner.
information from init calls is complete. We would like to notethat verifying both assumptions requires a formal proof, whichis beyond the scope of this paper. However, we sketch whythese assumptions are reasonable in the following.
The first assumption is sensible, because system callsare triggered by individual processes to provide services ina synchronous manner, meaning that the calling process issuspended until execution of the system call finishes. Whileinterrupts and inter-process communication may enable otherprocesses to query the kernel asynchronously, this is orthog-onal to the partitioning of kernel code, because these operateunder a different context. In particular, our framework allowsanalyses to take multiple memory contexts into account, e.g.,to uncover synchronization errors. Individual analysis passesthen have to ensure that the associated contexts are handledaccordingly.
Our second assumption is derived from the design of theanalyzed kernel code. The init call infrastructure for Linux isquite elaborate, using a hierarchy of different levels that mayalso specify dependencies on other init calls. Additionally, initcalls are used in many different scenarios, e.g., to populatemanagement structures for virtual memory and processes dur-ing early boot, or to instantiate drivers and modules at run time.By including all init call levels following their hierarchicalordering in the pre-analysis phase, we ensure that the relevantcontext information is recorded and initialized accordingly.
Real-world Impact: We cross-checked the reported mem-ory corruptions against publicly available bug reports andfound two interesting matches. In particular, our danglingpointer analysis automatically found a bug in Linux kernelversion 3.19, which was previously discovered through manualinspection and classified as a security-relevant vulnerability inLinux in 2014 (i.e., CVE-2014-3153). In fact, this vulnerabilitygained some popularity due to being used as a tool to allowusers privilegede access (aka ”root”) on their locked-downAndroid devices, such as the Samsung S5 [30]. The bug waslater discovered to be exploited by the HackingTeam companyto spy on freedom fighters and dissidents through a maliciouskernel extension [62].
Further, our double-free analysis found a driver bug (i.e.,CVE-2015-8962) in a disk protocol driver in version 3.19. Thevulnerability allows a local user to escalate privileges and cor-rupt kernel memory affecting a large range of kernel versions
including Android devices such as Google’s PIXEL [26]. Bothvulnerabilities were classified as critical issues with a highseverity and could have been easily found through K-Miner’sautomated analysis. Moreover, we reported two of our use-after-return alerts to the kernel developers.
B. Performance
We now analyze the performance, in particular, the runtime, memory consumption, and number of false positives.
Analysis Run Time: As already mentioned, the averageanalysis time per system call is around 25 minutes. In Fig-ure 5 we give an overview of those system calls for whichour analyses took longer than 30 minutes. Most system callanalysis are dominated by the context handling. However thereare some exceptions, notably sys_execve, sys_madvise,and sys_keyctl. The context handling is time consuming,because it represents the first phase of any subsequent data-flow analysis pass. This means, that it conducts multiple inter-procedural pointer analysis, cross-references the global kernelcontext with the syscall context, and populates the underlyinggraph data structures for the current system call. This alsoinvolves importing and copying information stored on disk,which is slower than accessing RAM. In theory, it should bepossible to pre-compute and export the results of the contexthandling phase for each system call to disk as well. Any data-flow analysis pass could then just re-import the respective filefor the current system call, potentially saving some of thisoverhead (especially in combination with fast SSD hardware).However, we did not implement this optimization feature inthe current version of K-Miner.
The UAF checker is notably quicker than the remainingpasses, which is due to its reuse of underlying analysisstructures from the first pass. In contrast to the use-after-freepass, the double-free analysis has to reconstruct the value-flowgraph, which accounts for the majority of its run time. Takenseparately, the individual analysis phases require between 5and 35 minutes run time, which is expected for graph-basedanalysis, given the magnitude of the input.
Memory Utilization: Initially, our main concern regardedthe memory requirements, because of the size of the interme-diate representation of the kernel as bitcode image. However,our approach to partition the kernel per system call proved to
9

Figure 6: Maximum memory requirements of K-Miner for system calls requiring more than 11G of RAM.
be effective: on average the analyses utilized between 8.7G and13.2G of RAM, i.e., around a third of our server’s memory,with a maximum of 26G (cf., version 4.10 in Table II). Weprovide a more detailed overview for different system calls inFigure 6. Granted that these numbers also depend to a largeextent on the respective kernel version and used configuration,our overall results demonstrate that complex data-flow analysisfor OS kernels are feasible and practical. In particular, thememory requirements of K-Miner show that an analysis offuture kernel releases is realistic, even with the tendency ofnewer versions to grow in size.
While the default configuration for the kernel offers agood tradeoff between feature coverage and size, real-worlddistribution kernels usually have larger configurations, becausethey enable a majority of features for compatibility reasons.Our current memory utilization is within range of analyzingkernels with such feature models as well. Although we expectto see increased memory requirements (i.e., 128G or more),this does not meet the limit of modern hardware, and K-Mineris able to conduct such analyses without requiring any changes.
C. Usability
Our framework can be integrated into the standard buildprocess for the Linux kernel with some changes to the mainbuild files, which will then generate the required intermediaterepresentation of the kernel image. Using this bitcode imageas main input, K-Miner can be configured through a numberof command line arguments, such as number of threads,which checkers to use, and output directory for intermediateresults. Results are written to a logfile, which can be inspectedmanually or subsequently rendered using our web interface to
Version Avg. Used Max Used
3.19 8,765.08M 18,073.60M4.2 13,232.28M 24,466.78M4.6 11,769.13M 22,929.92M4.10 12,868.30M 25,187.82M4.12 13,437.01M 26,404.82M
Table II: Average and maximum memory usage of K-Miner
get an overview and check reports for false positives.
Reporting Engine: The web interface for our frameworkis written in Python. It parses the resulting logfile to constructa JSON-based data model for quick graphing and tabularpresentation. We attached screenshots in Appendix A to givean impression of an exemplified workflow. While relativelysimple, we found this web-based rendering to be extremelyhelpful in analyzing individual reports. Developers can alreadyclassify and comment upon alerts and reports, and we plan toincorporate the possibility to schedule and manage the launchand configuration of analyses from the web interface in futureversions.
False Positives: Similar to other static analysis approacheslike the Effect-Based Analyzer (EBA) [1], Coccinelle [52],Smatch [9], or APISAN [74], K-Miner naturally exhibitsa number of false positives due to the necessary over-approximations. For instance, the use-after-free analysis stillshows a high number of false alarms, and leaves room forimprovement. In particular, our investigation showed that thereare many cases in the kernel code where a conditional branchbased on a nullness check is reported as potential use-after-free. Including these cases in our sanitizer component shouldbe straightforward to further reduce this number. However,there will always be a certain number of false positives forany static analysis tool and developers have to cross-checkthese alerts, similar to how they have to check for compiler-warnings. Overall K-Miner demonstrates that this scenario ispractical through some post-processing and intelligent filteringin our web-interface.
VI. DISCUSSION
In this section we discuss our ongoing improvements ofK-Miner, various possible extensions, and future work.
A. Soundness
While K-Miner currently does not offer a proof of sound-ness, we sketched an informal reasoning of why the kernel-code partitioning along the system call API is a sensiblestrategy in Section V. There are additional challenges for aformal result: first, in some cases the kernel uses non-standardcode constructs and custom compiler extensions, which maynot be covered by LLVM. However, for these constructs the
10

LLVM Linux project maintains a list of patches, which haveto be applied to the kernel to make it compatible to the LLVMcompiler suite. Second, some pointer variables are still handledvia unsigned long instead of the correct type. Theselow-level “hacks” are difficult to handle statically, becausethey exploit knowledge of the address space organization orunderlying architecture specifics. Nonetheless, such cases canbe handled in principle by embedding the required informationin LLVM or by annotating these special cases in the source.Finally, our memory tracking component currently relies ona list of allocation functions. For cases like file descriptorsor sockets the respective kernel objects are pre-allocated fromglobally managed lists and individual objects are retrieved andidentified by referring to their ID (usually an integer number).This can be resolved by considering all objects from the samelist to be modeled as objects of the same type, and markingfunctions for retrieval as allocations.
B. Future Work
As K-Miner is designed to be a customizable and extensibleframework, implementing additional checkers is straightfor-ward. To this end, we already implemented additional double-lock and memory-leak checkers, thereby covering additionalbug classes. Up to this point we only verified that these addi-tional pass implementations are able to detect intra-proceduralbugs.3 However, as our other analysis passes in K-Miner, thedouble-lock implementation covers inter-procedural double-lock errors in principle, including bugs spanning multiplesource files. Similarly, implementing analyses to find bufferoverflows, integer overflows, or uninitialized data usage re-mains as part of our future work to cover all potential sourcesof memory corruption as mentioned in Section II.
While primarily analyzing the system call API, we foundthat analyzing the module API in a similar way should bepossible and provide interesting results, since many bugs resultfrom (especially out-of-tree) driver and module code. Althoughthis interface is not as strict as the highly standardized systemcall API, the main top-level functions of many drivers areexported as symbols to the entire kernel image, while internaland helper functions are marked as static. Hence, we shouldbe able to automatically detect the main entry points for mostmajor driver modules by looking at its exported symbols andbuilding a call graph that starts with the exported functions. Wecan then analyze this automatically constructed control flowof the drivers by applying the data-flow analysis passes to theresulting code partitions. In addition to our current approach,this would allow for an extension of our adversary model toinclude malicious devices and network protocols. We includeda prototypical draft of this functionality to analyze modulecode using K-Miner in the future.
C. Automated Proof-of-Concept Generation
Finding a valid user-space program to provide the neces-sary input data to reliably trigger a bug is non-trivial in manycases. At the same time, kernel developers will often ignorebug reports without a proof-of-concept. K-Miner’s reportsalready contain all the necessary path information, and hence,
3In particular, the lock errors introduced in commits 09dc3cf [53],e50fb58 [13], 0adb237 [18], and 16da4b1 [2] of Linus’ tree.
it should be feasible to find matching inputs that lead tothe execution of that particular path, e.g., by processing thepath constraints using a SAT-solver [21]. Alternatively, wecould leverage concolic execution [8] or selective, guidedfuzzing [58] to generate such proof-of-concepts.
D. Machine Learning
Another possible perspective for interesting future workis to combine our static analysis framework with machinelearning, such as deep learning, reinforcement learning, andclassifier systems. This would allow for the extraction ofcommon bug patterns and automated pattern mining [73], orscalable classification of generated vulnerability reports, e.g.,to build a ranking system for K-Miner’s generated reportssimilar to how APISAN handles the large number of detectedsemantic function API violations [74]. One of the problems ofmachine learning approaches is that their results highly dependon the quality of the training data [31].
VII. RELATED WORK
In this section we give a brief overview of the relatedwork and compare K-Miner to existing frameworks andtools. In contrast to dynamic run-time approaches, such asKASAN [39], TypeSan [27], Credal [71], UBSAN [40], andvarious random testing techniques [34], [35], [22], our ap-proach aims at static analysis of kernel code, i.e., operatingsolely during compile time. As there already exists a largebody of literature around static program analysis [51], [41],we focus on static analysis tools targeting operating systemkernels, and data-flow analysis frameworks for user space thatinfluenced the design of K-Miner.
It is important to note that applying static analysis frame-works designed for user space programs is not possible a prioriin the kernel setting: data-flow analysis passes expect a top-level function, and an initial program state from which analysispasses can start to propagate value flows. These requirementsare naturally satisfied by user space programs by providing amain function, and a complete set of defined global variables.However, operating systems are driven by events, such astimer interrupts, exceptions, faults, and traps. Additonally, userspace programs can influence kernel execution, e.g., by issuingsystem calls. Hence, there is no single entry point for data-flowanalysis for an operating system. With K-Miner we present thefirst data-flow analysis framework that is specifically tailoredtowards this kernel setting.
A. Kernel Static Analysis Frameworks
The Effect-Based Analyzer (EBA) [1] uses a model-checking related, inter-procedural analysis technique to finda pre-compiled list of bug patterns. In particular, it providesa specification language for formulating and finding suchpatterns. EBA provides lightweight, flow-insensitive analyses,with a focus towards double-lock bugs. Additionally, EBA re-stricts analysis to individual source files. K-Miner provides anexpressive pass infrastucture for implementing many differentcheckers, and is specifically tailored towards the executionmodel of the kernel allowing complex, context and flow-sensitive data-flow analyses, potentially spanning the entiretyof the kernel image.
11

Coccinelle [52] is an established static analysis tool thatis used on a regular basis to analyze and transform seriesof patches for the kernel. While originally not intended forsecurity analysis, it can be used to conduct text-based patternmatching without the requirement for semantic knowledge orabstract interpretation of the code, resulting in highly efficientand scalable analyses. In comparison to our framework, Coc-cinelle is not able to conduct any data-flow, or inter-proceduralanalysis.
The Source-code Matcher (Smatch) [9] is a tool based onSparse [66], a parser framework for the C language developedexclusively for the Linux kernel. Smatch enriches the Sparsesyntax tree with selected semantic information about underly-ing types and control structures, enabling (limited) data-flowanalyses. Like Coccinelle, Smatch is fast, but constrained tointra-procedural checks per source file.
APISAN [74] analyzes function usage patterns in kernelcode based on symbolic execution. In contrast to other staticanalysis approaches, APISAN aims at finding semantic bugs,i.e., program errors resulting from incorrect usage of existingAPIs. Because specifying the correct usage patterns manuallyis not feasible for large code bases, rules are inferred proba-bilistically, based on the existing usage patterns present in thecode (the idea being that correct usage patterns should occurmore frequently than incorrect usage patterns). In comparisonto K-Miner, APISAN builds on LLVM as well, but onlyconsiders the call graph of the kernel and is not able to conductany inter-procedural data-flow analyses.
TypeChef [38] is an analysis framework targeting large Cprograms, such as the Linux kernel. In contrast to our work,TypeChef focuses on variability-induced issues and analyzingall possible feature configurations in combination. For this, itprovides a variability-aware pre-processor, which extracts theresulting feature model for the kernel, e.g., by treating macroslike regular C functions. TypeChef does not conduct any data-flow analysis on their resulting variability-aware syntax tree.
B. User Space Static Analysis
The Clang Static Analyzer [46] consists of a series ofcheckers that are implemented within the C frontend Clangof the LLVM compiler suite. These checkers are invoked viacommand-line arguments during program compilation and caneasily be extended. As part of the Linux LLVM project [69]there was an effort to implement kernel-specific checkers.However, to the best of our knowledge, this effort has sincebeen abandoned.
The Static Value-Flow (SVF) [59] analysis famework en-hances the built-in analysis capabilities of LLVM with anextended pointer analysis and a sparse value-flow graph repre-sentation. K-Miner builds on top of LLVM and leverages thepointer analyses provided by SVF to systematically analyzekernel APIs, such as the system call interface.
Melange [56] is a recent data-flow analysis frameworkfor user space, that is able to conduct complex analyses tofind security-sensitive vulnerabilities, such as unitialized reads.Melange is able to analyze large C and C++ user space codebases such as Chromium, Firefox, and MySQL.
Astree [15] is a proprietary framework for formal veri-fication of C user programs for embedded systems throughelaborate static analysis techniques. It operates on synchronousprograms, i.e., analyzed code is not allowed to dynamicallyallocate memory, contain backward branches, union types, orother conflicting side effects. Astree is able to provably verifythe absence of any run-time errors in a program obeying theserestrictions and was used to formally verify the primary flightcontrol software of commercial passenger aircraft.
Soot [68] is a popular and widely used static analysisframework capable of conducting extensible and complexdata-flow analyses. However, Soot is targeted towards Javaprograms, and hence cannot analyze programs written in Cor C++.
VIII. CONCLUSION
Memory-corruption vulnerabilities represent an importantchallenge for the security of today’s operating systems. Anyinstance of one of these bugs exposes the system to a variatyof run-time attacks. Such attacks therefore pose a severethreat to the OS, since they can be launched by unprivilegeduser processes to exploit a particular vulnerability, e.g., bycorrupting memory used by the kernel to gain read and writeaccess to kernel space. This access can then be exploited toescalated privileges of the attacker process to root or achievearbitrary code execution in the kernel.
Bugs such as dangling pointers, use-after-free, doublefree, or double-lock errors are introduced through humanerror during routine programming. Since the code bases ofmodern kernels are also highly complex, many vulnerabilitiesare typically hard to find using simple text-based analysistools. Additionally, finding deeply nested vulnerabilities usingdynamic analyses, such as fuzzing, is usually difficult, as everynested layer of call indirection decreases the chances of thefuzzer to randomly trigger the required path. Furthermore,dynamic testing does not offer any guarantees in the case ofnegative results.
In this paper we present K-Miner, as the first data-flowanalysis framework targeting operating systems. We enablescalable, precise, and expressive static analysis for commoditykernels, and demonstrate high practicality by identifying crit-ical vulnerabilities. K-Miner tackles a number of challengeswith respect to the huge and highly complex code basesof modern kernels, and provides several analysis passes forfinding memory-corruption vulenrabilities such as danglingpointers, use-after-free, double free, and double-lock errors.Our extensive evaluation shows that K-Miner is able to ana-lyze recent versions of Linux in different configurations anduncover real-world vulnerabilities.
ACKNOWLEDGEMENT
The authors would like to thank Ferdinand Brasser andMathias Payer for interesting discussions and comments, aswell as the anonymous reviewers for their valuable feedback.
This work was supported in part by the German Sci-ence Foundation (project S2, CRC 1119 CROSSING), theEuropean Union’s Seventh Framework Programme (609611,PRACTICE), and the German Federal Ministry of Educationand Research within CRISP.
12

APPENDIX A: WEB INTERFACE OF K-MINER
Figure 7: Web interface overview.
Figure 8: Web interface details.
13

REFERENCES
[1] I. Abal, C. Brabrand, and A. Wasowski. Effective bug finding in cprograms with shape and effect abstractions. In International Con-ference on Verification, Model Checking, and Abstract Interpretation,pages 34–54. Springer, 2017.
[2] T. Anton. usb: phy: Fix double lock in otg fsm. https://github.com/torvalds/linux/commit/16da4b1, 2013.
[3] Apple. Kernel extensions. https : / / developer . apple . com /library/content/documentation/Security/Conceptual/System IntegrityProtection Guide/KernelExtensions/KernelExtensions.html, 2014.
[4] ArchitectureReviewBoards. Openmp. http://www.openmp.org/, 2017.
[5] A. Azab, K. Swidowski, R. Bhutkar, J. Ma, W. Shen, R. Wang, andP. Ning. Skee: A lightweight secure kernel-level execution environmentfor arm. In 23rd Annual Network and Distributed System SecuritySymposium, NDSS, 2016.
[6] C. Baumann and T. Bormer. Verifying the pikeos microkernel: Firstresults in the verisoft xt avionics project. In Doctoral Symposiumon Systems Software Verification (DS SSV’09) Real Software, RealProblems, Real Solutions, page 20, 2009.
[7] F. Brasser, L. Davi, D. Gens, C. Liebchen, and A.-R. Sadeghi.Can’t touch this: Practical and generic software-only defenses againstrowhammer attacks. arXiv preprint arXiv:1611.08396, 2016.
[8] C. Cadar, D. Dunbar, D. R. Engler, et al. Klee: Unassisted and automaticgeneration of high-coverage tests for complex systems programs. InOSDI, volume 8, pages 209–224, 2008.
[9] D. Carpenter. Smatch - the source matcher. http://smatch.sourceforge.net, 2009.
[10] H. Chen, Y. Mao, X. Wang, D. Zhou, N. Zeldovich, and M. F.Kaashoek. Linux kernel vulnerabilities: State-of-the-art defenses andopen problems. In Proceedings of the Second Asia-Pacific Workshopon Systems, page 5. ACM, 2011.
[11] S. Chen, J. Xu, E. C. Sezer, P. Gauriar, and R. K. Iyer. Non-control-data attacks are realistic threats. In 14th USENIX Security Symposium,USENIX Sec, 2005.
[12] S. Christey and R. A. Martin. Vulnerability type distributions in cve.Mitre report, May, 2007.
[13] H. Christopher. hfsplus: fix double lock typo in ioctl. https://github.com/torvalds/linux/commit/e50fb58, 2010.
[14] J. Corbet and G. Kroah-Hartman. Linux kernel development report2016. http://go.linuxfoundation.org/linux-kernel-development-report-2016, 2016.
[15] P. Cousot, R. Cousot, J. Feret, L. Mauborgne, A. Mine, D. Monniaux,and X. Rival. The astree analyzer. In European Symposium onProgramming, pages 21–30. Springer, 2005.
[16] J. Criswell, N. Dautenhahn, and V. Adve. Kcofi: Complete control-flow integrity for commodity operating system kernels. In 35th IEEESymposium on Security and Privacy, S&P, 2014.
[17] R. Cytron, J. Ferrante, B. Rosen, M. Wegman, and K. Zadeck. Anefficient method of computing static single assignment form. In Pro-ceedings of the 16th ACM SIGPLAN-SIGACT symposium on Principlesof programming languages, pages 25–35. ACM, 1989.
[18] C. Dan. drm/prime: double lock typo. https://github.com/torvalds/linux/commit/0adb237, 2013.
[19] N. Dautenhahn, T. Kasampalis, W. Dietz, J. Criswell, and V. Adve.Nested kernel: An operating system architecture for intra-kernel privi-lege separation. ACM SIGPLAN Notices, 50(4):191–206, 2015.
[20] L. Davi, D. Gens, C. Liebchen, and S. Ahmad-Reza. PT-Rand: Practicalmitigation of data-only attacks against page tables. In 24th AnnualNetwork and Distributed System Security Symposium, NDSS, 2017.
[21] L. De Moura and N. Bjørner. Z3: An efficient smt solver. Tools andAlgorithms for the Construction and Analysis of Systems, pages 337–340, 2008.
[22] D. Drysdale. Coverage-guided kernel fuzzing with syzkaller. https://lwn.net/Articles/677764/, 2016.
[23] X. Ge, N. Talele, M. Payer, and T. Jaeger. Fine-grained control-flowintegrity for kernel software. In 1st IEEE European Symposium onSecurity and Privacy, Euro S&P, 2016.
[24] D. Gens, S. Schmitt, L. Davi, and A. Sadeghi. K-Miner source code.https://github.com/ssl-tud/k-miner, 2017.
[25] C. Giuffrida, A. Kuijsten, and A. S. Tanenbaum. Enhanced operatingsystem security through efficient and fine-grained address space ran-domization. In 21st USENIX Security Symposium, USENIX Sec, 2012.
[26] Google, 2016.[27] I. Haller, Y. Jeon, H. Peng, M. Payer, C. Giuffrida, H. Bos, and
E. van der Kouwe. Typesan: Practical type confusion detection. InProceedings of the 2016 ACM SIGSAC Conference on Computer andCommunications Security, pages 517–528. ACM, 2016.
[28] B. Hardekopf and C. Lin. Flow-sensitive pointer analysis for millionsof lines of code. In Code Generation and Optimization (CGO), 20119th Annual IEEE/ACM International Symposium on, pages 289–298.IEEE, 2011.
[29] M. Hind. Pointer analysis: Haven’t we solved this problem yet?In Proceedings of the 2001 ACM SIGPLAN-SIGSOFT workshop onProgram analysis for software tools and engineering, pages 54–61.ACM, 2001.
[30] G. Hotz. towelroot by geohot. https://towelroot.com, 2015.[31] L. Huang, A. D. Joseph, B. Nelson, B. I. Rubinstein, and J. Tygar.
Adversarial machine learning. In Proceedings of the 4th ACM workshopon Security and artificial intelligence, pages 43–58. ACM, 2011.
[32] R. Hund, T. Holz, and F. C. Freiling. Return-oriented rootkits:Bypassing kernel code integrity protection mechanisms. In USENIXSecurity Symposium, pages 383–398, 2009.
[33] IEEE Computer Society - Austin Joint Working Group. 1003.1-2008 -IEEE Standard for Information Technology - Portable Operating SystemInterface (POSIX(R)). http://standards.ieee.org/findstds/standard/1003.1-2008.html, 2008.
[34] D. Jones. Trinity: A system call fuzzer. In Proceedings of the 13thOttawa Linux Symposium, pages, 2011.
[35] M. Jurczyk and G. Coldwind. Identifying and exploiting windowskernel race conditions via memory access patterns. 2013.
[36] J. B. Kam and J. D. Ullman. Monotone data flow analysis frameworks.Acta Informatica, 7(3):305–317, 1977.
[37] V. P. Kemerlis, M. Polychronakis, and A. D. Keromytis. ret2dir:Rethinking kernel isolation. In USENIX Security, pages 957–972, 2014.
[38] A. Kenner, C. Kastner, S. Haase, and T. Leich. Typechef: toward typechecking# ifdef variability in c. In Proceedings of the 2nd InternationalWorkshop on Feature-Oriented Software Development, pages 25–32.ACM, 2010.
[39] T. kernel development community. The kernel address sanitizer (kasan).https://www.kernel.org/doc/html/latest/dev-tools/kasan.html, 2014.
[40] T. kernel development community. The undefined behavior sanitizer(ubsan). https://www.kernel.org/doc/html/latest/dev-tools/ubsan.html,2014.
[41] U. Khedker, A. Sanyal, and B. Sathe. Data flow analysis: theory andpractice. CRC Press, 2009.
[42] Y. Kim, R. Daly, J. Kim, C. Fallin, J. H. Lee, D. Lee, C. Wilkerson,K. Lai, and O. Mutlu. Flipping bits in memory without accessing them:An experimental study of dram disturbance errors. In ACM SIGARCHComputer Architecture News, volume 42, pages 361–372. IEEE Press,2014.
[43] G. Klein. Operating system verification — an overview. Sadhana,34:27–69, feb 2009.
[44] G. Klein, K. Elphinstone, G. Heiser, J. Andronick, D. Cock, P. Derrin,D. Elkaduwe, K. Engelhardt, R. Kolanski, M. Norrish, et al. sel4:Formal verification of an os kernel. In Proceedings of the ACMSIGOPS 22nd symposium on Operating systems principles, pages 207–220. ACM, 2009.
[45] G. Kroah-Hartman. Signed kernel modules. http://www.linuxjournal.com/article/7130, 2004.
[46] C. Lattner and V. S. Adve. LLVM: A compilation framework forlifelong program analysis & transformation. In IEEE/ACM InternationalSymposium on Code Generation and Optimization, CGO, 2004.
[47] K. Lu, M.-T. Walter, D. Pfaff, S. Nurnberger, W. Lee, and M. Backes.Unleashing use-before-initialization vulnerabilities in the linux kernelusing targeted stack spraying. NDSS, 2017.
14
[48] Microsof. Kernel-mode code signing walkthrough. https://msdn.microsoft .com/en- us/library/windows/hardware/dn653569(v=vs.85).aspx, 2007.
[49] Microsoft. Control flow guard. http://msdn.microsoft.com/en-us/library/Dn919635.aspx, 2015.
[50] MITRE. CVE-2014-3153. http://cve.mitre.org/cgi-bin/cvename.cgi?name=CVE-2014-3153, 2014.
[51] F. Nielson, H. R. Nielson, and C. Hankin. Principles of programanalysis. Springer, 1999.
[52] Y. Padioleau, J. Lawall, R. R. Hansen, and G. Muller. Documenting andautomating collateral evolutions in linux device drivers. In Acm sigopsoperating systems review, volume 42, pages 247–260. ACM, 2008.
[53] Z. Peter. printk: avoid double lock acquire. https://github.com/torvalds/linux/commit/09dc3cf, 2011.
[54] T. Reps, S. Horwitz, and M. Sagiv. Precise interprocedural dataflowanalysis via graph reachability. In Proceedings of the 22nd ACMSIGPLAN-SIGACT symposium on Principles of programming lan-guages, pages 49–61. ACM, 1995.
[55] M. Seaborn and T. Dullien. Exploiting the dram rowhammer bug togain kernel privileges. Black Hat, 2015.
[56] B. Shastry, F. Yamaguchi, K. Rieck, and J.-P. Seifert. Towardsvulnerability discovery using staged program analysis. In Detection ofIntrusions and Malware, and Vulnerability Assessment, pages 78–97.Springer, 2016.
[57] C. Song, B. Lee, K. Lu, W. R. Harris, T. Kim, and W. Lee. Enforcingkernel security invariants with data flow integrity. In 23rd AnnualNetwork and Distributed System Security Symposium, NDSS, 2016.
[58] N. Stephens, J. Grosen, C. Salls, A. Dutcher, R. Wang, J. Corbetta,Y. Shoshitaishvili, C. Kruegel, and G. Vigna. Driller: Augmentingfuzzing through selective symbolic execution. In NDSS, volume 16,pages 1–16, 2016.
[59] Y. Sui and J. Xue. Svf: interprocedural static value-flow analysis inllvm. In Proceedings of the 25th International Conference on CompilerConstruction, pages 265–266. ACM, 2016.
[60] L. Szekeres, M. Payer, T. Wei, and D. Song. SoK: Eternal war inmemory. In 34th IEEE Symposium on Security and Privacy, S&P, 2013.
[61] A. S. Tanenbaum and A. S. Woodhull. Operating systems: design andimplementation, volume 2. Prentice-Hall Englewood Cliffs, NJ, 1987.
[62] H. Team. Hacking team futex exploit. https : / /wikileaks .org /hackingteam/emails/emailid/312357, 2014.
[63] P. Team. RAP: RIP ROP, 2015.[64] M. Tiwari, J. K. Oberg, X. Li, J. Valamehr, T. Levin, B. Hardekopf,
R. Kastner, F. T. Chong, and T. Sherwood. Crafting a usable microker-nel, processor, and i/o system with strict and provable information flowsecurity. In ACM SIGARCH Computer Architecture News, volume 39,pages 189–200. ACM, 2011.
[65] T. B. Tok, S. Z. Guyer, and C. Lin. Efficient flow-sensitive interpro-cedural data-flow analysis in the presence of pointers. In InternationalConference on Compiler Construction, pages 17–31. Springer, 2006.
[66] L. Torvalds. Sparse - a semantic parser for C. https://sparse.wiki.kernel.org/index.php/Main Page, 2006.
[67] W. Trevor. How the linux kernel initcall mechanism works. http://www.compsoc.man.ac.uk/∼moz/kernelnewbies/documents/initcall/kernel.html, 2003.
[68] R. Vallee-Rai, P. Co, E. Gagnon, L. Hendren, P. Lam, and V. Sundare-san. Soot-a java bytecode optimization framework. In Proceedings ofthe 1999 conference of the Centre for Advanced Studies on Collabora-tive research, page 13. IBM Press, 1999.
[69] B. Webster. LLVMLinux. http://llvm.linuxfoundation.org, 2014.[70] J. Xiao, H. Huang, and H. Wang. Kernel data attack is a realistic
security threat. In International Conference on Security and Privacy inCommunication Systems, pages 135–154. Springer, 2015.
[71] J. Xu, D. Mu, P. Chen, X. Xing, P. Wang, and P. Liu. Credal: Towardslocating a memory corruption vulnerability with your core dump. InProceedings of the 2016 ACM SIGSAC Conference on Computer andCommunications Security, pages 529–540. ACM, 2016.
[72] W. Xu, J. Li, J. Shu, W. Yang, T. Xie, Y. Zhang, and D. Gu. Fromcollision to exploitation: Unleashing use-after-free vulnerabilities in
linux kernel. In Proceedings of the 22nd ACM SIGSAC Conference onComputer and Communications Security, pages 414–425. ACM, 2015.
[73] F. Yamaguchi. Pattern-based vulnerability discovery. 2015.[74] I. Yun, C. Min, X. Si, Y. Jang, T. Kim, and M. Naik. Apisan:
Sanitizing api usages through semantic cross-checking. In 25th USENIXSecurity Symposium (USENIX Security 16), pages 363–378. USENIXAssociation.
15