Embed Size (px)
Citation preview

UMUDIKE JOURNAL OF ENGINEERING AND TECHNOLOGY (UJET), VOL. 1, NO. 1, JUNE. 2015 Page 106- 117
EFFECT OF DRYING TEMPERATURE ON THE FUNCTIONAL PROPERTIES OF A FERMENTED
POPCORN (ZEAMAYSEVERTA) FLOUR
Kadurumba C.H*. and Agu C.S.
Department of Mechanical Engineering Micheal Okpara University of Agriculture, Umudike, P.M.B 7267, Umuahia, Abia State,
Nigeria.
Abstract
This study was carried out to evaluate the effect of processing methods on the drying behaviour and functional properties of fermented
popcorn flour. Pop corn (ZeaMaysEvertar) grains were fermented in water for six days, drained and dried at 600C, 650C, 700C, 750C, and 800C
in a hot air oven. The grains were milled and labeled as sample A, B, C, D,E and F, respectively. The effect of temperature on the quality of
the flour produced were assessed through the physicochemical characteristics . The results obtained from proximate composition and
functional properties of fermented ZeaMayseverta flour were determined and were compared with the unfermented sample to determine the
significant difference at (P<0.05). The results for proximate composition for fermented Zea Maysevetra showed that Protein increased from
12.10 to 12.34% with increase in temperature while Fat decreased from 4.56 to 3.33%. Also Ash content decreased from 2.06 to 1.08%.
Crude Fibre content increased from 0.51 to 0.62% while Carbohydrate 72.17 to 73.68%. The results of functional properties also indicate
adecrease in bulk density as drying temperature increases. The swelling index ranged between 1.67 to 1.83 and increases as drying
temperature increases, water absorption capacity ranged between 3.32 to 3.81, oil absorption capacity ranged from 2.18 to 2.36, emulsion
capacity and gelatinization temperature ranged between 1.18 to 1.260C and 60.00 to 66.00 0C.
Keywords: FermentedPopcorn flour, Drying kinetics, Physico-chemical properties, functional properties
1. Introduction
Maize(Zea mays) commonly known as “corn” was originally
cultivated in Central America. Osagie and Eka (1998)
reported that maize is the second most important cereal
crops in Nigeria ranking behind sorghum in the number of
people itfeeds. Maize has the highest average yield per
hectare.Maize not only provide the necessary calories,
vitamins,etc. for healthy daily metabolism but also provides
medicinal benefits by controlling diabetes, lowering
hypertension and antioxidant present in maize also act as
carcinogenic agent.
*Corresponding Author: Kadurumba, C. H., (234) 08039128244; E-
mail: [email protected]
Maize kernels are used for both human consumption and
livestock feed Oyarekua and Adeyeye (2009), Iken and
Amusa (2010). According to Ristonovic (2001) about 66
percent of the maize produced globally is used for animal
nutrition, and 25 percent is for human consumption.
Humans mainly consume popcorn (Zea Mays everta) as a
versatile and nutritious snack. Popcorn provides a full
complement of nutrition benefits including dietary fiber,
protein and B-complex vitamins (Donkeun et al., 2000).
The nutritional composition of popcorn showed that it
contains 3.8-4% crude fiber, 8.1-10% crude protein, 0.07-
23% reducing sugars and 61.0-67.9% starch(amylase),
(Donkeun et al., 2000).
Popcorn hybrids(Zea Mayseverta) contain an average of
12.6% palmitic, 2.0% stearic, linoleic and linolenic acids
EFFECT OF DRYING TEMPERATURE ON THE FUNCTIONAL PROPERTIES OF A FERMENTED POPCORN (ZEAMAYSEVERTA)
FLOUR Kadurumba and Agu, 2015
UJET Vol. 1, No. 1, JUNE 2015 Page 2
respectively (Donkeun et al., 2000).Processing methods of
popcorn such as sprouting and fermentation has been
reported to improve the nutritional and functional properties
of the plant seeds (Jirapa et al., 2001; Yagoub and Adalla,
2007) Fermentation of popcorn has the potential to
enhance iron and zinc absorption (Teucher et al., 2004).
Several processing methods of popcorn has been carried
out into finished products such as flour, beer, soup,
bakeries,etc., but popcorn consumed as “Snack”.The
objective of this study was to determine the effect of drying
temperature on the drying kinetics, physicochemical and
functional properties of the fermented popcorn flour.
2. Materials and Methods
2.1 Production of Popcorn Flour
The yellow cultivar of Popcorn (Zea Mays Everta) grain
samples were obtained from the seed programme of the
National Root Crops Research Institute Umudike, Abia
state. Laboratory and other facilities were obtained at
Emery Research Laboratory located at Km 6 Ikot-Ekpene
Expressway,Ahiaeke Umuahia, Abia state.Popcorn grains
were manually cleaned to remove dirt and extraneous
materials.The sample was divided into six portions of
800g each. Five portions of the grains were soaked
differently in clean water at room temprature and left for six
days to ferment using the microorganisms naturally present
on the grain surface. The fermented grains were washed
with clean water, drained and oven-dried at different
temperatures of 60oC, 65oC, 70oC, 75oC & 80oC until a
constant weight was achieved. The dried fermented and
unfermented grains were milled using a hammer mill,
sieved using a muslin cloth 0.001mm to get a fine flour and
stored in a sealed plastic container. The flour samples
labeled sample A,B,C,D,E and F according to the drying
temperature, respectively.
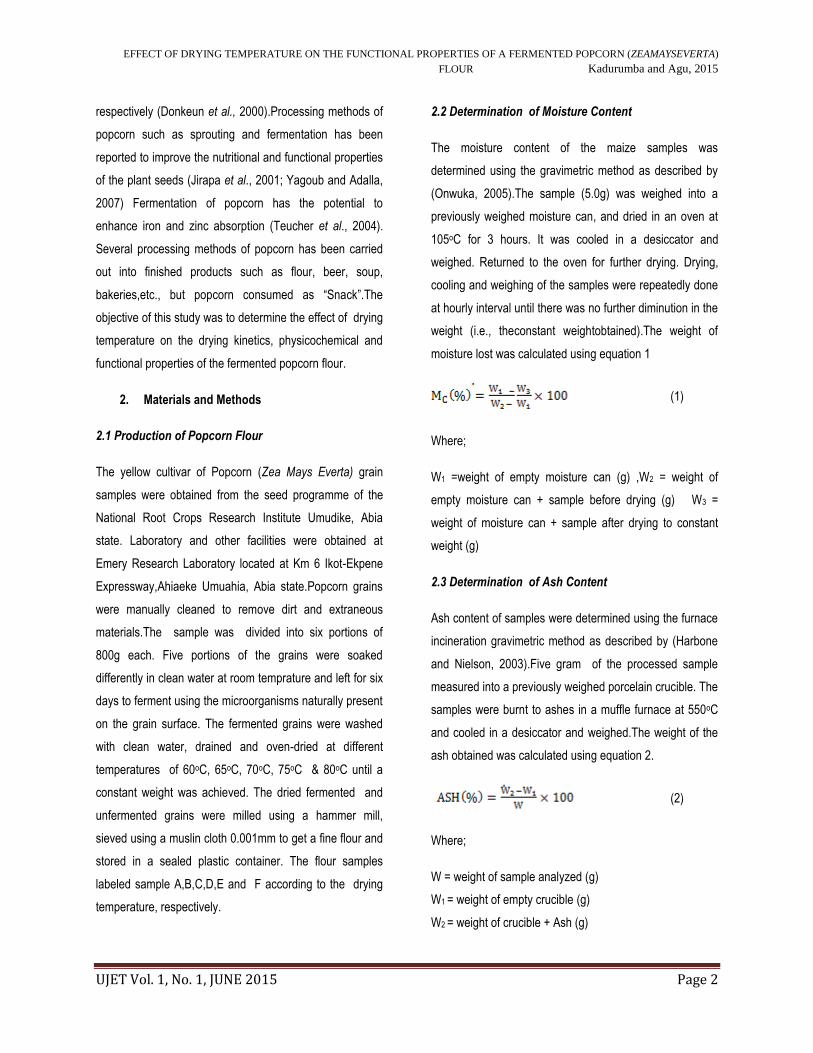
2.2 Determination of Moisture Content
The moisture content of the maize samples was
determined using the gravimetric method as described by
(Onwuka, 2005).The sample (5.0g) was weighed into a
previously weighed moisture can, and dried in an oven at
105oC for 3 hours. It was cooled in a desiccator and
weighed. Returned to the oven for further drying. Drying,
cooling and weighing of the samples were repeatedly done
at hourly interval until there was no further diminution in the
weight (i.e., theconstant weightobtained).The weight of
moisture lost was calculated using equation 1
(1)
Where;
W1 =weight of empty moisture can (g) ,W2 = weight of
empty moisture can + sample before drying (g) W3 =
weight of moisture can + sample after drying to constant
weight (g)
2.3 Determination of Ash Content
Ash content of samples were determined using the furnace
incineration gravimetric method as described by (Harbone
and Nielson, 2003).Five gram of the processed sample
measured into a previously weighed porcelain crucible. The
samples were burnt to ashes in a muffle furnace at 550oC
and cooled in a desiccator and weighed.The weight of the
ash obtained was calculated using equation 2.
(2)
Where;
W = weight of sample analyzed (g)
W1 = weight of empty crucible (g)
W2 = weight of crucible + Ash (g)

EFFECT OF DRYING TEMPERATURE ON THE FUNCTIONAL PROPERTIES OF A FERMENTED POPCORN (ZEAMAYSEVERTA)
FLOUR Kadurumba and Agu, 2015
UJET Vol. 1, No. 1, JUNE 2015 Page 3
2.4 Determination of Fat Content
Fat content of samples were determined by the continuous
solvent extraction in a Soxhlet method described by AOAC
(2000), Min and Bott (2003).Five grams from each of the
sample weighed into a previously Whatman paper and put
in a Soxhlet reflux flask. The flask was mounted into an oil
extraction flask containing 300ml petroleum ether. The
upper end of the reflux flask was connected to a
condenser. The ether flask was heated using an electronic
mantle. The samples remain in contact with the solvent
(immersed) until the flask filled up and siphoned over.Thus
carrying its extracted oil down to the boiling solvent.The
cycle of boiling and vaporizing the solvent was recovered,
and the defatted wrapped sample was carefully retrieved
using a pair of forceps The defatted sample were dried in
the oven at 105oC for an hour and weighed after cooling in
a desiccator.
Equation 3 was used to calculate the fat (ether extract) and
the fatty sampleused for crude fibre analysis.
(3)
Where;
W1 = weight of empty whatman paper (g)
W2 = weight of paper + sample before defatting (wrapped)
(g) W3 =
weight of paper + defatted sample after drying (g)
2.5 Determination of Crude Fibre
The crude fibre content of samples was determined using
the Weeden method AOAC (2000).A measured weight of
the defatted sample (5.0g) from the fat analysis was boiled
under reflux for 30 minutes in 150ml of 1.25% H2SO4
solution. After boiling for 30 minutes in the acid solution,
the sample was washed with repeated portions of hot
distilled water until the wash water was free of acid. A two-
fold muslin cloth was used to retain sample particles during
the washing. The retained particles were transferred back
to the flask and boiled in 150ml of 1.25% NaOH solution. It
was washed and poured into a weighed crucible and dried
in the oven at 105oC for an hour. It was burnt in the muffle
furnace until the only ash left of it. The weight of the fibre
was obtained and expressed as a percentage of the weight
of thesample analyzed, using equation 4.
(4)
Where;
W1 = weight of sample (g)
W2 = weight of crucible + sample after boiling, washing (g),
and drying,
W3 = weight of crucible + sample as ash (g)
2.6 Determination of Crude Protein
The crude protein content of samples were determined
using semi-micro kye dahl method as described by (Chang,
2003).A measured test sample (0.5g) mixed with 10ml of
concentrated. H2SO4 in a kyedahl digestion also stood to a
tablet of selenium catalyst and heated strongly under a firm
cupboard as the digestion process. A reagent blank
digested,and carefully diluted with distilled water. Then
transferred to a 100ml volume flask corresponding to the
mark of distilled water. An aliquot (10ml) of the digest
mixed with equal (10ml) of 45% NaOH solution in a
machan distillation apparatus.The mixture distilled, and
connected into 10ml of 40% boric acid solution containing
three drops of mixed indicator solution (methyl red and
promocresol). A total of 50ml distillate was collected and
titrated against 0.02N H2SO4 solution. The end point
colour changed from green to a deep red colour. Both the
sample and the blank reagent digest were distilled and

EFFECT OF DRYING TEMPERATURE ON THE FUNCTIONAL PROPERTIES OF A FERMENTED POPCORN (ZEAMAYSEVERTA)
FLOUR Kadurumba and Agu, 2015
UJET Vol. 1, No. 1, JUNE 2015 Page 4
titrated. Equations 5 and 6 were used respectively to
calculate the protein and nitrogen contents;
(5)
(6)
Where;
W = weight of sample analyzed (g)
N = normality (conc) of titrant (%)
Vd = total volume of digest (m3)
Va = volume of digest analyzed (m3)
T = titre volume of sample (m3)
B = blank .
2.7 Determination of carbohydrate Content
The carbohydrate content of samples were calculated by
using the difference between 100 and sum of the other
proximate components as the nitrogen free extractive
(NFE) a method separately described by (Bemiller, 2003).
Mathematically it was calculated using equation 7.
CHO(% ) = 100-% (protein + fibre + Ash + moisture
content) (7)
3. FUNCTIONAL PROPERTIES OF POPCORN
(ZEA MAYSEVERTA)
3.1 Bulk Density of Popcorn (Zea Mayseverta)
The method given by (Okaka and Porter, 1997) was used
to determine the bulk density of samples .Ten gram of the
flour samples was weighed into a graduated cylinder, and
its volume was recorded. The bottom of the cylinder was
repeatedly tapped on a pad placed on a laboratory bench.
Tapping was done until there was no further reduction in
volume by the sample.
The bulk density was calculated using equation 8.
(8)
3.2 Emulsion Capacity of Popcorn (Zea Mayseverta)
The method given by Okezie and Bello (1998), as
described by Onwuka (2005), was employed.One gram of
the sample mixed with 25ml of distilled water and blended
in a laboratory wave(micro) blender for 30 seconds. On
complete digestion, 25ml of vegetable oil was added to it
and blended for 60 seconds. The mixture quickly
transferred to a graduated cylinder and after 15 minutes
the entire height was measured as well as the height of the
emulsion layer.Emulsion capacity is calculated using
equation 9.
(9)
Where; EC= Emulsion Capacity (%), H = height of
emulsion layer in cylinder(ml), W = total weight of the entire
mixture in cylinder (g)
3.3 Swelling Index of Popcorn(Zea Mayseverta)
Swelling index of the pop corn samples were determined
as the ratio of the size of unit weight of the sample when
swollen (in the presence of water) to its original size in a
dry form. The method given by Onwuka (2005) was
used.One gram of the flour sample weighed into a clean
dry test tube, with the aid of a meter quarter ruler; the initial
height was allowed to stand for 30 minutes without
disturbance. At the end, the height of the swollen sample
EFFECT OF DRYING TEMPERATURE ON THE FUNCTIONAL PROPERTIES OF A FERMENTED POPCORN (ZEAMAYSEVERTA)
FLOUR Kadurumba and Agu, 2015
UJET Vol. 1, No. 1, JUNE 2015 Page 5
was measured with the same ruler and recorded. The
swelling index was determined using equation (10).
(10)
Where;
H1 = initial height of dry sample (ml)
H2 = final height of sample when swollen (ml)
3.4 Water Absorption Capacity of Popcorn(Zea
Mayseverta)
Water absorption capacity of the samples were
determined by the method given by Abbey and Ibeh
(1998).One gram of the sample was weighed and
transferred into a clean centrifuge tube of known weight.
Distilled water was mixed with the four to make up to 10ml
dispersion. This was centrifuged at 3500rpm for
15minutes. The Supermatant was decanted and the tube
with its content reweighed.The gain of the mass of water
absorption capacity of flour was calculated using equation
(11).
(11)
Where;
W = weight of sample (g)
W1 = weight of empty tube (g)
W2 = weight of tube + water absorbed (g)
3.5 Oil Absorption Capacity of Popcorn(Zea
Mayseverta)
The method given by Abbey and Ibeh (1988) was used in
determining the oil absorption capacity.The flour sample
was weighed and placed in a clean centrifuge tube of a
known weight. Groundnut oil mixed with the flour to a 10ml
dispersion. The tubes were discarded, and its content
reweighed.The gain in the mass recorded as the oil
absorption capacity. It was calculated using the equation
12.
(12)
Where;
W = weight of sample (g) W1 = weight of empty tube (g)
W2 = weight of tube + oil absorbed (g)
3.6 Gelatinization Temperature of Popcorn(Zea
Mayseverta)
Gelatinization temperature is determined using the method
given by Onwuka (2005) .Ten percent suspension of the
flour samples prepared in a test tube. The aqueous
suspension-heated in a boiling water bath with a
continuous stirring; the temperature was recorded 30
seconds after gelatinization visually noticed as the
gelatinization temperature.
4. PHYSICAL PROPERTIES OF POPCORN(ZEA
MAYSEVERTA)
4.1 Determination of pH
PH of the sample determined by cocomel electrode meter
direct reading method (Sadler and Murphy, 2003). The log
of sample dispensed into a clean glass 20ml beaker. The
pH meter was set up according to the manufacturer
instructions. Switched on and allowed to equilibrate for 10
mintues and then calibrated with a buffer solution of pH
7..0. To measure into the sample in the beaker and its pH
value was read directly from the screen when the figures
were steady.

EFFECT OF DRYING TEMPERATURE ON THE FUNCTIONAL PROPERTIES OF A FERMENTED POPCORN (ZEAMAYSEVERTA)
FLOUR Kadurumba and Agu, 2015
UJET Vol. 1, No. 1, JUNE 2015 Page 6
4.2 Determination of Total Titrable Acid
The titrable acidity of the samples was determined using
the titrimetric alkaline method as described by (Sadler and
Murphy, 2003).Five grams of the samples mixed with 45ml
of distilled water in a clean glass beaker and the drops of
phenolphthalein indicator solution added to it. The mixture
titrated against 0.1N NaOH solution. Titrate to an endpoint
marked by a faint pink coloration that persisted for more
than 15 seconds.
The titrable acidity of the sample was calculated using
equation 13
. (13)
Where;
w = weight percent of sample,
N = Normality of the titrant (NaOH)
5. Results and Discussions
Drying kinetics is used to describe the combined
macroscopic and microscopic mechanism of heat and
mass transfer to wet food substances used in carrying out
analysis. Mintab 17.0 software was used for the statistical
analysis.
The result after Popcorn(ZeaMaysEverta) grains were
soaked, fermented for 144 hours ( six days), drained and
dried in hot oven gave a drying pattern of falling rate period
of moisture loss. Table 1. Shows the drying pattern of the
fermented maize grains at different temperature ranges.
Table 1. The Drying Pattern of the Fermented Popcorn Grains
Temperature (0C)
Duration of drying (hours)
Initial weight(kg)
Final weight(kg)
600C 7 0.8kg 0.6kg
650C 7 0.8kg 0.6kg
700C 6 0.85kg 0.55kg
750C 5 0.6kg 0.45kg
800C 4 0.8kg 0.55kg
Fig. 1: Surface plot of moisture content (%wb)Vs temperature,
Time of drying (hrs) for fermented porpcorn grains.
Figure 1 shows the graphical description on drying kinetics
of fermented popcorn grains at temperature ranges of
60oC, 65 oC, 70 oC, 75 oC and 80 oC. The graph of the
samples exhibited a falling rate pattern. This pattern agrees
withmost agricultural products that exhibit falling rate period
as described by Velic et al. (2007).In figure1, it took 4
hours for weight loss from 0.8kg to 0.55kg at adrying
temperature of 800C. Also, it took 5 hours to bring down the
weight loss of the sample from 0.6kg−0.45kg at a drying

EFFECT OF DRYING TEMPERATURE ON THE FUNCTIONAL PROPERTIES OF A FERMENTED POPCORN (ZEAMAYSEVERTA)
FLOUR Kadurumba and Agu, 2015
UJET Vol. 1, No. 1, JUNE 2015 Page 7
temperature of 750C. The result of the analysis shows that
the higher the temperature, the higher the moisture
removal.Also the lower the temperature, the lower the
drying and moisture removal from the popcorn grains. The
greater the temperature difference between the drying air
and the food, the greater the heat transfer to the food and
faster the moisture removal from the grains. This
observation was earlier reported by Bella Agha et al.
(2002). From the result, thedrying rate was faster at 800C
than at the lower temperatures of 650C and 600C.
The proximate composition of the fermented and
unfermented popcorn flour samples is presented in Table
2.
Protein: The results showed that the protein values
increases as the temperature increases, this implies
positive correlation. The values for fermented samples (A-
E) were higher compared with the unfermented sample (F).
The increase in the protein content was as a result of
increased microbial mass during fermentation period
causing extensive hydrolysis of protein molecules to amino
acid and other single peptides. The increase also
corresponds to the observation of Michodjehoun et al.
(2005) on the increase in protein content from 7.9 −10%
during fermentation of Millet. The protein content also
increased as temperature increases which imply
concentration of nutrients compounds as drying
temperature increases.
Fat: The fat (in table 2) showed a significant decrease
(P<0.05) with an increase in drying temperature, the values
ranged 3.61−3.39 for fermented samples (Table 3
(ANOVA)). The results were lower when compared with
values (3.7%) obtained by Onesmo (2011) for sorghum.
The low-fat content implies that the samples are no
substitute to rancidity.
Moisture: The moisture content of fermented samples
ranged from 9.58−9.53%dbwith the samples dried at 70oC
−75oC. The reasons for the variations may be due to
gelling of the starchy part of the grain that results in
restricting of water molecule moving from the interior to the
exterior. However, the value 8.75 was obtained in thestudy.
High moisture content in food materials results in (low shelf
life/ storability), high microbial activity which results in high
spoilage rate.
Ash: Ash content of fermented dried samples (A-E) were
significantly different (P<0.05) and lower than the
unfermented sample (F). This variation might be due to the
fact that most minerals leach out during fermentation.
Onimawo and Egbekun (2002)
described Ash content as an index of total mineral content
of the food material.
Crude Fibre: The results revealed asignificant difference
(P<0.05) between samples evaluated. However, the values
were within the range 0.51−0.62 for fermented samples,
the values for unfermented was higher 1.10. The crude
fibretends to increase as drying temperature increases
(figure 2c). El-Tinay et al. reported that the crude fibre
tends to decrease during fermentation. This decrease may
be due to microbial activities that breakdown the cellulose
materials and utilize them for their growth.
Carbohydrate: The CHO content range between 71−73%.
The values were within the range obtained by Ijabadeniyi
and Adebolu(2005). The carbohydrate in food is amajor
source of energy.

EFFECT OF DRYING TEMPERATURE ON THE FUNCTIONAL PROPERTIES OF A FERMENTED POPCORN (ZEAMAYSEVERTA)
FLOUR Kadurumba and Agu, 2015
UJET Vol. 1, No. 1, JUNE 2015 Page 8
Table 2: Proximate Composition of Fermented and Unfermented Popcorn
Key: A−E (Fermented popcorn), F (Unfermented popcorn) and LSD (least significant difference)
(a)
(b)
(c)
Fig.2 :(a-c): Surface plot of Temperature vs Protein, Fat, Moisture,
Ash,` Crude Fibre and Carbohydrate for fermented popcorn.
The positive linear effect of temperature had the maximum
effect on fat and protein (P≤0.05) Table 2), meaning that it
decreased with an increase in fat (figure 2a). Both
carbohydrate and crude fibre had the maximum linear
positive effects on temperature (figure 2c).
Samples Temperature
(00C)
Protein (%) Fat (%) Moisture
(%)
Ash (%) Crude
Fibre(%)
Carbohydrate (%)
A 600C 12.10 3.61 9.56 2.06 0.51 72.17
B 650C 12.20 3.41 9.55 1.52 0.52 72.81
C 700C 12.34 3.33 9.58 2.53 0.55 71.89
D 750C 12.33 3.46 9.57 2.00 0.59 72.06
E 800C 12.25 3.39 9.53 1.08 0.62 73.14
F 00C 9.13 4.56 8.75 2.78 1.10 73.68
LSD 8.39 0.39 4.67 1.89 0.34 7.13

EFFECT OF DRYING TEMPERATURE ON THE FUNCTIONAL PROPERTIES OF A FERMENTED POPCORN (ZEAMAYSEVERTA)
FLOUR Kadurumba and Agu, 2015
UJET Vol. 1, No. 1, JUNE 2015 Page 9
The positive linear effect of temperature had the maximum
effect on Ash (Table 2), meaning that it decreased with an
increase in Ash (figure 2b).
The functional properties of fermented and unfermemted
popcorn are presented in table 4.
Table 3: ANOVA
Bulk Density
The result for bulk density showed that the bulk density
carried significantly (P<0.05) and ranged between 0.56−0.63
g/cm3 for fermented samples and 0.67 g/cm3 for the
unfermented sample. The values are compared with the
values obtained by Bolaji et al. (2014)
Swelling Index: the results obtained in this observation
showed that the values for fermented samples were
significantly higher (P<0.05) than the unfermented sample.
This result were in line with the findings of Bolaji et al. (2014).
The values were, however, lower compared with the values
Bolaji et al. (2014). Swelling index is a function of the ratio of
amylose to amylopectin, the characteristics of each fraction in
terms of molecular weight distribution, degree length of
blanching and confirmation (Onitilo et al., 2007). The swelling
pattern of the flour
suggests the level of crystalline packing of starch granules
(Billiadris, 1982). The difference observed between the value
in this study, and Bolaji et al. (2014). may be due to the
findings of Osungbono (1990) that the degree and amount of
swelling depends on the type of species of starch in the flour
samples.The degree of swelling and amount depends on the
type and species of starch in the flour samples.
Water absorption capacity
The values for water absorption capacity (WAC) are
significant (P<0.05).The values ranged between 1.67−1.83
and also showed an increase as temperature increases. The
variation in WAC values also indicated differences in the
degree of engagement to form hydrogen and covalent bonds
between the starch chain. And thedegree of availability of
water binding sites coming from the starch (Hoever and
Sosuluki, 1986). Adegunwa et al. (2011), observed that the
variation maybe due to particle size, amylase/amylopectin
ratio and molecular structure.
Oil absorption capacity
This is the ability of the flour protein to bind physically fat by
capillary attraction. It is of great importance since fat acts as
flavor retainer and increase the mouth feel of foods (Kinsella,
1976).The values obtained in this study 2.18−2.39 were higher
than the values of 0.8−1.05 obtained by Bolaji et al. (2014).
The difference between the values might be due to the
difference in drying temperatures used in this study. The
samples were soaked for six days and dried at the range of
65oC−80oC. Bolaji et al. (2014).soaked for 12 to 13 hours and
dried between 40oC−60oC.
Emulsion Capacity
The result for emulsion capacity showed that the samples
varied significantly and ranged between 1.18−1.26. It also
showed that emulsion capacity denotes the maximum amount
of oil that can be emulsified by protein dispersion (Emjuigha et
al., 2003).
Sum of Squares
df Mean Square
f Sig.
Protein 16.240 5 3.248 1.460 0.326
Fat 2.199 5 0.440 87.682 0.000
Moisture 1.086 5 0.217 0.316 0.886
Ash 3.565 5 0.713 6.357 0.022
Crude Fibre
0.513 5 0.103 28.042 0.000

EFFECT OF DRYING TEMPERATURE ON THE FUNCTIONAL PROPERTIES OF A FERMENTED POPCORN (ZEAMAYSEVERTA)
FLOUR Kadurumba and Agu, 2015
UJET Vol. 1, No. 1, JUNE 2015 Page 10
Gelatinization temperature: This temperature referred as the
onset of a rise in viscosity (Isikli and Karababa, 2005). Sandhu
et al.(2007), termed it as a measure of the minimum
temperature required to cook a given food sample. The values
obtained in this study ranged between 60oC−66oC with the
unfermented sample having the lowest value (60oC) which
implies lower cooking time.
6. CONCLUSION
The effective moisture loss in the drying kinetics of fermented
popcorn (ZeaMaysEverta) grains showed that temperature
directly influenced drying. From the values obtained, the
application of fermentation and drying improves the nutritive
value of protein and storability of the Popcorn flour than in the
unfermented flour. The results obtained on the proximate
composition, and functional properties showed that
fermentation of the popcorn grains for 144 hours and drying at
700C and 750C is best suitable for Popcorn flour production.
Fermentation increased the nutritive content and is richer
particularly in protein content. On the other hand, unfermented
sample values were higher in minerals and vitamins but can
be dangerous to health because the anti-nutrient present in
the corn grains has not been properly eliminated. Therefore,
fermented Popcorn flour could also serve in the
complementary food. And sometimes produced by several
types of composite flour using groundnut, cashew nuts,
bambara, moringa olifera leaves,etc. used as infant food.
REFERENCES
Abbey W. And Ibeh (1998) Functional Properties of Raw Processed Cowpea Flour Journal Of Food Science 53(B): 17775-1777.
AOAC (2000): Official Methods Of Analysis 17thED Association of Official Analytical Chemist International Washington DC, USA.
AOAC (2000): Official Methods Of Analysis, 15th Ed, Association of Official Analytical Chemists, International Washington DC, USA.
Adegunwa, M.O., Sanni, L.O. and Maziya – Dixon, B. (2011). Effect of fermentation length and varieties on pasting properties of sour cassava starch. African Journal of Biotechnology, Vol. 10(42), pp. 8428-8433.
Bella agha. S, Amani. E, Fahart. H and kechaou, N (2002): Drying Kinetics and Characterics Curve of Lightly Salted Sardine.
Bemiller S. (2003) Carbohydrate Analysis In Food And Analysis 3rd Edition,Wover Academic/Plenium Publishers New York Pp 145-171.
Billiadris C. G. (1982) Physical characteristics, enzymatic digestibility and structure of chemical modified smooth pea and waxy maize starches. Journal of Agricultural food Chemistry 30: 925-930.
Bolaji O.T, Oyewo A.O and Adepoju P.A (2014); Soaking And Drying Effect On The Functional Properties Of Ogi From Selected Maize Varieties, AmericanJournal of Food Science And Technology 2.5: 150−157.
Chang (2003) Protein Analysis: In Food Analysis 3rd Edition Wurer Academic Publisher, New York.
Donkeun. P, Keneth. G. D.A, Stermitz F. R, Maga J. A (2000): Chemical Composition and Physical Characteristics Of Unpopped Popcorn Hybrids. J. Food Composition Analysis (6)921-934.
Emjuigha. V. N, Badejo. A.A and Oluwanmukomu M.O (2003): Effect of Germination on the Nutritional and Functional Properties of African Oil Bean (Penthacletha Macropphylla) Seed Flour.J. Food, Agricul. Environment 1(3&4): 72−75.
Harborne, L.H.; Nielson, S.S.(2003) Ash analysis. In Nielsen S.S. (Ed.). FoodAnalysis. 3. Ed.New York: Kluwer Academic; Plenum Publishers. Cap. 7, P. 103 – 111.
Hoever, R. and Sosulski, F.W.(1986 ) Effect of cross-linking on functional properties of legume starches. Starch/Starke 38(5): 149-155.
Ijabadeniyi,A.O. and T.T. Adebolu (2005). The effect of processing
methods on the nutritional properties of ogi produced from three maize varieties. J. Food Agric. and Environ., 3: 108-109.
Iken. J. E, and Amusa. N. A(2010): Consumer Acceptability of
Seventeen Popcorn Maize(ZeaMaysL) Varieties In Nigeria. J. AgricRes 5(5) 404-407.
Isikli N.D, and Karababa E.A (2005): Rheological Characterization of Feniyreek Paste (Cemen) .J. Food. Eng 69;185−190.
Jirapa P. Normah, H. Zamaliah MM. Asmah. R And Mohamad. K (2001): Nutritional Quality Of Germinated Cowpea Flour (VignaUnguiculata) and Its Application in Home Prepared Weaning Foods. Plants Foods Hum Nutria; 56,203-216.

EFFECT OF DRYING TEMPERATURE ON THE FUNCTIONAL PROPERTIES OF A FERMENTED POPCORN (ZEAMAYSEVERTA)
FLOUR Kadurumba and Agu, 2015
UJET Vol. 1, No. 1, JUNE 2015 Page 11
Kinsella, J.E. (1976). Functional properties of proteins in foods. Critical Reviews in Food Science and Nutrition 1(3): 219 – 280.
Michodjehoun-M L., D. J. Hounhouigan, J. Dossou and C. Mestres,(2005)“Physical,Chemical and Microbiological Changes during Natural Fermentation of Gowé, a Sprouted or Non-Sprouted Sorghum Beverage from West-Africa,” African Journal of Biotechnology, Vol. 4, No. 6, pp. 487-
496.
Min. D. B and J Bott (2003): Crude Fat Analysis In Food Analysis 3rd Edition; Kluver Academic Plenium Published, New York Pp 115-128.
Okaka J. C And Porter N. N, (1997), Physiochemical And Functional Properties of Cowpea Powder Processed To Reduce Beany Flavor J. Food Sci. 44,1235-1240.
Okezie. B.O And Bello. A.B (1988) Physiochemical And FunctionalProperties of Waged Bean FlourandIsolate
Compared With Fry Isolate. J. Food Sci. Vol. 53: (2)450-454.
Onesmo, N. O. (2011). Effects of malting and fermentation on the composition and functionality of sorghum flour. Dissertations & Theses in Food Science and Technology. Retrievedfromhttp://digitalcommons.unl.edu/foodscidiss/12
Onimawo A.I and Egbekun(2002):Comprehension of food and
nutrition, Ambik Press Benin.
Onitilo, M. O.; Sanni, L. O., Daniel, I., Maziya-Dixon, B. and Dixon, A. (2007)Physicochemical and Functional Properties of Native Starches from Cassava Varieties in Southwest Nigeria. Journal of Food, Agriculture and Environment Vol. 5(3&4):108-114.
Onwuka G. I (2005) Food Analysis and Instrumentation in the Theory andPractical. Napthal Prints, Surulere Lagos. Pp 07-126.
Osagie. A. U and Eka. O. U (Eds) (1998): Nutritional Quality Of Plant Foods.Post Harvest Research Units, University Of Benin. Pp 34-41
Osungbaro, T.O. (1990). Effect of differences in varieties and dry milling of maize on the textural characteristics of Ogi
(fermented maize porridge) and agidi (fermented maize meal) J. Sci. Food Agric. 52: 1-12
Oyarekua. M. A, Adeye. E. I (2009): Comparative Evaluation of the
Nutritional Quality Functional Properties And Amino Acid Profile of Co-Fermented Maize (Cowpea And Sorghum/Cowpea Ogi) as InfantComplementary Food. Asia. J. Llin Nutria(1) 31-39.
Ristanovic. D (2001): Cereal Crops; Maize(Zea Mays L) Crop Production in Tropical Africa Ed Pea Maker.
Sadler, G.D. and P.A Murphy.(2003). Chapter 13: pH and Titratable Acidity. In : Food Analysis. S.S. Neilson, ed. Kluwer
Academic. New York
Sandhu K.S, Singh N, and Malhi N.S (2007). Some Properties of Corn Grains and their Flours Physicochemical Functional
and Chapati-Making Properties Of Flour. Food Chem. 99:541−548.
Teucher, B. Olivares. M. Cori. H (2004): Enhancers Of Iron Absorption: Ascorbic Acid and Other Organic Acids. Int Vitamin Nutir Ris. 74,19-403.
Velic D, Bilic.M, Tomas. S. P, Lanic. M, Bucic-Kojic A and Al adick (2007).Study Of The Drying Kinetics Of “Granny Smith” Apple in Trayer Drier, Agric Conspec Sci. Vol 72(4):pp 326.
Yagoub and Adalla, (2007) Effect of domestic processing methods
on chemical, in vitro digestibility of protein and starch
and functional properties of bambara groundnut
(Voandzeia subterranean) seed, Res.J.Agric. Biol. Sci. 3,
pp. 24-34
Table 4: Functional Properties of Fermented and Unfermented Popcorn
Samples Temperature (00C)
Bulk density (g/cm3)
Swelling Index
Water absorption capacity
Oil absorption capacity
Emulsion capacity
Gelatinization temperature(00C)

UMUDIKE JOURNAL OF ENGINEERING AND TECHNOLOGY (UJET), VOL. 1, NO. 1, NOV. 2015. INFORMATION ON SUBMISSION OF ARTICLES
UJET Vol. 1, No. 1, JUNE 2015 Page 12
Key: A−E (fermented popcorn), F(unfermented popcorn) and LSD (least significance difference)
A 600C 0.63 1.77 3.32 2.22 1.19 64.0
B 650C 0.63 1.76 3.51 2.26 1.18 65.50
C 700C 0.61 1.78 3.48 2.34 1.25 63.50
D 750C 0.59 1.81 3.62 2.39 1.22 64.50
E 800C 0.56 1.83 3.81 2.36 1.24 66.00
F 00C 0.67 1.67 3.34 2.18 1.26 60.00
LSD 0.04 0.06 0.04 0.05 0.17 5.39