Embed Size (px)
Citation preview
KAFA’A Knowledge and Action Fostering Advances in Agriculture
Baseline Assessment On-Farm Water Management, Crop Production and Marketing
Development Alternatives Inc.
September 2004
Table of Contents Page
Abbreviations and Acronyms ......................................................................................................... 4 List of Tables .................................................................................................................................. 5 List of Figures ................................................................................................................................. 6 Executive Summary ........................................................................................................................ 8 Introduction................................................................................................................................... 12 Baseline Survey Objectives .......................................................................................................... 13 Survey Methods and Implementation Plan ................................................................................... 14 Literature Search and Data Inventory ........................................................................................... 15 Farmers Participation, Preliminary Interviews ............................................................................. 15 Questionnaire Development.......................................................................................................... 15 Survey Sample .............................................................................................................................. 16 Enumerator Selection and Training .............................................................................................. 16 A senior water management specialist/farm owner and survey team leader ................................ 16 Interview Protocol......................................................................................................................... 17 Farming schemes in the Jordan Valley and AZB ......................................................................... 18 Cropping patterns in the Jordan Valley ........................................................................................ 19 Agricultural Calendar.................................................................................................................... 25 Crop Water Requirements............................................................................................................. 25 Gross Crop Revenue ..................................................................................................................... 26 Monthly water requirements per zone .......................................................................................... 27 Water productivity by zone........................................................................................................... 31 Water Deliveries compared with Crop Water Requirements ....................................................... 33
2
Farmers’ perceptions about water use and crop profitability........................................................ 42 On-Farm Irrigation Water Management ....................................................................................... 45 Needs for appropriate marketing techniques ................................................................................ 45 Decreasing water use .................................................................................................................... 47 Agricultural labor use in the Jordan Valley .................................................................................. 49 Improving Farm Water Management in the Project Areas........................................................... 54 A Numerical Illustration ............................................................................................................... 57
Appendices
I. KAFA’A Project Database and Reporting System
II. Tables and Figures
III. Demonstrations of Appropriate Crops, Site Selection, and Farmer Contracts
3
Abbreviations and Acronyms
AZB Amman-Zarqa Basin Highlands CWN Center Wholesale Market Dunum 1,000 m2, 0.1 hectare EureGap European Union retailer and Good Agricultural practices FTA Farm Turnout Assembly GTZ Deutsche Gessellshaft Fur Technische Zusammenarbeit IAS Irrigation Advisory Service HACCP Hazard Analysis and Critical Control Points ISO International Standards Organization JD Jordan Dinar JVA Jordan Valley Authority KAC King Abdullah Canal KTD King Talal Dam MCM Million Cubic Meters MOA Ministry of Agriculture MWI Ministry of Water and Irrigation USAID United States Agency for International Development WUA Water User Association
4
List of Tables Page
Table 1. Stratified Survey Sample.............................................................................................. 17 Table 2. Enumerator Teams ...................................................................................................... 18 Table 3. Interviewee nationality and management relationship to the land............................... 20 Table 4. Cropping pattern among survey sample farmers in the Jordan Valley. 2003............. 21 Table 5. Source of irrigation water and quality description....................................................... 42 Table 6. Farmer’s knowledge of the irrigation water Quality.................................................... 43 Table 7. Ranking of selected crops according to profitability and use of irrigation water,
blended water, and saline water, as reported by survey sample farmers in the Jordan Valley and Southern Ghor, 2004.................................................................................. 46
Table 8. Ranking of crops by farmers in AZB, according to profitability and use of water .... 47 Table 9. Farmer’s On-Farm irrigation water management ........................................................ 48 Table 10. Farmers Knowledge of food quality standards for increasing exports and source of
information................................................................................................................... 49 Table 11. Current Information Systems and Farmer’s Choices and Incentives for Increasing
Water Use Efficiency. .................................................................................................. 50
5
List of Figures Page
Figure 1. Cropping pattern among survey sample farmers in the Jordan Valley, 2003 .............. 23 Figure 2. Cropping pattern among survey sample farmers in the Southern Ghor. 2003............. 24 Figure 3. Value of production per dunum and per thousand cubic meters of irrigation water for
major crops in the North Jordan Valley, 2003 ............................................................. 28 Figure 4. Value of production per dunum and per thousand cubic meters of irrigation water for
major crops in the Center Jordan Valley, 2003............................................................ 29 Figure 5. Value of production per dunum and per thousand cubic meters of irrigation water for
major crops in the South Jordan Valley, 2003 ............................................................. 30 Figure 6. Jordan Valle monthly irrigation water requirements, by zone ..................................... 31 Figure 7. Water productivity in the Jordan Valley, by zone. 2003............................................... 32 Figure 8. Irrigation water needed to produce one dinar of value in the Jordan Valley, 2003. .... 32 Figure 9. Jordan Valley Authority. Irrigation water delivery for vegetables, citrus trees, and
bananas......................................................................................................................... 34 Fig. 10. Monthly water delivery schedule in the Jordan Valley, by zone, 2003.......................... 35 Figure 11. Jordan Valley. Value of production and water consumption per dunum, and dinars
per thousand cubic meters of water among survey sample farms, by zone. 2003 ....... 36 Figure 12. Jordan Valley. Cubic meters of irrigation water required to produce one dinar of
product value among farms in the survey sample, by zone. 2003 ............................... 37 Figure13. Value of production per dunum and per thousand cubic meters of irrigation water
delivered for major crops in the Southern Ghor, 2003................................................. 38 Figure 14. Jordan Valley survey. Value of production and water consumption and dinars per
thousand cubic meters of irrigation water among survey sample farms, by product category. 2003.............................................................................................................. 39
Figure 15. Jordan Valley. Cubic meters of irrigation water needed to produce one dinar of value,
by product category, 2003............................................................................................ 39 Figure 16. Jordan Valley. Average production value and water consumption per dunum. 2003 40
6
Figure 17. Jordan Valley. Irrigation water consumption in the survey sample farms for
vegetables, citrus, bananas and other tree crops, 2003 ................................................ 41 Figure 18. Jordan Valley. Production value and irrigation water consumption in the survey
sample farms on vegetables, citrus, bananas, and other tree crops, 2003 .................... 41 Figure 19. Jordan Valley Survey. Permanent and temporary agricultural labor used ................. 52 Figure 20. Jordan Valley Survey. Agricultural labor used by survey sample farmers, by zone,
2003.............................................................................................................................. 52 Figure 21. Additional agricultural labor months per dunum of major crop categories among
survey sample farms, 2003 (see regression results) ..................................................... 53
7
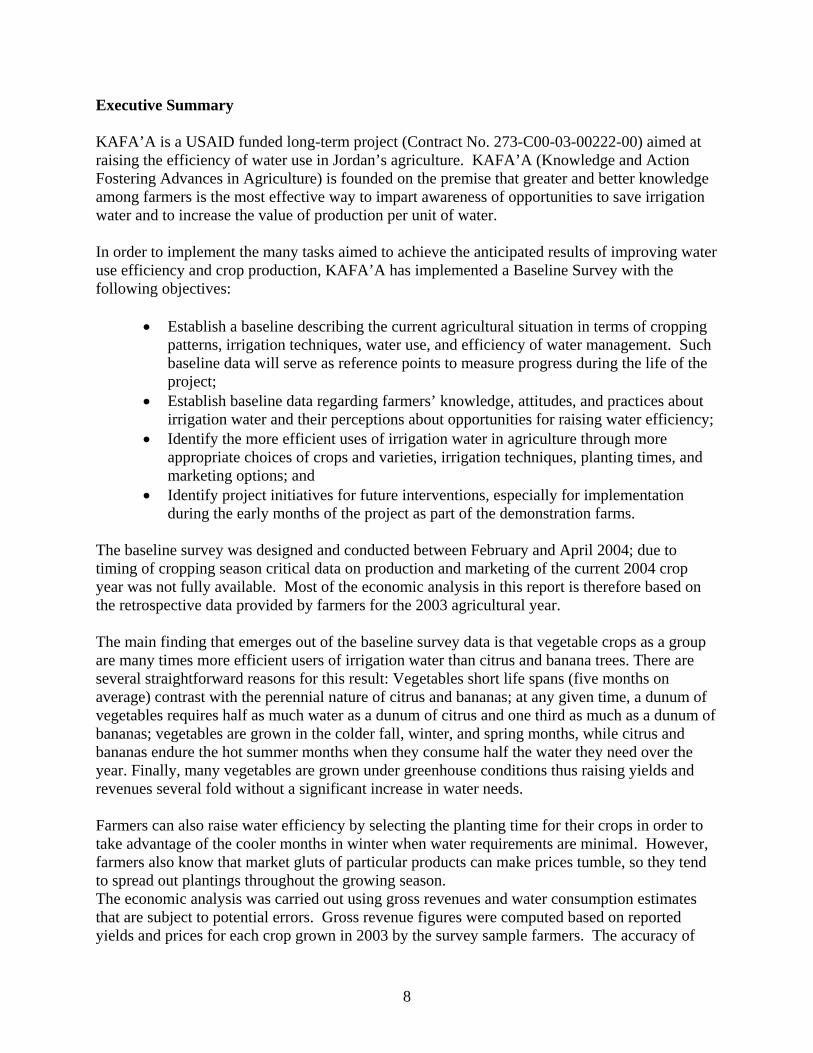
Executive Summary KAFA’A is a USAID funded long-term project (Contract No. 273-C00-03-00222-00) aimed at raising the efficiency of water use in Jordan’s agriculture. KAFA’A (Knowledge and Action Fostering Advances in Agriculture) is founded on the premise that greater and better knowledge among farmers is the most effective way to impart awareness of opportunities to save irrigation water and to increase the value of production per unit of water. In order to implement the many tasks aimed to achieve the anticipated results of improving water use efficiency and crop production, KAFA’A has implemented a Baseline Survey with the following objectives:
• Establish a baseline describing the current agricultural situation in terms of cropping patterns, irrigation techniques, water use, and efficiency of water management. Such baseline data will serve as reference points to measure progress during the life of the project;
• Establish baseline data regarding farmers’ knowledge, attitudes, and practices about irrigation water and their perceptions about opportunities for raising water efficiency;
• Identify the more efficient uses of irrigation water in agriculture through more appropriate choices of crops and varieties, irrigation techniques, planting times, and marketing options; and
• Identify project initiatives for future interventions, especially for implementation during the early months of the project as part of the demonstration farms.
The baseline survey was designed and conducted between February and April 2004; due to timing of cropping season critical data on production and marketing of the current 2004 crop year was not fully available. Most of the economic analysis in this report is therefore based on the retrospective data provided by farmers for the 2003 agricultural year. The main finding that emerges out of the baseline survey data is that vegetable crops as a group are many times more efficient users of irrigation water than citrus and banana trees. There are several straightforward reasons for this result: Vegetables short life spans (five months on average) contrast with the perennial nature of citrus and bananas; at any given time, a dunum of vegetables requires half as much water as a dunum of citrus and one third as much as a dunum of bananas; vegetables are grown in the colder fall, winter, and spring months, while citrus and bananas endure the hot summer months when they consume half the water they need over the year. Finally, many vegetables are grown under greenhouse conditions thus raising yields and revenues several fold without a significant increase in water needs. Farmers can also raise water efficiency by selecting the planting time for their crops in order to take advantage of the cooler months in winter when water requirements are minimal. However, farmers also know that market gluts of particular products can make prices tumble, so they tend to spread out plantings throughout the growing season. The economic analysis was carried out using gross revenues and water consumption estimates that are subject to potential errors. Gross revenue figures were computed based on reported yields and prices for each crop grown in 2003 by the survey sample farmers. The accuracy of
8
these figures is subject to considerable potential recall error, but there is large enough number of observations and consistency in the sample data to make the aggregate estimates fairly robust. Net revenues were not computed because it would have been too costly and cumbersome to obtain cost of production data for each crop. Thus, the considerable cost of setting up plastic tunnels for green house vegetable was not considered; nor was the cost of establishing a citrus orchard or a banana grove and waiting for several years before production begins. Water consumption by each crop or each farm was not available. Instead, we used estimates of crop water requirements provided by the Jordan Valley Authority, computed for each crop based on weather factors along the Jordan Valley. Alternatively, we used water delivery schedules also provided by the JVA based on their rule of thumb estimates for vegetables (2 mm/day), citrus (4 mm/day), and bananas (6 mm/day) with adjustments for cooler months. The results of the economic analysis were fairly consistent in both cases, either using crop water requirements or water delivery schedules: vegetables outperform by far citrus and bananas in terms of value per unit of irrigation water. Citrus trees receive about two thirds (65 percent) of the water supplied by JVA in the Jordan Valley but generate less than one third (31 percent) of the value of production; vegetables crops on the other hand use 22 percent of the irrigation water delivered but generate 62 percent of the gross value of production. In general, large gains in water efficiency can therefore be accomplished simply by shifting water and farmland from citrus crops to vegetable crops, especially vegetables crops grown under green house conditions. To be sure, there are large differences both within vegetable crops and within citrus crops. Navel oranges, for example, consistently perform better in terms of gross revenue per dunum and per 1000 m3 of irrigation water than other citrus crops, while clementines tended to perform poorly in most cases. Similarly tomatoes and cucumbers under plastic tunnels perform very well in terms of relative water use efficiency, while others vegetables in open field conditions can give mediocre results. Bananas provide very high gross returns per dunum but consume enormous amounts of water (1600 m3 per dunum per year) as opposed to vegetables (227 m3 per year) and therefore relative water use efficiency in bananas is very poor. Crop water use efficiency in the North Jordan Valley is considerable lower than in the Center Jordan Valley because citrus trees are the dominant crops in the North while in the Center vegetable crops predominate. The North also has the better quality soils in the valley and uses the best quality water. In the Center and South the soils are less desirable and irrigation water is mixed with either treated waste water or underground water. Many farms in the Center and South also leave areas uncultivated for lack of reliable water supply from JVA. The South also suffers from high soil and water salinity problems. Finally, in terms of employment, vegetable crops generate significantly more person months in employment than citrus trees. These factors reinforce the view that using fresh water and the best soils to produce citrus and bananas is not the best social or economic policy. JVA has now imposed restrictions on any new planted areas to citrus and bananas, the two crop categories that consume most water. JVA would like to reserve some areas strictly for vegetables. However, JVA’s power to enforce those restrictions is undermined by a few privilege farmers who ignore the rules, and by a court order that JVA provide water even to
9
citrus and banana fields planted without proper permits. Farmers know that once these fields are established they are entitled to receive the higher water allocations for citrus and bananas. Why do farmers want to increase the areas planted to the least water use efficient crops? Because current prices that JVA charges farmers for irrigation water do not reflect the true value of water. At 10 fils (0.010 JD) per cubic meter the cost of 1000 m3 of water needed per dunum of citrus is only 10 JD per year, while the value of production is about 450 JD. Households in Amman are paying 40 to 50 times more (0.400 to 0.500 JD per m3). In years with water shortages JVA has rented farm units (35-dunum average) for about 1000 JD per year to save 20,000 cubic meters of water by leaving the land fallow; this is equivalent to 50 JD per 1,000 m3 (0.500 JD/m3). To the extent that farmers are now receiving highly subsidized water relative to its opportunity cost, it should not be a surprise that they are treating water as a free good. At present, Jordan Valley farmers irrigate all of the water delivered to their farms by JVA. They exert little control to adjust on-farm use to the water requirements of their crops. Apart from a few exceptional individuals, farmers are not using flow meters, tensiometers or watermarks to measure and control irrigation scheduling. Not all the water flow meters installed by JVA at every farm’s FTA box are working for several reasons; even those which are working properly are not being used for controlling water use or water billing. Farmers in the Jordan Valley do not derive tangible benefits from reducing irrigation water. Farmers gain little financially from investing in equipment and techniques to improve irrigation scheduling or by using only the minimum water requirements in their fields. For example, a citrus farmer who reduces water consumption by one third (300 m3/dunum) only saves 3 JD per year in water charges. Without tangible financial benefits it is likely that better knowledge and exhortations to save water might not translate into better irrigation practices. Suggested project interventions, based on the assessments of on-farm water management, crop production, and marketing, include:
• Design and implement a maintenance and operation program for drip irrigation for farmers and irrigation operators, including irrigation set time, maintenance of media filters, and system repairs
• Implement “hands on training” of irrigation scheduling for the major crops identified in the assessment and for proposed alternative crops, monitoring soil moisture by “hand feel method”, soil augers, and electronic sensors
• Evaluate irrigation system performance on farmers’ fields for distribution and uniformity
• Promote the transition of surface to drip irrigation • Establish a chain of demonstration sites showing farmers improved water
management techniques throughout the project area • Use these demonstration sites as information distribution centers where farmers can
obtain advice on crop husbandry, marketing options, and irrigation management • Work with JVA to establish a Water Delivery Management Committee for the Jordan
Valley to oversee the allocation of irrigation water with transparency and fairness
10
• Monitor salt accumulation in irrigated soils in the Jordan Valley, southern Ghors, and Amman-Zarqa Basin
• Develop a crop-suitability planning tool to aid farmers in determining the best adapted crops for specific soil and microclimatic conditions.
• Train farmers and extension personnel to use the crop-suitability planning tool • Base fertilizer recommendations on soil nutrient analyses • Monitor soil moisture and irrigation results in a network of farms surrounding each
demonstration site • Train agricultural laborers in irrigation management and crop husbandry practices,
including agrochemical use, transplanting, and packaging • Consider the importation of Vetiver grass to improve water quality along the water
delivery system of the King Talal reservoir, the Zarqa River, and around farm ponds. • Work with NCARTT in screening alternative crops, including stone fruits,
ornamentals, and indigenous species • Work with JVA in irrigation pond maintenance, such as preventing leaks,
evaporation, and algae growth • Work with JVA to improve irrigation flow and pressure in water delivery • Design a credit or revolving grant program for farmer associations and cooperatives
to allow small and economically disadvantaged farmers access to more efficient irrigation equipment
• Promote private sector participation in marketing services and enforce standards for agricultural products in compliance with international requirements
• Conduct a follow-up survey each year to monitor the impact of the introduced techniques and water management recommendations
• Institutionalize the use of the farm code number within the MWI and all government, donor agencies and private sector dealing with data collection, processing and management for farms in the Jordan Valley and Southern Ghors.
11
Introduction Jordan faces a critical water shortage, with only 750 million cubic meters (MCM) per year of renewable surface and groundwater to supply an increasing water demand that reached 1,200 MCM (MCM) in 2002. In addition to the historic problems of water scarcity and irregularity, resource planners face increasing water demand due to rapid urban expansion, industrial and tourism development, over-abstraction of groundwater and inefficient use of irrigation water. Farmers in the Jordan Valley and the highlands will find it increasingly difficult to justify their priority claim over water resources. The results of previous studies, such as WQIC (1994-1998), Amman-Zarqa Basin WRPS (1999-2001), and pilot programs including the Jordan Valley IAS (1999-2001) and IOJOV (1995-present), stressed that efficient agricultural water use needs to be integrated with good agricultural production and marketing practices. In effect, improved crop production and marketing methods can compensate for increasingly tight water supplies and declining water quality. Technical assistance in crop production and marketing can facilitate and serve as an incentive for farmers to adopt less water-intensive crops, more efficient on-farm water management practices, and improved market access that ultimately will reduce agricultural water use and protect national water resources, while increasing farm income. The KAFA’A project (Knowledge and Action Fostering Advances in Agriculture) is a USAID funded program (Contract No. 273-C00-03-00222-00) aimed at raising the efficiency of water used in agriculture in Jordan. KAFA’A staff and participating farmers and stakeholders from public and private institutions, NGOs, cooperatives and farmers associations will assist the MWI, MOA, and JVA in providing technical assistance on efficient on-farm water management, crop production, and marketing practices. One of the initial deliverables of the KAFA'A project is a baseline assessment of on-farm water management and crop production practices in the Jordan Valley and the Amman-Zarqa Basin (AZB) Highlands. The KAFA’A Baseline Survey constitutes the initial attempt at the start of the project to determine the current state of farmers knowledge, attitudes and practices as well as describing the current situation on the ground in terms of cropping patterns, irrigation methods, and marketing practices. The Baseline Survey was designed also to find out the current levels of water efficiency, identify the more and the less efficient crops and irrigation practices. Efficiency was measured in terms of value of production per unit of irrigation water used. Based on the findings from the baseline survey KAFA’A will design its future interventions in order to raise farmer’s awareness of how to make better use of irrigation water. The results from the Baseline Survey will also serve as reference points to evaluate how effectively the messages from KAFA’A have reached farmers and how effectively these messages motivate them to improve decisions making regarding water use and water efficiency. The economic analysis of the Baseline Survey data proceeded in a logical sequence of steps: First, we determined the cropping patterns that farmers have adopted in different regions of the Jordan Valley and the Southern Ghors. Second, we obtained data on crop water requirements by
12
month for the different zones of the Jordan Valley, differentiating between open field cultivation and green housing using plastic. Third, we determined from the data collected estimates of gross revenue obtained for each crop in each sample farm, as reported by the farmers themselves during survey interviews. Fourth, the two sets of data on gross revenue and water requirements were combined to arrive at estimates of revenue per thousand cubic meters for each crop and each zone. Fifth, a parallel economic analysis was carried out using water delivery schedules provided by the Jordan Valley Authority to contrast with the earlier analysis. Sixth, the types of crops and farming practices that yield higher efficiency ratios and those with the lower efficiency ratios were identified. Seventh, farmers’ perceptions about the relative profitability of crops and their suitability for growing under water scarcity or using saline or treated wastewater were noted. Finally, the relative labor demand of different crops was evaluated. The Baseline Survey was designed and carried out between February 2004 and data collection took place in March and April. The economic analysis was based mainly on the cropping patterns, yields, and revenues reported by farmers for the previous season in 2003, for which we had a complete data set on production, marketing, and water use. Data for the 2004 season was incomplete in terms of yields, production, and prices. A KAFA’A database and reporting system has been developed as a project information management system that will support project planning, monitoring and reporting. Sampling methodology, survey instrument design and data entry systems are described in the first phase of the assessment report, February 2004. A team of Agricultural engineers, who are also farmers in the project areas, interviewed over 700 farmers, insuring high and reliable quality of data collection (see Appendices). The KAFA’A database and reporting system serves as a project planning and monitoring tool. Database automation fosters ease of data entry (and reduced errors), updating survey data, and data reporting. Although not defined as a project deliverable, a geographic information system (GIS) component was built into the KAFA’A project database to allow for spatial analysis of the survey. GIS technology can help to reveal important spatial relationships that are not easily discerned using conventional statistical reporting. For example, a spatial analysis of where farmers are using drip irrigation in the Jordan valley helps to determine specific extension needs and to demonstrate where these farmers are located with relation to irrigation canals, markets and land resources. The Jordan Valley Association JVA might use this information to plan extension activities aimed at fostering efficient utilization of irrigation resources.
Baseline Survey Objectives The primary objectives of the baseline survey of on-farm water management and crop production are to:
1. Collect information and develop a detailed understanding of current knowledge, attitudes, and practices (KAP) related to on-farm water management and crop production, providing a baseline against which progress will be monitored;
13
2. Identify marketing constraints (particularly to exports) and sources of market information; and
3. Promote farmer participation in defining their needs, identifying constraints, and designing
project interventions to promote changes in farmer attitudes and behaviors concerning improved water use efficiency and crop production.
The survey was designed to measure the success of KAFA'A in reaching target results, and to test the relationship of those results to the overall objective of increasing agricultural water use efficiency and productivity. The survey was also designed to test a basic hypothesis of the KAFA’A project - that farmers using efficient irrigation technologies and practices to produce high-value, water-efficient crops that are appropriate for their water quality, and marketing them in competitive markets, will make highly productive use of irrigation water. The following assumptions underlie this hypothesis:
• Irrigation efficiency depends on irrigation technologies as well as on-farm water management and crop production practices;
• Appropriate use of irrigation scheduling equipment (tensiometers, water marks, evaporation pans), and irrigation records are indicators of water use efficiency;
• High-value crops, less water-intensive crops, salinity-tolerant crops and crops appropriate for low-quality treated wastewater can be defined a priori;
• Exporting to EU and Gulf states is an indicator of competitive marketing capabilities; • Jordanian farmers follow two distinct marketing strategies - crop specialization or crop
diversification. Survey Methods and Implementation Plan The design and implementation of the baseline survey follows the following eight steps, each of which is described in greater detail below:
1. Review the results of previous surveys, programs and studies concerning on-farm water use, irrigation practices, and crop production;
2. Collect relevant information from MWI, JVA, and MOA databases; 3. Conduct field reconnaissance trips to the Jordan Valley and AZB Highlands to inform the
farmers and ensure their participation in the design of the survey questionnaires; 4. Develop questionnaire; 5. Select the survey sample; 6. Train enumerators and field-test the questionnaire; 7. Define interview protocol; and 8. Prepare a field survey implementation schedule.
14
Literature Search and Data Inventory The survey design team reviewed reports on on-farm irrigation practices, cropping strategies, and new crops that Jordanian farmers can produce competitively for world markets. Jordanian government counterparts and other foreign organizations provided an extensive body of literature on irrigation system management, crop water requirements, and export marketing. Many of these reports contain useful information that can be integrated with the KAFAA survey results. For example, “A Study of Groundwater Use and Users in the Northeastern Amman-Zarqa Basin Highlands” by Associates in Rural Development (ARD) in 2001 provides useful information on irrigation using groundwater in the Highlands. The baseline survey in the Jordan Valley and Highlands is consistent with information from the 2001 Highlands survey. Farmers Participation, Preliminary Interviews The survey design team spent two days interviewing farmers in the Jordan Valley and Amman-Zarqa Highlands. They engaged farmers in informal conversations about management practices and on-farm irrigation, allowing the team to observe farm conditions and assess whether farmer responses are consistent with current conditions and practices. These field visits provided valuable background information on crop production methods, irrigation resource delivery, problems with water pressure, duration of irrigation schedules and lack of transparency in water distribution practices. Questionnaire Development The survey team used an iterative process to design the questionnaire, and exploited every opportunity to test it. The primary basis for the questionnaire was the list of indicators and results in the KAFA’A annual work plan. Project staff and local consultant Dr. Kamel Radaideh provided feedback on early drafts of the questionnaire, which was subsequently tested on five modern, progressive farmers meeting at KAFA’A to discuss marketing constraints. Enumerators and respondents were asked to comment on the technical usefulness and cultural appropriateness of the survey questions. Two final questionnaires were developed, one for the Jordan Valley (JV) and Ghor Es-Safi and the other for Amman Zarqa Basin Highlands. The JV and Ghor Es Safi questionnaire addresses on-farm water management, cropping patterns, and marketing strategies. It include questions on farmers’ knowledge (high-value and less-water intensive crops, and crops appropriate for saline water and treated wastewater), attitudes (production constraints, marketing requirements, opinions of contract production, foreign competition, governmental extension services, and expectations of future labor costs), practices and behaviors (farm and irrigation management, cropping patterns in 2003 and 2004, agricultural production and income in 2003, destination markets and marketing strategies, and exports in 2003). The AZB Highlands questionnaire is designed to complement the rapid appraisal survey conducted in the year 2000. It addresses the operation and maintenance of the irrigation systems, knowledge of efficient water use practices,
15
knowledge of less water-intensive crops and crops appropriate for saline water and treated wastewater, and marketing. Survey Sample The survey covers five geographical areas namely the North, Central, and South Jordan Valley, Ghor Es-Safi, and the Amman-Zarqa Basin. To ensure statistically significant results regarding vegetable and tree crop producers in each of the five survey areas, the sample of respondents is stratified to include representative sub-samples of farmers in each area (Table 1). The baseline survey will cover 800 farm units including 80 in AZB Highlands. The remaining 720 interviews are distributed proportionately on the basis of the number of farms units in each area (see Table 1 below). The relatively high proportion of interviews in the Jordan Valley, compared to the Highlands, will allow the survey team to focus in detail on management practices on farms with different water sources and qualities. Survey results will be weighted to reflect the characteristics of the total farm population. Enumerator Selection and Training To increase the reliability of survey data, KAFA’A hired highly-qualified agronomists and water engineers who have extensive experience in irrigated farming. The six members of the survey team included: • Three senior agricultural production specialists who own and manage their own farms; • A senior irrigation engineer who has extensive experience in crop production and modern
irrigation management practices; • A crop protection /IPM specialist who also has data management experience; and • A senior water management specialist/farm owner and survey team leader
16
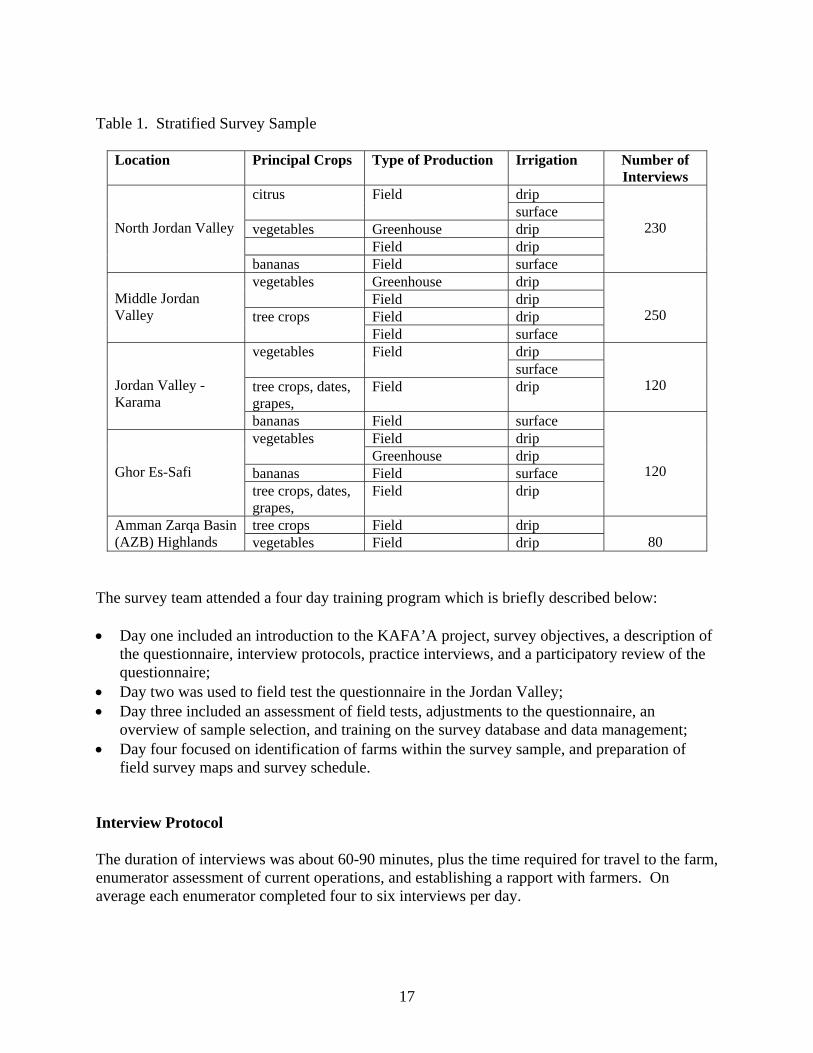
Table 1. Stratified Survey Sample
Location Principal Crops Type of Production Irrigation Number of Interviews
drip citrus Field surface
vegetables Greenhouse drip Field drip
North Jordan Valley
bananas Field surface
230
Greenhouse drip vegetables Field drip Field drip
Middle Jordan Valley tree crops
Field surface
250
drip vegetables Field surface
tree crops, dates, grapes,
Field drip
120
Jordan Valley - Karama
bananas Field surface Field drip vegetables Greenhouse drip
bananas Field surface
Ghor Es-Safi
tree crops, dates, grapes,
Field drip
120
tree crops Field drip Amman Zarqa Basin (AZB) Highlands vegetables Field drip
80
The survey team attended a four day training program which is briefly described below: • Day one included an introduction to the KAFA’A project, survey objectives, a description of
the questionnaire, interview protocols, practice interviews, and a participatory review of the questionnaire;
• Day two was used to field test the questionnaire in the Jordan Valley; • Day three included an assessment of field tests, adjustments to the questionnaire, an
overview of sample selection, and training on the survey database and data management; • Day four focused on identification of farms within the survey sample, and preparation of
field survey maps and survey schedule. Interview Protocol
The duration of interviews was about 60-90 minutes, plus the time required for travel to the farm, enumerator assessment of current operations, and establishing a rapport with farmers. On average each enumerator completed four to six interviews per day.
17
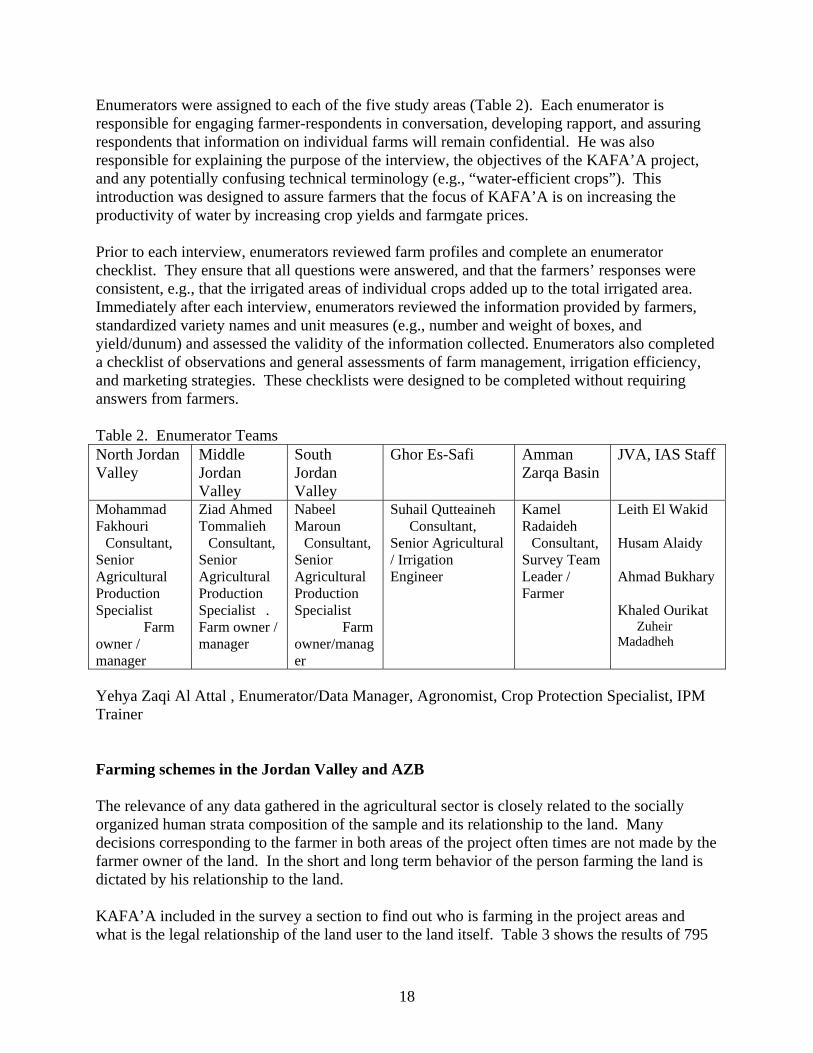
Enumerators were assigned to each of the five study areas (Table 2). Each enumerator is responsible for engaging farmer-respondents in conversation, developing rapport, and assuring respondents that information on individual farms will remain confidential. He was also responsible for explaining the purpose of the interview, the objectives of the KAFA’A project, and any potentially confusing technical terminology (e.g., “water-efficient crops”). This introduction was designed to assure farmers that the focus of KAFA’A is on increasing the productivity of water by increasing crop yields and farmgate prices. Prior to each interview, enumerators reviewed farm profiles and complete an enumerator checklist. They ensure that all questions were answered, and that the farmers’ responses were consistent, e.g., that the irrigated areas of individual crops added up to the total irrigated area. Immediately after each interview, enumerators reviewed the information provided by farmers, standardized variety names and unit measures (e.g., number and weight of boxes, and yield/dunum) and assessed the validity of the information collected. Enumerators also completed a checklist of observations and general assessments of farm management, irrigation efficiency, and marketing strategies. These checklists were designed to be completed without requiring answers from farmers. Table 2. Enumerator Teams North Jordan Valley
Middle Jordan Valley
South Jordan Valley
Ghor Es-Safi Amman Zarqa Basin
JVA, IAS Staff
Mohammad Fakhouri Consultant, Senior Agricultural Production Specialist Farm owner / manager
Ziad Ahmed Tommalieh Consultant, Senior Agricultural Production Specialist . Farm owner / manager
Nabeel Maroun Consultant, Senior Agricultural Production Specialist Farm owner/manager
Suhail Qutteaineh Consultant, Senior Agricultural / Irrigation Engineer
Kamel Radaideh Consultant, Survey Team Leader / Farmer
Leith El Wakid Husam Alaidy Ahmad Bukhary Khaled Ourikat Zuheir Madadheh
Yehya Zaqi Al Attal , Enumerator/Data Manager, Agronomist, Crop Protection Specialist, IPM Trainer Farming schemes in the Jordan Valley and AZB The relevance of any data gathered in the agricultural sector is closely related to the socially organized human strata composition of the sample and its relationship to the land. Many decisions corresponding to the farmer in both areas of the project often times are not made by the farmer owner of the land. In the short and long term behavior of the person farming the land is dictated by his relationship to the land. KAFA’A included in the survey a section to find out who is farming in the project areas and what is the legal relationship of the land user to the land itself. Table 3 shows the results of 795
18
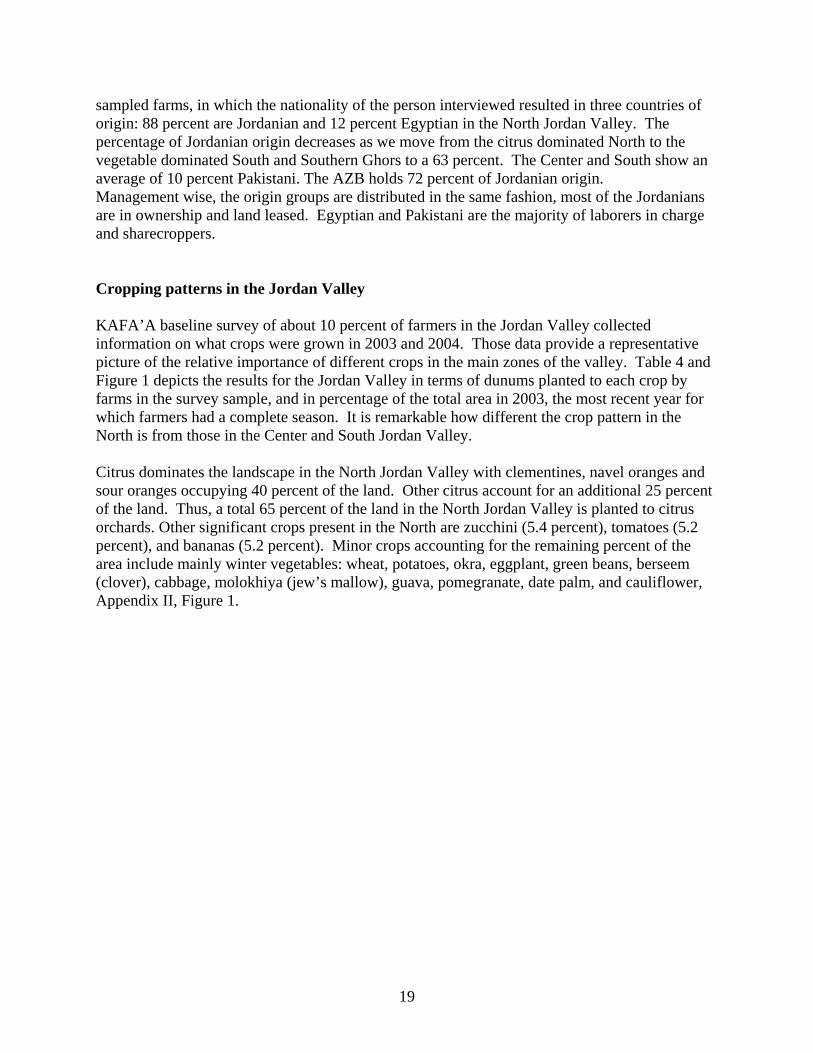
sampled farms, in which the nationality of the person interviewed resulted in three countries of origin: 88 percent are Jordanian and 12 percent Egyptian in the North Jordan Valley. The percentage of Jordanian origin decreases as we move from the citrus dominated North to the vegetable dominated South and Southern Ghors to a 63 percent. The Center and South show an average of 10 percent Pakistani. The AZB holds 72 percent of Jordanian origin. Management wise, the origin groups are distributed in the same fashion, most of the Jordanians are in ownership and land leased. Egyptian and Pakistani are the majority of laborers in charge and sharecroppers. Cropping patterns in the Jordan Valley KAFA’A baseline survey of about 10 percent of farmers in the Jordan Valley collected information on what crops were grown in 2003 and 2004. Those data provide a representative picture of the relative importance of different crops in the main zones of the valley. Table 4 and Figure 1 depicts the results for the Jordan Valley in terms of dunums planted to each crop by farms in the survey sample, and in percentage of the total area in 2003, the most recent year for which farmers had a complete season. It is remarkable how different the crop pattern in the North is from those in the Center and South Jordan Valley. Citrus dominates the landscape in the North Jordan Valley with clementines, navel oranges and sour oranges occupying 40 percent of the land. Other citrus account for an additional 25 percent of the land. Thus, a total 65 percent of the land in the North Jordan Valley is planted to citrus orchards. Other significant crops present in the North are zucchini (5.4 percent), tomatoes (5.2 percent), and bananas (5.2 percent). Minor crops accounting for the remaining percent of the area include mainly winter vegetables: wheat, potatoes, okra, eggplant, green beans, berseem (clover), cabbage, molokhiya (jew’s mallow), guava, pomegranate, date palm, and cauliflower, Appendix II, Figure 1.
19
Table 3. Interviewee nationality and management relationship to the land
J. V. North J. V. Central J. V. SouthSouthern
Ghor (Safi) AZB Count % Count % Count % Count % Count %Nationality Egyptian 28 12.0 49 20.5 39 31.2 41 34.5 22 28.2Jordanian 206 88.0 171 71.5 70 56.0 75 63.0 56 71.8Pakistani 19 8.0 16 12.8 3 2.5 Total 234 239 125 119 78 Nationality & Relation to Land Jordanian Laborer in Charge 32 15.5 29 17.010 14.312 16.0 7 12.5Land Leased 47 22.8 73 42.740 57.122 29.3 10 17.9Land Owner 126 61.2 67 39.210 14.326 34.7 37 66.1Sharecropper 1 0.5 2 1.210 14.315 20.0 2 3.6
Subtotal 206 171 70 75 56 Egyptian Laborer in Charge 25 89.3 34 69.416 42.122 53.7 20 90.9Land Leased 3 10.7 13 26.5 9 23.7 3 7.3 1 4.5Land Owner 1 2.6 1 4.5Sharecropper 2 4.112 31.616 39.0
Subtotal 28 49 38 41 22 Pakistani Laborer in Charge 5 26.3 Land Leased 13 68.4 1 33.31 33.3 Sharecropper 1 5.3 2 66.72 66.7
Subtotal 19 12 3 Total 234 220 108 116 78 By contrast, tomatoes are the dominant crop in the Center and South Jordan Valley zones, occupying 20 and 25 percent of the area, respectively, Table 4. Potatoes are second in the Center with 12 percent, followed by cucumber (11 percent), zucchini (9 percent), onions (5.6 percent), and wheat (4.9 percent). Clementines, navel oranges, shamouti oranges and other citrus account for 17 percent of total planted area. Wheat (4.9 percent), maize (3.7 percent), and eggplant (4.0 percent) also occupy significant shares of land, Appendix II, Figure 2. In general, irrigated land in the Center Jordan Valley goes primarily to vegetables crops, while in the North it is mainly citrus.
After tomatoes, which occupy 24 percent of the land in the South Jordan Valley, the other main crops are eggplant (17.8 percent). Maize, zucchini, lettuce, hot peppers, and potatoes contribute percent shares between 4 to 8 percent. Next come cucumber, squash, broad beans, bananas and cauliflower, each contributing between 2 to 4 percent additionally, Table 4, and Figure 3 in Appendix II. Other minor crops include wheat, onions, grapes, and cabbage. Citrus are present but they account for a barely significant percent of the planted area.
20
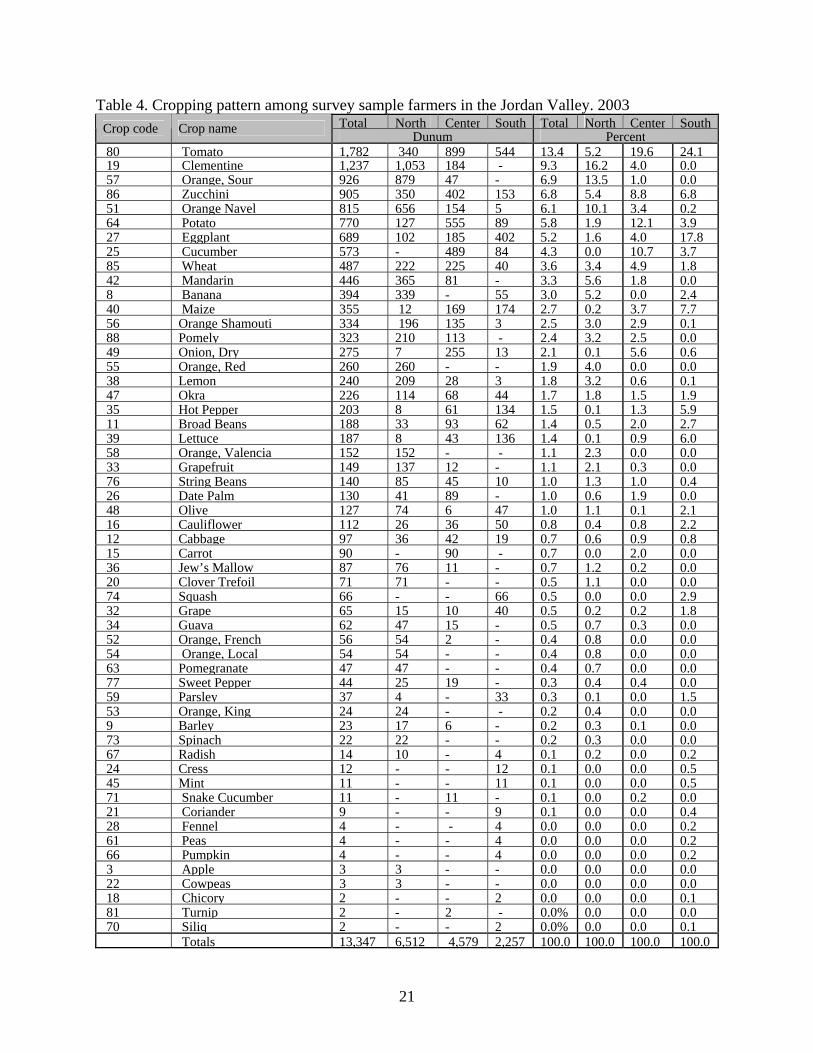
Table 4. Cropping pattern among survey sample farmers in the Jordan Valley. 2003 Total North Center South Total North Center SouthCrop code Crop name Dunum Percent
80 Tomato 1,782 340 899 544 13.4 5.2 19.6 24.1 19 Clementine 1,237 1,053 184 - 9.3 16.2 4.0 0.0 57 Orange, Sour 926 879 47 - 6.9 13.5 1.0 0.0 86 Zucchini 905 350 402 153 6.8 5.4 8.8 6.8 51 Orange Navel 815 656 154 5 6.1 10.1 3.4 0.2 64 Potato 770 127 555 89 5.8 1.9 12.1 3.9 27 Eggplant 689 102 185 402 5.2 1.6 4.0 17.8 25 Cucumber 573 - 489 84 4.3 0.0 10.7 3.7 85 Wheat 487 222 225 40 3.6 3.4 4.9 1.8 42 Mandarin 446 365 81 - 3.3 5.6 1.8 0.0 8 Banana 394 339 - 55 3.0 5.2 0.0 2.4 40 Maize 355 12 169 174 2.7 0.2 3.7 7.7 56 Orange Shamouti 334 196 135 3 2.5 3.0 2.9 0.1 88 Pomely 323 210 113 - 2.4 3.2 2.5 0.0 49 Onion, Dry 275 7 255 13 2.1 0.1 5.6 0.6 55 Orange, Red 260 260 - - 1.9 4.0 0.0 0.0 38 Lemon 240 209 28 3 1.8 3.2 0.6 0.1 47 Okra 226 114 68 44 1.7 1.8 1.5 1.9 35 Hot Pepper 203 8 61 134 1.5 0.1 1.3 5.9 11 Broad Beans 188 33 93 62 1.4 0.5 2.0 2.7 39 Lettuce 187 8 43 136 1.4 0.1 0.9 6.0 58 Orange, Valencia 152 152 - - 1.1 2.3 0.0 0.0 33 Grapefruit 149 137 12 - 1.1 2.1 0.3 0.0 76 String Beans 140 85 45 10 1.0 1.3 1.0 0.4 26 Date Palm 130 41 89 - 1.0 0.6 1.9 0.0 48 Olive 127 74 6 47 1.0 1.1 0.1 2.1 16 Cauliflower 112 26 36 50 0.8 0.4 0.8 2.2 12 Cabbage 97 36 42 19 0.7 0.6 0.9 0.8 15 Carrot 90 - 90 - 0.7 0.0 2.0 0.0 36 Jew’s Mallow 87 76 11 - 0.7 1.2 0.2 0.0 20 Clover Trefoil 71 71 - - 0.5 1.1 0.0 0.0 74 Squash 66 - - 66 0.5 0.0 0.0 2.9 32 Grape 65 15 10 40 0.5 0.2 0.2 1.8 34 Guava 62 47 15 - 0.5 0.7 0.3 0.0 52 Orange, French 56 54 2 - 0.4 0.8 0.0 0.0 54 Orange, Local 54 54 - - 0.4 0.8 0.0 0.0 63 Pomegranate 47 47 - - 0.4 0.7 0.0 0.0 77 Sweet Pepper 44 25 19 - 0.3 0.4 0.4 0.0 59 Parsley 37 4 - 33 0.3 0.1 0.0 1.5 53 Orange, King 24 24 - - 0.2 0.4 0.0 0.0 9 Barley 23 17 6 - 0.2 0.3 0.1 0.0 73 Spinach 22 22 - - 0.2 0.3 0.0 0.0 67 Radish 14 10 - 4 0.1 0.2 0.0 0.2 24 Cress 12 - - 12 0.1 0.0 0.0 0.5 45 Mint 11 - - 11 0.1 0.0 0.0 0.5 71 Snake Cucumber 11 - 11 - 0.1 0.0 0.2 0.0 21 Coriander 9 - - 9 0.1 0.0 0.0 0.4 28 Fennel 4 - - 4 0.0 0.0 0.0 0.2 61 Peas 4 - - 4 0.0 0.0 0.0 0.2 66 Pumpkin 4 - - 4 0.0 0.0 0.0 0.2 3 Apple 3 3 - - 0.0 0.0 0.0 0.0 22 Cowpeas 3 3 - - 0.0 0.0 0.0 0.0 18 Chicory 2 - - 2 0.0 0.0 0.0 0.1 81 Turnip 2 - 2 - 0.0% 0.0 0.0 0.0 70 Siliq 2 - - 2 0.0% 0.0 0.0 0.1 Totals 13,347 6,512 4,579 2,257 100.0 100.0 100.0 100.0
21
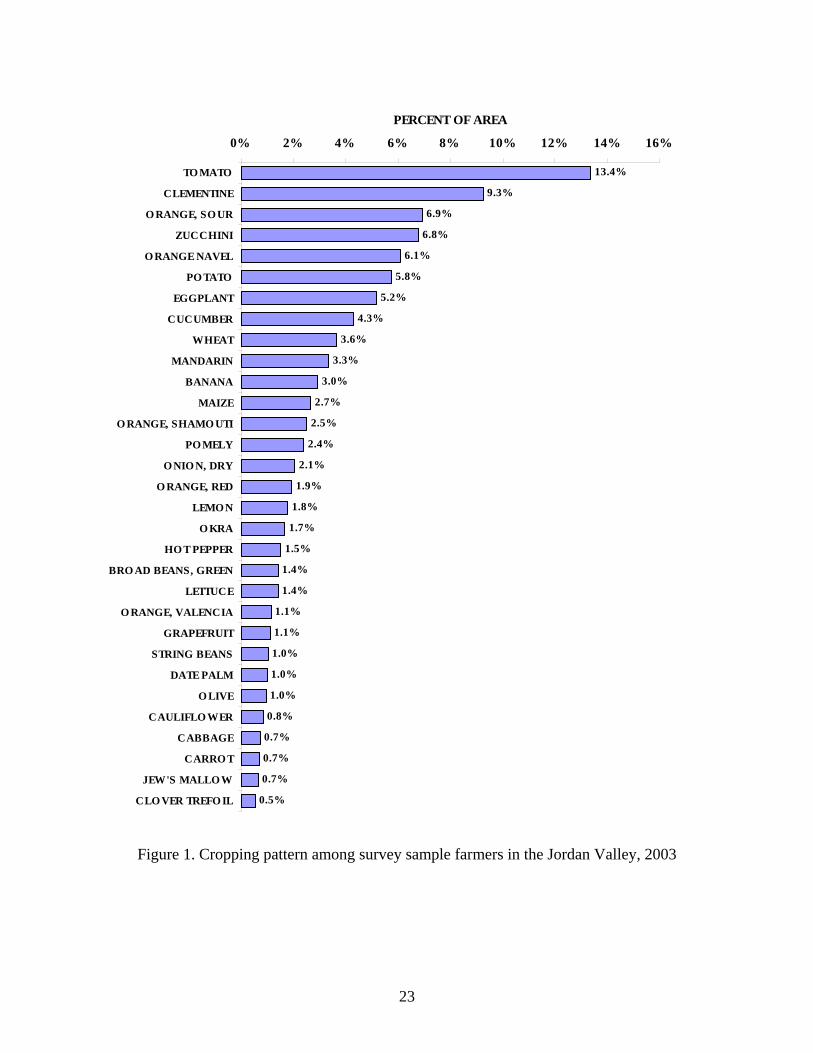
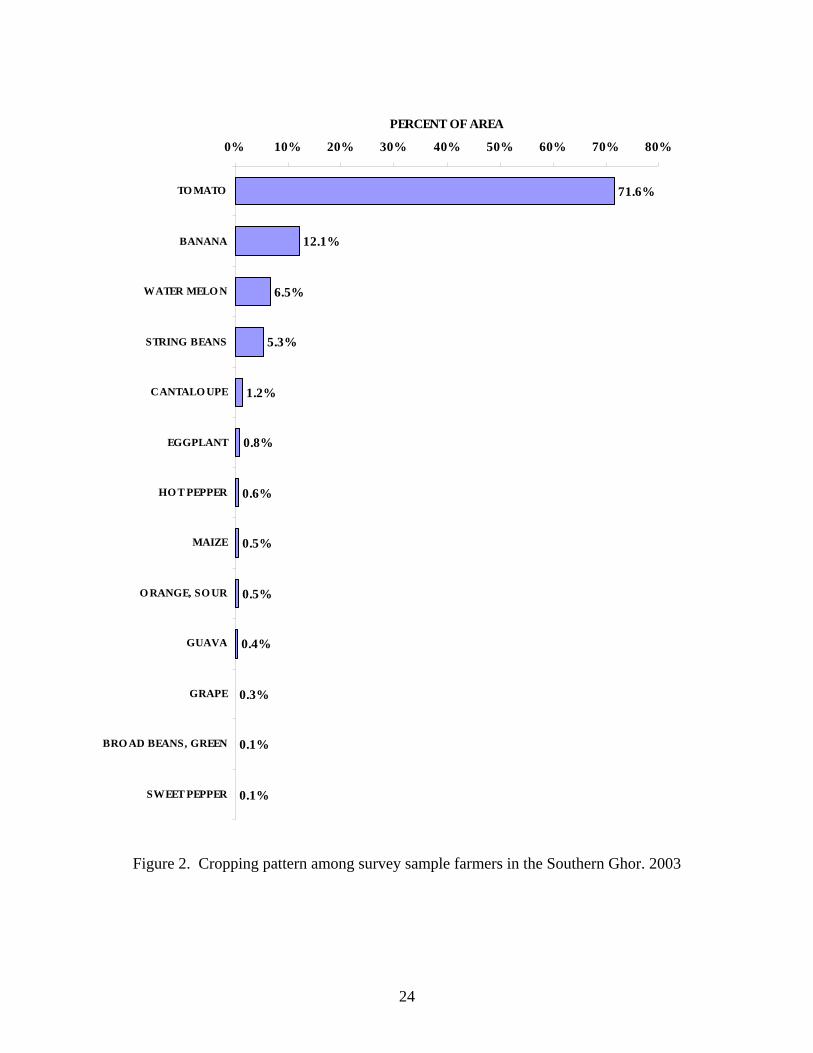
For the Jordan Valley as a whole, the two main crops in terms of area planted are tomatoes (13.4 percent) and clementine oranges (9.3 percent), Figure 1. Tomatoes are followed by sour oranges, zucchini, navel oranges, potatoes, and eggplant that contribute, each, between 5 to 7 percent. Shares between 3 and 4 percent are contributed by banana, cucumbers, mandarin orange, and wheat. A large group of annual crops contribute percentage shares ranging from 1 to 3 percent: maize, hot peppers, green beans, okra, lettuce, and string beans. Minor citrus species account for most of the rest of the cultivated land, including oranges (Shamouti, Red, Valencia), lemon, and grapefruit. Three quarters of irrigated land in the Southern Ghor is exclusively used for growing tomatoes. The only other crops present in any significant rate are bananas (12 percent), watermelons (6.5 percent), and string beans (5.3 percent), Figure 2. In general, the Jordan Valley has a wide variety of crops growing along the valley, with marked local differences between North, Center, and South. A wide range of vegetable crops predominate in the Center and South, while citrus dominate agriculture in the North Jordan Valley. Soil and water salinity problems limit the choice of cropping possibilities in the South. Observers point out that some farmers in 2003 have left part of their farmland uncultivated in response to reduced water availability. This is apparently more frequently done in the south zone. Unfortunately, in our survey data collection this possible non-use of irrigated land was not foreseen and properly accounted for. Subsequent monitoring efforts under the project need to take into account the possibility of farmers letting part of their irrigated area under fallow. Crop areas reported by the survey sample farmers for the 2004 season roughly maintain the same relative importance in the three zones of the valley.
22
13.4%
9.3%
6.9%
6.8%
6.1%
5.8%
5.2%
4.3%
3.6%
3.3%
3.0%
2.7%
2.5%
2.4%
2.1%
1.9%
1.8%
1.7%
1.5%
1.4%
1.4%
1.1%
1.1%
1.0%
1.0%
1.0%
0.8%
0.7%
0.7%
0.7%
0.5%
0% 2% 4% 6% 8% 10% 12% 14% 16%
TO MATO
CLEMENTINE
O RANGE, SOUR
ZUCCHINI
ORANGE NAVEL
PO TATO
EGGPLANT
CUCUMBER
WHEAT
MANDARIN
BANANA
MAIZE
O RANGE, SHAMO UTI
POMELY
ONIO N, DRY
O RANGE, RED
LEMON
O KRA
HO T PEPPER
BRO AD BEANS, GREEN
LETTUCE
O RANGE, VALENCIA
GRAPEFRUIT
STRING BEANS
DATE PALM
O LIVE
CAULIFLO WER
CABBAGE
CARRO T
JEW'S MALLOW
CLO VER TREFO IL
PERCENT OF AREA
Figure 1. Cropping pattern among survey sample farmers in the Jordan Valley, 2003
23
71.6%
12.1%
6.5%
5.3%
1.2%
0.8%
0.6%
0.5%
0.5%
0.4%
0.3%
0.1%
0.1%
0% 10% 20% 30% 40% 50% 60% 70% 80%
TO MATO
BANANA
WATER MELO N
STRING BEANS
CANTALO UPE
EGGPLANT
HO T PEPPER
MAIZE
O RANGE, SO UR
GUAVA
GRAPE
BRO AD BEANS, GREEN
SWEET PEPPER
PERCENT OF AREA
Figure 2. Cropping pattern among survey sample farmers in the Southern Ghor. 2003
24
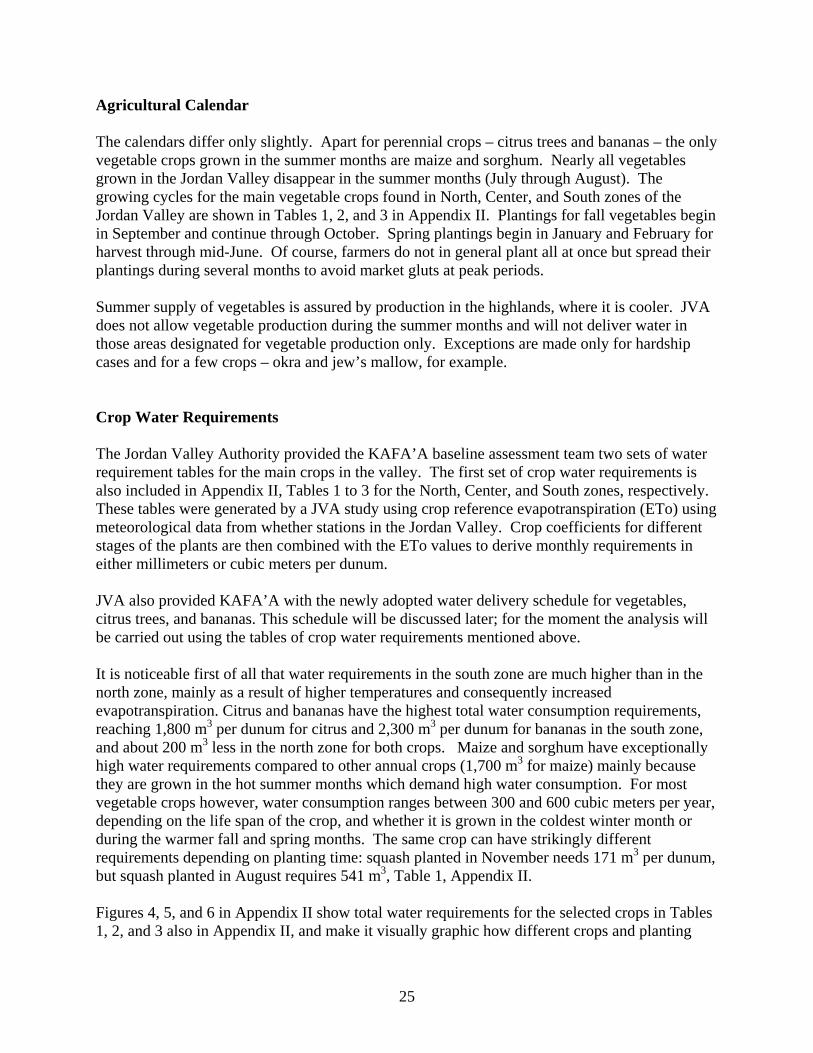
Agricultural Calendar The calendars differ only slightly. Apart for perennial crops – citrus trees and bananas – the only vegetable crops grown in the summer months are maize and sorghum. Nearly all vegetables grown in the Jordan Valley disappear in the summer months (July through August). The growing cycles for the main vegetable crops found in North, Center, and South zones of the Jordan Valley are shown in Tables 1, 2, and 3 in Appendix II. Plantings for fall vegetables begin in September and continue through October. Spring plantings begin in January and February for harvest through mid-June. Of course, farmers do not in general plant all at once but spread their plantings during several months to avoid market gluts at peak periods. Summer supply of vegetables is assured by production in the highlands, where it is cooler. JVA does not allow vegetable production during the summer months and will not deliver water in those areas designated for vegetable production only. Exceptions are made only for hardship cases and for a few crops – okra and jew’s mallow, for example. Crop Water Requirements The Jordan Valley Authority provided the KAFA’A baseline assessment team two sets of water requirement tables for the main crops in the valley. The first set of crop water requirements is also included in Appendix II, Tables 1 to 3 for the North, Center, and South zones, respectively. These tables were generated by a JVA study using crop reference evapotranspiration (ETo) using meteorological data from whether stations in the Jordan Valley. Crop coefficients for different stages of the plants are then combined with the ETo values to derive monthly requirements in either millimeters or cubic meters per dunum. JVA also provided KAFA’A with the newly adopted water delivery schedule for vegetables, citrus trees, and bananas. This schedule will be discussed later; for the moment the analysis will be carried out using the tables of crop water requirements mentioned above. It is noticeable first of all that water requirements in the south zone are much higher than in the north zone, mainly as a result of higher temperatures and consequently increased evapotranspiration. Citrus and bananas have the highest total water consumption requirements, reaching 1,800 m3 per dunum for citrus and 2,300 m3 per dunum for bananas in the south zone, and about 200 m3 less in the north zone for both crops. Maize and sorghum have exceptionally high water requirements compared to other annual crops (1,700 m3 for maize) mainly because they are grown in the hot summer months which demand high water consumption. For most vegetable crops however, water consumption ranges between 300 and 600 cubic meters per year, depending on the life span of the crop, and whether it is grown in the coldest winter month or during the warmer fall and spring months. The same crop can have strikingly different requirements depending on planting time: squash planted in November needs 171 m3 per dunum, but squash planted in August requires 541 m3, Table 1, Appendix II. Figures 4, 5, and 6 in Appendix II show total water requirements for the selected crops in Tables 1, 2, and 3 also in Appendix II, and make it visually graphic how different crops and planting
25
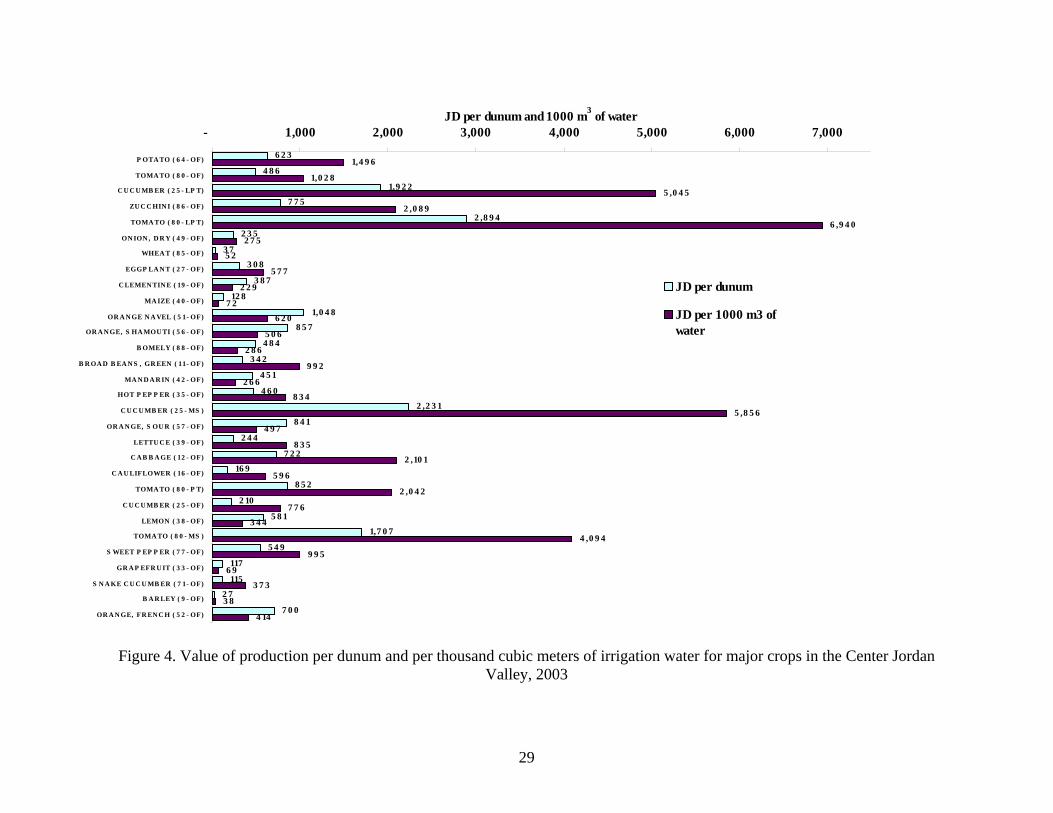
times can affect crop water requirements. Paradoxically, farming methods do not appreciably affect water requirements: greenhouse tomatoes require roughly the same amount of water than open field tomatoes. Of course, yields of vegetables grown greenhouses are several times the yields obtained in open fields, and therefore the productivity of water is higher. Gross Crop Revenue The baseline survey questionnaire requested from sample farmers the area planted to each crop, but also the estimated yield per dunum and the average price received per dunum. Only the information for 2003 was used to estimate revenues because the survey was conducted in February and March 2004, halfway through the winter season. Yields were normally obtained in number of boxes per dunum, and the average weight in kilograms per box was recorded. Note on data exclusion: The survey data contain several instances where the revenue figures were suspected, either because they are extremely high, or extremely low. In those cases those entries were removed from the calculations. A “flag” or dummy variable was introduced in the original Access data table for section 9 of the questionnaire (T9_Crop_Baseline) to exclude certain entries from the analysis. The flag value was set to “1” when the entry is acceptable and to “0” when the entry is not acceptable for analysis. Unacceptable entries were those with either no revenue generated, or those with value below 20 dinars per dunum. Most of the extremely low values were attributed to data collection or data entry errors. Analysis regarding revenue was therefore based on entries for crops that generated significant revenue. Fields of bananas or tree crops that were not at production stage are therefore not included in the analysis, nor are those field crops that failed completely. The process also excluded a few crop entries for fields with 10,000 dinars per dunum and above because they were deemed excessively high and atypical. The value of production was computed for every crop in each farm unit in the sample. Figure 3 shows gross revenue per dunum in the North Jordan Valley, for the crops with the largest planted area in that zone. Figure 3 also shows the value of production per 1000 cubic meters of water, as estimated using the crop water requirements tables. Few of the crops in the North Jordan Valley generate over 500 JD per dunum, with the notable exceptions of bananas, navel oranges, red oranges, lemon, potatoes, and French and local oranges. Most citrus crops yield gross revenues between 300 and 400 dinars per dunum. Among the worst performers in terms or revenue per dunum are grains such as wheat, barley, and maize, and berseem (clover). In terms of gross revenue per thousand cubic meters of water, the top performers are vegetable crops like potatoes, eggplant, lettuce, tomatoes, and bananas. Citrus varieties as a group generate revenue per unit of water below 400 dinars per 1,000 m3. By contrast, in Figure 4 many of the bars representing gross revenue per dunum and per thousand cubic meters of water in the Center Jordan Valley exceed 1,000 JD. Many of the predominant crops in the zone have revenue exceeding 500 JD per dunum, including potatoes,
26
tomatoes under plastic tunnels, zucchini, cucumbers, cabbage, sweet peppers, and a few citrus trees (navel, shamouti, and French oranges). The Center Jordan Valley also performs well in terms of gross revenue per thousand cubic meters of water requirements, with the top performing crops being cucumbers and tomatoes grown under greenhouses, zucchini, and cabbage. Several open field vegetables also generate gross revenues per 1000 m3 of water above 500 JD, including potatoes, tomatoes, broad beans, hot and sweet peppers, lettuce and cauliflower. The weakest performers in terms of revenue per unit of water are again the grain crops – wheat, barley, and maize. Citrus trees are weak performers with the exception of navel oranges that yield over 500 JD per 1000 m3 of water. A similar picture emerges for the South Jordan Valley in Figure 5. Cucumbers and tomatoes grown under greenhouses have outstanding revenues per dunum as well as per thousand cubic meters of water. Maize and wheat are among the poorest performers. Several open field vegetables perform relatively well, with revenues per 1000 m3 of water above 500 JD, including tomatoes, eggplant, zucchini, potatoes, squash, and cauliflower. In general, vegetable crops have some of the highest gross revenues both per dunum and per thousand cubic meters of water, especially those vegetables that are grown under greenhouses as cucumbers and tomatoes. Investments in green housing using plastic raises water and land productivity, though they also require sizeable investments that may be beyond the reach of many farmers. Grains perform on average very poorly, both in terms of returns per unit of land and water. Citrus crops are in general weak performers, with the notable exception of navel, shamouti, and red oranges.
Monthly water requirements per zone It is possible to generate a profile of monthly water requirement by zone based on the cropping patterns prevalent in the three zones of the Jordan Valley, as they emerge from the baseline survey, combined with the crop water requirements obtained from the Jordan Valley Authority. Figure 6 shows graphically the wide variation in requirements for the North zone, from a low of 32 m3 per dunum in January to over 160 m3 per dunum in July and August. Most of high water consumption occurs in the hot summer months from May through October. The prevalence of citrus trees in the North Jordan Valley explains this highly demanding pattern of water requirements in the North. Water requirements in the Center Jordan Valley are much lower than in the North, with the highest monthly demand occurring in October, 83 m3 per dunum, half as much as in the North, Figure 6. The lowest water demand also happens in January (19 m3 per dunum). April also exhibits a high water demand because many vegetables are in full production and the weather beings to warm up, but throughout most of the year crop water requirements in the Center zone remain below 60 m3 per dunum (2 mm per day). This is mainly due to the prevalence of vegetable crops with low water requirements.
27
287
470
688
396
191
288
1,136
548
47
310
645
495
567
236
623
370
111
507
575
96
105
91
138
207
29
75
99
240
175
171
280
410
236
514
607
518
326
63
185
384
295
338
141
1,494
687
130
302
342
272
289
305
249
123
38
44
177
801
199
0 500 1,000 1,500 2,000 2,500 3,000
CLEMENTINE (19-OF)
ORANGE, SOUR (57-OF)
ORANGE NAVEL (51-OF)
MANDARIN (42-OF)
ZUCCHINI (86-OF)
TOMATO (80-OF)
BANANA (8-OF)
ORANGE, RED (55-OF)
WHEAT (85-OF)
BOMELY (88-OF)
LEMON (38-OF)
ORANGE, SHAMOUTI (56-OF)
ORANGE, VALENCIA (58-OF)
GRAPEFRUIT (33-OF)
POTATO (64-OF)
EGGPLANT (27-OF)
CLOVER TREFOIL (20-OF)
ORANGE, FRENCH (52-OF)
ORANGE, LOCAL (54-OF)
CABBAGE (12-OF)
BROAD BEANS, GREEN (11-OF)
CAULIFLOWER (16-OF)
SWEET PEPPER (77-OF)
ORANGE, KING (53-OF)
BARLEY (9-OF)
MAIZE (40-OF)
HOT PEPPER (35-OF)
LETTUCE (39-OF)
ONION, DRY (49-OF)
JD per dunum and 1000 m3 of water
JD per dunum
JD per 1000 m3 ofwater
Figure 3. Value of production per dunum and per thousand cubic meters of irrigation water for
major crops in the North Jordan Valley, 2003
28
6 2 3
4 8 6
1,9 2 2
7 7 5
2 ,8 9 4
2 3 5
3 7
3 0 8
3 8 7
12 8
1,0 4 8
8 5 7
4 8 4
3 4 2
4 5 1
4 6 0
2 ,2 3 1
8 4 1
2 4 4
7 2 2
16 9
8 5 2
2 10
5 8 1
1,7 0 7
5 4 9
117
115
2 7
7 0 0
1,4 9 6
1,0 2 8
5 ,0 4 5
2 ,0 8 9
6 ,9 4 0
2 7 5
5 2
5 7 7
2 2 9
7 2
6 2 0
5 0 6
2 8 6
9 9 2
2 6 6
8 3 4
5 ,8 5 6
4 9 7
8 3 5
2 ,10 1
5 9 6
2 ,0 4 2
7 7 6
3 4 4
4 ,0 9 4
9 9 5
6 9
3 7 3
3 8
4 14
- 1,000 2,000 3,000 4,000 5,000 6,000 7,000
P OTA TO ( 6 4 - OF)
TOMA TO ( 8 0 - OF)
C U C U MB ER ( 2 5 - LP T)
ZUC C HIN I ( 8 6 - OF)
TOMA TO ( 8 0 - LP T)
ON ION , D R Y ( 4 9 - OF)
WHEA T ( 8 5 - OF)
EGGP LA N T ( 2 7 - OF)
C LEMEN TIN E ( 19 - OF)
MA IZE ( 4 0 - OF)
OR A N GE N A VEL ( 5 1- OF)
OR A NGE, S HA MOU TI ( 5 6 - OF)
B OMELY ( 8 8 - OF)
B R OA D B EA N S , GR EEN ( 11- OF)
MA N D A R IN ( 4 2 - OF)
HOT P EP P ER ( 3 5 - OF)
C U C UMB ER ( 2 5 - MS )
OR A N GE, S OU R ( 5 7 - OF)
LETTU C E ( 3 9 - OF)
C AB B A GE ( 12 - OF)
C A U LIFLOWER ( 16 - OF)
TOMA TO ( 8 0 - P T)
C U C UMB ER ( 2 5 - OF)
LEMON ( 3 8 - OF)
TOMA TO ( 8 0 - MS )
S WEET P EP P ER ( 7 7 - OF)
GR A P EFR U IT ( 3 3 - OF)
S N A KE C U C U MB ER ( 7 1- OF)
B A R LEY ( 9 - OF)
OR A N GE, FR EN C H ( 5 2 - OF)
JD per dunum and 1000 m3 of water
JD per dunum
JD per 1000 m3 ofwater
Figure 4. Value of production per dunum and per thousand cubic meters of irrigation water for major crops in the Center Jordan
Valley, 2003
29
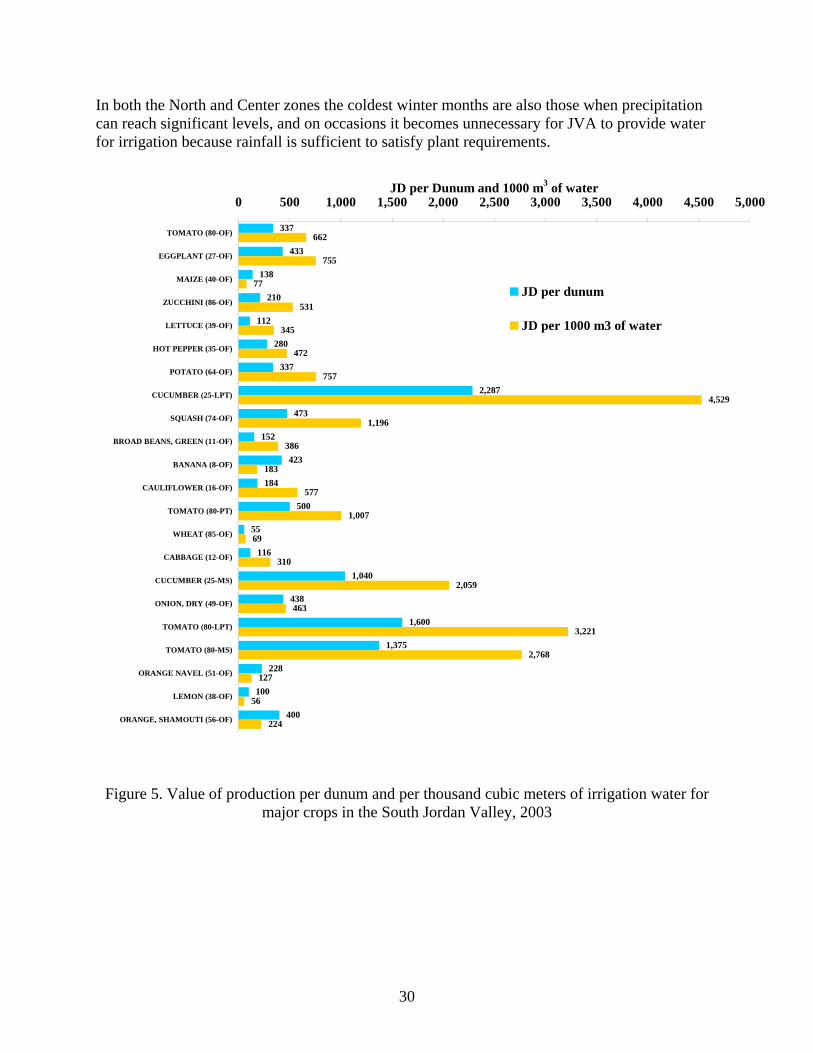
In both the North and Center zones the coldest winter months are also those when precipitation can reach significant levels, and on occasions it becomes unnecessary for JVA to provide water for irrigation because rainfall is sufficient to satisfy plant requirements.
337
433
138
210
112
280
337
2,287
473
152
423
184
500
55
116
1,040
438
1,600
1,375
228
100
400
662
755
77
531
345
472
757
4,529
1,196
386
183
577
1,007
69
310
2,059
463
3,221
2,768
127
56
224
0 500 1,000 1,500 2,000 2,500 3,000 3,500 4,000 4,500 5,000
TOMATO (80-OF)
EGGPLANT (27-OF)
MAIZE (40-OF)
ZUCCHINI (86-OF)
LETTUCE (39-OF)
HOT PEPPER (35-OF)
POTATO (64-OF)
CUCUMBER (25-LPT)
SQUASH (74-OF)
BROAD BEANS, GREEN (11-OF)
BANANA (8-OF)
CAULIFLOWER (16-OF)
TOMATO (80-PT)
WHEAT (85-OF)
CABBAGE (12-OF)
CUCUMBER (25-MS)
ONION, DRY (49-OF)
TOMATO (80-LPT)
TOMATO (80-MS)
ORANGE NAVEL (51-OF)
LEMON (38-OF)
ORANGE, SHAMOUTI (56-OF)
JD per Dunum and 1000 m3 of water
JD per dunum
JD per 1000 m3 of water
Figure 5. Value of production per dunum and per thousand cubic meters of irrigation water for major crops in the South Jordan Valley, 2003
30
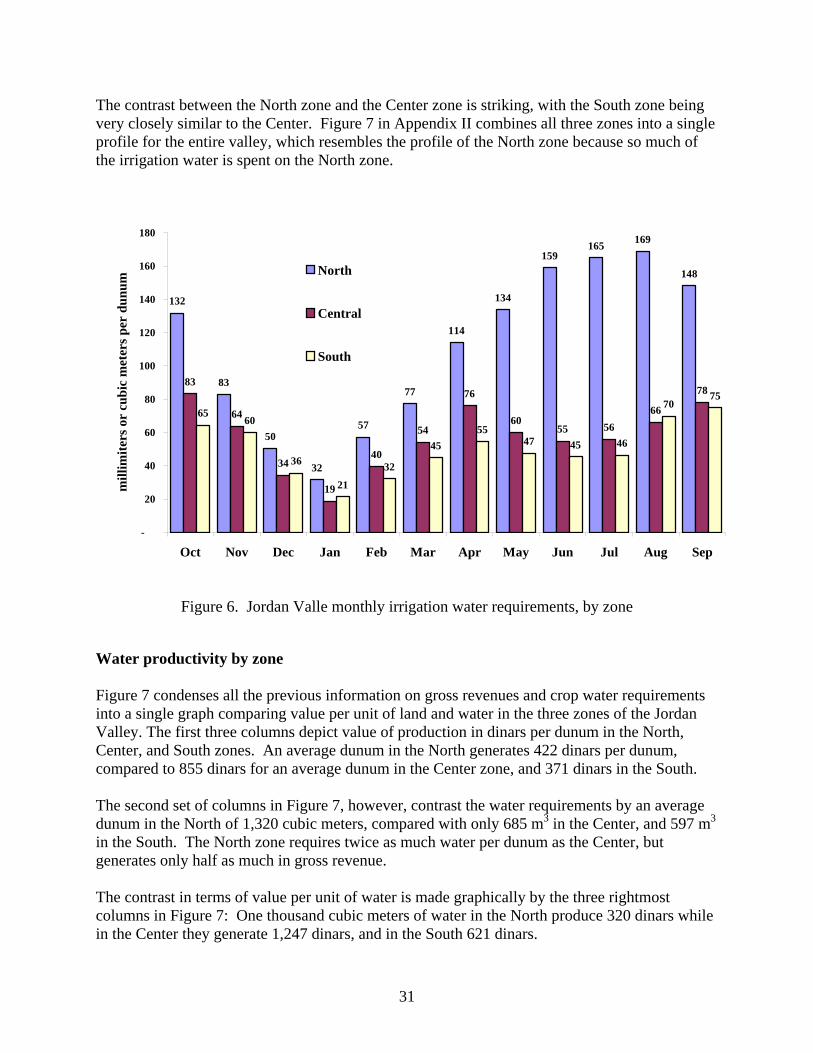
The contrast between the North zone and the Center zone is striking, with the South zone being very closely similar to the Center. Figure 7 in Appendix II combines all three zones into a single profile for the entire valley, which resembles the profile of the North zone because so much of the irrigation water is spent on the North zone.
132
83
50
32
57
77
114
134
159165 169
148
83
64
34
19
40
54
76
6055 56
66
78
6560
36
21
32
4555
47 45 46
7075
-
20
40
60
80
100
120
140
160
180
Oct Nov Dec Jan Feb Mar Apr May Jun Jul Aug Sep
mill
imite
rs o
r cu
bic
met
ers p
er d
unum
North
Central
South
Figure 6. Jordan Valle monthly irrigation water requirements, by zone
Water productivity by zone Figure 7 condenses all the previous information on gross revenues and crop water requirements into a single graph comparing value per unit of land and water in the three zones of the Jordan Valley. The first three columns depict value of production in dinars per dunum in the North, Center, and South zones. An average dunum in the North generates 422 dinars per dunum, compared to 855 dinars for an average dunum in the Center zone, and 371 dinars in the South. The second set of columns in Figure 7, however, contrast the water requirements by an average dunum in the North of 1,320 cubic meters, compared with only 685 m3 in the Center, and 597 m3 in the South. The North zone requires twice as much water per dunum as the Center, but generates only half as much in gross revenue. The contrast in terms of value per unit of water is made graphically by the three rightmost columns in Figure 7: One thousand cubic meters of water in the North produce 320 dinars while in the Center they generate 1,247 dinars, and in the South 621 dinars.
31
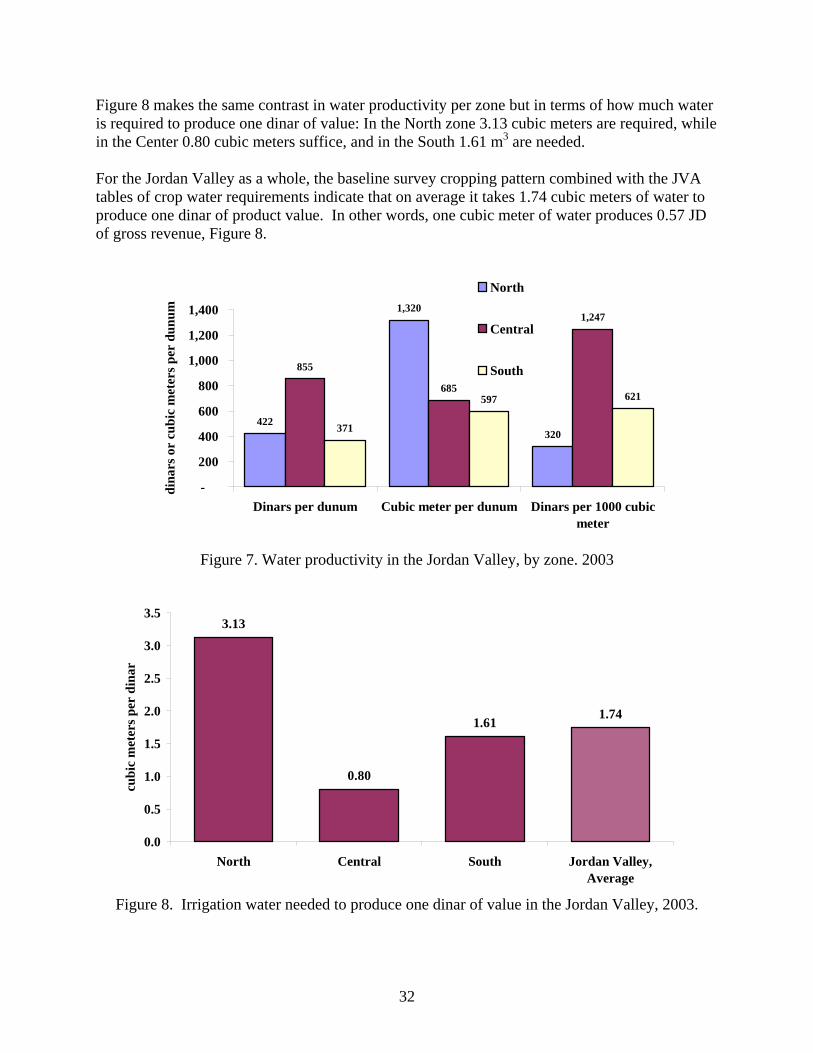
Figure 8 makes the same contrast in water productivity per zone but in terms of how much water is required to produce one dinar of value: In the North zone 3.13 cubic meters are required, while in the Center 0.80 cubic meters suffice, and in the South 1.61 m3 are needed. For the Jordan Valley as a whole, the baseline survey cropping pattern combined with the JVA tables of crop water requirements indicate that on average it takes 1.74 cubic meters of water to produce one dinar of product value. In other words, one cubic meter of water produces 0.57 JD of gross revenue, Figure 8.
422
1,320
320
855
685
1,247
371
597 621
-
200
400
600
800
1,000
1,200
1,400
Dinars per dunum Cubic meter per dunum Dinars per 1000 cubicmeter
dina
rs o
r cu
bic
met
ers p
er d
unum
North
Central
South
Figure 7. Water productivity in the Jordan Valley, by zone. 2003
3.13
0.80
1.611.74
0.0
0.5
1.0
1.5
2.0
2.5
3.0
3.5
North Central South Jordan Valley,Average
cubi
c m
eter
s per
din
ar
Figure 8. Irrigation water needed to produce one dinar of value in the Jordan Valley, 2003.
32
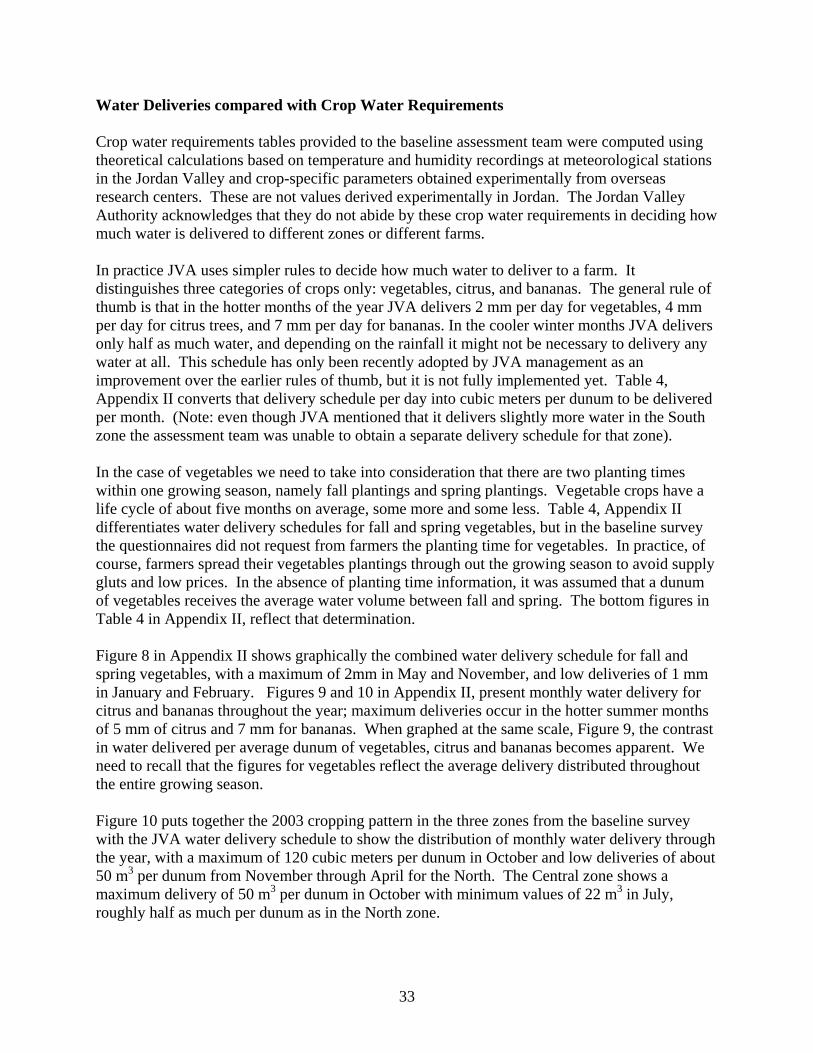
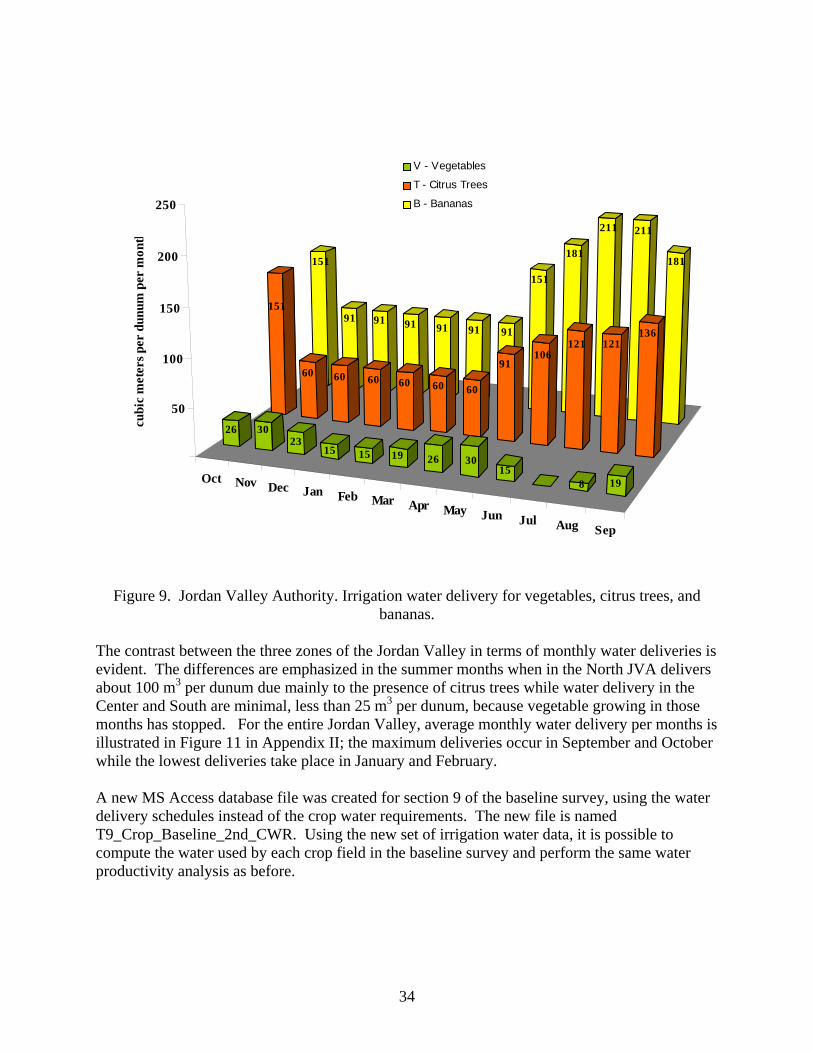
Water Deliveries compared with Crop Water Requirements Crop water requirements tables provided to the baseline assessment team were computed using theoretical calculations based on temperature and humidity recordings at meteorological stations in the Jordan Valley and crop-specific parameters obtained experimentally from overseas research centers. These are not values derived experimentally in Jordan. The Jordan Valley Authority acknowledges that they do not abide by these crop water requirements in deciding how much water is delivered to different zones or different farms. In practice JVA uses simpler rules to decide how much water to deliver to a farm. It distinguishes three categories of crops only: vegetables, citrus, and bananas. The general rule of thumb is that in the hotter months of the year JVA delivers 2 mm per day for vegetables, 4 mm per day for citrus trees, and 7 mm per day for bananas. In the cooler winter months JVA delivers only half as much water, and depending on the rainfall it might not be necessary to delivery any water at all. This schedule has only been recently adopted by JVA management as an improvement over the earlier rules of thumb, but it is not fully implemented yet. Table 4, Appendix II converts that delivery schedule per day into cubic meters per dunum to be delivered per month. (Note: even though JVA mentioned that it delivers slightly more water in the South zone the assessment team was unable to obtain a separate delivery schedule for that zone). In the case of vegetables we need to take into consideration that there are two planting times within one growing season, namely fall plantings and spring plantings. Vegetable crops have a life cycle of about five months on average, some more and some less. Table 4, Appendix II differentiates water delivery schedules for fall and spring vegetables, but in the baseline survey the questionnaires did not request from farmers the planting time for vegetables. In practice, of course, farmers spread their vegetables plantings through out the growing season to avoid supply gluts and low prices. In the absence of planting time information, it was assumed that a dunum of vegetables receives the average water volume between fall and spring. The bottom figures in Table 4 in Appendix II, reflect that determination. Figure 8 in Appendix II shows graphically the combined water delivery schedule for fall and spring vegetables, with a maximum of 2mm in May and November, and low deliveries of 1 mm in January and February. Figures 9 and 10 in Appendix II, present monthly water delivery for citrus and bananas throughout the year; maximum deliveries occur in the hotter summer months of 5 mm of citrus and 7 mm for bananas. When graphed at the same scale, Figure 9, the contrast in water delivered per average dunum of vegetables, citrus and bananas becomes apparent. We need to recall that the figures for vegetables reflect the average delivery distributed throughout the entire growing season. Figure 10 puts together the 2003 cropping pattern in the three zones from the baseline survey with the JVA water delivery schedule to show the distribution of monthly water delivery through the year, with a maximum of 120 cubic meters per dunum in October and low deliveries of about 50 m3 per dunum from November through April for the North. The Central zone shows a maximum delivery of 50 m3 per dunum in October with minimum values of 22 m3 in July, roughly half as much per dunum as in the North zone.
33
Oct Nov Dec Jan Feb Mar Apr May Jun Jul Aug Sep
151
91 91 91 91 91 91
151
181
211 211
181
151
60 60 60 60 60 60
91106
121 121136
26 3023
15 15 19 26 3015
8 19
50
100
150
200
250
cubi
c m
eter
s per
dun
um p
er m
onth
V - Vegetables
T - Citrus Trees
B - Bananas
Figure 9. Jordan Valley Authority. Irrigation water delivery for vegetables, citrus trees, and
bananas.
The contrast between the three zones of the Jordan Valley in terms of monthly water deliveries is evident. The differences are emphasized in the summer months when in the North JVA delivers about 100 m3 per dunum due mainly to the presence of citrus trees while water delivery in the Center and South are minimal, less than 25 m3 per dunum, because vegetable growing in those months has stopped. For the entire Jordan Valley, average monthly water delivery per months is illustrated in Figure 11 in Appendix II; the maximum deliveries occur in September and October while the lowest deliveries take place in January and February. A new MS Access database file was created for section 9 of the baseline survey, using the water delivery schedules instead of the crop water requirements. The new file is named T9_Crop_Baseline_2nd_CWR. Using the new set of irrigation water data, it is possible to compute the water used by each crop field in the baseline survey and perform the same water productivity analysis as before.
34
120
54 52 51 51 51 53
78
87
95 97
109
50
3630
24 24 2733
41
32
2229
4134 33
2619 19
2229
35
23
1017
27
-
20
40
60
80
100
120
140
Oct Nov Dec Jan Feb Mar Apr May Jun Jul Aug Sep
cubi
c m
eter
s per
dun
um
North
Central
South
Fig. 10. Monthly water delivery schedule in the Jordan Valley, by zone, 2003
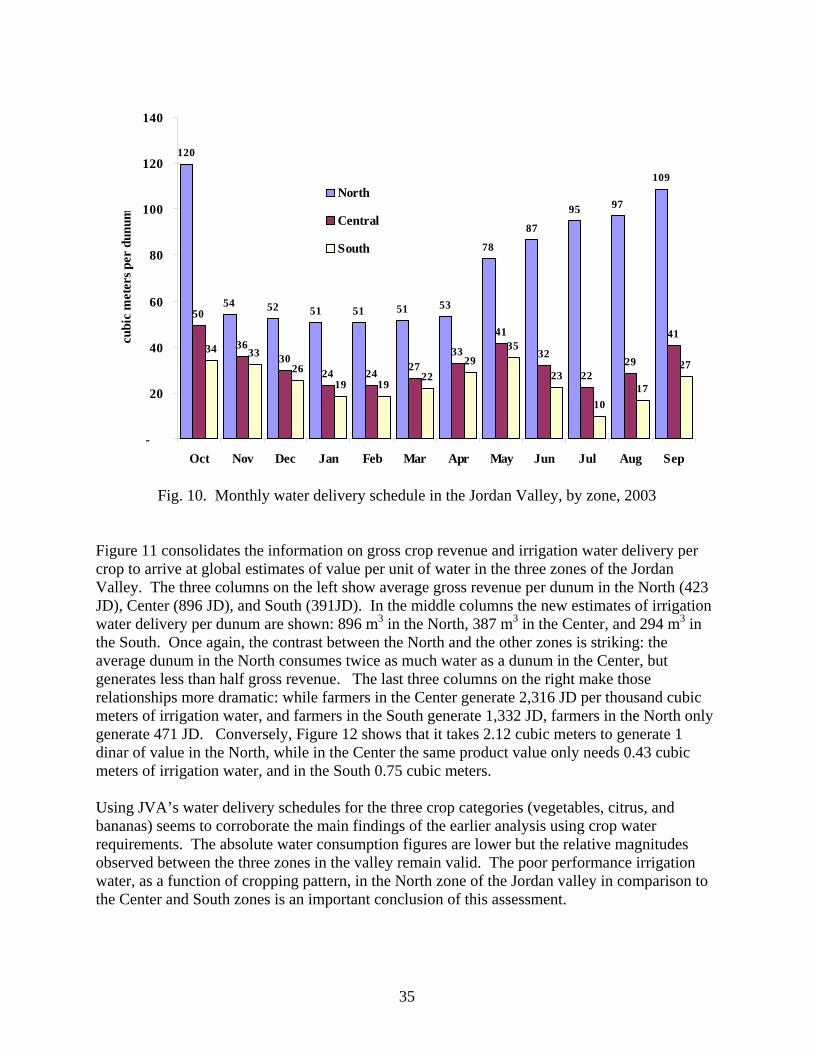
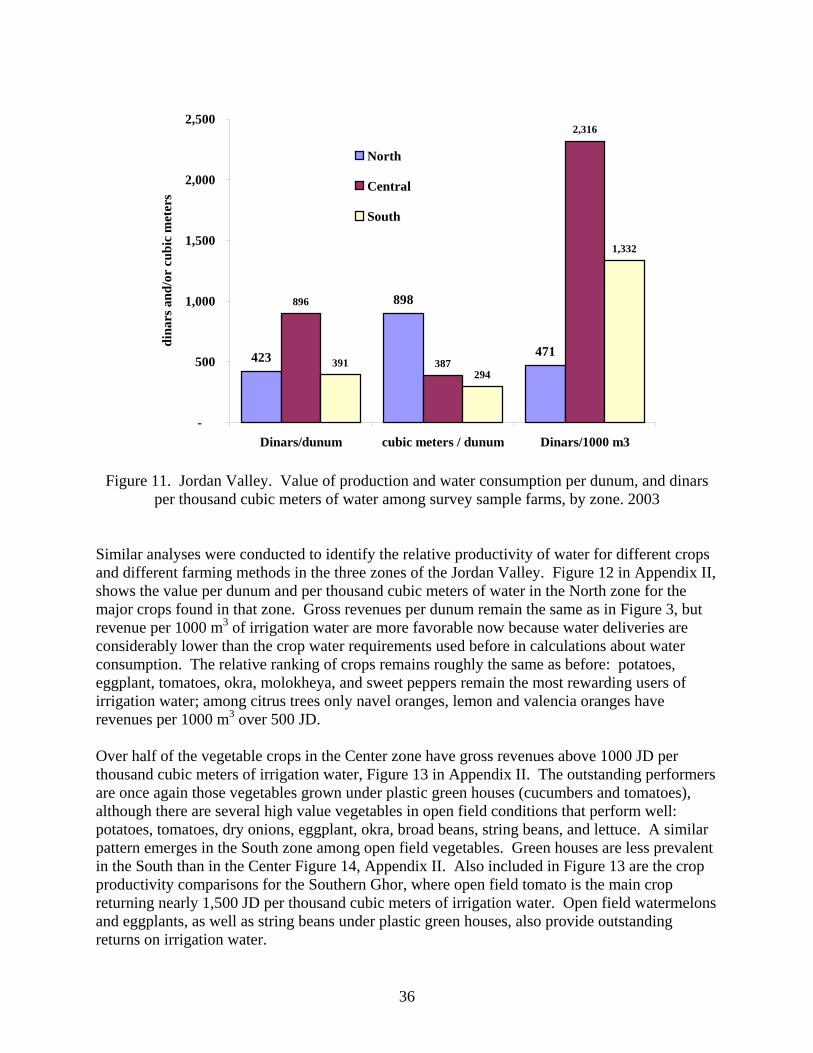
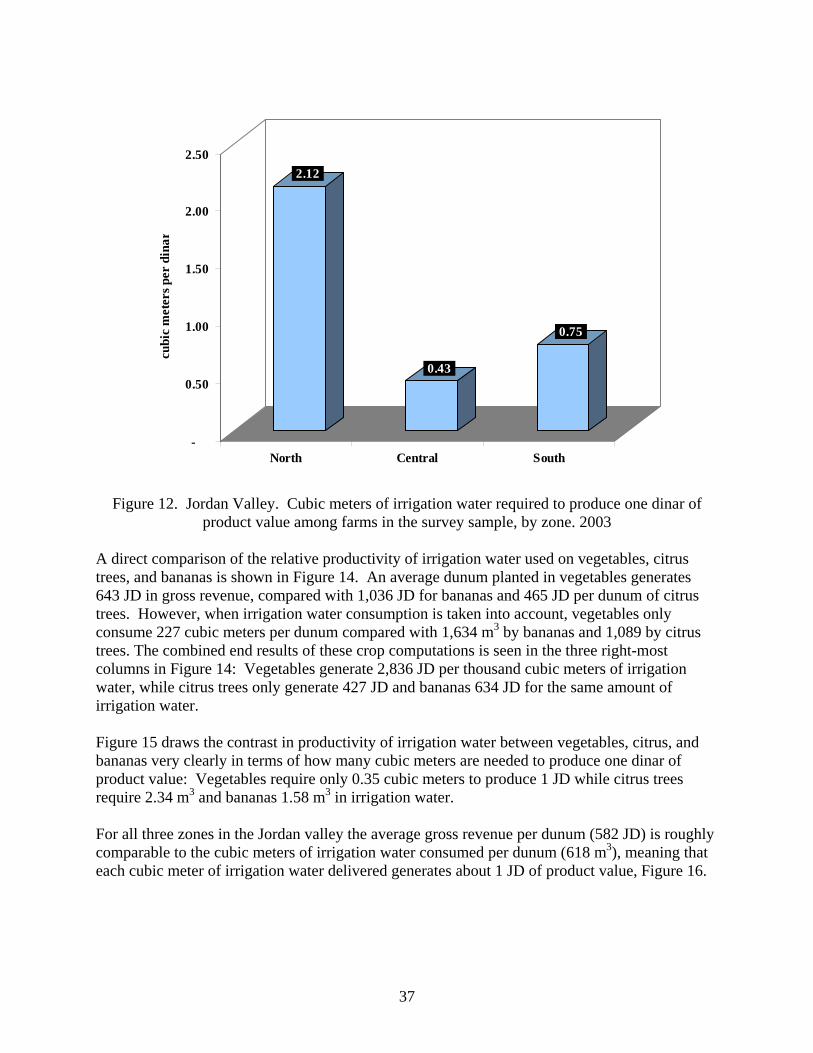
Figure 11 consolidates the information on gross crop revenue and irrigation water delivery per crop to arrive at global estimates of value per unit of water in the three zones of the Jordan Valley. The three columns on the left show average gross revenue per dunum in the North (423 JD), Center (896 JD), and South (391JD). In the middle columns the new estimates of irrigation water delivery per dunum are shown: 896 m3 in the North, 387 m3 in the Center, and 294 m3 in the South. Once again, the contrast between the North and the other zones is striking: the average dunum in the North consumes twice as much water as a dunum in the Center, but generates less than half gross revenue. The last three columns on the right make those relationships more dramatic: while farmers in the Center generate 2,316 JD per thousand cubic meters of irrigation water, and farmers in the South generate 1,332 JD, farmers in the North only generate 471 JD. Conversely, Figure 12 shows that it takes 2.12 cubic meters to generate 1 dinar of value in the North, while in the Center the same product value only needs 0.43 cubic meters of irrigation water, and in the South 0.75 cubic meters. Using JVA’s water delivery schedules for the three crop categories (vegetables, citrus, and bananas) seems to corroborate the main findings of the earlier analysis using crop water requirements. The absolute water consumption figures are lower but the relative magnitudes observed between the three zones in the valley remain valid. The poor performance irrigation water, as a function of cropping pattern, in the North zone of the Jordan valley in comparison to the Center and South zones is an important conclusion of this assessment.
35
423
898
471
896
387
2,316
391294
1,332
-
500
1,000
1,500
2,000
2,500
Dinars/dunum cubic meters / dunum Dinars/1000 m3
dina
rs a
nd/o
r cu
bic
met
ers
North
Central
South
Figure 11. Jordan Valley. Value of production and water consumption per dunum, and dinars
per thousand cubic meters of water among survey sample farms, by zone. 2003 Similar analyses were conducted to identify the relative productivity of water for different crops and different farming methods in the three zones of the Jordan Valley. Figure 12 in Appendix II, shows the value per dunum and per thousand cubic meters of water in the North zone for the major crops found in that zone. Gross revenues per dunum remain the same as in Figure 3, but revenue per 1000 m3 of irrigation water are more favorable now because water deliveries are considerably lower than the crop water requirements used before in calculations about water consumption. The relative ranking of crops remains roughly the same as before: potatoes, eggplant, tomatoes, okra, molokheya, and sweet peppers remain the most rewarding users of irrigation water; among citrus trees only navel oranges, lemon and valencia oranges have revenues per 1000 m3 over 500 JD. Over half of the vegetable crops in the Center zone have gross revenues above 1000 JD per thousand cubic meters of irrigation water, Figure 13 in Appendix II. The outstanding performers are once again those vegetables grown under plastic green houses (cucumbers and tomatoes), although there are several high value vegetables in open field conditions that perform well: potatoes, tomatoes, dry onions, eggplant, okra, broad beans, string beans, and lettuce. A similar pattern emerges in the South zone among open field vegetables. Green houses are less prevalent in the South than in the Center Figure 14, Appendix II. Also included in Figure 13 are the crop productivity comparisons for the Southern Ghor, where open field tomato is the main crop returning nearly 1,500 JD per thousand cubic meters of irrigation water. Open field watermelons and eggplants, as well as string beans under plastic green houses, also provide outstanding returns on irrigation water.
36
2.12
0.43
0.75
-
0.50
1.00
1.50
2.00
2.50cu
bic
met
ers p
er d
inar
North Central South
Figure 12. Jordan Valley. Cubic meters of irrigation water required to produce one dinar of
product value among farms in the survey sample, by zone. 2003 A direct comparison of the relative productivity of irrigation water used on vegetables, citrus trees, and bananas is shown in Figure 14. An average dunum planted in vegetables generates 643 JD in gross revenue, compared with 1,036 JD for bananas and 465 JD per dunum of citrus trees. However, when irrigation water consumption is taken into account, vegetables only consume 227 cubic meters per dunum compared with 1,634 m3 by bananas and 1,089 by citrus trees. The combined end results of these crop computations is seen in the three right-most columns in Figure 14: Vegetables generate 2,836 JD per thousand cubic meters of irrigation water, while citrus trees only generate 427 JD and bananas 634 JD for the same amount of irrigation water. Figure 15 draws the contrast in productivity of irrigation water between vegetables, citrus, and bananas very clearly in terms of how many cubic meters are needed to produce one dinar of product value: Vegetables require only 0.35 cubic meters to produce 1 JD while citrus trees require 2.34 m3 and bananas 1.58 m3 in irrigation water. For all three zones in the Jordan valley the average gross revenue per dunum (582 JD) is roughly comparable to the cubic meters of irrigation water consumed per dunum (618 m3), meaning that each cubic meter of irrigation water delivered generates about 1 JD of product value, Figure 16.
37
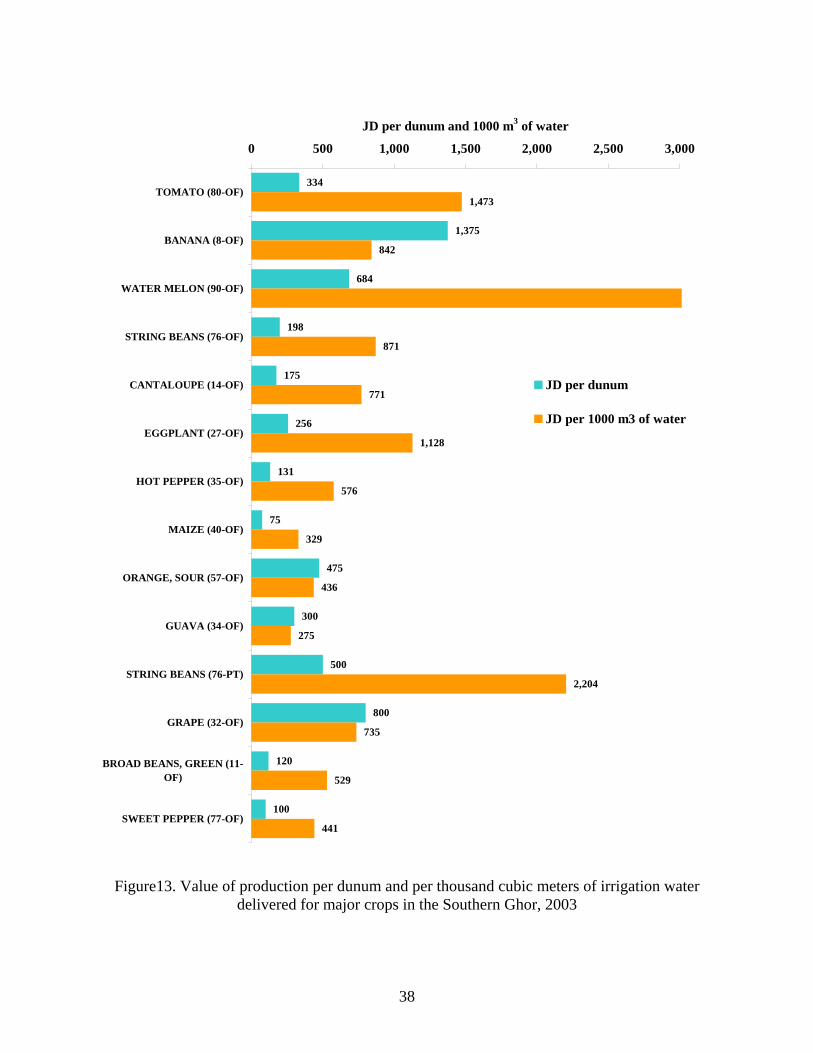
334
1,375
684
198
175
256
131
75
475
300
500
800
120
100
1,473
842
871
771
1,128
576
329
436
275
2,204
735
529
441
0 500 1,000 1,500 2,000 2,500 3,000
TOMATO (80-OF)
BANANA (8-OF)
WATER MELON (90-OF)
STRING BEANS (76-OF)
CANTALOUPE (14-OF)
EGGPLANT (27-OF)
HOT PEPPER (35-OF)
MAIZE (40-OF)
ORANGE, SOUR (57-OF)
GUAVA (34-OF)
STRING BEANS (76-PT)
GRAPE (32-OF)
BROAD BEANS, GREEN (11-OF)
SWEET PEPPER (77-OF)
JD per dunum and 1000 m3 of water
JD per dunum
JD per 1000 m3 of water
Figure13. Value of production per dunum and per thousand cubic meters of irrigation water delivered for major crops in the Southern Ghor, 2003
38
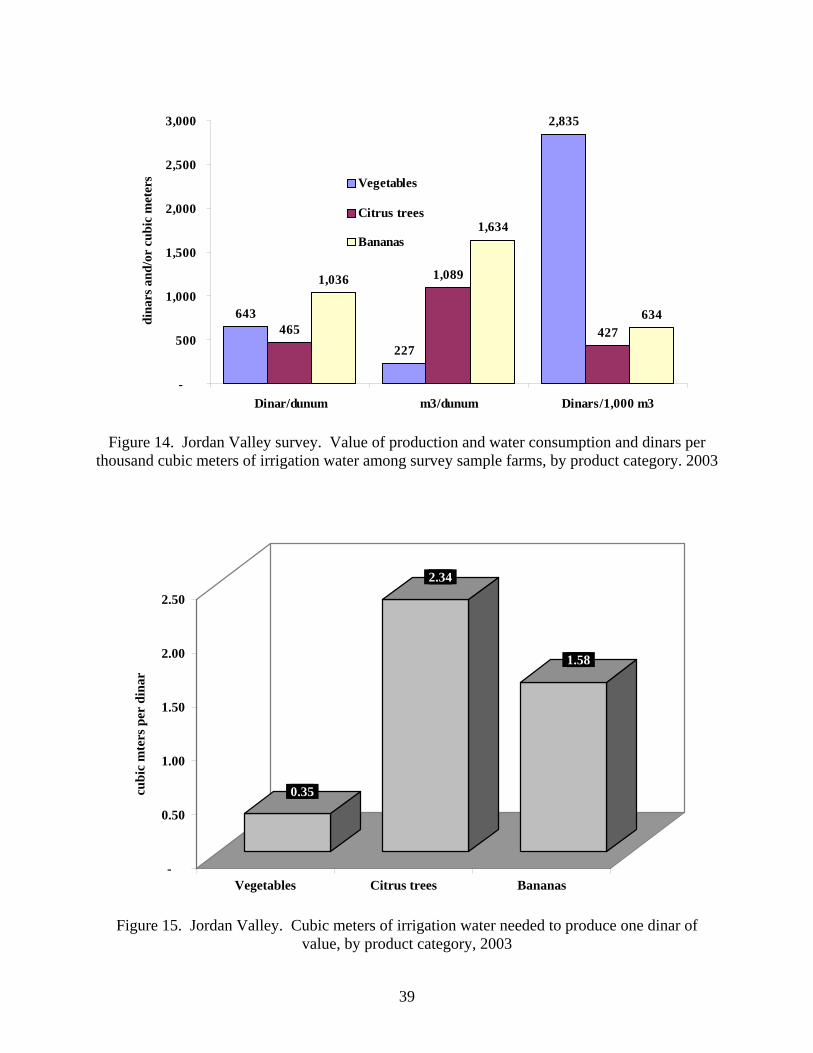
643
227
2,835
465
1,089
427
1,036
1,634
634
-
500
1,000
1,500
2,000
2,500
3,000
Dinar/dunum m3/dunum Dinars/1,000 m3
dina
rs a
nd/o
r cu
bic
met
ers Vegetables
Citrus trees
Bananas
Figure 14. Jordan Valley survey. Value of production and water consumption and dinars per
thousand cubic meters of irrigation water among survey sample farms, by product category. 2003
0.35
2.34
1.58
-
0.50
1.00
1.50
2.00
2.50
cubi
c m
ters
per
din
ar
Vegetables Citrus trees Bananas
Figure 15. Jordan Valley. Cubic meters of irrigation water needed to produce one dinar of
value, by product category, 2003
39
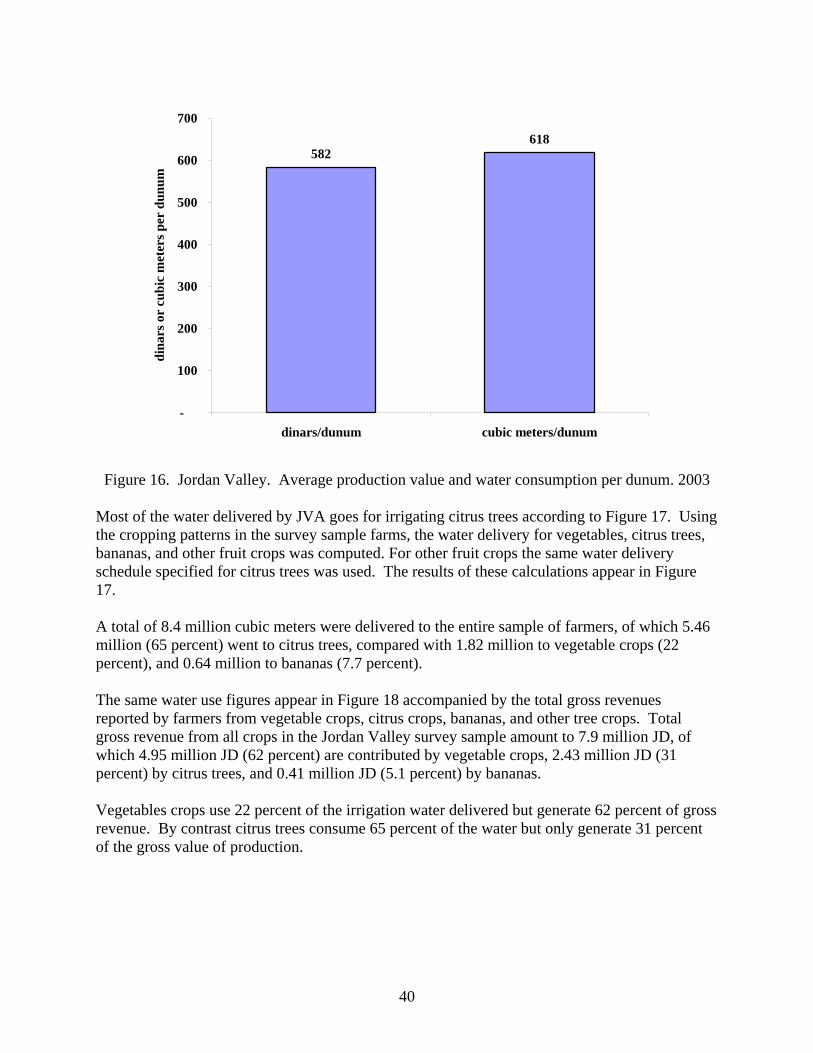
582618
-
100
200
300
400
500
600
700
dinars/dunum cubic meters/dunum
dina
rs o
r cu
bic
met
ers p
er d
unum
Figure 16. Jordan Valley. Average production value and water consumption per dunum. 2003
Most of the water delivered by JVA goes for irrigating citrus trees according to Figure 17. Using the cropping patterns in the survey sample farms, the water delivery for vegetables, citrus trees, bananas, and other fruit crops was computed. For other fruit crops the same water delivery schedule specified for citrus trees was used. The results of these calculations appear in Figure 17. A total of 8.4 million cubic meters were delivered to the entire sample of farmers, of which 5.46 million (65 percent) went to citrus trees, compared with 1.82 million to vegetable crops (22 percent), and 0.64 million to bananas (7.7 percent). The same water use figures appear in Figure 18 accompanied by the total gross revenues reported by farmers from vegetable crops, citrus crops, bananas, and other tree crops. Total gross revenue from all crops in the Jordan Valley survey sample amount to 7.9 million JD, of which 4.95 million JD (62 percent) are contributed by vegetable crops, 2.43 million JD (31 percent) by citrus trees, and 0.41 million JD (5.1 percent) by bananas. Vegetables crops use 22 percent of the irrigation water delivered but generate 62 percent of gross revenue. By contrast citrus trees consume 65 percent of the water but only generate 31 percent of the gross value of production.
40
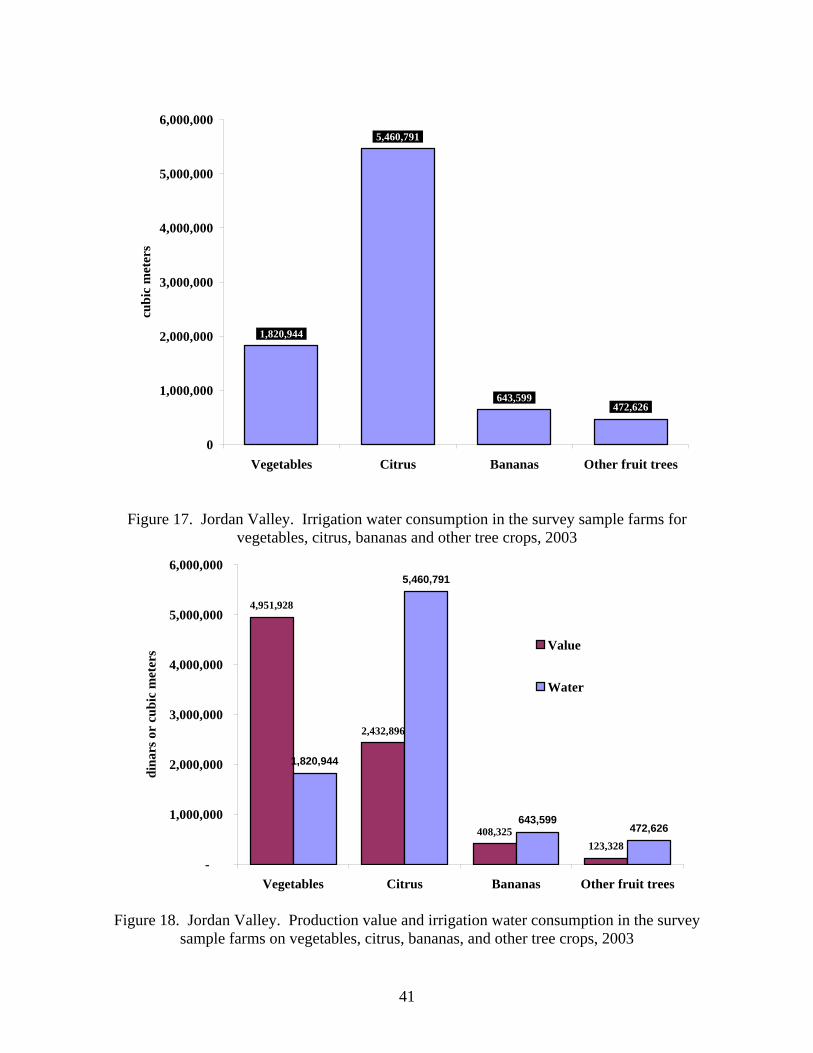
1,820,944
5,460,791
643,599472,626
0
1,000,000
2,000,000
3,000,000
4,000,000
5,000,000
6,000,000
Vegetables Citrus Bananas Other fruit trees
cubi
c m
eter
s
Figure 17. Jordan Valley. Irrigation water consumption in the survey sample farms for vegetables, citrus, bananas and other tree crops, 2003
4,951,928
2,432,896
408,325123,328
1,820,944
5,460,791
643,599472,626
-
1,000,000
2,000,000
3,000,000
4,000,000
5,000,000
6,000,000
Vegetables Citrus Bananas Other fruit trees
dina
rs o
r cu
bic
met
ers Value
Water
Figure 18. Jordan Valley. Production value and irrigation water consumption in the survey
sample farms on vegetables, citrus, bananas, and other tree crops, 2003
41
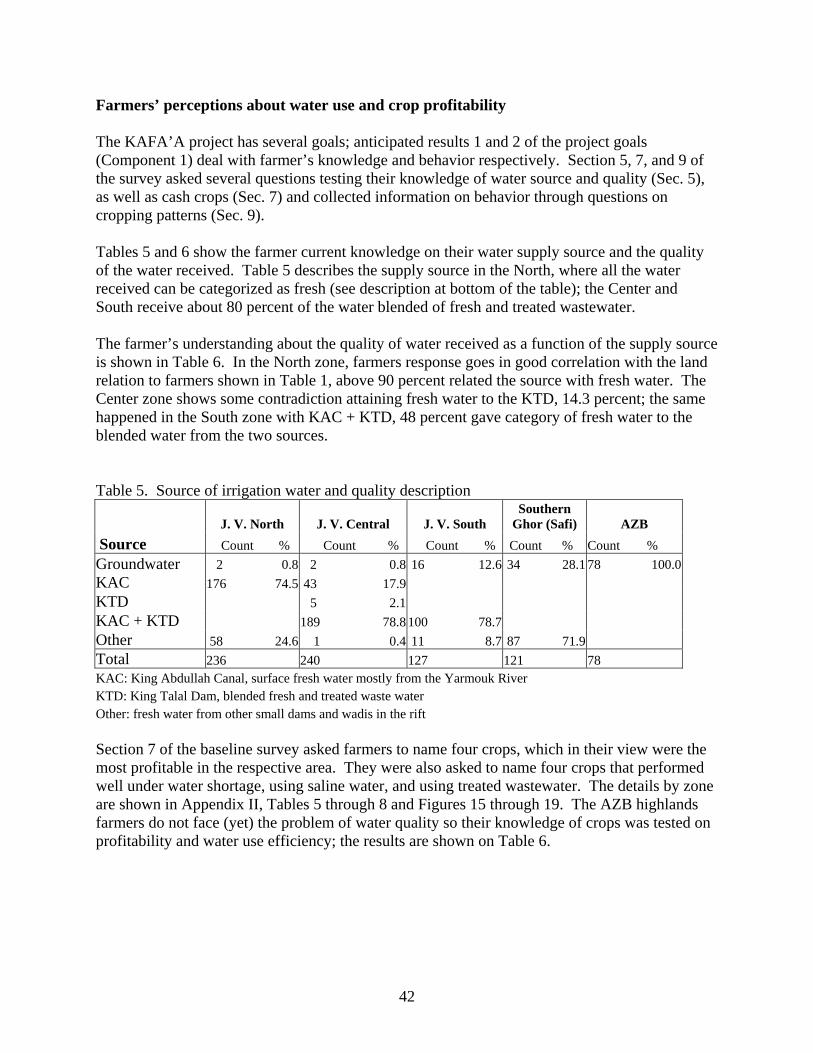
Farmers’ perceptions about water use and crop profitability The KAFA’A project has several goals; anticipated results 1 and 2 of the project goals (Component 1) deal with farmer’s knowledge and behavior respectively. Section 5, 7, and 9 of the survey asked several questions testing their knowledge of water source and quality (Sec. 5), as well as cash crops (Sec. 7) and collected information on behavior through questions on cropping patterns (Sec. 9). Tables 5 and 6 show the farmer current knowledge on their water supply source and the quality of the water received. Table 5 describes the supply source in the North, where all the water received can be categorized as fresh (see description at bottom of the table); the Center and South receive about 80 percent of the water blended of fresh and treated wastewater. The farmer’s understanding about the quality of water received as a function of the supply source is shown in Table 6. In the North zone, farmers response goes in good correlation with the land relation to farmers shown in Table 1, above 90 percent related the source with fresh water. The Center zone shows some contradiction attaining fresh water to the KTD, 14.3 percent; the same happened in the South zone with KAC + KTD, 48 percent gave category of fresh water to the blended water from the two sources. Table 5. Source of irrigation water and quality description
J. V. North J. V. Central J. V. South Southern
Ghor (Safi) AZB Source Count % Count % Count % Count % Count % Groundwater 2 0.8 2 0.8 16 12.6 34 28.1 78 100.0KAC 176 74.5 43 17.9 KTD 5 2.1 KAC + KTD 189 78.8 100 78.7 Other 58 24.6 1 0.4 11 8.7 87 71.9 Total 236 240 127 121 78 KAC: King Abdullah Canal, surface fresh water mostly from the Yarmouk River KTD: King Talal Dam, blended fresh and treated waste water Other: fresh water from other small dams and wadis in the rift Section 7 of the baseline survey asked farmers to name four crops, which in their view were the most profitable in the respective area. They were also asked to name four crops that performed well under water shortage, using saline water, and using treated wastewater. The details by zone are shown in Appendix II, Tables 5 through 8 and Figures 15 through 19. The AZB highlands farmers do not face (yet) the problem of water quality so their knowledge of crops was tested on profitability and water use efficiency; the results are shown on Table 6.
42
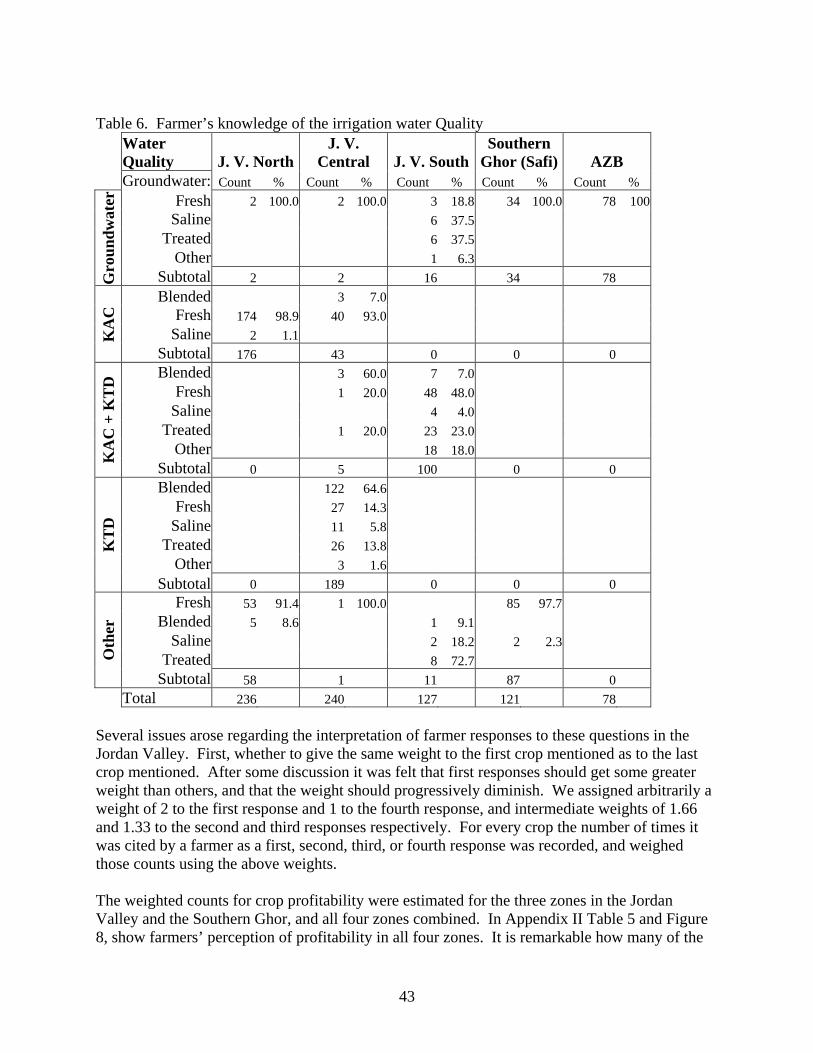
Table 6. Farmer’s knowledge of the irrigation water Quality
Water Quality J. V. North
J. V. Central J. V. South
Southern Ghor (Safi) AZB
Groundwater: Count % Count % Count % Count % Count % Fresh 2 100.0 2 100.0 3 18.8 34 100.0 78 100
Saline 6 37.5 Treated 6 37.5
Other 1 6.3
Gro
undw
ater
Subtotal 2 2 16 34 78 Blended 3 7.0
Fresh 174 98.9 40 93.0 Saline 2 1.1 K
AC
Subtotal 176 43 0 0 0 Blended 3 60.0 7 7.0
Fresh 1 20.0 48 48.0 Saline 4 4.0
Treated 1 20.0 23 23.0 Other 18 18.0 K
AC
+ K
TD
Subtotal 0 5 100 0 0 Blended 122 64.6
Fresh 27 14.3 Saline 11 5.8
Treated 26 13.8 Other 3 1.6
KT
D
Subtotal 0 189 0 0 0 Fresh 53 91.4 1 100.0 85 97.7
Blended 5 8.6 1 9.1 Saline 2 18.2 2 2.3
Treated 8 72.7 Oth
er
Subtotal 58 1 11 87 0 Total 236 240 127 121 78 Several issues arose regarding the interpretation of farmer responses to these questions in the Jordan Valley. First, whether to give the same weight to the first crop mentioned as to the last crop mentioned. After some discussion it was felt that first responses should get some greater weight than others, and that the weight should progressively diminish. We assigned arbitrarily a weight of 2 to the first response and 1 to the fourth response, and intermediate weights of 1.66 and 1.33 to the second and third responses respectively. For every crop the number of times it was cited by a farmer as a first, second, third, or fourth response was recorded, and weighed those counts using the above weights. The weighted counts for crop profitability were estimated for the three zones in the Jordan Valley and the Southern Ghor, and all four zones combined. In Appendix II Table 5 and Figure 8, show farmers’ perception of profitability in all four zones. It is remarkable how many of the
43
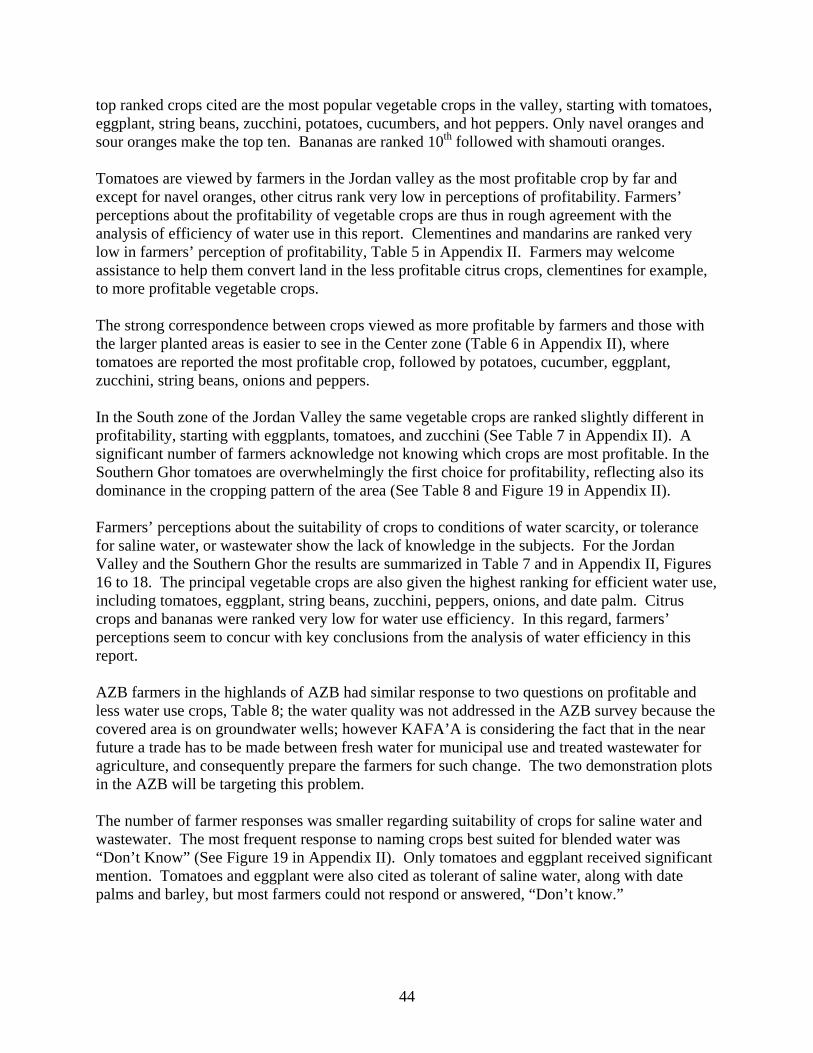
top ranked crops cited are the most popular vegetable crops in the valley, starting with tomatoes, eggplant, string beans, zucchini, potatoes, cucumbers, and hot peppers. Only navel oranges and sour oranges make the top ten. Bananas are ranked 10th followed with shamouti oranges. Tomatoes are viewed by farmers in the Jordan valley as the most profitable crop by far and except for navel oranges, other citrus rank very low in perceptions of profitability. Farmers’ perceptions about the profitability of vegetable crops are thus in rough agreement with the analysis of efficiency of water use in this report. Clementines and mandarins are ranked very low in farmers’ perception of profitability, Table 5 in Appendix II. Farmers may welcome assistance to help them convert land in the less profitable citrus crops, clementines for example, to more profitable vegetable crops. The strong correspondence between crops viewed as more profitable by farmers and those with the larger planted areas is easier to see in the Center zone (Table 6 in Appendix II), where tomatoes are reported the most profitable crop, followed by potatoes, cucumber, eggplant, zucchini, string beans, onions and peppers. In the South zone of the Jordan Valley the same vegetable crops are ranked slightly different in profitability, starting with eggplants, tomatoes, and zucchini (See Table 7 in Appendix II). A significant number of farmers acknowledge not knowing which crops are most profitable. In the Southern Ghor tomatoes are overwhelmingly the first choice for profitability, reflecting also its dominance in the cropping pattern of the area (See Table 8 and Figure 19 in Appendix II). Farmers’ perceptions about the suitability of crops to conditions of water scarcity, or tolerance for saline water, or wastewater show the lack of knowledge in the subjects. For the Jordan Valley and the Southern Ghor the results are summarized in Table 7 and in Appendix II, Figures 16 to 18. The principal vegetable crops are also given the highest ranking for efficient water use, including tomatoes, eggplant, string beans, zucchini, peppers, onions, and date palm. Citrus crops and bananas were ranked very low for water use efficiency. In this regard, farmers’ perceptions seem to concur with key conclusions from the analysis of water efficiency in this report. AZB farmers in the highlands of AZB had similar response to two questions on profitable and less water use crops, Table 8; the water quality was not addressed in the AZB survey because the covered area is on groundwater wells; however KAFA’A is considering the fact that in the near future a trade has to be made between fresh water for municipal use and treated wastewater for agriculture, and consequently prepare the farmers for such change. The two demonstration plots in the AZB will be targeting this problem. The number of farmer responses was smaller regarding suitability of crops for saline water and wastewater. The most frequent response to naming crops best suited for blended water was “Don’t Know” (See Figure 19 in Appendix II). Only tomatoes and eggplant received significant mention. Tomatoes and eggplant were also cited as tolerant of saline water, along with date palms and barley, but most farmers could not respond or answered, “Don’t know.”
44

The assessment team concludes therefore that farmers in the sample do not have a clear understanding or knowledge of which crops are more suitable to adverse water conditions of scarcity, salinity, and waste contamination. It would be a measure of success if at the end of the KAFA’A project farmers are able to respond to a similar inquiry in a more discriminating manner. The current figures will be a valuable reference in the future to assess the efficacy of programs to impart better knowledge among farmers of crop response to poor water conditions.
On-Farm Irrigation Water Management The adoption of water-efficient technologies and improved on-farm management practices are called for in anticipated result 3 of KAFA’A Component 1. Table 9 shows several questions asked to the farmers, which relate directly to on-farm water management; the use of sand media filters is higher in the Center and South zones in direct relationship to the low water quality. However when visiting farms in any of the areas, is common the sight of early life abandoned (broken or useless) sand media filters reflecting poor operation and maintenance. Most farmers do some cleaning of laterals and emitters, mostly on a weekly basis; however, regarding to cleaning emitters, the most used method is the “mechanical”, which consist of cleaning with any sharp pointed device (needle or nail) distorting all the hydraulic purpose of a low flow-localized emission source. Water flow measurement, currently JVA is addressing the serious problem of accounting for water deliveries to the farmers through another USAID funded project targeting the improvement of the delivery system in the valley. Records is a must in any program for improving performance in any activity; over 82 percent of the farmers surveyed reported not keeping records, a weighted average of 78 percent of farmers, who do not keep records (Table 9) justified not doing so because they “would not use” the data. Such attitude is hiding the lack of knowledge on the ‘know how” in irrigation management technologies. The AZB shows the highest percentage (40 %), which indicates a response to the need of control because of the higher water cost in the area. Needs for appropriate marketing techniques Since KAFA’A launching workshop in October 2003, and the series of meetings with farmers that followed that event, marketing has taken high priority as a request from the agricultural sector, main stakeholders, and the farmers. The baseline assessment survey tested the awareness of the farmers on international food quality standards as an essential step for export marketing improvement; the majority of the farmers in the five project sub areas have no knowledge of EurepGap, ISO, or HACCP and their standards requirements for agricultural products; from 72 to 96 percent of the farmers surveyed do not know about these organizations, Table 10.
45
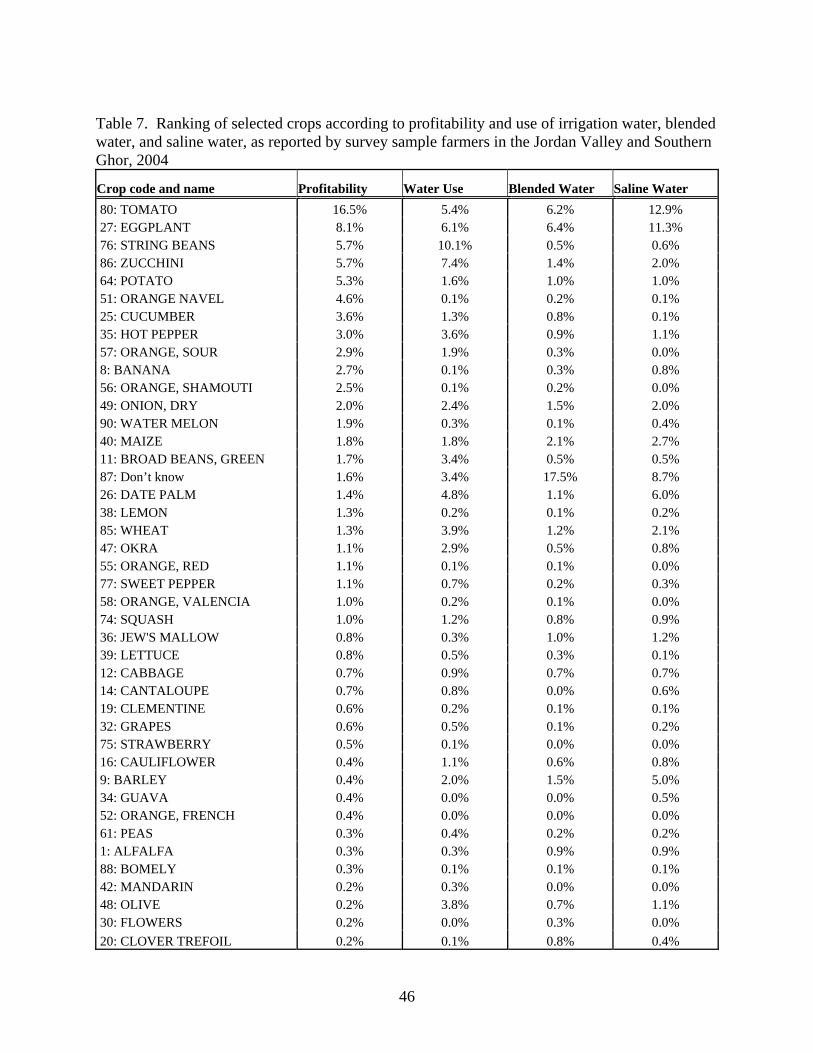
Table 7. Ranking of selected crops according to profitability and use of irrigation water, blended water, and saline water, as reported by survey sample farmers in the Jordan Valley and Southern Ghor, 2004
Crop code and name Profitability Water Use Blended Water Saline Water 80: TOMATO 16.5% 5.4% 6.2% 12.9% 27: EGGPLANT 8.1% 6.1% 6.4% 11.3% 76: STRING BEANS 5.7% 10.1% 0.5% 0.6% 86: ZUCCHINI 5.7% 7.4% 1.4% 2.0% 64: POTATO 5.3% 1.6% 1.0% 1.0% 51: ORANGE NAVEL 4.6% 0.1% 0.2% 0.1% 25: CUCUMBER 3.6% 1.3% 0.8% 0.1% 35: HOT PEPPER 3.0% 3.6% 0.9% 1.1% 57: ORANGE, SOUR 2.9% 1.9% 0.3% 0.0% 8: BANANA 2.7% 0.1% 0.3% 0.8% 56: ORANGE, SHAMOUTI 2.5% 0.1% 0.2% 0.0% 49: ONION, DRY 2.0% 2.4% 1.5% 2.0% 90: WATER MELON 1.9% 0.3% 0.1% 0.4% 40: MAIZE 1.8% 1.8% 2.1% 2.7% 11: BROAD BEANS, GREEN 1.7% 3.4% 0.5% 0.5% 87: Don’t know 1.6% 3.4% 17.5% 8.7% 26: DATE PALM 1.4% 4.8% 1.1% 6.0% 38: LEMON 1.3% 0.2% 0.1% 0.2% 85: WHEAT 1.3% 3.9% 1.2% 2.1% 47: OKRA 1.1% 2.9% 0.5% 0.8% 55: ORANGE, RED 1.1% 0.1% 0.1% 0.0% 77: SWEET PEPPER 1.1% 0.7% 0.2% 0.3% 58: ORANGE, VALENCIA 1.0% 0.2% 0.1% 0.0% 74: SQUASH 1.0% 1.2% 0.8% 0.9% 36: JEW'S MALLOW 0.8% 0.3% 1.0% 1.2% 39: LETTUCE 0.8% 0.5% 0.3% 0.1% 12: CABBAGE 0.7% 0.9% 0.7% 0.7% 14: CANTALOUPE 0.7% 0.8% 0.0% 0.6% 19: CLEMENTINE 0.6% 0.2% 0.1% 0.1% 32: GRAPES 0.6% 0.5% 0.1% 0.2% 75: STRAWBERRY 0.5% 0.1% 0.0% 0.0% 16: CAULIFLOWER 0.4% 1.1% 0.6% 0.8% 9: BARLEY 0.4% 2.0% 1.5% 5.0% 34: GUAVA 0.4% 0.0% 0.0% 0.5% 52: ORANGE, FRENCH 0.4% 0.0% 0.0% 0.0% 61: PEAS 0.3% 0.4% 0.2% 0.2% 1: ALFALFA 0.3% 0.3% 0.9% 0.9% 88: BOMELY 0.3% 0.1% 0.1% 0.1% 42: MANDARIN 0.2% 0.3% 0.0% 0.0% 48: OLIVE 0.2% 3.8% 0.7% 1.1% 30: FLOWERS 0.2% 0.0% 0.3% 0.0% 20: CLOVER TREFOIL 0.2% 0.1% 0.8% 0.4%
46
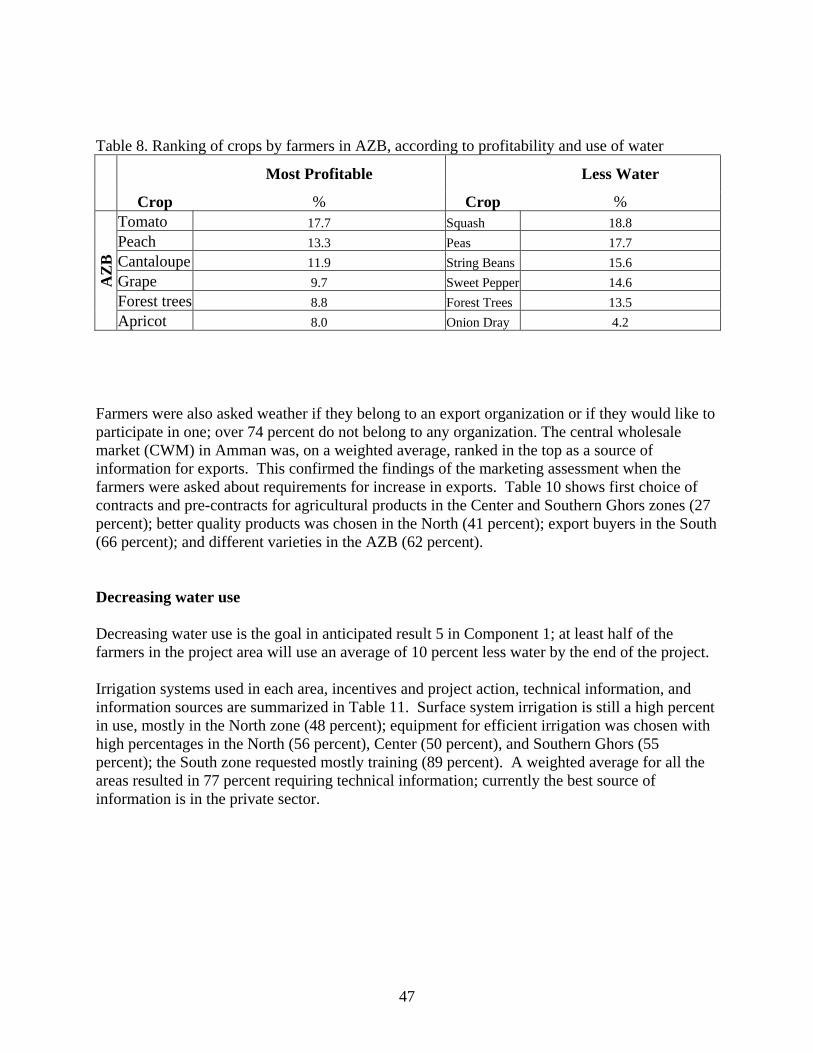
Table 8. Ranking of crops by farmers in AZB, according to profitability and use of water
Most Profitable Less Water
Crop % Crop % Tomato 17.7 Squash 18.8 Peach 13.3 Peas 17.7 Cantaloupe 11.9 String Beans 15.6 Grape 9.7 Sweet Pepper 14.6 Forest trees 8.8 Forest Trees 13.5
AZ
B
Apricot 8.0 Onion Dray 4.2 Farmers were also asked weather if they belong to an export organization or if they would like to participate in one; over 74 percent do not belong to any organization. The central wholesale market (CWM) in Amman was, on a weighted average, ranked in the top as a source of information for exports. This confirmed the findings of the marketing assessment when the farmers were asked about requirements for increase in exports. Table 10 shows first choice of contracts and pre-contracts for agricultural products in the Center and Southern Ghors zones (27 percent); better quality products was chosen in the North (41 percent); export buyers in the South (66 percent); and different varieties in the AZB (62 percent). Decreasing water use Decreasing water use is the goal in anticipated result 5 in Component 1; at least half of the farmers in the project area will use an average of 10 percent less water by the end of the project. Irrigation systems used in each area, incentives and project action, technical information, and information sources are summarized in Table 11. Surface system irrigation is still a high percent in use, mostly in the North zone (48 percent); equipment for efficient irrigation was chosen with high percentages in the North (56 percent), Center (50 percent), and Southern Ghors (55 percent); the South zone requested mostly training (89 percent). A weighted average for all the areas resulted in 77 percent requiring technical information; currently the best source of information is in the private sector.
47
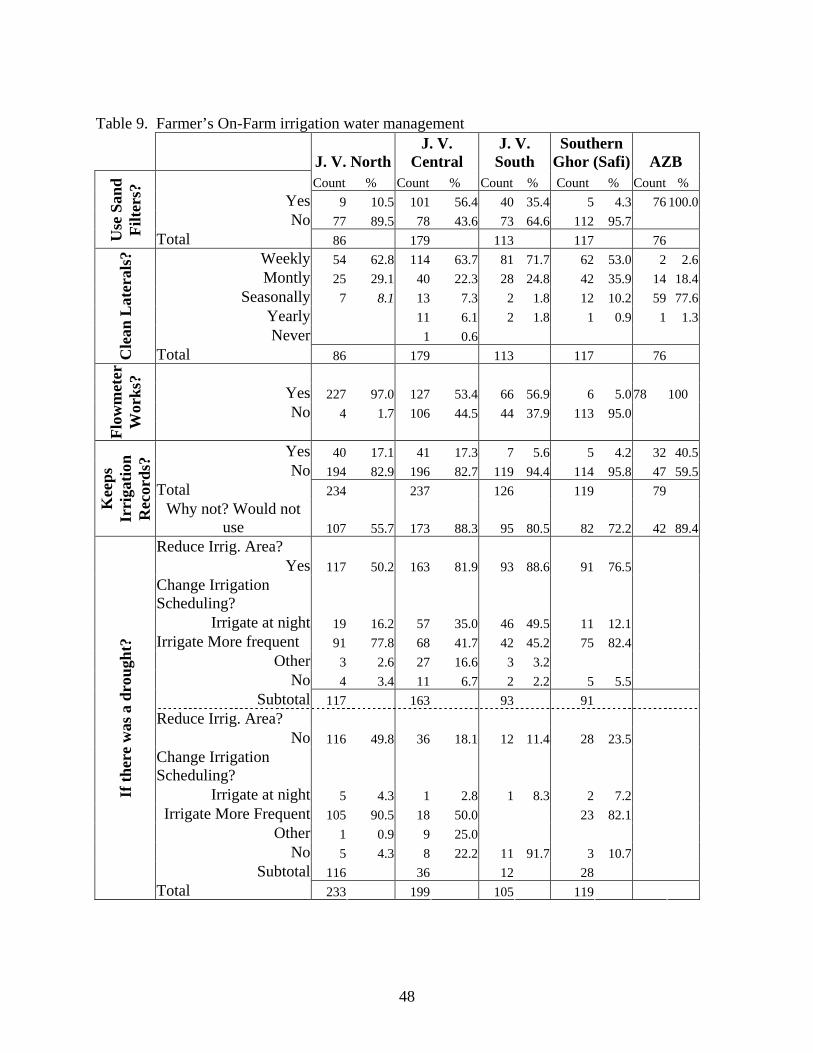
Table 9. Farmer’s On-Farm irrigation water management
J. V. NorthJ. V.
Central J. V.
South Southern
Ghor (Safi) AZB Count % Count % Count % Count % Count %
Yes 9 10.5 101 56.4 40 35.4 5 4.3 76 100.0No 77 89.5 78 43.6 73 64.6 112 95.7
Use
San
d Fi
lters
?
Total 86 179 113 117 76 Weekly 54 62.8 114 63.7 81 71.7 62 53.0 2 2.6Montly 25 29.1 40 22.3 28 24.8 42 35.9 14 18.4
Seasonally 7 8.1 13 7.3 2 1.8 12 10.2 59 77.6Yearly 11 6.1 2 1.8 1 0.9 1 1.3Never 1 0.6
Cle
an L
ater
als?
Total 86 179 113 117 76
Yes 227 97.0 127 53.4 66 56.9 6 5.0 78 100 No 4 1.7 106 44.5 44 37.9 113 95.0
Flow
met
er
Wor
ks?
Yes 40 17.1 41 17.3 7 5.6 5 4.2 32 40.5No 194 82.9 196 82.7 119 94.4 114 95.8 47 59.5
Total 234 237 126 119 79
Kee
ps
Irri
gatio
n R
ecor
ds?
Why not? Would not use 107 55.7 173 88.3 95 80.5 82 72.2 42 89.4
Reduce Irrig. Area? Yes 117 50.2 163 81.9 93 88.6 91 76.5
Change Irrigation Scheduling?
Irrigate at night 19 16.2 57 35.0 46 49.5 11 12.1 Irrigate More frequent 91 77.8 68 41.7 42 45.2 75 82.4
Other 3 2.6 27 16.6 3 3.2 No 4 3.4 11 6.7 2 2.2 5 5.5
Subtotal 117 163 93 91 Reduce Irrig. Area?
No 116 49.8 36 18.1 12 11.4 28 23.5 Change Irrigation Scheduling?
Irrigate at night 5 4.3 1 2.8 1 8.3 2 7.2 Irrigate More Frequent 105 90.5 18 50.0 23 82.1
Other 1 0.9 9 25.0 No 5 4.3 8 22.2 11 91.7 3 10.7
Subtotal 116 36 12 28
If th
ere
was
a d
roug
ht?
Total 233 199 105 119
48
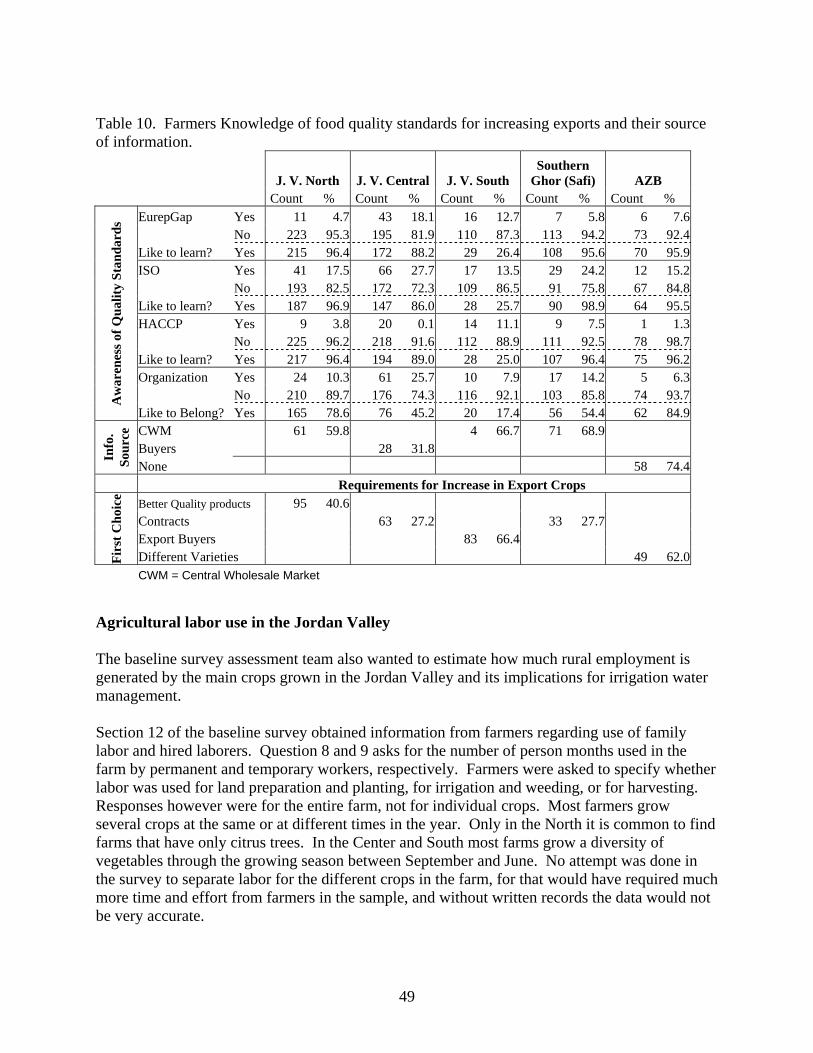
Table 10. Farmers Knowledge of food quality standards for increasing exports and their source of information.
J. V. North J. V. Central J. V. South Southern
Ghor (Safi) AZB Count % Count % Count % Count % Count %
EurepGap Yes 11 4.7 43 18.1 16 12.7 7 5.8 6 7.6 No 223 95.3 195 81.9 110 87.3 113 94.2 73 92.4Like to learn? Yes 215 96.4 172 88.2 29 26.4 108 95.6 70 95.9ISO Yes 41 17.5 66 27.7 17 13.5 29 24.2 12 15.2 No 193 82.5 172 72.3 109 86.5 91 75.8 67 84.8Like to learn? Yes 187 96.9 147 86.0 28 25.7 90 98.9 64 95.5HACCP Yes 9 3.8 20 0.1 14 11.1 9 7.5 1 1.3 No 225 96.2 218 91.6 112 88.9 111 92.5 78 98.7Like to learn? Yes 217 96.4 194 89.0 28 25.0 107 96.4 75 96.2Organization Yes 24 10.3 61 25.7 10 7.9 17 14.2 5 6.3 No 210 89.7 176 74.3 116 92.1 103 85.8 74 93.7A
war
enes
s of Q
ualit
y St
anda
rds
Like to Belong? Yes 165 78.6 76 45.2 20 17.4 56 54.4 62 84.9CWM 61 59.8 4 66.7 71 68.9 Buyers 28 31.8 In
fo.
Sour
ce
None 58 74.4 Requirements for Increase in Export Crops
Better Quality products 95 40.6 Contracts 63 27.2 33 27.7 Export Buyers 83 66.4
Firs
t Cho
ice
Different Varieties 49 62.0
CWM = Central Wholesale Market
Agricultural labor use in the Jordan Valley The baseline survey assessment team also wanted to estimate how much rural employment is generated by the main crops grown in the Jordan Valley and its implications for irrigation water management. Section 12 of the baseline survey obtained information from farmers regarding use of family labor and hired laborers. Question 8 and 9 asks for the number of person months used in the farm by permanent and temporary workers, respectively. Farmers were asked to specify whether labor was used for land preparation and planting, for irrigation and weeding, or for harvesting. Responses however were for the entire farm, not for individual crops. Most farmers grow several crops at the same or at different times in the year. Only in the North it is common to find farms that have only citrus trees. In the Center and South most farms grow a diversity of vegetables through the growing season between September and June. No attempt was done in the survey to separate labor for the different crops in the farm, for that would have required much more time and effort from farmers in the sample, and without written records the data would not be very accurate.
49
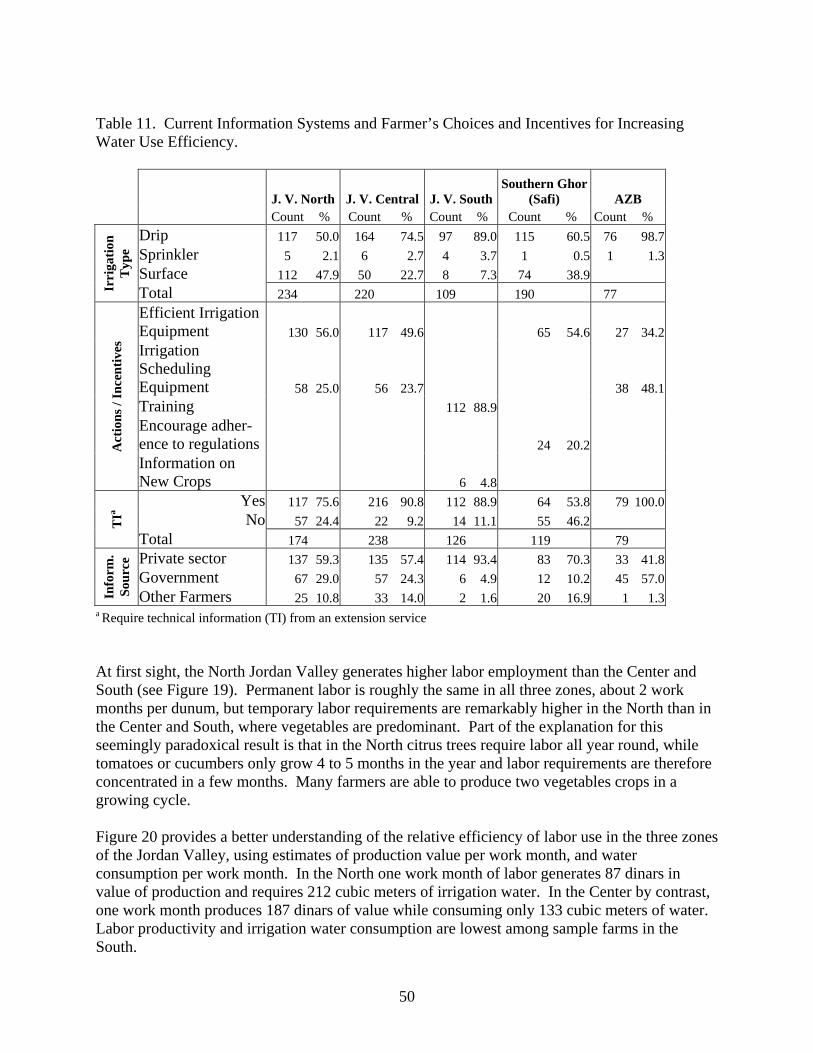
Table 11. Current Information Systems and Farmer’s Choices and Incentives for Increasing Water Use Efficiency.
J. V. North J. V. Central J. V. SouthSouthern Ghor
(Safi) AZB Count % Count % Count % Count % Count %
Drip 117 50.0 164 74.5 97 89.0 115 60.5 76 98.7Sprinkler 5 2.1 6 2.7 4 3.7 1 0.5 1 1.3Surface 112 47.9 50 22.7 8 7.3 74 38.9
Irri
gatio
n T
ype
Total 234 220 109 190 77 Efficient Irrigation Equipment 130 56.0 117 49.6 65 54.6 27 34.2Irrigation Scheduling Equipment 58 25.0 56 23.7 38 48.1Training 112 88.9 Encourage adher- ence to regulations 24 20.2 A
ctio
ns /
Ince
ntiv
es
Information on New Crops 6 4.8
Yes 117 75.6 216 90.8 112 88.9 64 53.8 79 100.0No 57 24.4 22 9.2 14 11.1 55 46.2 T
Ia
Total 174 238 126 119 79 Private sector 137 59.3 135 57.4 114 93.4 83 70.3 33 41.8Government 67 29.0 57 24.3 6 4.9 12 10.2 45 57.0
Info
rm.
Sour
ce
Other Farmers 25 10.8 33 14.0 2 1.6 20 16.9 1 1.3a Require technical information (TI) from an extension service At first sight, the North Jordan Valley generates higher labor employment than the Center and South (see Figure 19). Permanent labor is roughly the same in all three zones, about 2 work months per dunum, but temporary labor requirements are remarkably higher in the North than in the Center and South, where vegetables are predominant. Part of the explanation for this seemingly paradoxical result is that in the North citrus trees require labor all year round, while tomatoes or cucumbers only grow 4 to 5 months in the year and labor requirements are therefore concentrated in a few months. Many farmers are able to produce two vegetables crops in a growing cycle. Figure 20 provides a better understanding of the relative efficiency of labor use in the three zones of the Jordan Valley, using estimates of production value per work month, and water consumption per work month. In the North one work month of labor generates 87 dinars in value of production and requires 212 cubic meters of irrigation water. In the Center by contrast, one work month produces 187 dinars of value while consuming only 133 cubic meters of water. Labor productivity and irrigation water consumption are lowest among sample farms in the South.
50
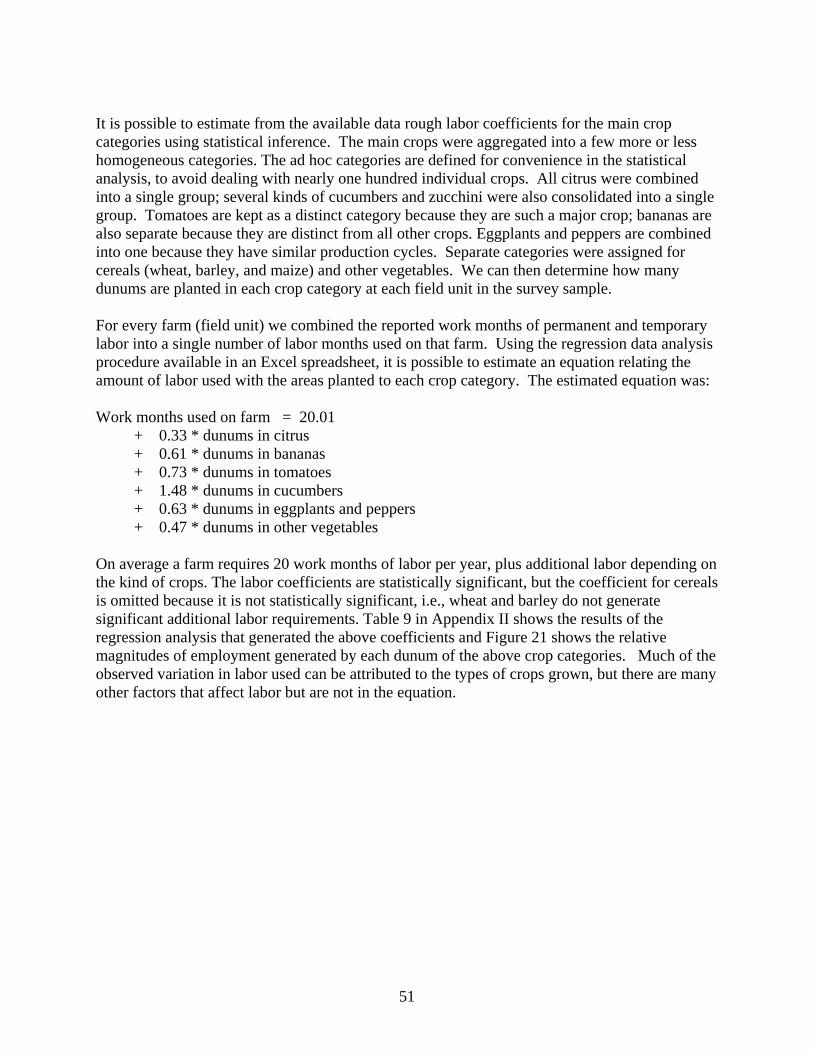
It is possible to estimate from the available data rough labor coefficients for the main crop categories using statistical inference. The main crops were aggregated into a few more or less homogeneous categories. The ad hoc categories are defined for convenience in the statistical analysis, to avoid dealing with nearly one hundred individual crops. All citrus were combined into a single group; several kinds of cucumbers and zucchini were also consolidated into a single group. Tomatoes are kept as a distinct category because they are such a major crop; bananas are also separate because they are distinct from all other crops. Eggplants and peppers are combined into one because they have similar production cycles. Separate categories were assigned for cereals (wheat, barley, and maize) and other vegetables. We can then determine how many dunums are planted in each crop category at each field unit in the survey sample. For every farm (field unit) we combined the reported work months of permanent and temporary labor into a single number of labor months used on that farm. Using the regression data analysis procedure available in an Excel spreadsheet, it is possible to estimate an equation relating the amount of labor used with the areas planted to each crop category. The estimated equation was: Work months used on farm = 20.01 + 0.33 * dunums in citrus + 0.61 * dunums in bananas + 0.73 * dunums in tomatoes + 1.48 * dunums in cucumbers + 0.63 * dunums in eggplants and peppers + 0.47 * dunums in other vegetables On average a farm requires 20 work months of labor per year, plus additional labor depending on the kind of crops. The labor coefficients are statistically significant, but the coefficient for cereals is omitted because it is not statistically significant, i.e., wheat and barley do not generate significant additional labor requirements. Table 9 in Appendix II shows the results of the regression analysis that generated the above coefficients and Figure 21 shows the relative magnitudes of employment generated by each dunum of the above crop categories. Much of the observed variation in labor used can be attributed to the types of crops grown, but there are many other factors that affect labor but are not in the equation.
51
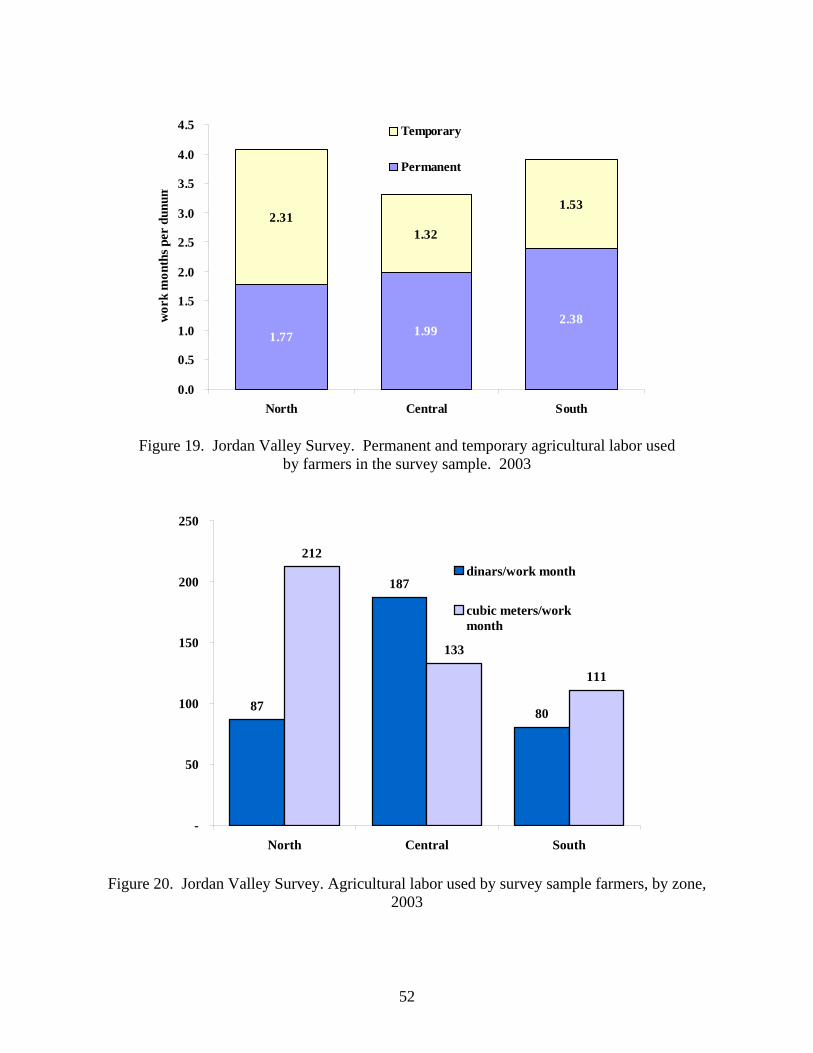
1.77 1.992.38
2.311.32
1.53
0.0
0.5
1.0
1.5
2.0
2.5
3.0
3.5
4.0
4.5
North Central South
wor
k m
onth
s per
dun
um
Temporary
Permanent
Figure 19. Jordan Valley Survey. Permanent and temporary agricultural labor used
by farmers in the survey sample. 2003
187
80
212
133
111
87
-
50
100
150
200
250
North Central South
dinars/work month
cubic meters/workmonth
Figure 20. Jordan Valley Survey. Agricultural labor used by survey sample farmers, by zone,
2003
52
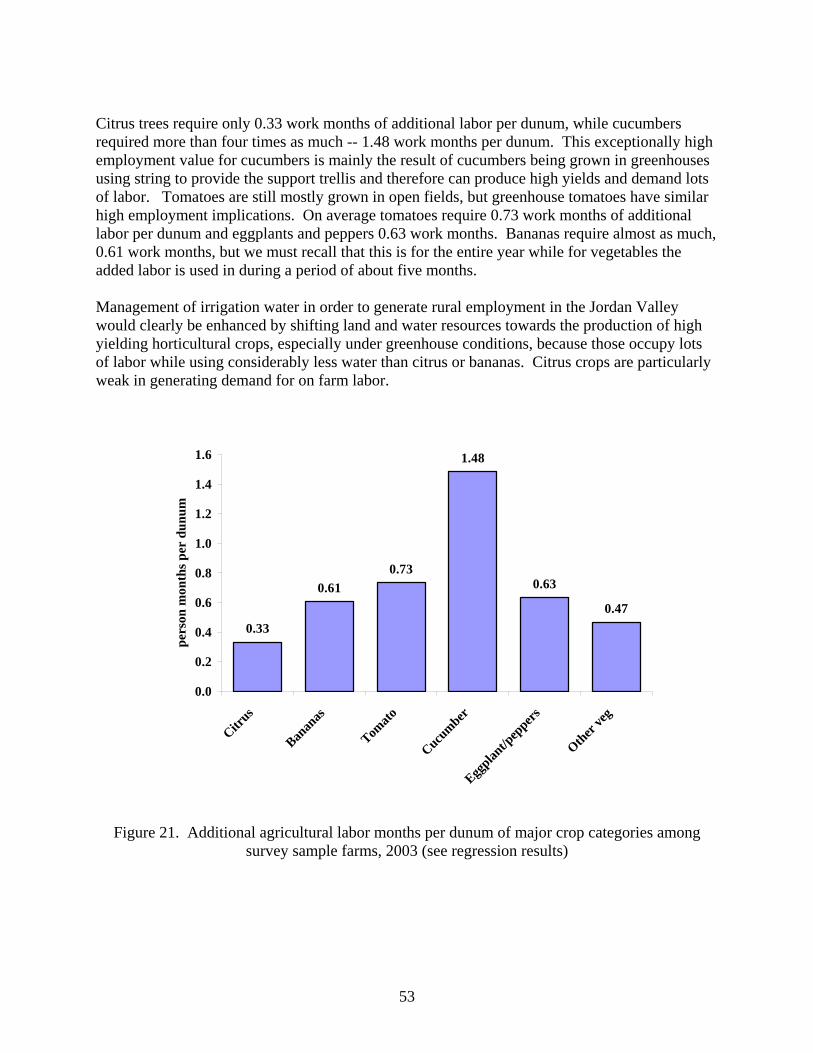
Citrus trees require only 0.33 work months of additional labor per dunum, while cucumbers required more than four times as much -- 1.48 work months per dunum. This exceptionally high employment value for cucumbers is mainly the result of cucumbers being grown in greenhouses using string to provide the support trellis and therefore can produce high yields and demand lots of labor. Tomatoes are still mostly grown in open fields, but greenhouse tomatoes have similar high employment implications. On average tomatoes require 0.73 work months of additional labor per dunum and eggplants and peppers 0.63 work months. Bananas require almost as much, 0.61 work months, but we must recall that this is for the entire year while for vegetables the added labor is used in during a period of about five months. Management of irrigation water in order to generate rural employment in the Jordan Valley would clearly be enhanced by shifting land and water resources towards the production of high yielding horticultural crops, especially under greenhouse conditions, because those occupy lots of labor while using considerably less water than citrus or bananas. Citrus crops are particularly weak in generating demand for on farm labor.
0.33
0.610.73
1.48
0.63
0.47
0.0
0.2
0.4
0.6
0.8
1.0
1.2
1.4
1.6
Citrus
Banan
as
Tomato
Cucumber
Eggplan
t/pep
pers
Other ve
g
pers
on m
onth
s per
dun
um
Figure 21. Additional agricultural labor months per dunum of major crop categories among survey sample farms, 2003 (see regression results)
53
Improving Farm Water Management in the Project Areas The objective of the KAFAA project is to enhance farmers’ knowledge, attitudes, and practices regarding the use of water in agriculture in Jordan, particularly in the Jordan Valley where farm production is nearly totally dependent on scarce irrigation water. Farmers in the Jordan Valley have many options to reduce water consumption and to enhance productivity per unit of irrigation water. We distinguish three kinds of farm management initiatives that can affect farm water consumption:
1. Water-saving technologies: Examples are using watermarks and tensiometers for irrigation scheduling; or using flow-meters to measure volume of water applied to a given field. Management within current technologies, such as choosing crops that generate greater value per unit of water, or adjusting planting times to coincide with less water demanding months.
2. Other yield and revenue-enhancing measures: For example, using bumblebees to increase pollination and raise yields in tomatoes and strawberries. Even though these measures do not save water directly, they raise income per unit of water used.
In many respects the current irrigation system in the Jordan Valley is highly advanced and technologically sophisticated. The water distribution network in the Jordan Valley is predominantly through underground pipelines with individual outlets to each farm (field unit); each farm has its own FTA (farm turn-out assembly) control box that regulates and measures the amount of water supplied to each farm; the system is designed to operate under pressure so as to enable farmers to install drip irrigation to deliver water to localized areas closed to the plants; most irrigation is done through drip irrigation or micro-sprayers. The Jordan Valley Authority (JVA) controls the entire delivery system up to the FTA, through a computerized network and water deliveries are calibrated and follow strict schedules. Nevertheless, there are many shortcomings in the current system of water distribution and use in agriculture in the Jordan Valley that are fairly well known and understood. The principal and universal complaint that farmers express is low pressure in water delivered to farms. Farmers claim that the amount of water received from JVA is far below what is expected and at such low pressure that their drip irrigation systems cannot perform well. Farmers are obliged to build storage reservoirs to hold water when delivered by JVA and then use their own pumps to operate their drip irrigation systems properly. In the absence of a reliable water supply farmers use all the water that is made available whenever it is available by JVA. To be on the safe side, farmers tend to over-irrigate, that is, to use more water than needed by the plants, just in case the next water delivery is delayed. A “ditch rider” system was originally envisioned whereby roving JVA officers in motorcycles opened and closed FTA valves along a main water line according to a strict calendar and schedule to match the water requirements for every farm. The ditch rider system has completely broken down, partly for lack of transport but mainly because it is nearly impossible for JVA to keep track of each single farm’s water needs. Farmers themselves need to be responsible for opening and closing valves, but the current water delivery system largely neglects and distrusts
54
farmers. JVA has basically given up on controlling individual farm water intakes, and uses instead broad water delivery schedules of so many hours per week for groups of farms. Farmers often times leave their water intake valves open to ensure that whenever JVA operates the pumps they receive water to store in their farm reservoirs. Most farm reservoirs are lined with heavy-duty plastic sheets but are not sealed, and therefore contribute to significant leakages of water. JVA on the other hand, attributes the low pressure to farmers keeping their valves open out of the rotation schedule. Very few farmers bother to close the valves leading to their farms after receiving the amount of water needed. While JVA views this “stealing water” as the key reason for low pressure, the practice is so widespread that there is no social stigma or sanction attached to it since farmers are effectively stealing water from each other. Another major shortcoming of the system is the failure to use the water meters already installed at the outlet to every farm to measure and control water delivery. The meters are enclosed in a locked steel box (the FTA) that only the JVA “ditch rider” can open. Farmers in the KAFAA baseline survey report that most of those meters are in working order in the North Jordan Valley, but neither farmers nor the JVA are recording the readings in the water meters to monitor water delivery and use. There are many conflicting claims about what is wrong with the water flow meters. Some farmers claim that readings are inflated because JVA uses cheaper gas meters that record air as well as water and that JVA pump station water intakes are poorly designed and draw a lot of air with the water (this was partly confirmed by JVA). JVA claims that farmers regularly sabotage the meters by inserting stones and wires to jam the moving parts of the meter to avoid paying for water. Farmers counter claim that the stones and foreign matter come with the water provided by JVA. There is no easy way to verify these complaints and counter complaints, but the end result is that water meters installed at each farm are not being used by farmers or JVA. Despite the lack of individual meter readings, JVA continues to invoice farmers for water delivered, but the amount is calculated based on JVA’s estimates of hours of pumping to a main pipeline and average volume of water based on the diameter of the orifice in the regulator at every farm. The amount invoiced is therefore roughly the same for every farmer, and reportedly ranges between 180 and 250 JD per year, for volumes roughly between 20,000 and 25,000 cubic meters for an average field unit of 30 dunums. The average costs of roughly 1 piaster per cubic meter is considered very low, not even sufficient to cover the operation and maintenance of the system, and certainly too low to induce farmers to save water. Why farmers bother to damage water meters to save a few piasters in water charges is not obvious. On the other hand, once farmers perceive that their water charge is the same regardless of the actual volume of water delivered or used, they lose all incentives to make an effort to save irrigation water. Farmers report paying JVA about 200 JD per year plus or minus adjustments of a few dinars for water delivered to a typical farm unit, average 35 dunums. Farmers do not have a clear understanding of what items are incorporated in their JVA bills, how much is for operation and maintenance costs, for administrative fees, and for volume of water used. JVA water bills are treated as a fixed annual cost rather than as a variable cost dependent on water actually consumed, and despite the payment being so low farmers complain that they are not getting their money’s worth in services. The total revenue collected by JVA is on the order of 1.5 million JD
55
(7,500 farm units paying 200 JD each). This is not enough to cover the operating budget for JVA. Farmers are practically getting irrigation water at nearly zero cost; what farmers pay right now barely contributes to operation, maintenance and administrative costs of the system. There exist already a repertoire of water saving techniques and strategies that farmers in the Jordan Valley could adopt. Efforts are being made by JVA and several donor supported projects to promote alternative strategies to induce farmers to make better use of irrigation water. A regional French project to improve irrigation water management focuses on promoting the use of watermarks and tensiometers to improve irrigation scheduling. Their experience and JVA’s indicate that farmers could save 30 to 40 percent of current water consumption without reduction in yields. The GTZ is promoting farmers’ participation in decision making through the creation of water users associations empowered to manage their own small networks. Independent companies and contractors have been successful in persuading farmers to grow crops under plastic tunnels and greenhouses and to use integrated pest management methods as a way of raising crop yields, product quality and product value. This is also a way of raising productivity per unit of water used. These major investments and changes in crop production technology clearly show that farmers respond quickly when they perceive that such changes result in higher incomes and profits. The KAFAA project relies on voluntary decisions within the farmers’ control concerning production and marketing of farm products. It is therefore essential to understand what can motivate farmers to change their current practices voluntarily. Administrative controls and measures imposed by external authorities are weakly effective in improving on-farm water use efficiency and therefore are not contemplated, except insofar as they provide a framework of reference for decisions made by farmers. GTZ’s experience indicates that collective decision making through water users associations is possible and effective as long as provisions are made for fair enforcing mechanisms. We adopt the working hypothesis that farmers are ready and willing to adopt water saving strategies when they operate within a proper structure of economic incentives and other motives of social responsibility. During the preparation of this baseline assessment the team put forward a proposal to do a water valuation pilot trial in collaboration with one GTZ new water users association near the center of the valley. Farmers in the group would be assigned given irrigation water allowances and encouraged to save water by compensating farmers at the rate of 50 JD for each thousand cubic meters saved from their allowance. This is 50 times the current rate paid by farmers for water, but reflects the opportunity cost of fresh water for other uses. Farmers who would like to use more water than their allowance can buy it at the same rate (50 JD per 1000 m3). All member farms in the GTZ group are already provided with working flow meters to monitor water consumption. The proposal was actively discussed and considered but in the end it was deemed outside the scope of the KAFA’A project.
56
A Numerical Illustration A numerical example might illustrate KAFA’A’s project predicament. Ahmed, a citrus farmer in the North Jordan Valley requires about 1000 cubic meters (m3) of irrigation water per dunum per year. Farmers at present pay about 10 fils (0.010 JD) per cubic meter. Ahmed’s water cost is therefore about 10 JD per dunum per year (about $14). Gross revenue from oranges is about 450 JD per dunum (about $640). KAFA’A can demonstrate to Ahmed that he can save 30 percent of current water consumption by installing a system of tensiometers (or resistance blocks) and water flow meters to help him schedule irrigation. The investment in these instruments comes to about 50 JD per dunum, and will require daily or regular monitoring of all these instruments. If farmer Ahmed were to do this, he would save 330 m3 of water per dunum and as a result will reduce his water bill by 3.300 JD (about $4.70) per dunum per year. Will farmer Ahmed invest 50 JD and go through the trouble of recording and monitoring the tensiometers and flowmeters in order to save 3.30 JD per year? Probably not. The key point here is to recognize that current prices for irrigation water are too low to make it worthwhile for a typical citrus farmer in the Jordan Valley to adopt the leading technical improvement that KAFA’A and other donors are promoting – resistance blocks and tensiometers for better irrigation scheduling. Would vegetable farmers be more amenable to install tensiometers? Vegetable farmer Lamia earns about 700 JD per dunum of vegetables, and requires 225 m3 per dunum per year. (In some years when she is able to grow two vegetables crops in the same piece of land she needs twice as much water, 450 m3). If farmer Lamia were to spend 50 JD to install tensiometers to improve irrigation scheduling, she would be able to save 30 percent of current consumption, or 75 m3 per dunum. At current prices for irrigation water that is worth 0.75 JD per dunum. Would farmer Lamia spend 50 JD to save 0.75 JD per dunum per year? The obvious answer is “no”. Conclusion: at current prices, should be reconsidered and use as an incentive to save water along with promoting tensiometers, resistance blocks, and flow meters. Revenue enhancing measures such as using bumblebees to increase pollination and yields, growing vegetables under green houses, and using better packaging for strawberries … do not change the equation. Even if farmer Lamia were to double revenue per dunum, the investment question remains the same: Will she spend 50 JD to save 0.75 per dunum per year? It is not a question whether she can afford it or not; even if she can afford it, the investment must pay to be justified. Many dunums of land remain idle in the South Jordan Valley for lack of irrigation water. Farmer Lamia herself faces that problem in her farm: she has dunums that could be cultivated with vegetables and generate revenues of 700 JD per dunum, but she has no assurances from JVA that she can have the 225 m3 of water required. Would farmer Lamia be willing to pay, say 100 JD
57
for those 225 m3 of water needed to grow 700 JD worth of production? Probably yes. Farmer Lamia is willing to pay 0.45 JD per cubic meter of water (as much as families in Amman for household consumption). We have then a paradoxical situation that citrus farmer Ahmed in the North Jordan Valley continues to waste 330 m3 of water per dunum because he has no incentive to save that water. Meanwhile, farmer Lamia has land in her farm being wasted because she cannot have access to 225 m3, even though she is willing to pay 100 JD for that water. The basic irrigation problem in the Jordan Valley is that farmers have no incentive to save water so as to release it to other farmers willing to pay for that water. The obvious solution is for the Jordan Valley Authority (JVA), the organization that delivers irrigation water to both farmer Ahmed and farmer Lamia, to buy water from farmer Ahmed and sell it to farmer Lamia, and pay Ahmed with the 100 JD that Lamia is willing to pay. If that could be arranged, would farmer Ahmed be willing to spend 50 JD in tensiometers to save 330 m3 of water, for which he could get the 100 JD per year that Lamia is willing to pay? Of course. All that is needed is for JVA to agree to buy from farmer Ahmed irrigation water that he saves, and sell it to farmer Lamia at the price she is willing to pay. The KAFA’A project could and should attempt to persuade JVA that it is a good and practical idea for JVA to become a buyer and seller of water to the same farmers that it is serving already. However, it will take longer that the expected life span of the KAFA’A project to persuade JVA of the merits of this arrangement. Alternatively, there is nothing to stop some other organization, say GTZ or a private broker, to do the same in a smaller scale, in an area where farmer Ahmed and farmer Lamia are farming nearby. That way GTZ or a private broker could reward farmer Ahmed for the 330 m3 of water that he saves in his citrus, using the money that farmer Lamia is willing to pay for the 225 m3 per dunum she needs for her vegetables. Hence the need for a market for farmers to trade rights to water allotments.
58
Appendix I KAFA’A
Project Database and Reporting system

Appendix II Tables and Figures
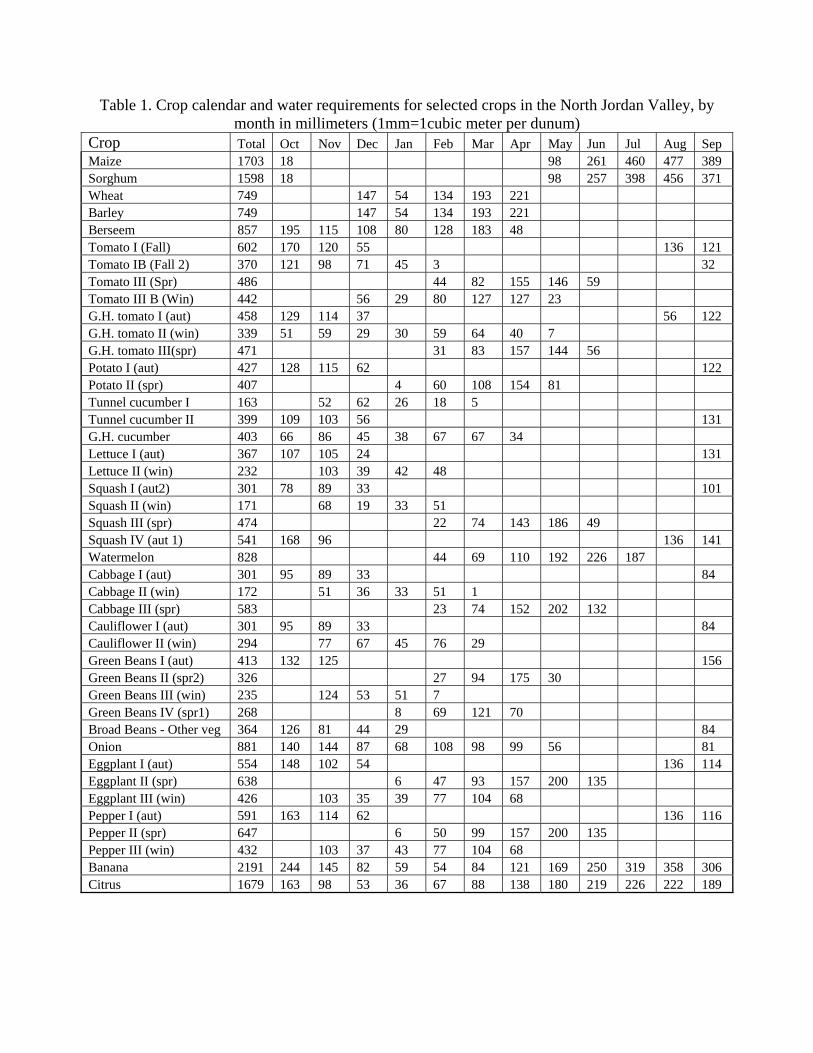
Table 1. Crop calendar and water requirements for selected crops in the North Jordan Valley, by month in millimeters (1mm=1cubic meter per dunum)
Crop Total Oct Nov Dec Jan Feb Mar Apr May Jun Jul Aug Sep Maize 1703 18 98 261 460 477 389 Sorghum 1598 18 98 257 398 456 371 Wheat 749 147 54 134 193 221 Barley 749 147 54 134 193 221 Berseem 857 195 115 108 80 128 183 48 Tomato I (Fall) 602 170 120 55 136 121 Tomato IB (Fall 2) 370 121 98 71 45 3 32 Tomato III (Spr) 486 44 82 155 146 59 Tomato III B (Win) 442 56 29 80 127 127 23 G.H. tomato I (aut) 458 129 114 37 56 122 G.H. tomato II (win) 339 51 59 29 30 59 64 40 7 G.H. tomato III(spr) 471 31 83 157 144 56 Potato I (aut) 427 128 115 62 122 Potato II (spr) 407 4 60 108 154 81 Tunnel cucumber I 163 52 62 26 18 5 Tunnel cucumber II 399 109 103 56 131 G.H. cucumber 403 66 86 45 38 67 67 34 Lettuce I (aut) 367 107 105 24 131 Lettuce II (win) 232 103 39 42 48 Squash I (aut2) 301 78 89 33 101 Squash II (win) 171 68 19 33 51 Squash III (spr) 474 22 74 143 186 49 Squash IV (aut 1) 541 168 96 136 141 Watermelon 828 44 69 110 192 226 187 Cabbage I (aut) 301 95 89 33 84 Cabbage II (win) 172 51 36 33 51 1 Cabbage III (spr) 583 23 74 152 202 132 Cauliflower I (aut) 301 95 89 33 84 Cauliflower II (win) 294 77 67 45 76 29 Green Beans I (aut) 413 132 125 156 Green Beans II (spr2) 326 27 94 175 30 Green Beans III (win) 235 124 53 51 7 Green Beans IV (spr1) 268 8 69 121 70 Broad Beans - Other veg 364 126 81 44 29 84 Onion 881 140 144 87 68 108 98 99 56 81 Eggplant I (aut) 554 148 102 54 136 114 Eggplant II (spr) 638 6 47 93 157 200 135 Eggplant III (win) 426 103 35 39 77 104 68 Pepper I (aut) 591 163 114 62 136 116 Pepper II (spr) 647 6 50 99 157 200 135 Pepper III (win) 432 103 37 43 77 104 68 Banana 2191 244 145 82 59 54 84 121 169 250 319 358 306 Citrus 1679 163 98 53 36 67 88 138 180 219 226 222 189
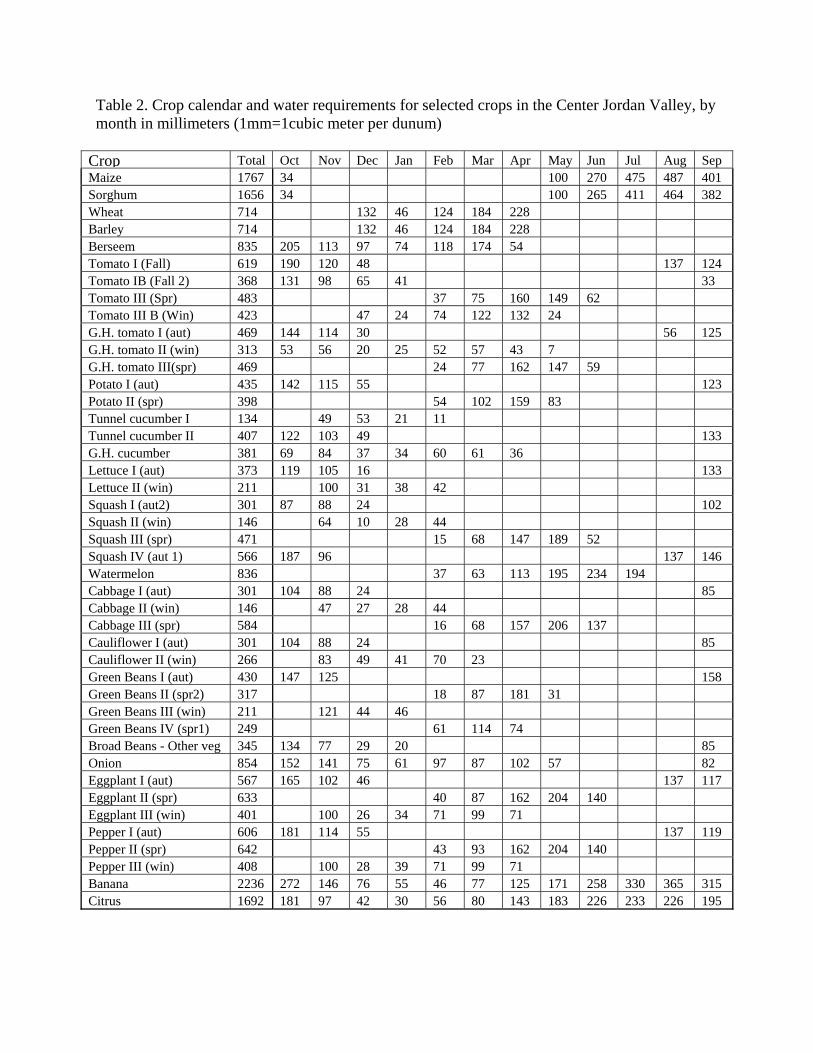
Table 2. Crop calendar and water requirements for selected crops in the Center Jordan Valley, by month in millimeters (1mm=1cubic meter per dunum)
Crop Total Oct Nov Dec Jan Feb Mar Apr May Jun Jul Aug Sep Maize 1767 34 100 270 475 487 401 Sorghum 1656 34 100 265 411 464 382 Wheat 714 132 46 124 184 228 Barley 714 132 46 124 184 228 Berseem 835 205 113 97 74 118 174 54 Tomato I (Fall) 619 190 120 48 137 124 Tomato IB (Fall 2) 368 131 98 65 41 33 Tomato III (Spr) 483 37 75 160 149 62 Tomato III B (Win) 423 47 24 74 122 132 24 G.H. tomato I (aut) 469 144 114 30 56 125 G.H. tomato II (win) 313 53 56 20 25 52 57 43 7 G.H. tomato III(spr) 469 24 77 162 147 59 Potato I (aut) 435 142 115 55 123 Potato II (spr) 398 54 102 159 83 Tunnel cucumber I 134 49 53 21 11 Tunnel cucumber II 407 122 103 49 133 G.H. cucumber 381 69 84 37 34 60 61 36 Lettuce I (aut) 373 119 105 16 133 Lettuce II (win) 211 100 31 38 42 Squash I (aut2) 301 87 88 24 102 Squash II (win) 146 64 10 28 44 Squash III (spr) 471 15 68 147 189 52 Squash IV (aut 1) 566 187 96 137 146 Watermelon 836 37 63 113 195 234 194 Cabbage I (aut) 301 104 88 24 85 Cabbage II (win) 146 47 27 28 44 Cabbage III (spr) 584 16 68 157 206 137 Cauliflower I (aut) 301 104 88 24 85 Cauliflower II (win) 266 83 49 41 70 23 Green Beans I (aut) 430 147 125 158 Green Beans II (spr2) 317 18 87 181 31 Green Beans III (win) 211 121 44 46 Green Beans IV (spr1) 249 61 114 74 Broad Beans - Other veg 345 134 77 29 20 85 Onion 854 152 141 75 61 97 87 102 57 82 Eggplant I (aut) 567 165 102 46 137 117 Eggplant II (spr) 633 40 87 162 204 140 Eggplant III (win) 401 100 26 34 71 99 71 Pepper I (aut) 606 181 114 55 137 119 Pepper II (spr) 642 43 93 162 204 140 Pepper III (win) 408 100 28 39 71 99 71 Banana 2236 272 146 76 55 46 77 125 171 258 330 365 315 Citrus 1692 181 97 42 30 56 80 143 183 226 233 226 195
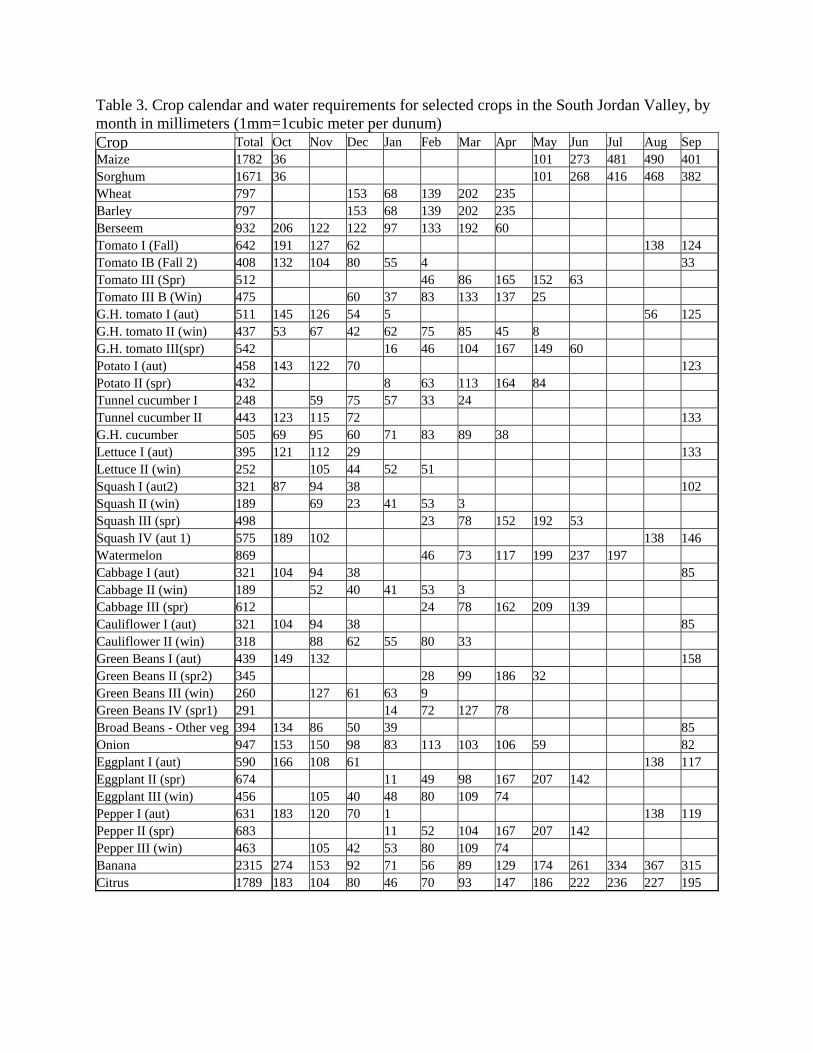
Table 3. Crop calendar and water requirements for selected crops in the South Jordan Valley, by month in millimeters (1mm=1cubic meter per dunum) Crop Total Oct Nov Dec Jan Feb Mar Apr May Jun Jul Aug Sep Maize 1782 36 101 273 481 490 401 Sorghum 1671 36 101 268 416 468 382 Wheat 797 153 68 139 202 235 Barley 797 153 68 139 202 235 Berseem 932 206 122 122 97 133 192 60 Tomato I (Fall) 642 191 127 62 138 124 Tomato IB (Fall 2) 408 132 104 80 55 4 33 Tomato III (Spr) 512 46 86 165 152 63 Tomato III B (Win) 475 60 37 83 133 137 25 G.H. tomato I (aut) 511 145 126 54 5 56 125 G.H. tomato II (win) 437 53 67 42 62 75 85 45 8 G.H. tomato III(spr) 542 16 46 104 167 149 60 Potato I (aut) 458 143 122 70 123 Potato II (spr) 432 8 63 113 164 84 Tunnel cucumber I 248 59 75 57 33 24 Tunnel cucumber II 443 123 115 72 133 G.H. cucumber 505 69 95 60 71 83 89 38 Lettuce I (aut) 395 121 112 29 133 Lettuce II (win) 252 105 44 52 51 Squash I (aut2) 321 87 94 38 102 Squash II (win) 189 69 23 41 53 3 Squash III (spr) 498 23 78 152 192 53 Squash IV (aut 1) 575 189 102 138 146 Watermelon 869 46 73 117 199 237 197 Cabbage I (aut) 321 104 94 38 85 Cabbage II (win) 189 52 40 41 53 3 Cabbage III (spr) 612 24 78 162 209 139 Cauliflower I (aut) 321 104 94 38 85 Cauliflower II (win) 318 88 62 55 80 33 Green Beans I (aut) 439 149 132 158 Green Beans II (spr2) 345 28 99 186 32 Green Beans III (win) 260 127 61 63 9 Green Beans IV (spr1) 291 14 72 127 78 Broad Beans - Other veg 394 134 86 50 39 85 Onion 947 153 150 98 83 113 103 106 59 82 Eggplant I (aut) 590 166 108 61 138 117 Eggplant II (spr) 674 11 49 98 167 207 142 Eggplant III (win) 456 105 40 48 80 109 74 Pepper I (aut) 631 183 120 70 1 138 119 Pepper II (spr) 683 11 52 104 167 207 142 Pepper III (win) 463 105 42 53 80 109 74 Banana 2315 274 153 92 71 56 89 129 174 261 334 367 315 Citrus 1789 183 104 80 46 70 93 147 186 222 236 227 195
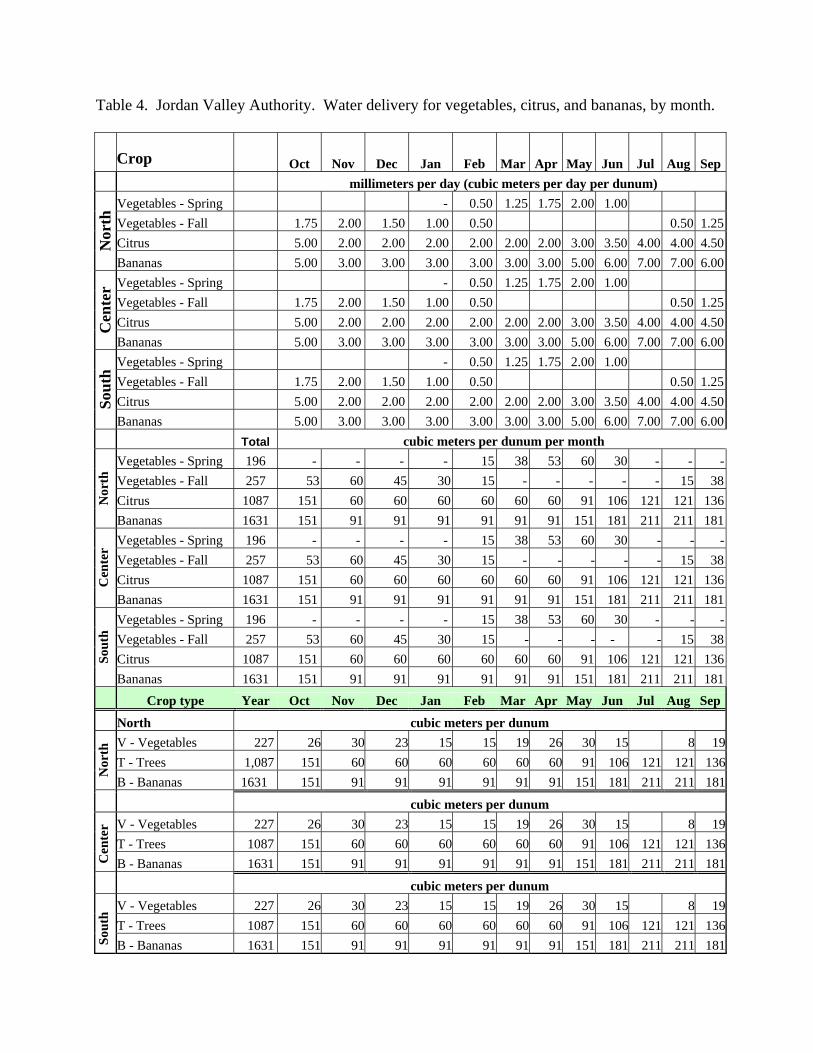
Table 4. Jordan Valley Authority. Water delivery for vegetables, citrus, and bananas, by month.
Crop Oct Nov Dec Jan Feb Mar Apr May Jun Jul Aug Sep millimeters per day (cubic meters per day per dunum)
Vegetables - Spring - 0.50 1.25 1.75 2.00 1.00 Vegetables - Fall 1.75 2.00 1.50 1.00 0.50 0.50 1.25 Citrus 5.00 2.00 2.00 2.00 2.00 2.00 2.00 3.00 3.50 4.00 4.00 4.50 N
orth
Bananas 5.00 3.00 3.00 3.00 3.00 3.00 3.00 5.00 6.00 7.00 7.00 6.00 Vegetables - Spring - 0.50 1.25 1.75 2.00 1.00 Vegetables - Fall 1.75 2.00 1.50 1.00 0.50 0.50 1.25 Citrus 5.00 2.00 2.00 2.00 2.00 2.00 2.00 3.00 3.50 4.00 4.00 4.50 C
ente
r
Bananas 5.00 3.00 3.00 3.00 3.00 3.00 3.00 5.00 6.00 7.00 7.00 6.00 Vegetables - Spring - 0.50 1.25 1.75 2.00 1.00 Vegetables - Fall 1.75 2.00 1.50 1.00 0.50 0.50 1.25 Citrus 5.00 2.00 2.00 2.00 2.00 2.00 2.00 3.00 3.50 4.00 4.00 4.50 So
uth
Bananas 5.00 3.00 3.00 3.00 3.00 3.00 3.00 5.00 6.00 7.00 7.00 6.00 Total cubic meters per dunum per month
Vegetables - Spring 196 - - - - 15 38 53 60 30 - - -Vegetables - Fall 257 53 60 45 30 15 - - - - - 15 38 Citrus 1087 151 60 60 60 60 60 60 91 106 121 121 136 N
orth
Bananas 1631 151 91 91 91 91 91 91 151 181 211 211 181 Vegetables - Spring 196 - - - - 15 38 53 60 30 - - -Vegetables - Fall 257 53 60 45 30 15 - - - - - 15 38 Citrus 1087 151 60 60 60 60 60 60 91 106 121 121 136 C
ente
r
Bananas 1631 151 91 91 91 91 91 91 151 181 211 211 181 Vegetables - Spring 196 - - - - 15 38 53 60 30 - - -Vegetables - Fall 257 53 60 45 30 15 - - - - - 15 38 Citrus 1087 151 60 60 60 60 60 60 91 106 121 121 136 So
uth
Bananas 1631 151 91 91 91 91 91 91 151 181 211 211 181 Crop type Year Oct Nov Dec Jan Feb Mar Apr May Jun Jul Aug Sep
North cubic meters per dunum V - Vegetables 227 26 30 23 15 15 19 26 30 15 8 19T - Trees 1,087 151 60 60 60 60 60 60 91 106 121 121 136
Nor
th
B - Bananas 1631 151 91 91 91 91 91 91 151 181 211 211 181 cubic meters per dunum
V - Vegetables 227 26 30 23 15 15 19 26 30 15 8 19T - Trees 1087 151 60 60 60 60 60 60 91 106 121 121 136
Cen
ter
B - Bananas 1631 151 91 91 91 91 91 91 151 181 211 211 181 cubic meters per dunum
V - Vegetables 227 26 30 23 15 15 19 26 30 15 8 19T - Trees 1087 151 60 60 60 60 60 60 91 106 121 121 136
Sout
h
B - Bananas 1631 151 91 91 91 91 91 91 151 181 211 211 181
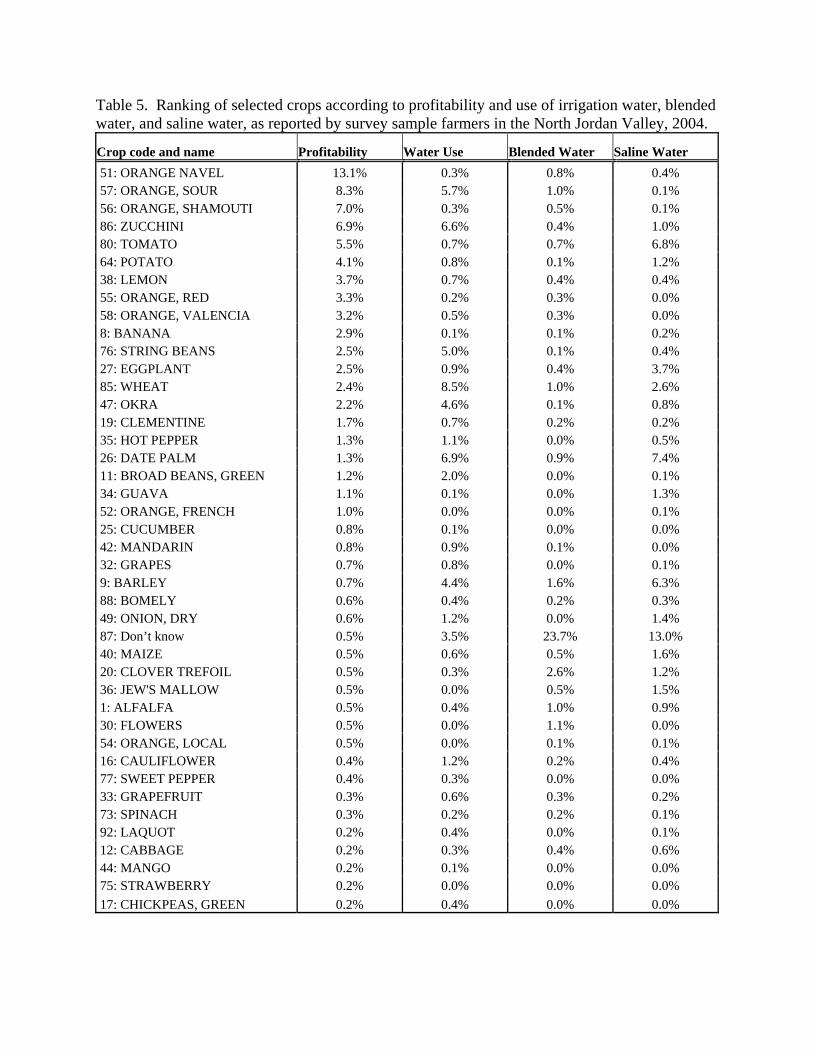
Table 5. Ranking of selected crops according to profitability and use of irrigation water, blended water, and saline water, as reported by survey sample farmers in the North Jordan Valley, 2004.
Crop code and name Profitability Water Use Blended Water Saline Water 51: ORANGE NAVEL 13.1% 0.3% 0.8% 0.4% 57: ORANGE, SOUR 8.3% 5.7% 1.0% 0.1% 56: ORANGE, SHAMOUTI 7.0% 0.3% 0.5% 0.1% 86: ZUCCHINI 6.9% 6.6% 0.4% 1.0% 80: TOMATO 5.5% 0.7% 0.7% 6.8% 64: POTATO 4.1% 0.8% 0.1% 1.2% 38: LEMON 3.7% 0.7% 0.4% 0.4% 55: ORANGE, RED 3.3% 0.2% 0.3% 0.0% 58: ORANGE, VALENCIA 3.2% 0.5% 0.3% 0.0% 8: BANANA 2.9% 0.1% 0.1% 0.2% 76: STRING BEANS 2.5% 5.0% 0.1% 0.4% 27: EGGPLANT 2.5% 0.9% 0.4% 3.7% 85: WHEAT 2.4% 8.5% 1.0% 2.6% 47: OKRA 2.2% 4.6% 0.1% 0.8% 19: CLEMENTINE 1.7% 0.7% 0.2% 0.2% 35: HOT PEPPER 1.3% 1.1% 0.0% 0.5% 26: DATE PALM 1.3% 6.9% 0.9% 7.4% 11: BROAD BEANS, GREEN 1.2% 2.0% 0.0% 0.1% 34: GUAVA 1.1% 0.1% 0.0% 1.3% 52: ORANGE, FRENCH 1.0% 0.0% 0.0% 0.1% 25: CUCUMBER 0.8% 0.1% 0.0% 0.0% 42: MANDARIN 0.8% 0.9% 0.1% 0.0% 32: GRAPES 0.7% 0.8% 0.0% 0.1% 9: BARLEY 0.7% 4.4% 1.6% 6.3% 88: BOMELY 0.6% 0.4% 0.2% 0.3% 49: ONION, DRY 0.6% 1.2% 0.0% 1.4% 87: Don’t know 0.5% 3.5% 23.7% 13.0% 40: MAIZE 0.5% 0.6% 0.5% 1.6% 20: CLOVER TREFOIL 0.5% 0.3% 2.6% 1.2% 36: JEW'S MALLOW 0.5% 0.0% 0.5% 1.5% 1: ALFALFA 0.5% 0.4% 1.0% 0.9% 30: FLOWERS 0.5% 0.0% 1.1% 0.0% 54: ORANGE, LOCAL 0.5% 0.0% 0.1% 0.1% 16: CAULIFLOWER 0.4% 1.2% 0.2% 0.4% 77: SWEET PEPPER 0.4% 0.3% 0.0% 0.0% 33: GRAPEFRUIT 0.3% 0.6% 0.3% 0.2% 73: SPINACH 0.3% 0.2% 0.2% 0.1% 92: LAQUOT 0.2% 0.4% 0.0% 0.1% 12: CABBAGE 0.2% 0.3% 0.4% 0.6% 44: MANGO 0.2% 0.1% 0.0% 0.0% 75: STRAWBERRY 0.2% 0.0% 0.0% 0.0% 17: CHICKPEAS, GREEN 0.2% 0.4% 0.0% 0.0%

Table 6. Ranking of selected crops according to profitability and use of irrigation water, blended water, and saline water, as reported by survey sample farmers in the Center Jordan Valley, 2004.
Crop code and name Profitability Water Use Blended Water Saline Water 80: TOMATO 19.7% 6.1% 9.3% 15.0% 64: POTATO 10.3% 3.0% 2.4% 1.7% 25: CUCUMBER 8.5% 2.6% 2.0% 0.1% 27: EGGPLANT 7.3% 6.7% 9.7% 8.3% 86: ZUCCHINI 6.7% 6.4% 2.0% 2.2% 76: STRING BEANS 4.8% 8.7% 1.2% 0.5% 49: ONION, DRY 4.5% 4.1% 4.0% 2.5% 35: HOT PEPPER 3.9% 4.0% 1.6% 0.5% 26: DATE PALM 3.1% 7.6% 2.4% 8.6% 77: SWEET PEPPER 1.9% 0.6% 0.3% 0.2% 11: BROAD BEANS, GREEN 1.6% 2.7% 1.3% 0.8% 40: MAIZE 1.5% 0.9% 3.1% 1.2% 85: WHEAT 1.4% 2.8% 2.5% 2.4% 39: LETTUCE 1.4% 0.6% 0.8% 0.4% 12: CABBAGE 1.3% 0.8% 1.3% 1.0% 75: STRAWBERRY 1.3% 0.1% 0.0% 0.0% 87: Don’t know 1.2% 3.1% 8.3% 7.8% 51: ORANGE NAVEL 1.0% 0.0% 0.0% 0.0% 36: JEW'S MALLOW 1.0% 0.7% 2.5% 2.1% 32: GRAPES 0.8% 0.4% 0.3% 0.4% 57: ORANGE, SOUR 0.7% 0.1% 0.0% 0.0% 15: CARROT 0.6% 0.4% 0.4% 0.4% 9: BARLEY 0.5% 1.3% 2.7% 3.6% 56: ORANGE, SHAMOUTI 0.5% 0.1% 0.0% 0.0% 16: CAULIFLOWER 0.4% 1.0% 0.9% 0.8% 48: OLIVE 0.4% 5.3% 1.0% 2.2% 8: BANANA 0.3% 0.0% 0.1% 0.2% 47: OKRA 0.3% 2.7% 1.0% 0.6% 1: ALFALFA 0.3% 0.5% 1.9% 1.5% 19: CLEMENTINE 0.3% 0.0% 0.0% 0.0% 31: GARLIC 0.2% 0.4% 0.1% 0.0% 74: SQUASH 0.2% 0.0% 0.0% 0.0% 30: FLOWERS 0.2% 0.0% 0.0% 0.0% 62: PEPPERWORT 0.2% 0.0% 0.0% 0.0% 6: ASPARAGUS 0.1% 0.1% 0.1% 0.0% 38: LEMON 0.1% 0.0% 0.0% 0.1% 88: BOMELY 0.1% 0.0% 0.0% 0.0% 71: SNAKE CUCUMBER 0.1% 0.1% 0.0% 0.0% 22: COWPEAS 0.1% 1.2% 0.1% 0.0% 33: GRAPEFRUIT 0.1% 0.1% 0.0% 0.0% 10: BEET,RED 0.1% 0.0% 0.1% 0.0% 14: CANTALOUPE 0.1% 0.2% 0.0% 0.2%
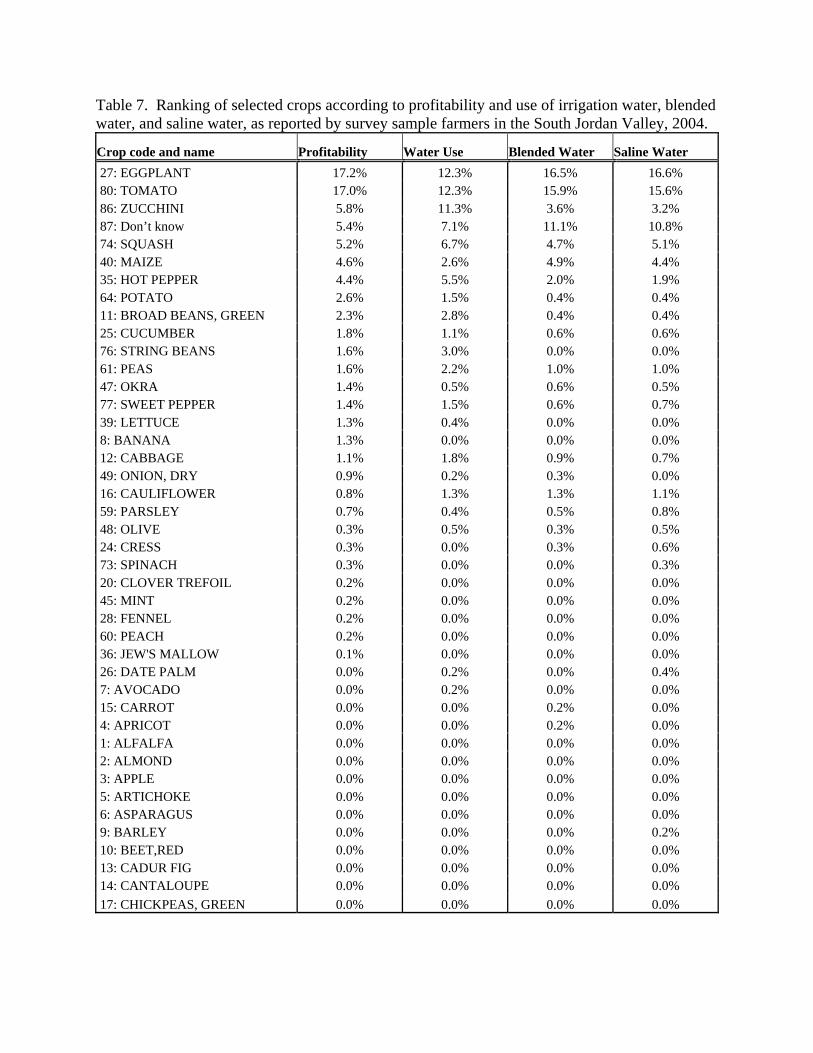
Table 7. Ranking of selected crops according to profitability and use of irrigation water, blended water, and saline water, as reported by survey sample farmers in the South Jordan Valley, 2004.
Crop code and name Profitability Water Use Blended Water Saline Water 27: EGGPLANT 17.2% 12.3% 16.5% 16.6% 80: TOMATO 17.0% 12.3% 15.9% 15.6% 86: ZUCCHINI 5.8% 11.3% 3.6% 3.2% 87: Don’t know 5.4% 7.1% 11.1% 10.8% 74: SQUASH 5.2% 6.7% 4.7% 5.1% 40: MAIZE 4.6% 2.6% 4.9% 4.4% 35: HOT PEPPER 4.4% 5.5% 2.0% 1.9% 64: POTATO 2.6% 1.5% 0.4% 0.4% 11: BROAD BEANS, GREEN 2.3% 2.8% 0.4% 0.4% 25: CUCUMBER 1.8% 1.1% 0.6% 0.6% 76: STRING BEANS 1.6% 3.0% 0.0% 0.0% 61: PEAS 1.6% 2.2% 1.0% 1.0% 47: OKRA 1.4% 0.5% 0.6% 0.5% 77: SWEET PEPPER 1.4% 1.5% 0.6% 0.7% 39: LETTUCE 1.3% 0.4% 0.0% 0.0% 8: BANANA 1.3% 0.0% 0.0% 0.0% 12: CABBAGE 1.1% 1.8% 0.9% 0.7% 49: ONION, DRY 0.9% 0.2% 0.3% 0.0% 16: CAULIFLOWER 0.8% 1.3% 1.3% 1.1% 59: PARSLEY 0.7% 0.4% 0.5% 0.8% 48: OLIVE 0.3% 0.5% 0.3% 0.5% 24: CRESS 0.3% 0.0% 0.3% 0.6% 73: SPINACH 0.3% 0.0% 0.0% 0.3% 20: CLOVER TREFOIL 0.2% 0.0% 0.0% 0.0% 45: MINT 0.2% 0.0% 0.0% 0.0% 28: FENNEL 0.2% 0.0% 0.0% 0.0% 60: PEACH 0.2% 0.0% 0.0% 0.0% 36: JEW'S MALLOW 0.1% 0.0% 0.0% 0.0% 26: DATE PALM 0.0% 0.2% 0.0% 0.4% 7: AVOCADO 0.0% 0.2% 0.0% 0.0% 15: CARROT 0.0% 0.0% 0.2% 0.0% 4: APRICOT 0.0% 0.0% 0.2% 0.0% 1: ALFALFA 0.0% 0.0% 0.0% 0.0% 2: ALMOND 0.0% 0.0% 0.0% 0.0% 3: APPLE 0.0% 0.0% 0.0% 0.0% 5: ARTICHOKE 0.0% 0.0% 0.0% 0.0% 6: ASPARAGUS 0.0% 0.0% 0.0% 0.0% 9: BARLEY 0.0% 0.0% 0.0% 0.2% 10: BEET,RED 0.0% 0.0% 0.0% 0.0% 13: CADUR FIG 0.0% 0.0% 0.0% 0.0% 14: CANTALOUPE 0.0% 0.0% 0.0% 0.0% 17: CHICKPEAS, GREEN 0.0% 0.0% 0.0% 0.0%
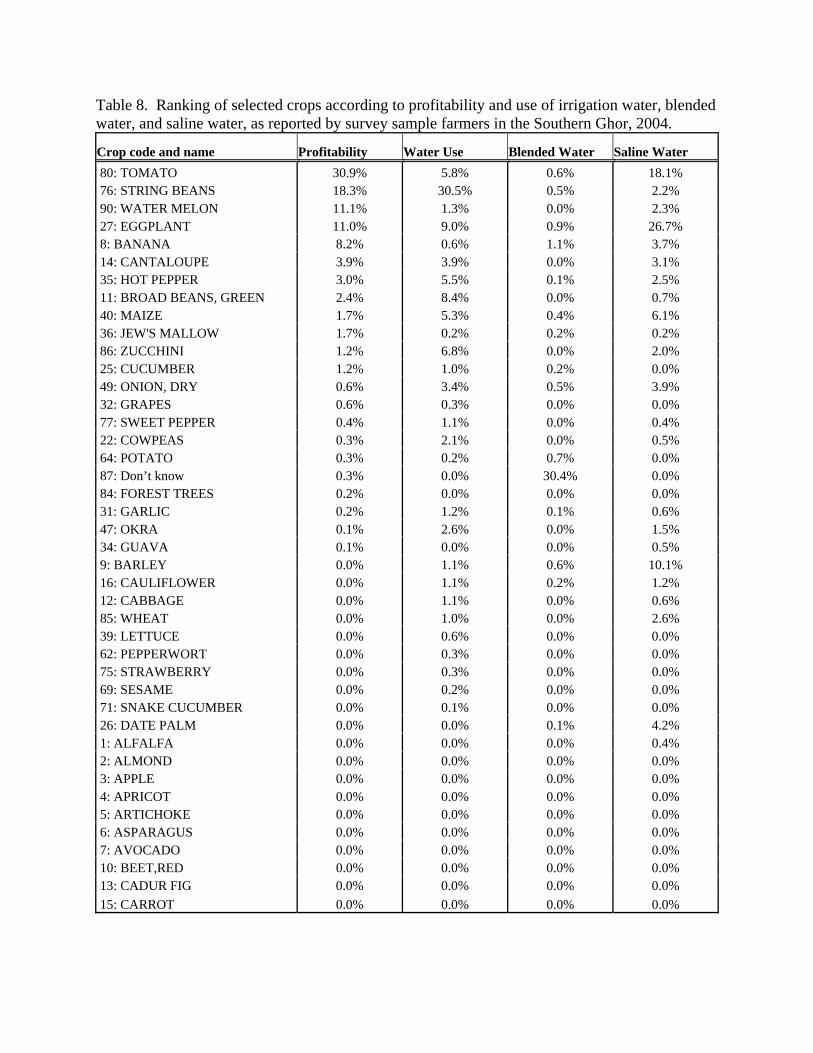
Table 8. Ranking of selected crops according to profitability and use of irrigation water, blended water, and saline water, as reported by survey sample farmers in the Southern Ghor, 2004.
Crop code and name Profitability Water Use Blended Water Saline Water 80: TOMATO 30.9% 5.8% 0.6% 18.1% 76: STRING BEANS 18.3% 30.5% 0.5% 2.2% 90: WATER MELON 11.1% 1.3% 0.0% 2.3% 27: EGGPLANT 11.0% 9.0% 0.9% 26.7% 8: BANANA 8.2% 0.6% 1.1% 3.7% 14: CANTALOUPE 3.9% 3.9% 0.0% 3.1% 35: HOT PEPPER 3.0% 5.5% 0.1% 2.5% 11: BROAD BEANS, GREEN 2.4% 8.4% 0.0% 0.7% 40: MAIZE 1.7% 5.3% 0.4% 6.1% 36: JEW'S MALLOW 1.7% 0.2% 0.2% 0.2% 86: ZUCCHINI 1.2% 6.8% 0.0% 2.0% 25: CUCUMBER 1.2% 1.0% 0.2% 0.0% 49: ONION, DRY 0.6% 3.4% 0.5% 3.9% 32: GRAPES 0.6% 0.3% 0.0% 0.0% 77: SWEET PEPPER 0.4% 1.1% 0.0% 0.4% 22: COWPEAS 0.3% 2.1% 0.0% 0.5% 64: POTATO 0.3% 0.2% 0.7% 0.0% 87: Don’t know 0.3% 0.0% 30.4% 0.0% 84: FOREST TREES 0.2% 0.0% 0.0% 0.0% 31: GARLIC 0.2% 1.2% 0.1% 0.6% 47: OKRA 0.1% 2.6% 0.0% 1.5% 34: GUAVA 0.1% 0.0% 0.0% 0.5% 9: BARLEY 0.0% 1.1% 0.6% 10.1% 16: CAULIFLOWER 0.0% 1.1% 0.2% 1.2% 12: CABBAGE 0.0% 1.1% 0.0% 0.6% 85: WHEAT 0.0% 1.0% 0.0% 2.6% 39: LETTUCE 0.0% 0.6% 0.0% 0.0% 62: PEPPERWORT 0.0% 0.3% 0.0% 0.0% 75: STRAWBERRY 0.0% 0.3% 0.0% 0.0% 69: SESAME 0.0% 0.2% 0.0% 0.0% 71: SNAKE CUCUMBER 0.0% 0.1% 0.0% 0.0% 26: DATE PALM 0.0% 0.0% 0.1% 4.2% 1: ALFALFA 0.0% 0.0% 0.0% 0.4% 2: ALMOND 0.0% 0.0% 0.0% 0.0% 3: APPLE 0.0% 0.0% 0.0% 0.0% 4: APRICOT 0.0% 0.0% 0.0% 0.0% 5: ARTICHOKE 0.0% 0.0% 0.0% 0.0% 6: ASPARAGUS 0.0% 0.0% 0.0% 0.0% 7: AVOCADO 0.0% 0.0% 0.0% 0.0% 10: BEET,RED 0.0% 0.0% 0.0% 0.0% 13: CADUR FIG 0.0% 0.0% 0.0% 0.0% 15: CARROT 0.0% 0.0% 0.0% 0.0%
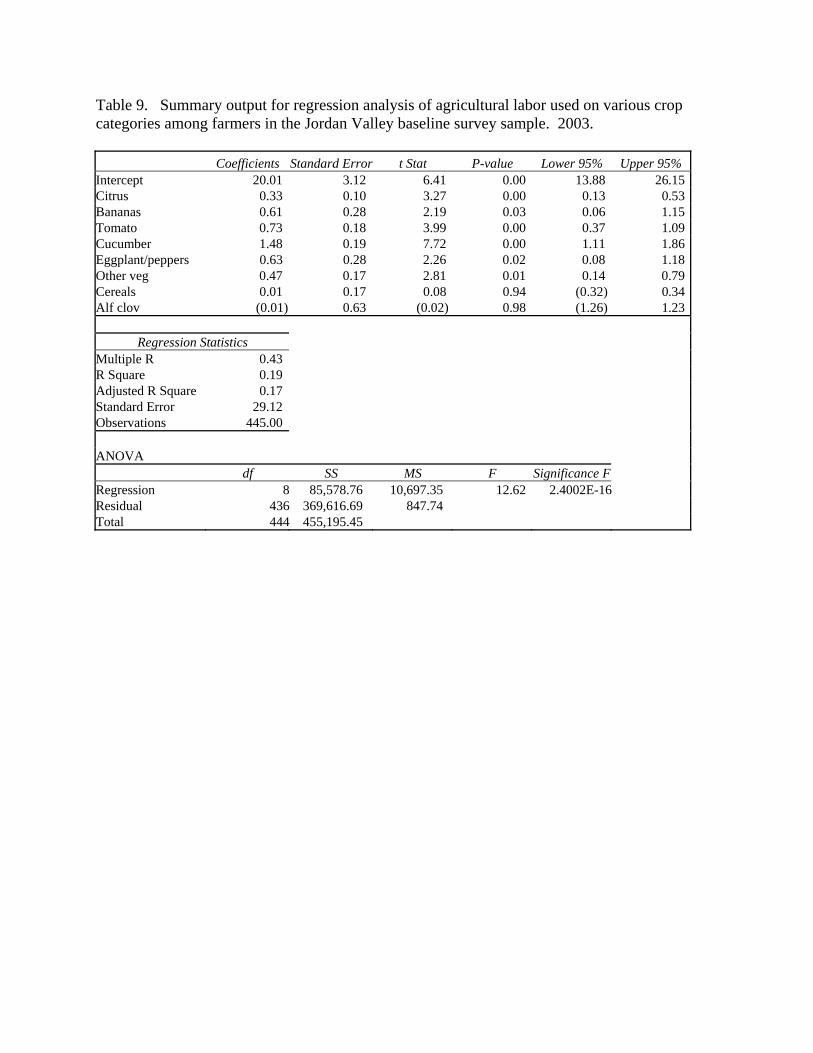
Table 9. Summary output for regression analysis of agricultural labor used on various crop categories among farmers in the Jordan Valley baseline survey sample. 2003.
Coefficients Standard Error t Stat P-value Lower 95% Upper 95% Intercept 20.01 3.12 6.41 0.00 13.88 26.15 Citrus 0.33 0.10 3.27 0.00 0.13 0.53 Bananas 0.61 0.28 2.19 0.03 0.06 1.15 Tomato 0.73 0.18 3.99 0.00 0.37 1.09 Cucumber 1.48 0.19 7.72 0.00 1.11 1.86 Eggplant/peppers 0.63 0.28 2.26 0.02 0.08 1.18 Other veg 0.47 0.17 2.81 0.01 0.14 0.79 Cereals 0.01 0.17 0.08 0.94 (0.32) 0.34 Alf clov (0.01) 0.63 (0.02) 0.98 (1.26) 1.23
Regression Statistics Multiple R 0.43 R Square 0.19 Adjusted R Square 0.17 Standard Error 29.12 Observations 445.00 ANOVA
df SS MS F Significance F Regression 8 85,578.76 10,697.35 12.62 2.4002E-16 Residual 436 369,616.69 847.74 Total 444 455,195.45
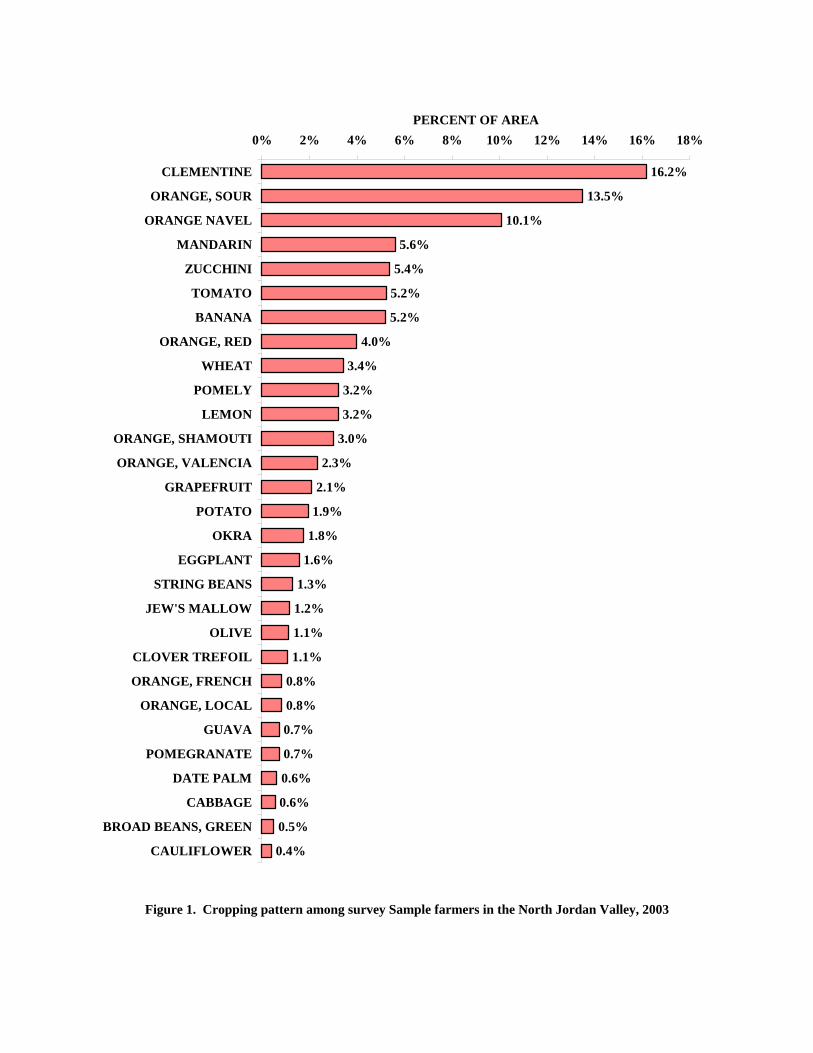
16.2%
13.5%
10.1%
5.6%
5.4%
5.2%
5.2%
4.0%
3.4%
3.2%
3.2%
3.0%
2.3%
2.1%
1.9%
1.8%
1.6%
1.3%
1.2%
1.1%
1.1%
0.8%
0.8%
0.7%
0.7%
0.6%
0.6%
0.5%
0.4%
0% 2% 4% 6% 8% 10% 12% 14% 16% 18%
CLEMENTINE
ORANGE, SOUR
ORANGE NAVEL
MANDARIN
ZUCCHINI
TOMATO
BANANA
ORANGE, RED
WHEAT
POMELY
LEMON
ORANGE, SHAMOUTI
ORANGE, VALENCIA
GRAPEFRUIT
POTATO
OKRA
EGGPLANT
STRING BEANS
JEW'S MALLOW
OLIVE
CLOVER TREFOIL
ORANGE, FRENCH
ORANGE, LOCAL
GUAVA
POMEGRANATE
DATE PALM
CABBAGE
BROAD BEANS, GREEN
CAULIFLOWER
PERCENT OF AREA
Figure 1. Cropping pattern among survey Sample farmers in the North Jordan Valley, 2003
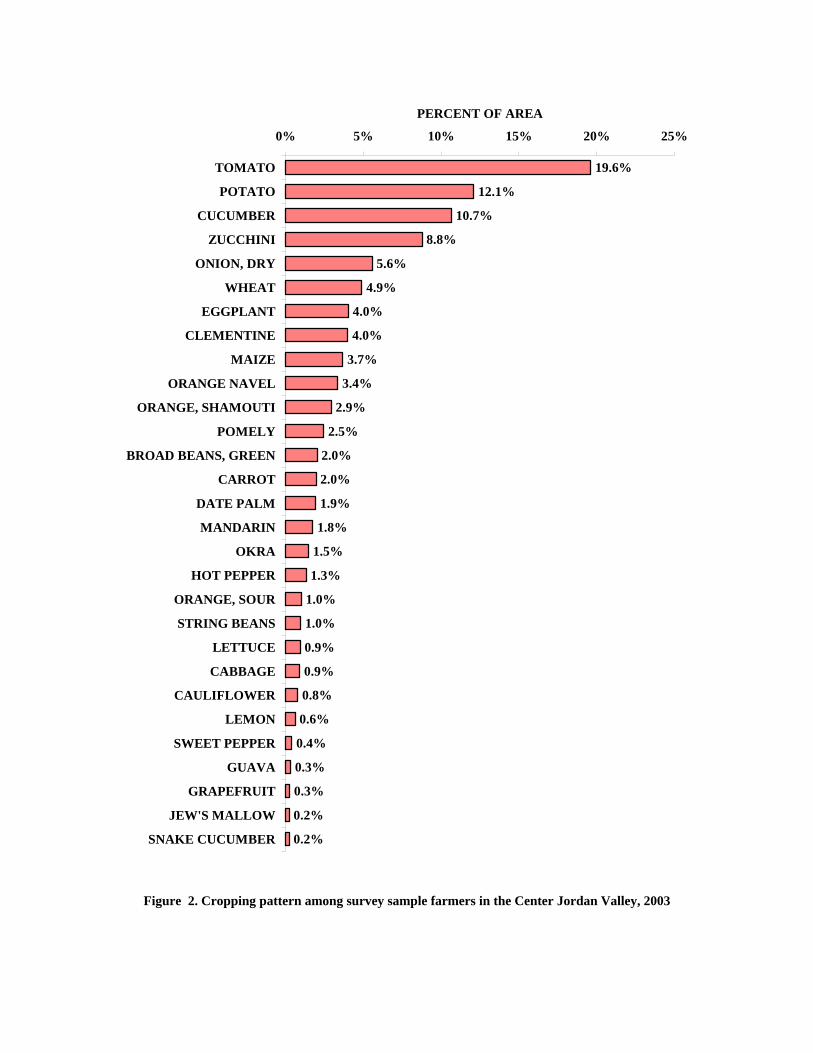
19.6%
12.1%
10.7%
8.8%
5.6%
4.9%
4.0%
4.0%
3.7%
3.4%
2.9%
2.5%
2.0%
2.0%
1.9%
1.8%
1.5%
1.3%
1.0%
1.0%
0.9%
0.9%
0.8%
0.6%
0.4%
0.3%
0.3%
0.2%
0.2%
0% 5% 10% 15% 20% 25%
TOMATO
POTATO
CUCUMBER
ZUCCHINI
ONION, DRY
WHEAT
EGGPLANT
CLEMENTINE
MAIZE
ORANGE NAVEL
ORANGE, SHAMOUTI
POMELY
BROAD BEANS, GREEN
CARROT
DATE PALM
MANDARIN
OKRA
HOT PEPPER
ORANGE, SOUR
STRING BEANS
LETTUCE
CABBAGE
CAULIFLOWER
LEMON
SWEET PEPPER
GUAVA
GRAPEFRUIT
JEW'S MALLOW
SNAKE CUCUMBER
PERCENT OF AREA
Figure 2. Cropping pattern among survey sample farmers in the Center Jordan Valley, 2003
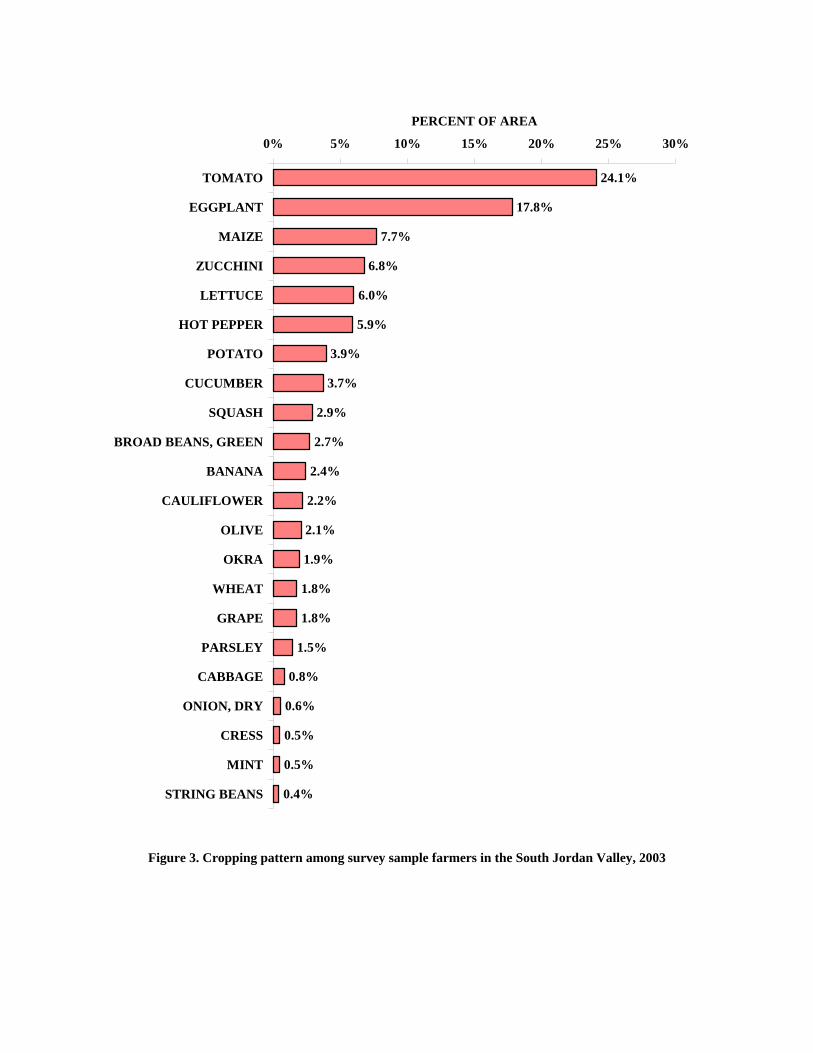
24.1%
17.8%
7.7%
6.8%
6.0%
5.9%
3.9%
3.7%
2.9%
2.7%
2.4%
2.2%
2.1%
1.9%
1.8%
1.8%
1.5%
0.8%
0.6%
0.5%
0.5%
0.4%
0% 5% 10% 15% 20% 25% 30%
TOMATO
EGGPLANT
MAIZE
ZUCCHINI
LETTUCE
HOT PEPPER
POTATO
CUCUMBER
SQUASH
BROAD BEANS, GREEN
BANANA
CAULIFLOWER
OLIVE
OKRA
WHEAT
GRAPE
PARSLEY
CABBAGE
ONION, DRY
CRESS
MINT
STRING BEANS
PERCENT OF AREA
Figure 3. Cropping pattern among survey sample farmers in the South Jordan Valley, 2003
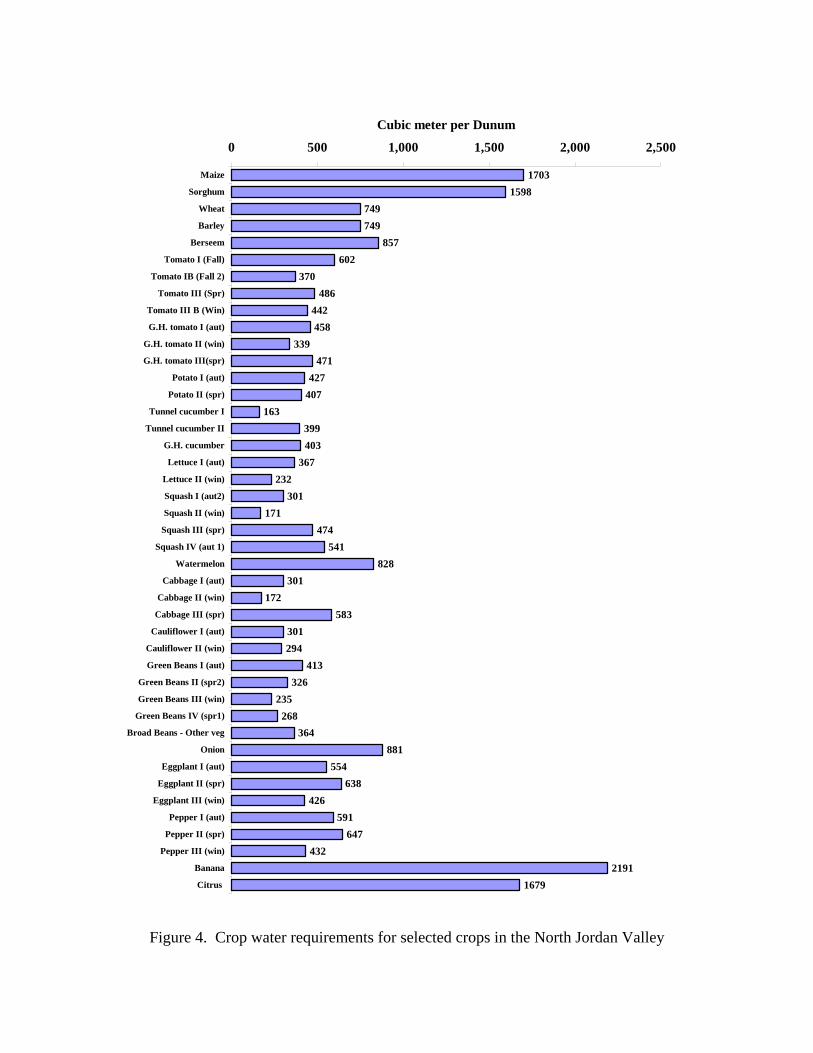
17031598
749749
857602
370486
442458
339471
427407
163399403
367232
301171
474541
828301
172583
301294
413326
235268
364881
554638
426591
647432
21911679
0 500 1,000 1,500 2,000 2,500
Maize
Sorghum
Wheat
Barley
Berseem
Tomato I (Fall)
Tomato IB (Fall 2)
Tomato III (Spr)
Tomato III B (Win)
G.H. tomato I (aut)
G.H. tomato II (win)
G.H. tomato III(spr)
Potato I (aut)
Potato II (spr)
Tunnel cucumber I
Tunnel cucumber II
G.H. cucumber
Lettuce I (aut)
Lettuce II (win)
Squash I (aut2)
Squash II (win)
Squash III (spr)
Squash IV (aut 1)
Watermelon
Cabbage I (aut)
Cabbage II (win)
Cabbage III (spr)
Cauliflower I (aut)
Cauliflower II (win)
Green Beans I (aut)
Green Beans II (spr2)
Green Beans III (win)
Green Beans IV (spr1)
Broad Beans - Other veg
Onion
Eggplant I (aut)
Eggplant II (spr)
Eggplant III (win)
Pepper I (aut)
Pepper II (spr)
Pepper III (win)
Banana
Citrus
Cubic meter per Dunum
Figure 4. Crop water requirements for selected crops in the North Jordan Valley
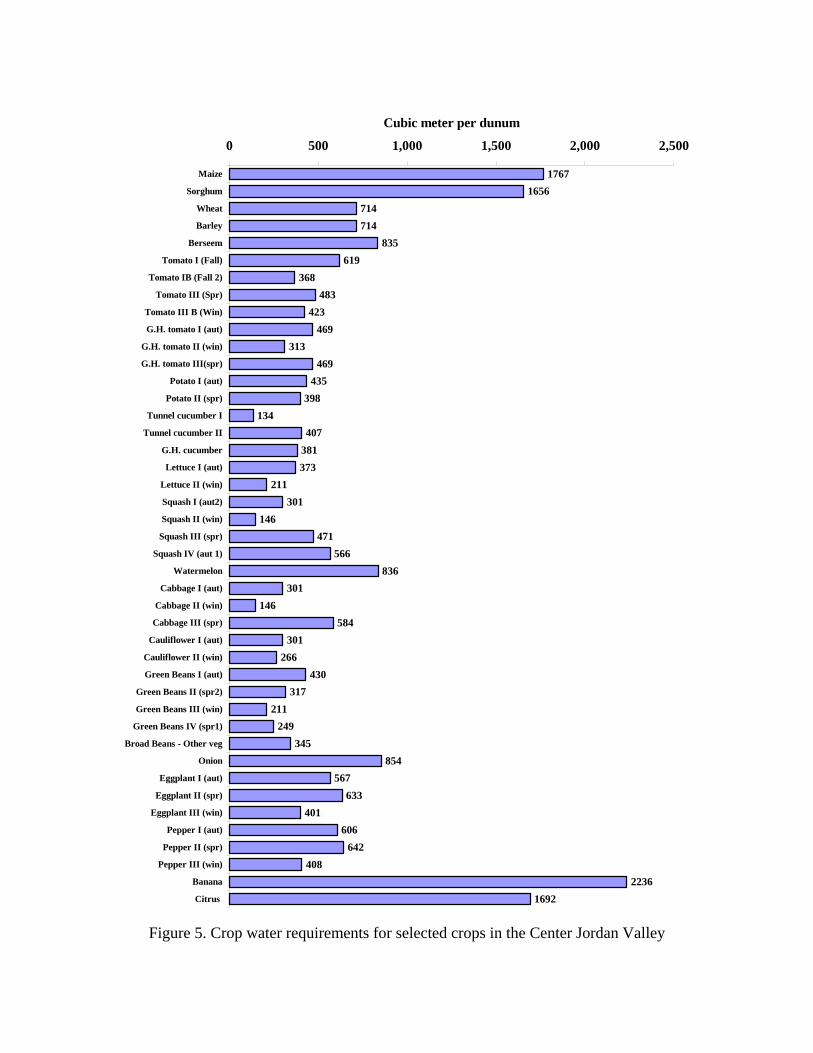
17671656
714714
835619
368483
423469
313469
435398
134407
381373
211301
146471
566836
301146
584301
266430
317211
249345
854567
633401
606642
4082236
1692
0 500 1,000 1,500 2,000 2,500
Maize
Sorghum
Wheat
Barley
Berseem
Tomato I (Fall)
Tomato IB (Fall 2)
Tomato III (Spr)
Tomato III B (Win)
G.H. tomato I (aut)
G.H. tomato II (win)
G.H. tomato III(spr)
Potato I (aut)
Potato II (spr)
Tunnel cucumber I
Tunnel cucumber II
G.H. cucumber
Lettuce I (aut)
Lettuce II (win)
Squash I (aut2)
Squash II (win)
Squash III (spr)
Squash IV (aut 1)
Watermelon
Cabbage I (aut)
Cabbage II (win)
Cabbage III (spr)
Cauliflower I (aut)
Cauliflower II (win)
Green Beans I (aut)
Green Beans II (spr2)
Green Beans III (win)
Green Beans IV (spr1)
Broad Beans - Other veg
Onion
Eggplant I (aut)
Eggplant II (spr)
Eggplant III (win)
Pepper I (aut)
Pepper II (spr)
Pepper III (win)
Banana
Citrus
Cubic meter per dunum
Figure 5. Crop water requirements for selected crops in the Center Jordan Valley
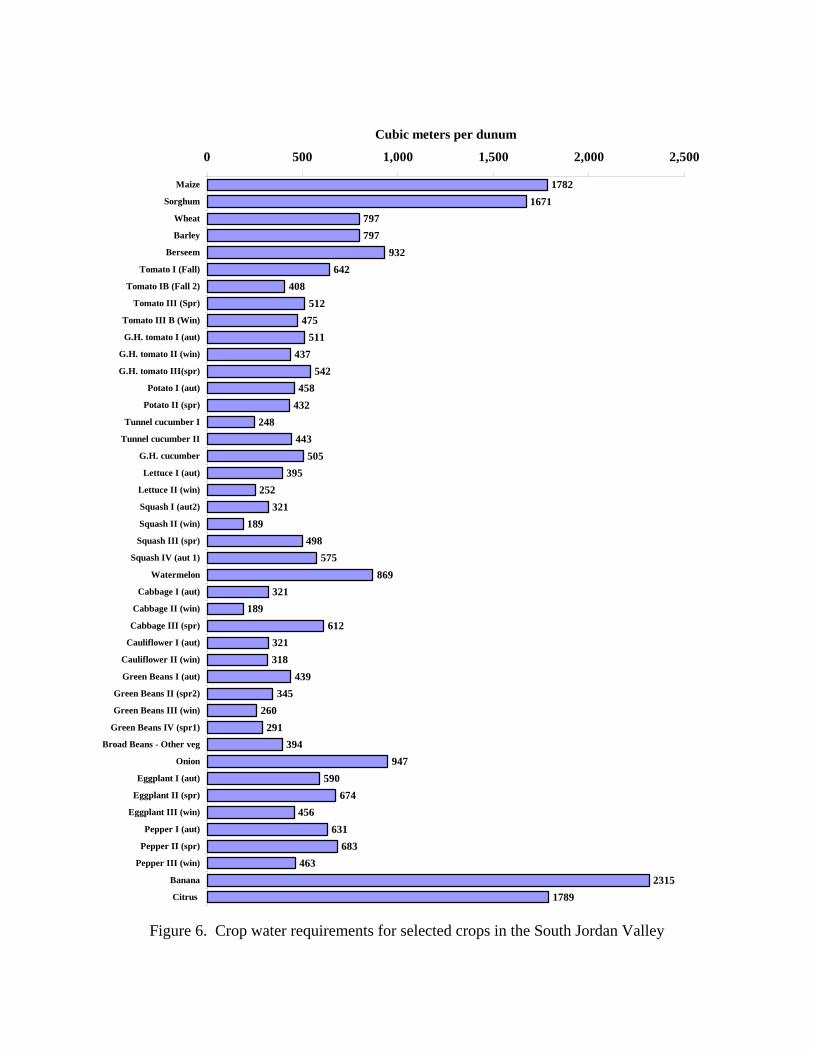
17821671
797797
932642
408512
475511
437542
458432
248443
505395
252321
189498
575869
321189
612321318
439345
260291
394947
590674
456631
683463
23151789
0 500 1,000 1,500 2,000 2,500
Maize
Sorghum
Wheat
Barley
Berseem
Tomato I (Fall)
Tomato IB (Fall 2)
Tomato III (Spr)
Tomato III B (Win)
G.H. tomato I (aut)
G.H. tomato II (win)
G.H. tomato III(spr)
Potato I (aut)
Potato II (spr)
Tunnel cucumber I
Tunnel cucumber II
G.H. cucumber
Lettuce I (aut)
Lettuce II (win)
Squash I (aut2)
Squash II (win)
Squash III (spr)
Squash IV (aut 1)
Watermelon
Cabbage I (aut)
Cabbage II (win)
Cabbage III (spr)
Cauliflower I (aut)
Cauliflower II (win)
Green Beans I (aut)
Green Beans II (spr2)
Green Beans III (win)
Green Beans IV (spr1)
Broad Beans - Other veg
Onion
Eggplant I (aut)
Eggplant II (spr)
Eggplant III (win)
Pepper I (aut)
Pepper II (spr)
Pepper III (win)
Banana
Citrus
Cubic meters per dunum
Figure 6. Crop water requirements for selected crops in the South Jordan Valley
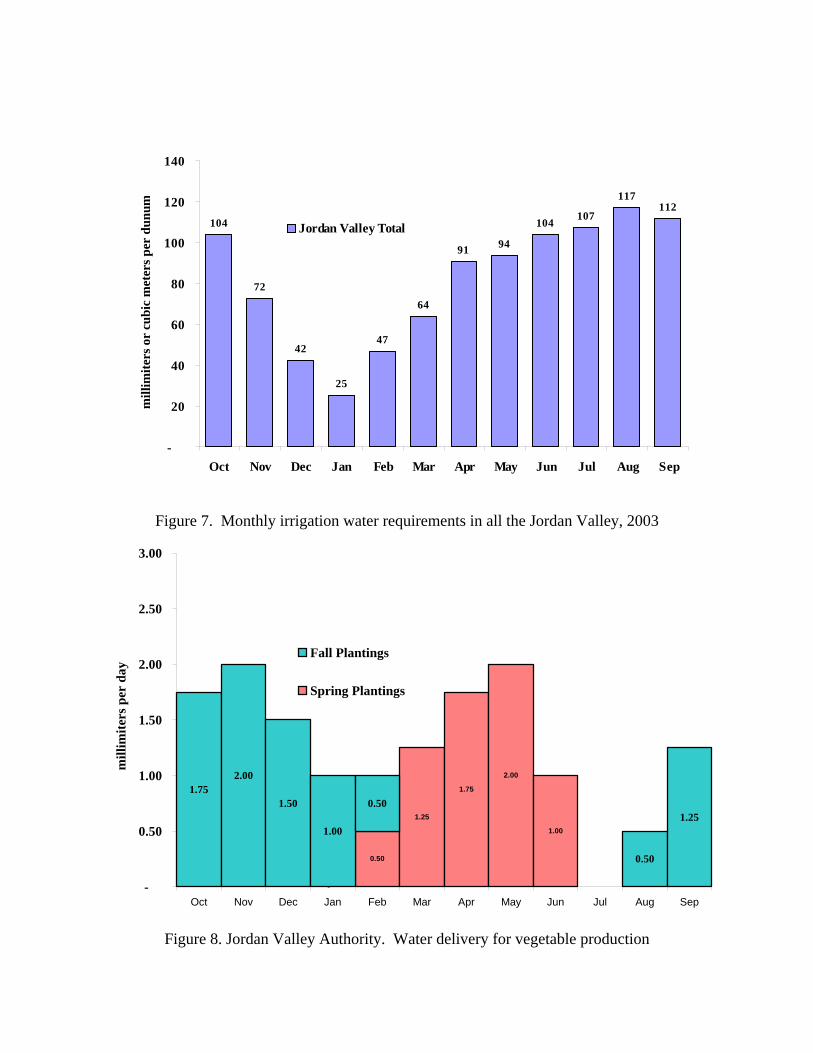
104
72
42
25
47
64
91 94
104 107
117112
-
20
40
60
80
100
120
140
Oct Nov Dec Jan Feb Mar Apr May Jun Jul Aug Sep
mill
imite
rs o
r cu
bic
met
ers p
er d
unum
Jordan Valley Total
Figure 7. Monthly irrigation water requirements in all the Jordan Valley, 2003
-
0.50
1.25
1.75
2.00
1.00
1.752.00
1.50
1.00
0.50
0.50
1.25
-
0.50
1.00
1.50
2.00
2.50
3.00
Oct Nov Dec Jan Feb Mar Apr May Jun Jul Aug Sep
mill
imite
rs p
er d
ay
Fall Plantings
Spring Plantings
Figure 8. Jordan Valley Authority. Water delivery for vegetable production
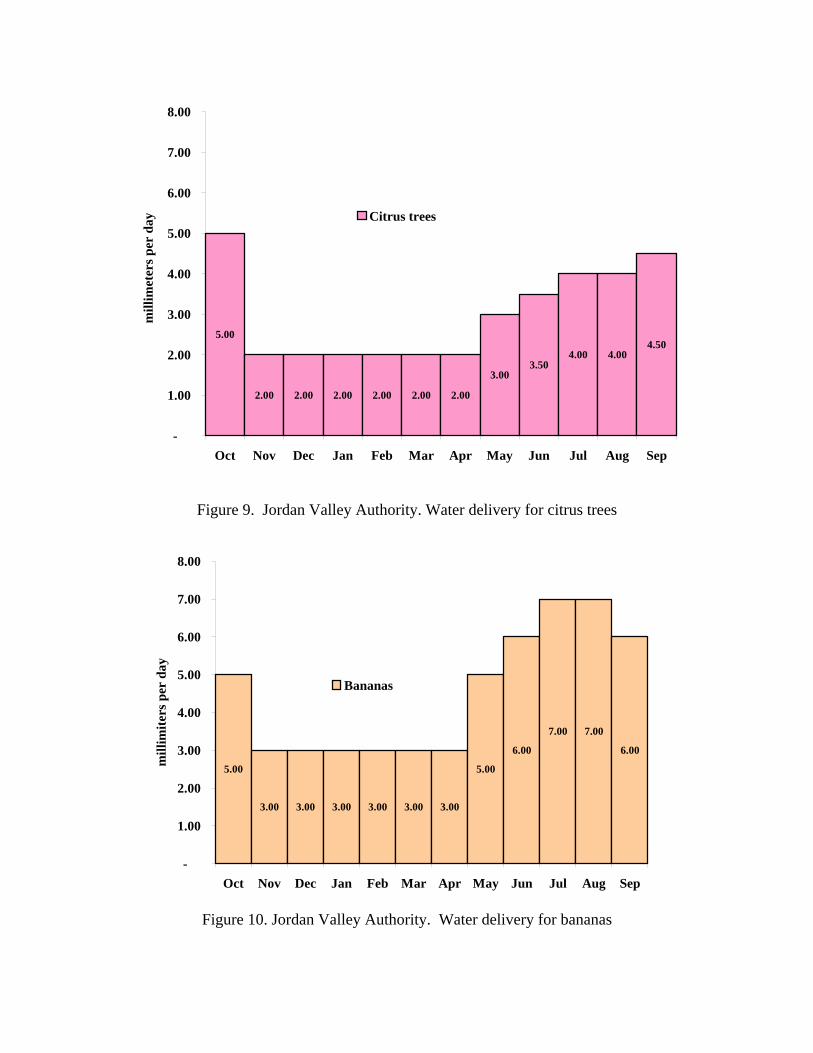
5.00
2.00 2.00 2.00 2.00 2.00 2.00
3.003.50
4.00 4.004.50
-
1.00
2.00
3.00
4.00
5.00
6.00
7.00
8.00
Oct Nov Dec Jan Feb Mar Apr May Jun Jul Aug Sep
mill
imet
ers p
er d
ay Citrus trees
Figure 9. Jordan Valley Authority. Water delivery for citrus trees
5.00
3.00 3.00 3.00 3.00 3.00 3.00
5.00
6.00
7.00 7.00
6.00
-
1.00
2.00
3.00
4.00
5.00
6.00
7.00
8.00
Oct Nov Dec Jan Feb Mar Apr May Jun Jul Aug Sep
mill
imite
rs p
er d
ay
Bananas
Figure 10. Jordan Valley Authority. Water delivery for bananas
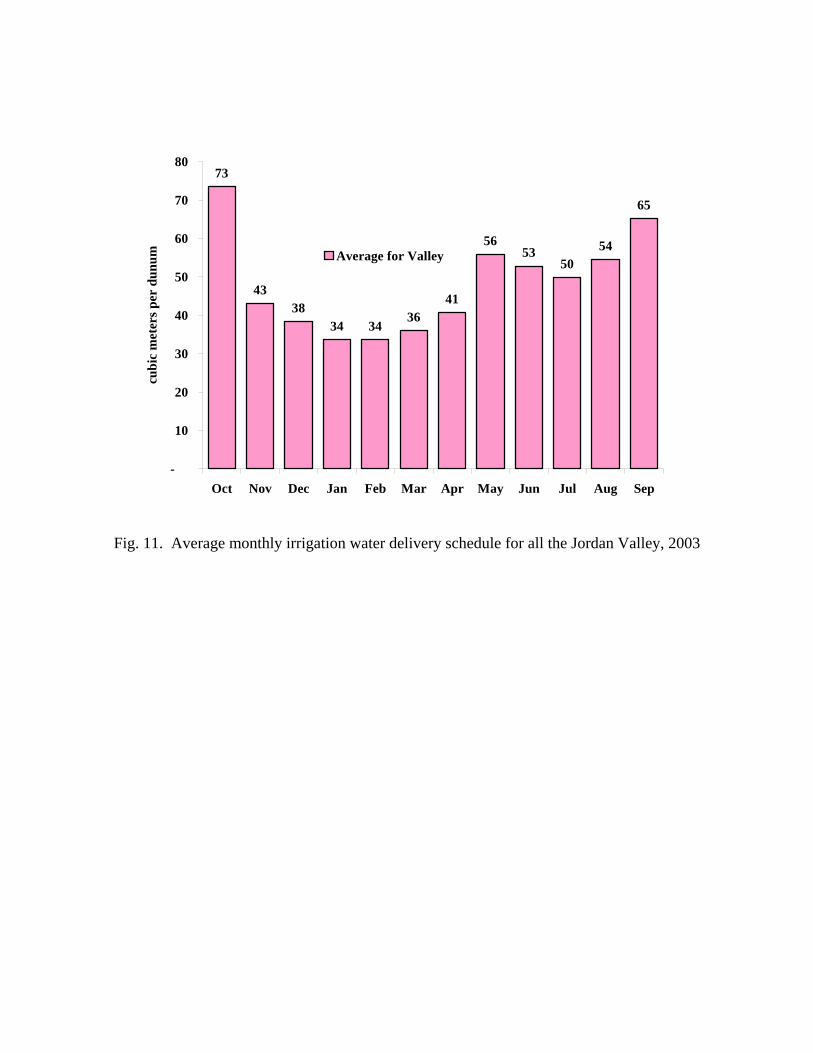
4338
34 3436
41
5653
5054
65
73
-
10
20
30
40
50
60
70
80
Oct Nov Dec Jan Feb Mar Apr May Jun Jul Aug Sep
cubi
c m
eter
s per
dun
um Average for Valley
Fig. 11. Average monthly irrigation water delivery schedule for all the Jordan Valley, 2003
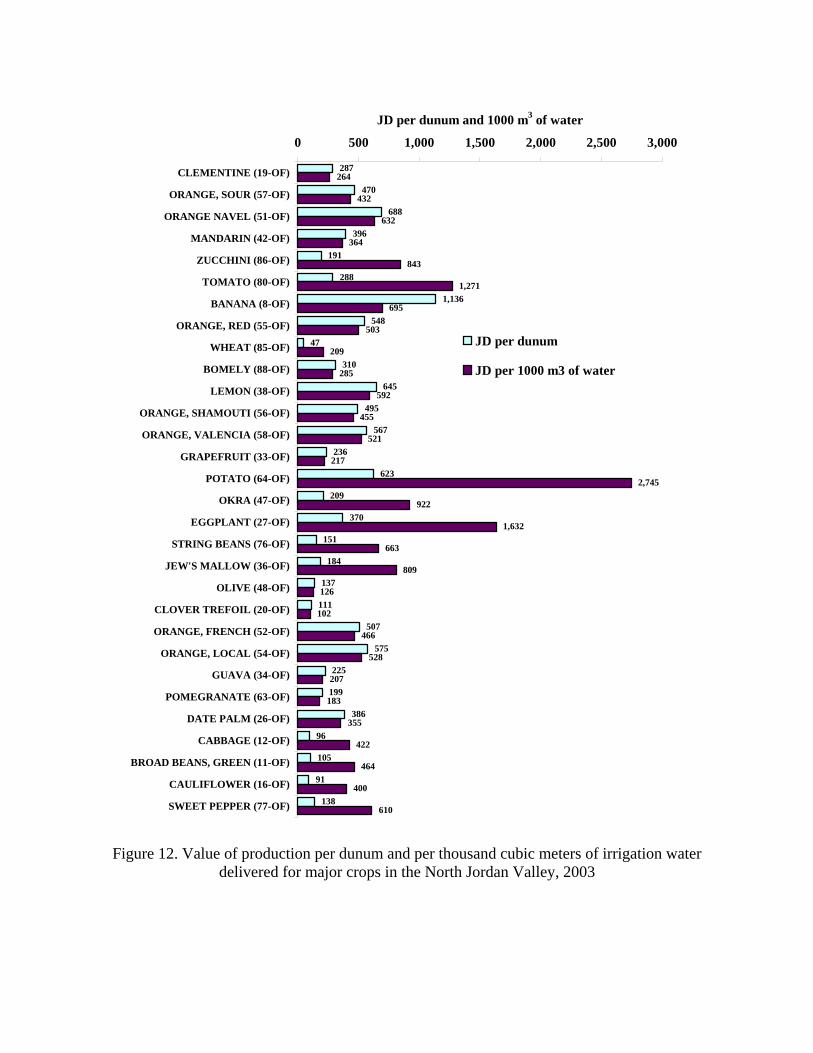
287
470
688
396
191
288
1,136
548
47
310
645
495
567
236
623
209
370
151
184
137
111
507
575
225
199
386
96
105
91
138
264
432
632
364
843
1,271
695
503
209
285
592
455
521
217
2,745
922
1,632
663
809
126
102
466
528
207
183
355
422
464
400
610
0 500 1,000 1,500 2,000 2,500 3,000
CLEMENTINE (19-OF)
ORANGE, SOUR (57-OF)
ORANGE NAVEL (51-OF)
MANDARIN (42-OF)
ZUCCHINI (86-OF)
TOMATO (80-OF)
BANANA (8-OF)
ORANGE, RED (55-OF)
WHEAT (85-OF)
BOMELY (88-OF)
LEMON (38-OF)
ORANGE, SHAMOUTI (56-OF)
ORANGE, VALENCIA (58-OF)
GRAPEFRUIT (33-OF)
POTATO (64-OF)
OKRA (47-OF)
EGGPLANT (27-OF)
STRING BEANS (76-OF)
JEW'S MALLOW (36-OF)
OLIVE (48-OF)
CLOVER TREFOIL (20-OF)
ORANGE, FRENCH (52-OF)
ORANGE, LOCAL (54-OF)
GUAVA (34-OF)
POMEGRANATE (63-OF)
DATE PALM (26-OF)
CABBAGE (12-OF)
BROAD BEANS, GREEN (11-OF)
CAULIFLOWER (16-OF)
SWEET PEPPER (77-OF)
JD per dunum and 1000 m3 of water
JD per dunum
JD per 1000 m3 of water
Figure 12. Value of production per dunum and per thousand cubic meters of irrigation water delivered for major crops in the North Jordan Valley, 2003
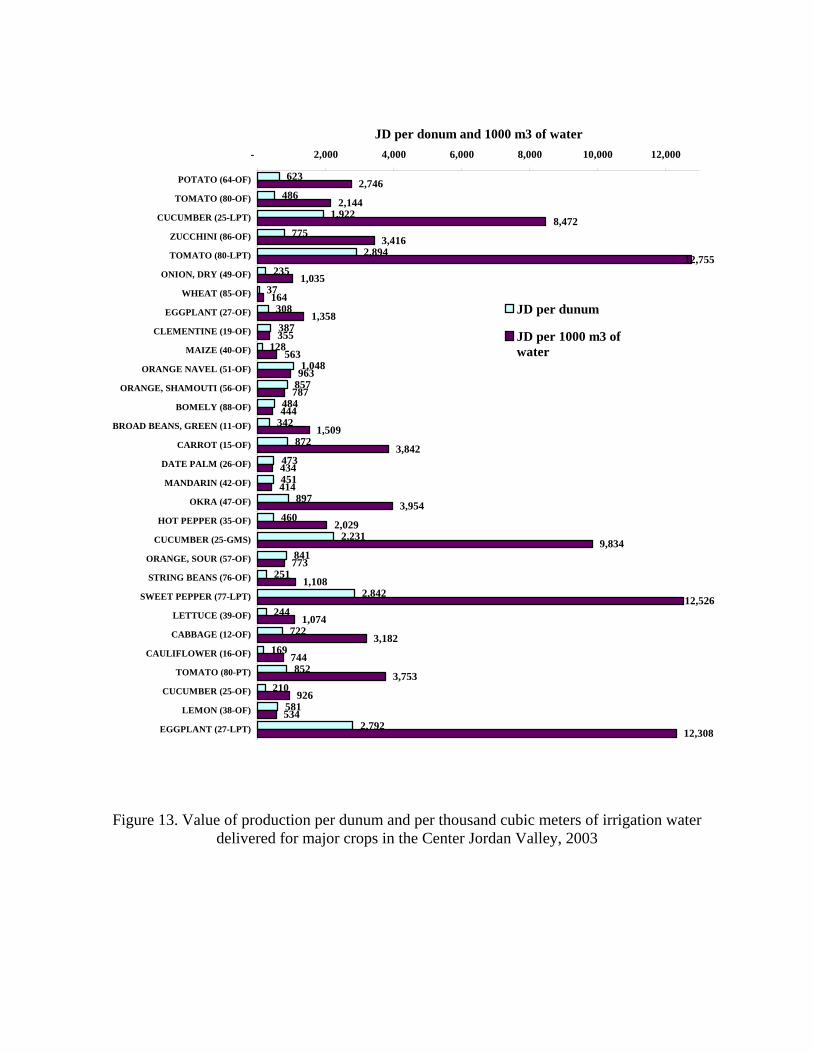
623
486
1,922
775
2,894
235
37
308
387
128
1,048
857
484
342
872
473
451
897
460
2,231
841
251
2,842
244
722
169
852
210
581
2,792
2,746
2,144
8,472
3,416
12,755
1,035
164
1,358
355
563
963
787
444
1,509
3,842
434
414
3,954
2,029
9,834
773
1,108
12,526
1,074
3,182
744
3,753
926
534
12,308
- 2,000 4,000 6,000 8,000 10,000 12,000
POTATO (64-OF)
TOMATO (80-OF)
CUCUMBER (25-LPT)
ZUCCHINI (86-OF)
TOMATO (80-LPT)
ONION, DRY (49-OF)
WHEAT (85-OF)
EGGPLANT (27-OF)
CLEMENTINE (19-OF)
MAIZE (40-OF)
ORANGE NAVEL (51-OF)
ORANGE, SHAMOUTI (56-OF)
BOMELY (88-OF)
BROAD BEANS, GREEN (11-OF)
CARROT (15-OF)
DATE PALM (26-OF)
MANDARIN (42-OF)
OKRA (47-OF)
HOT PEPPER (35-OF)
CUCUMBER (25-GMS)
ORANGE, SOUR (57-OF)
STRING BEANS (76-OF)
SWEET PEPPER (77-LPT)
LETTUCE (39-OF)
CABBAGE (12-OF)
CAULIFLOWER (16-OF)
TOMATO (80-PT)
CUCUMBER (25-OF)
LEMON (38-OF)
EGGPLANT (27-LPT)
JD per donum and 1000 m3 of water
JD per dunum
JD per 1000 m3 ofwater
Figure 13. Value of production per dunum and per thousand cubic meters of irrigation water delivered for major crops in the Center Jordan Valley, 2003
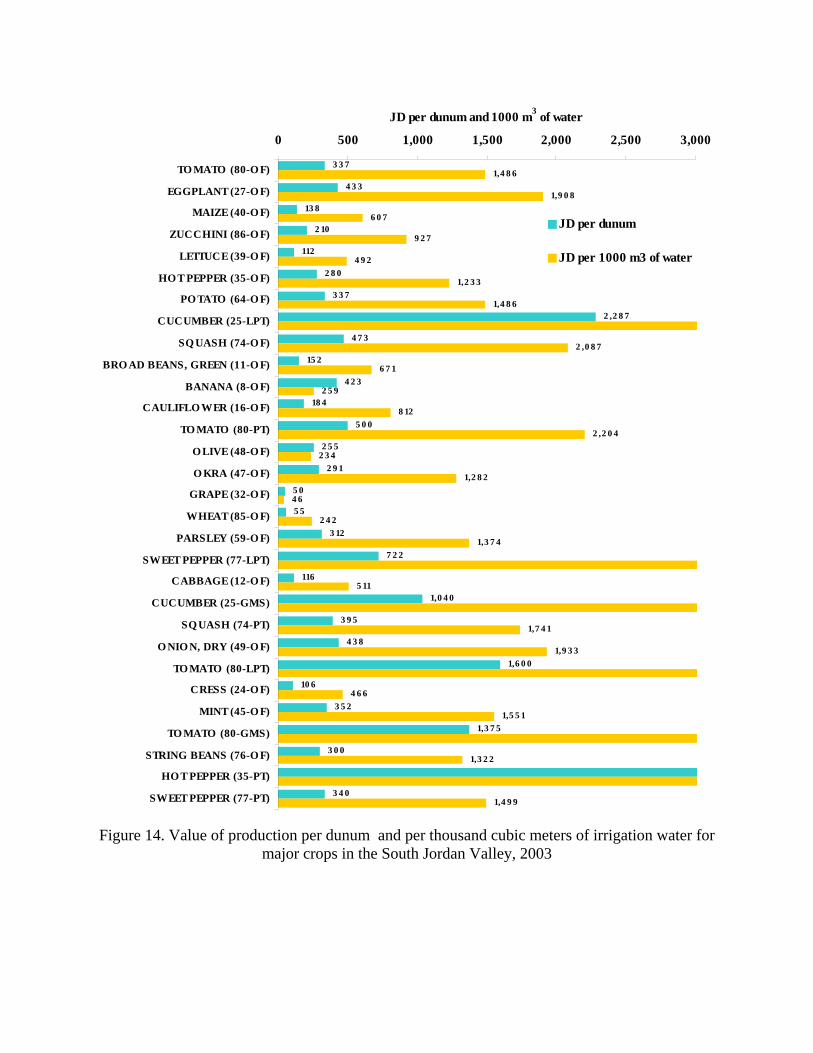
3 3 7
4 3 3
13 8
2 10
112
2 8 0
3 3 7
2 ,2 8 7
4 7 3
15 2
4 2 3
18 4
5 0 0
2 5 5
2 9 1
5 0
5 5
3 12
7 2 2
116
1,0 4 0
3 9 5
4 3 8
1,6 0 0
10 6
3 5 2
1,3 7 5
3 0 0
3 4 0
1,4 8 6
1,9 0 8
6 0 7
9 2 7
4 9 2
1,2 3 3
1,4 8 6
2 ,0 8 7
6 7 1
2 5 9
8 12
2 ,2 0 4
2 3 4
1,2 8 2
4 6
2 4 2
1,3 7 4
5 11
1,7 4 1
1,9 3 3
4 6 6
1,5 5 1
1,3 2 2
1,4 9 9
0 500 1,000 1,500 2,000 2,500 3,000
TO MATO (80-O F)
EGGPLANT (27-O F)
MAIZE (40-O F)
ZUCCHINI (86-O F)
LETTUCE (39-O F)
HO T PEPPER (35-O F)
PO TATO (64-O F)
CUCUMBER (25-LPT)
SQ UASH (74-O F)
BRO AD BEANS, GREEN (11-O F)
BANANA (8-O F)
CAULIFLO WER (16-O F)
TO MATO (80-PT)
O LIVE (48-O F)
O KRA (47-O F)
GRAPE (32-O F)
WHEAT (85-O F)
PARSLEY (59-O F)
SWEET PEPPER (77-LPT)
CABBAGE (12-O F)
CUCUMBER (25-GMS)
SQ UASH (74-PT)
O NIO N, DRY (49-O F)
TO MATO (80-LPT)
CRESS (24-O F)
MINT (45-O F)
TO MATO (80-GMS)
STRING BEANS (76-O F)
HO T PEPPER (35-PT)
SWEET PEPPER (77-PT)
JD per dunum and 1000 m3 of water
JD per dunum
JD per 1000 m3 of water
Figure 14. Value of production per dunum and per thousand cubic meters of irrigation water for
major crops in the South Jordan Valley, 2003
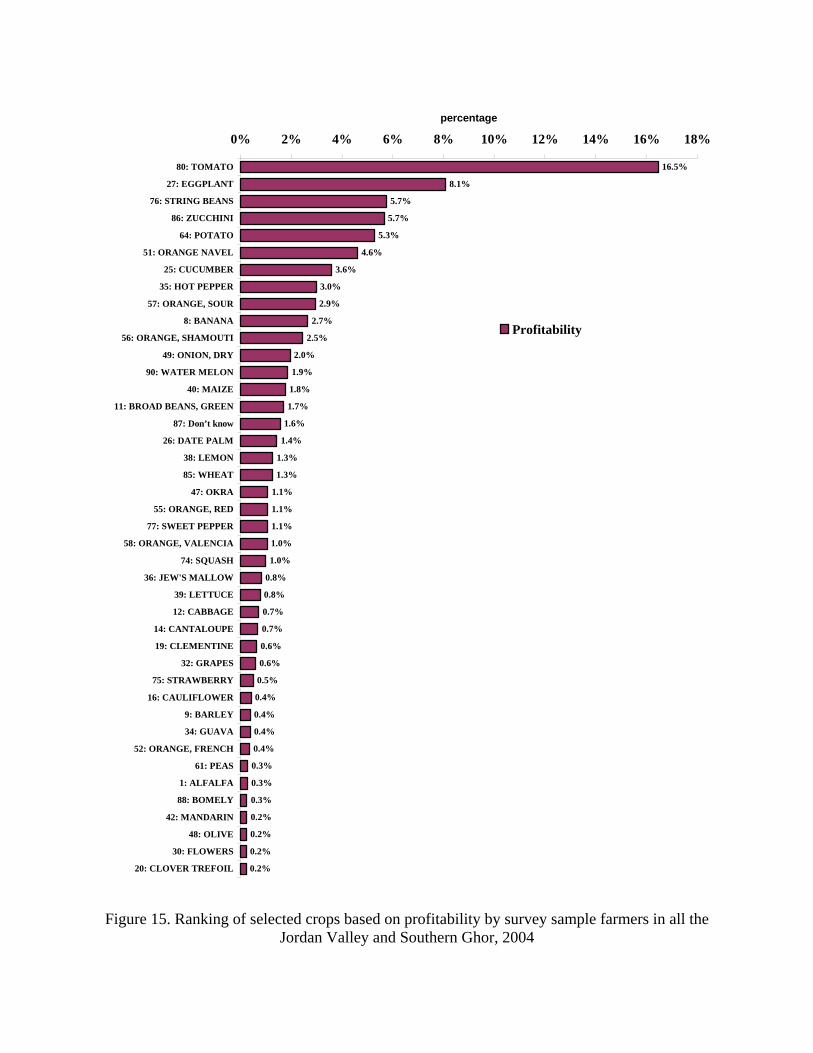
16.5%
8.1%
5.7%
5.7%
5.3%
4.6%
3.6%
3.0%
2.9%
2.7%
2.5%
2.0%
1.9%
1.8%
1.7%
1.6%
1.4%
1.3%
1.3%
1.1%
1.1%
1.1%
1.0%
1.0%
0.8%
0.8%
0.7%
0.7%
0.6%
0.6%
0.5%
0.4%
0.4%
0.4%
0.4%
0.3%
0.3%
0.3%
0.2%
0.2%
0.2%
0.2%
0% 2% 4% 6% 8% 10% 12% 14% 16% 18%
80: TOMATO
27: EGGPLANT
76: STRING BEANS
86: ZUCCHINI
64: POTATO
51: ORANGE NAVEL
25: CUCUMBER
35: HOT PEPPER
57: ORANGE, SOUR
8: BANANA
56: ORANGE, SHAMOUTI
49: ONION, DRY
90: WATER MELON
40: MAIZE
11: BROAD BEANS, GREEN
87: Don’t know
26: DATE PALM
38: LEMON
85: WHEAT
47: OKRA
55: ORANGE, RED
77: SWEET PEPPER
58: ORANGE, VALENCIA
74: SQUASH
36: JEW'S MALLOW
39: LETTUCE
12: CABBAGE
14: CANTALOUPE
19: CLEMENTINE
32: GRAPES
75: STRAWBERRY
16: CAULIFLOWER
9: BARLEY
34: GUAVA
52: ORANGE, FRENCH
61: PEAS
1: ALFALFA
88: BOMELY
42: MANDARIN
48: OLIVE
30: FLOWERS
20: CLOVER TREFOIL
percentage
Profitability
Figure 15. Ranking of selected crops based on profitability by survey sample farmers in all the
Jordan Valley and Southern Ghor, 2004
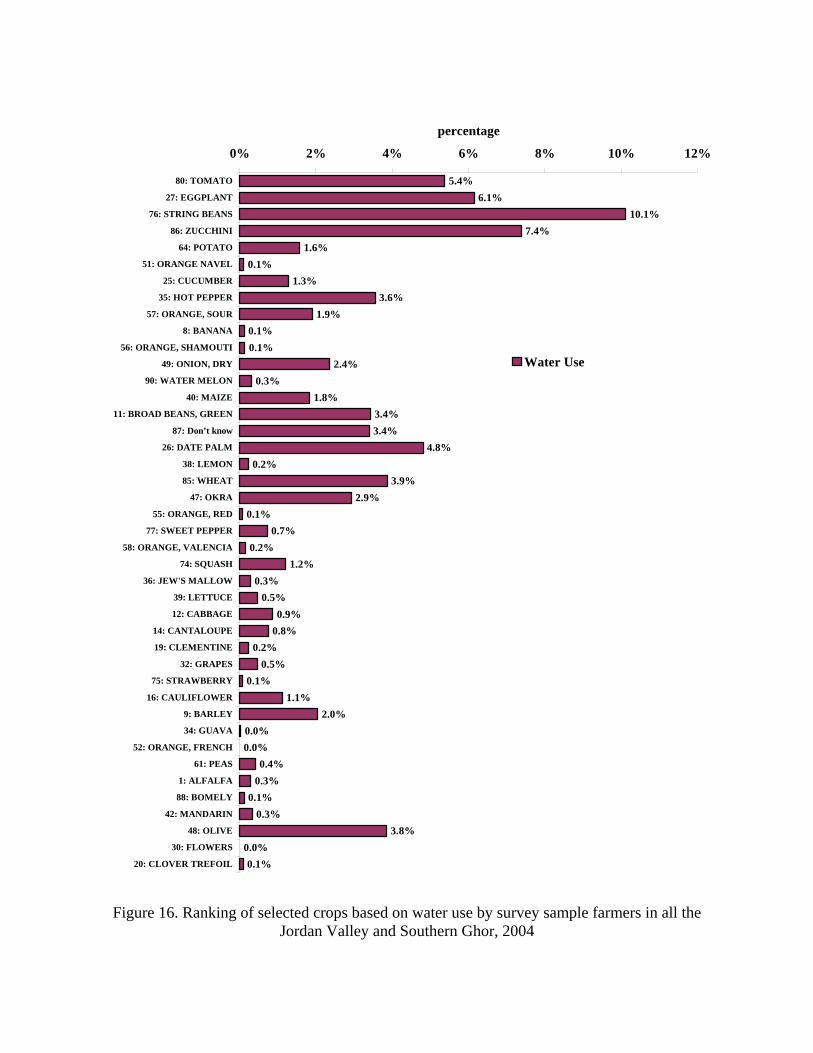
5.4%6.1%
10.1%7.4%
1.6%0.1%
1.3%3.6%
1.9%0.1%0.1%
2.4%0.3%
1.8%3.4%3.4%
4.8%0.2%
3.9%2.9%
0.1%0.7%
0.2%1.2%
0.3%0.5%
0.9%0.8%
0.2%0.5%
0.1%1.1%
2.0%0.0%0.0%
0.4%0.3%
0.1%0.3%
3.8%0.0%0.1%
0% 2% 4% 6% 8% 10% 12%
80: TOMATO
27: EGGPLANT
76: STRING BEANS
86: ZUCCHINI
64: POTATO
51: ORANGE NAVEL
25: CUCUMBER
35: HOT PEPPER
57: ORANGE, SOUR
8: BANANA
56: ORANGE, SHAMOUTI
49: ONION, DRY
90: WATER MELON
40: MAIZE
11: BROAD BEANS, GREEN
87: Don’t know
26: DATE PALM
38: LEMON
85: WHEAT
47: OKRA
55: ORANGE, RED
77: SWEET PEPPER
58: ORANGE, VALENCIA
74: SQUASH
36: JEW'S MALLOW
39: LETTUCE
12: CABBAGE
14: CANTALOUPE
19: CLEMENTINE
32: GRAPES
75: STRAWBERRY
16: CAULIFLOWER
9: BARLEY
34: GUAVA
52: ORANGE, FRENCH
61: PEAS
1: ALFALFA
88: BOMELY
42: MANDARIN
48: OLIVE
30: FLOWERS
20: CLOVER TREFOIL
percentage
Water Use
Figure 16. Ranking of selected crops based on water use by survey sample farmers in all the
Jordan Valley and Southern Ghor, 2004
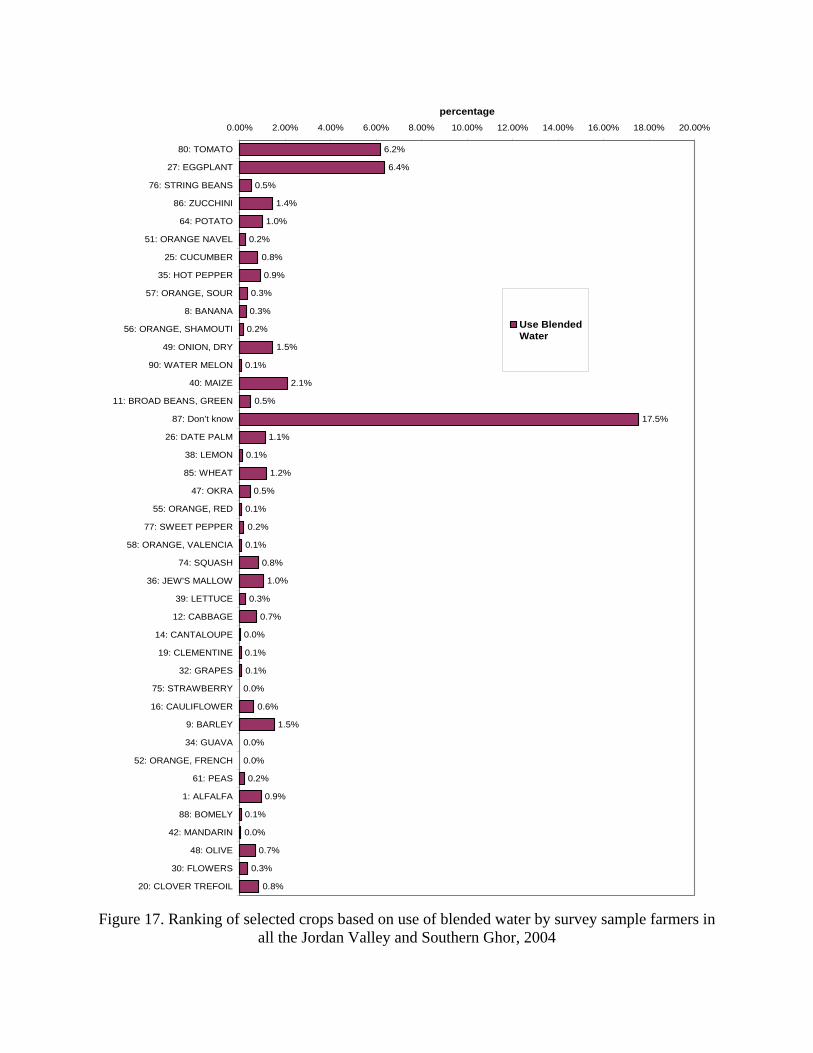
6.2%
6.4%
0.5%
1.4%
1.0%
0.2%
0.8%
0.9%
0.3%
0.3%
0.2%
1.5%
0.1%
2.1%
0.5%
17.5%
1.1%
0.1%
1.2%
0.5%
0.1%
0.2%
0.1%
0.8%
1.0%
0.3%
0.7%
0.0%
0.1%
0.1%
0.0%
0.6%
1.5%
0.0%
0.0%
0.2%
0.9%
0.1%
0.0%
0.7%
0.3%
0.8%
0.00% 2.00% 4.00% 6.00% 8.00% 10.00% 12.00% 14.00% 16.00% 18.00% 20.00%
80: TOMATO
27: EGGPLANT
76: STRING BEANS
86: ZUCCHINI
64: POTATO
51: ORANGE NAVEL
25: CUCUMBER
35: HOT PEPPER
57: ORANGE, SOUR
8: BANANA
56: ORANGE, SHAMOUTI
49: ONION, DRY
90: WATER MELON
40: MAIZE
11: BROAD BEANS, GREEN
87: Don’t know
26: DATE PALM
38: LEMON
85: WHEAT
47: OKRA
55: ORANGE, RED
77: SWEET PEPPER
58: ORANGE, VALENCIA
74: SQUASH
36: JEW'S MALLOW
39: LETTUCE
12: CABBAGE
14: CANTALOUPE
19: CLEMENTINE
32: GRAPES
75: STRAWBERRY
16: CAULIFLOWER
9: BARLEY
34: GUAVA
52: ORANGE, FRENCH
61: PEAS
1: ALFALFA
88: BOMELY
42: MANDARIN
48: OLIVE
30: FLOWERS
20: CLOVER TREFOIL
percentage
Use BlendedWater
Figure 17. Ranking of selected crops based on use of blended water by survey sample farmers in
all the Jordan Valley and Southern Ghor, 2004
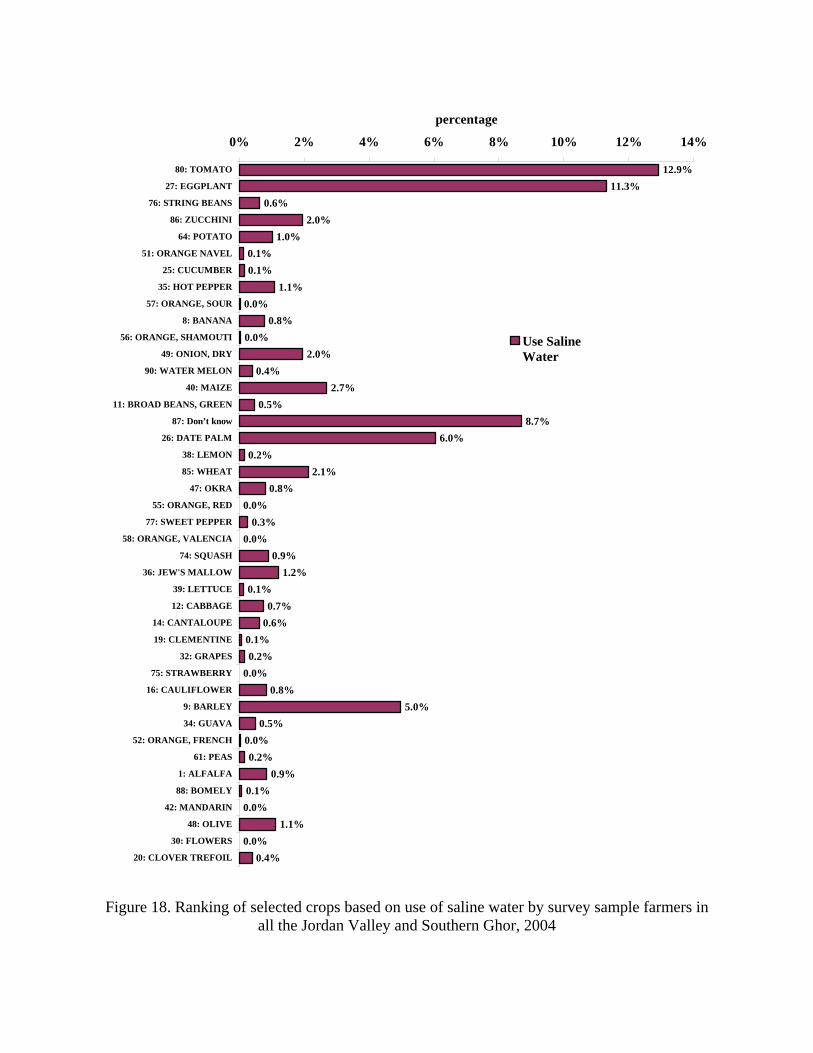
12.9%11.3%
0.6%2.0%
1.0%0.1%0.1%
1.1%0.0%
0.8%0.0%
2.0%0.4%
2.7%0.5%
8.7%6.0%
0.2%2.1%
0.8%0.0%
0.3%0.0%
0.9%1.2%
0.1%0.7%
0.6%0.1%0.2%
0.0%0.8%
5.0%0.5%
0.0%0.2%
0.9%0.1%
0.0%1.1%
0.0%0.4%
0% 2% 4% 6% 8% 10% 12% 14%
80: TOMATO
27: EGGPLANT
76: STRING BEANS
86: ZUCCHINI
64: POTATO
51: ORANGE NAVEL
25: CUCUMBER
35: HOT PEPPER
57: ORANGE, SOUR
8: BANANA
56: ORANGE, SHAMOUTI
49: ONION, DRY
90: WATER MELON
40: MAIZE
11: BROAD BEANS, GREEN
87: Don’t know
26: DATE PALM
38: LEMON
85: WHEAT
47: OKRA
55: ORANGE, RED
77: SWEET PEPPER
58: ORANGE, VALENCIA
74: SQUASH
36: JEW'S MALLOW
39: LETTUCE
12: CABBAGE
14: CANTALOUPE
19: CLEMENTINE
32: GRAPES
75: STRAWBERRY
16: CAULIFLOWER
9: BARLEY
34: GUAVA
52: ORANGE, FRENCH
61: PEAS
1: ALFALFA
88: BOMELY
42: MANDARIN
48: OLIVE
30: FLOWERS
20: CLOVER TREFOIL
percentage
Use SalineWater
Figure 18. Ranking of selected crops based on use of saline water by survey sample farmers in
all the Jordan Valley and Southern Ghor, 2004
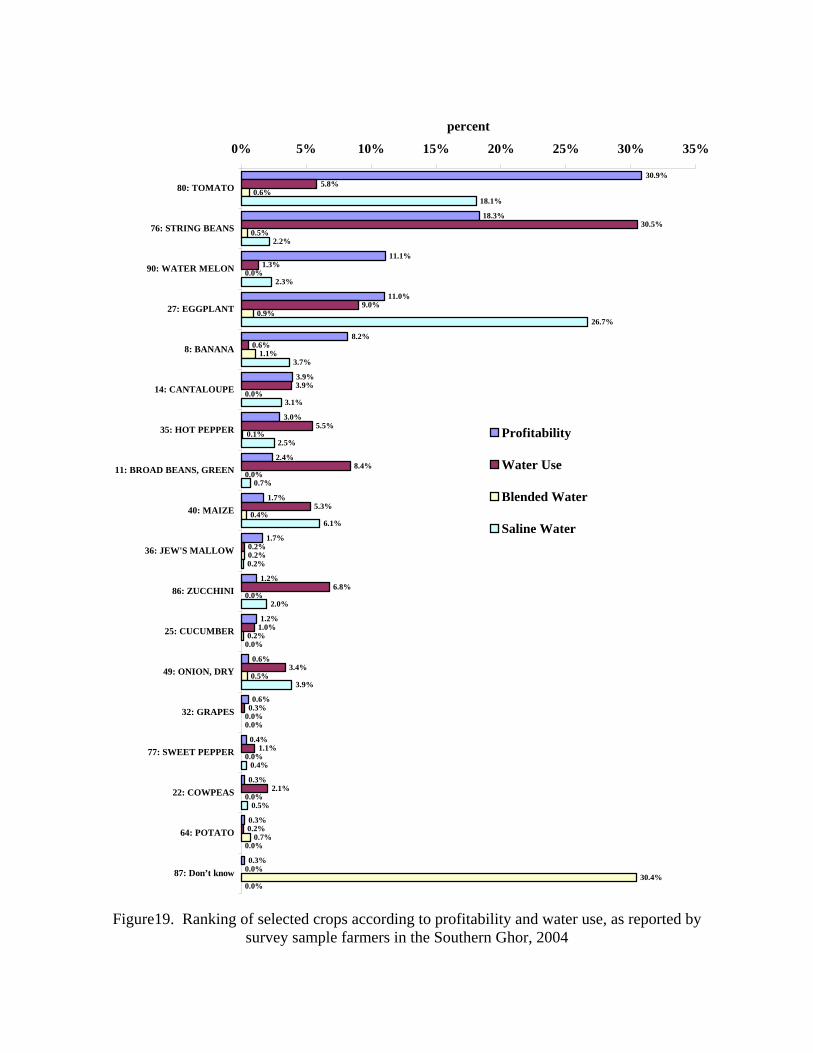
30.9%
18.3%
11.1%
11.0%
8.2%
3.9%
3.0%
2.4%
1.7%
1.7%
1.2%
1.2%
0.6%
0.6%
0.4%
0.3%
0.3%
0.3%
5.8%
30.5%
1.3%
9.0%
0.6%
3.9%
5.5%
8.4%
5.3%
0.2%
6.8%
1.0%
3.4%
0.3%
1.1%
2.1%
0.2%
0.0%
0.6%
0.5%
0.0%
0.9%
1.1%
0.0%
0.1%
0.0%
0.4%
0.2%
0.0%
0.2%
0.5%
0.0%
0.0%
0.0%
0.7%
30.4%
18.1%
2.2%
2.3%
26.7%
3.7%
3.1%
2.5%
0.7%
6.1%
0.2%
2.0%
0.0%
3.9%
0.0%
0.4%
0.5%
0.0%
0.0%
0% 5% 10% 15% 20% 25% 30% 35%
80: TOMATO
76: STRING BEANS
90: WATER MELON
27: EGGPLANT
8: BANANA
14: CANTALOUPE
35: HOT PEPPER
11: BROAD BEANS, GREEN
40: MAIZE
36: JEW'S MALLOW
86: ZUCCHINI
25: CUCUMBER
49: ONION, DRY
32: GRAPES
77: SWEET PEPPER
22: COWPEAS
64: POTATO
87: Don’t know
percent
Profitability
Water Use
Blended Water
Saline Water
Figure19. Ranking of selected crops according to profitability and water use, as reported by
survey sample farmers in the Southern Ghor, 2004
Appendix III Demonstrations of Appropriate Crops Site Selection and Farmer Contracts

Appendix IV KAFA’A
Assessment of Jordanian Marketing System for Fresh Fruits and Vegetables
JVA Comments on the “Baseline Assessment, On-Farm Water Management, Crop Production and Marketing” report 1. A clarification is needed on the basis used for calculating the Efficiency of
irrigation water use, which was higher for vegetables than for citrus and banana. 2. Random samples for one year were used to calculate the return of one dunum of
vegetables, citrus and banana. i. From our experience, the return for one dunum and one cubic meter of water used
for vegetables in the Middle JV is not representative. ii. It would have been more representative to compare between the return from
vegetable, citrus and banana in each geographical zone, for example planting early vegetables in plastic houses in the middle & south JV is more feasible than in the north, which explains the high intensity of plastic houses in the middle JV.
3. It was mentioned that the water consumption by each crop and each farm unit was
not available, while this information is available from the WMIS system at JVA. 4. It was mentioned that citrus trees receive about two thirds (65 percent) of the
water supplied by JVA in the Jordan Valley but generate less than one third (31 percent) of the value of production; vegetables on the other hand use 22 percent of the irrigation water but generate 62 percent of the gross value of production.
JVA records show that water used by citrus for the previous three past was 28.4%, while it was 69.4% for vegetables and 2.2% for banana. The basis of calculating the return should be clarified.
5. It was mentioned that the water use efficiency in the North JV is lower than in the
Middle and South, while JVA records show the opposite. 6. It was mentioned that many farms in the Middle and South JV are left un-
cultivated due to the lack of irrigation water. This is true in drought seasons when the available supply can’t meet the demand, but in the last two years there was no problem of providing farmers with water in the Middle and South JV.
7. The crop water requirements for citrus, banana and vegetables were mentioned
without defining the basis of calculating these requirements. The figures used in the report contradicts with the studies used to define these requirements in the JVA Instructions for Irrigation Water Use.
8. The report mentioned that the price of irrigation water is 10 fils / m3 , while it
depends upon the monthly consumed quantities and the cultivated area. 9. The report mentioned that the readings of the working water meters is not
considered, while these readings are taken monthly and considered the basis for calculating the farm units water consumption used for financial accounting.
10. The source of information is not always mentioned.