Embed Size (px)
Citation preview
Kai + zen(Change for the better)
1
Kaizen
© 2009 RLM & Associates LLC 04/19/23
Kaizen Defined
2
• Continuous, incremental improvement of an activity to create more value with less waste. A process of continually making incremental, ongoing changes and not as a single, separate event.
© 2009 RLM & Associates LLC04/19/23
Kaizen
• Small-scale improvements are easier and faster.
• The risks are lower because they generally have limited effect.
• The accumulated effect is often greater than a single large improvement
3© 2009 RLM & Associates LLC04/19/23
Change Management• The Lean journey is paved by kaizen events• Lean concepts are simple -- sustaining is hard• Lean as a business strategy and supported by
top mgt.
4© 2009 RLM & Associates LLC04/19/23
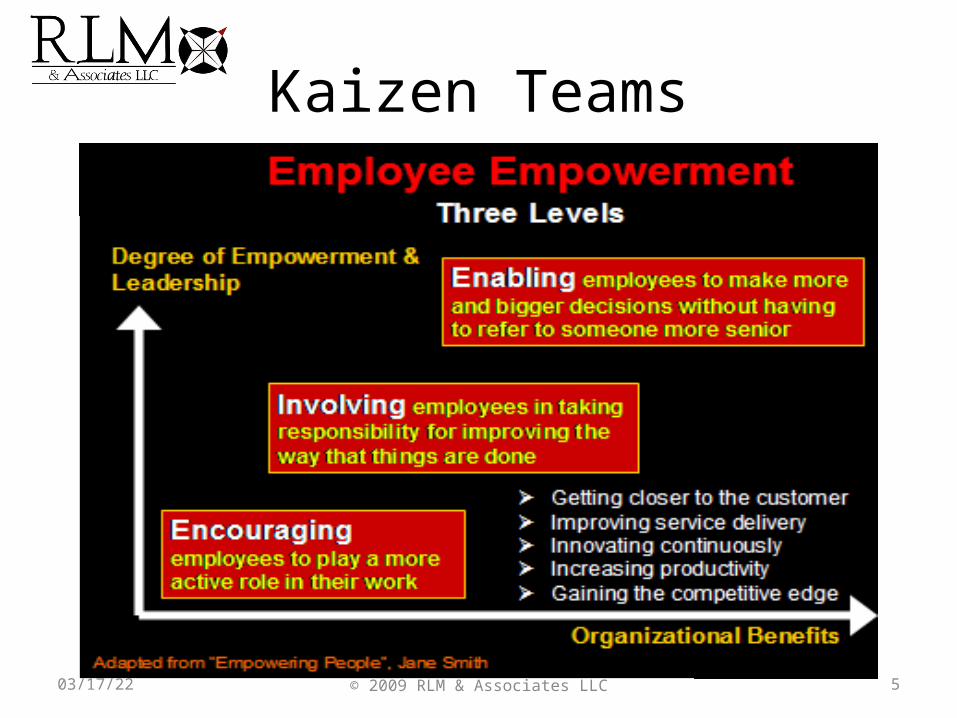
Kaizen Teams
5© 2009 RLM & Associates LLC04/19/23
Kaizen Teams
• Daily work teams– Multi-skilled, cross-trained team working in a cell– TPM team (mgt, engr, maint., operators)– Do not disband
• Kaizen team – Multi-skilled, cross-trained and cross-functional– Led by a facilitator– Trained in problem solving, conflict resolution, etc
6© 2009 RLM & Associates LLC04/19/23
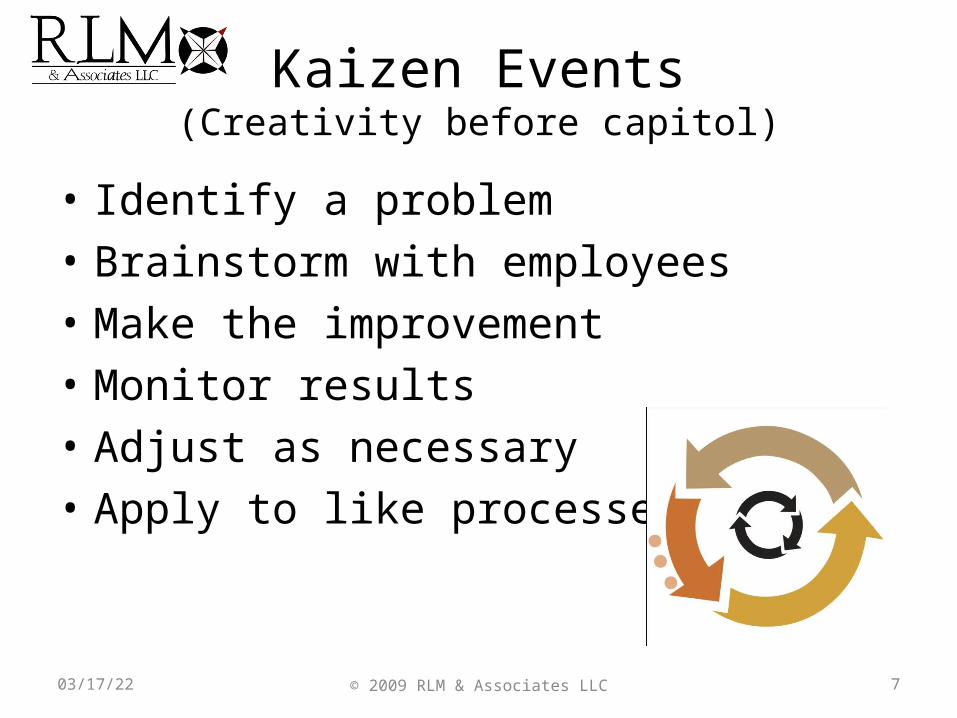
Kaizen Events(Creativity before capitol)
• Identify a problem• Brainstorm with employees• Make the improvement• Monitor results• Adjust as necessary• Apply to like processes
7© 2009 RLM & Associates LLC04/19/23
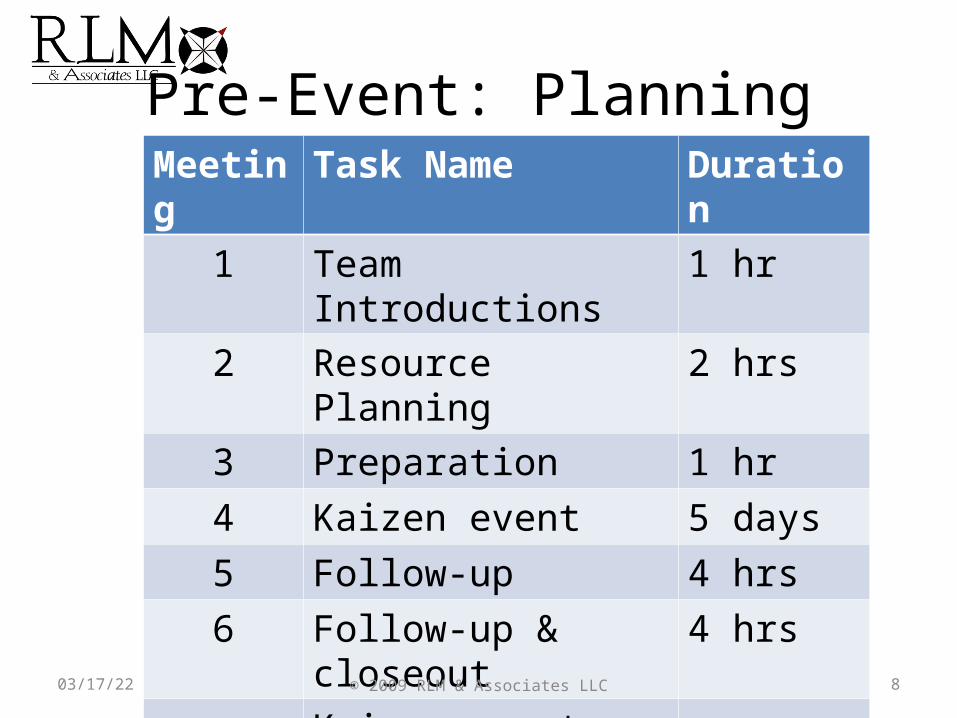
Pre-Event: PlanningMeeting Task Name Duration
1 Team Introductions 1 hr
2 Resource Planning 2 hrs
3 Preparation 1 hr4 Kaizen event 5 days5 Follow-up 4 hrs6 Follow-up & closeout 4 hrs
Kaizen event completed 8© 2009 RLM & Associates LLC04/19/23
Pre-Event: People
• Project Leader• Lean Champion• Team Members
9© 2009 RLM & Associates LLC04/19/23
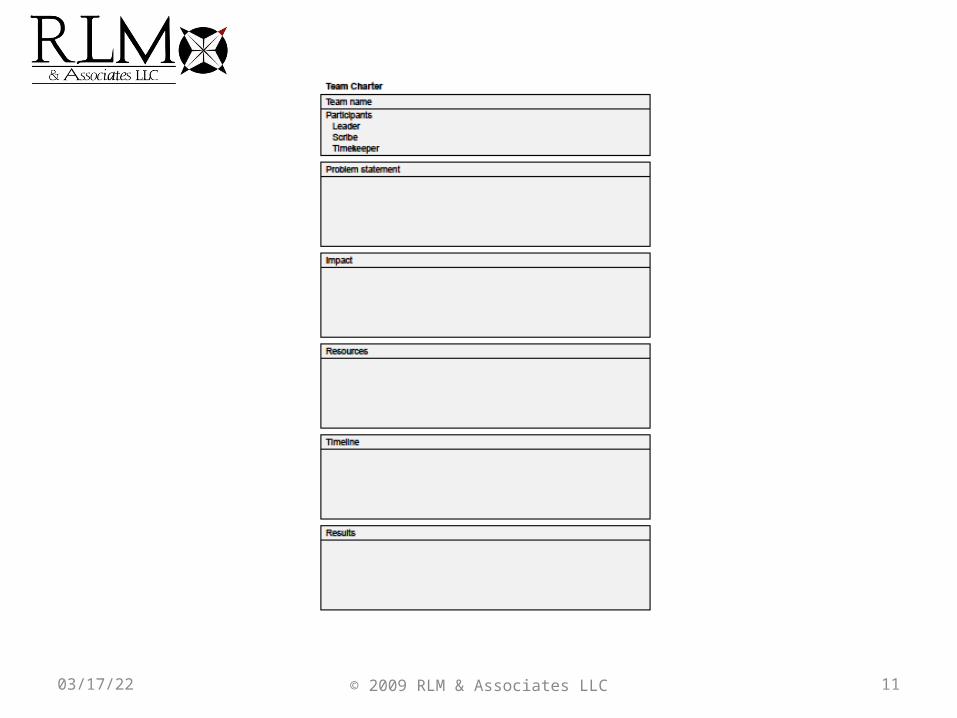
Day 1• Team Introductions• Project Scope• Overview with goals• Team Charter• Determine current state map• Brainstorm ideas for future state map• Set up plant walk-through
10© 2009 RLM & Associates LLC04/19/23
11© 2009 RLM & Associates LLC04/19/23
Day 2
• Communicate, Communicate!• Select Metrics• Select method for improvement• Build team consensus and select actual tasks• Organize tasks
– A Tasks - the team can do without permission– B Tasks - requiring help from maint., IT, accounting– C Tasks - requiring management approval
12© 2009 RLM & Associates LLC04/19/23
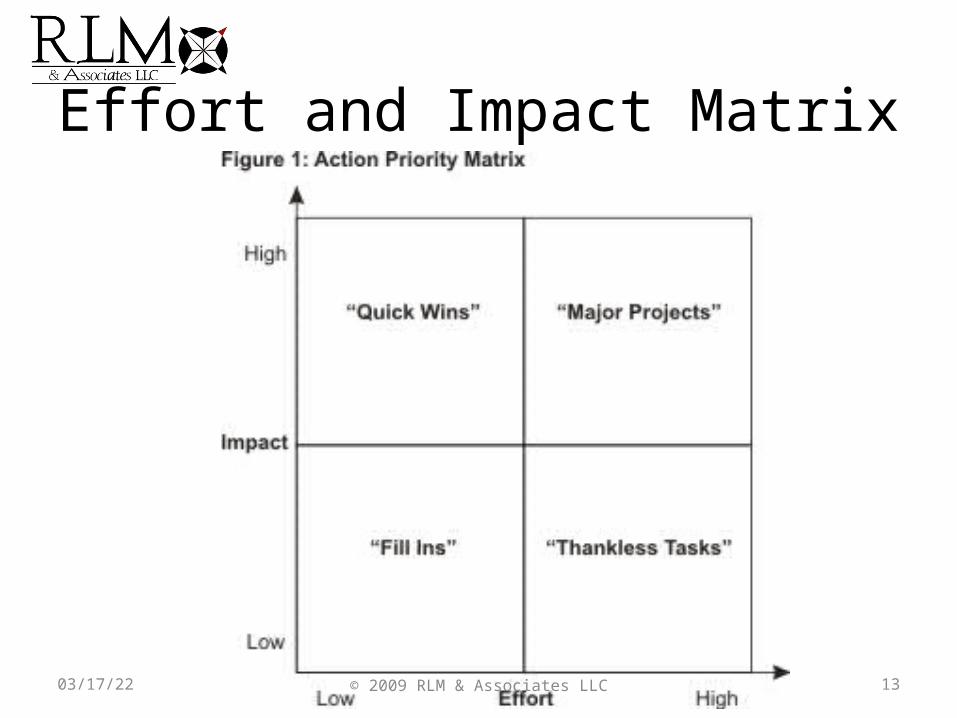
Effort and Impact Matrix
13© 2009 RLM & Associates LLC04/19/23
Day 3
• Identify items or material you need• Discuss possible obstacles to implementation• Communicate with target area people• Start implementation of ideas
14© 2009 RLM & Associates LLC04/19/23
Day 4
• Continue with improvement implementation• Work in teams of at least two• Identify action items to address in order to
complete kaizen event effort
15© 2009 RLM & Associates LLC04/19/23
Day 5
• Complete the Kaizen event• Develop a 30-day action item follow-up list• Document improvements• Calculate savings
16© 2009 RLM & Associates LLC04/19/23
Closeout and Presentation• Create a short presentation to management
and people in the area.• Everyone participate• Have accounting present the cost savings
17© 2009 RLM & Associates LLC04/19/23
Follow-up
• Ensure that all assigned tasks have been completed (infrastructure)
• Help build the habits and discipline of lean and reinforces the concepts.
18© 2009 RLM & Associates LLC04/19/23
Project Closeout
• Captures the total qualitative, quantitative, and financial improvements
• Collect lessons learned• Update your VSM• Have official celebration to reward and
recognize the team’s efforts
19© 2009 RLM & Associates LLC04/19/23
Points to Consider for Implementing JIT and Changing Layouts
1. Study the process thoroughly first2. Don’t under estimate the cost of changes3. Know your people capabilities because of additional duties4. Training is Vital5. Identify Goals and Objectives6. Be creative7. Don’t be afraid to make mistakes8. Involve everyone concerned9. Educate your people about the goals and objectives10.Keep it as simple as possible11.Stress flexibility of tools and equipment12.Keep areas open, avoiding walls and barriers
04/19/23 © 2009 RLM & Associates LLC 20
Order to Produce
21
Kanban
© 2009 RLM & Associates LLC 04/19/23
Kanban• Agenda
– Introduction– Kanban video– Benefits– Push vs. Pull systems– Kanban process– Visual factory– Tiny Tag factory activity
22© 2009 RLM & Associates LLC04/19/23
Introduction to Kanban• Kanban
– A signal to indicate when more parts are needed– Card, empty bin, In-process Kanban on plant floor
• Kanban System - a pull system that uses color-coded cards attached to parts or part containers to regulate the upstream production and delivery flow.
23© 2009 RLM & Associates LLC04/19/23
Kanban Video
24© 2009 RLM & Associates LLC04/19/23
Takt Time
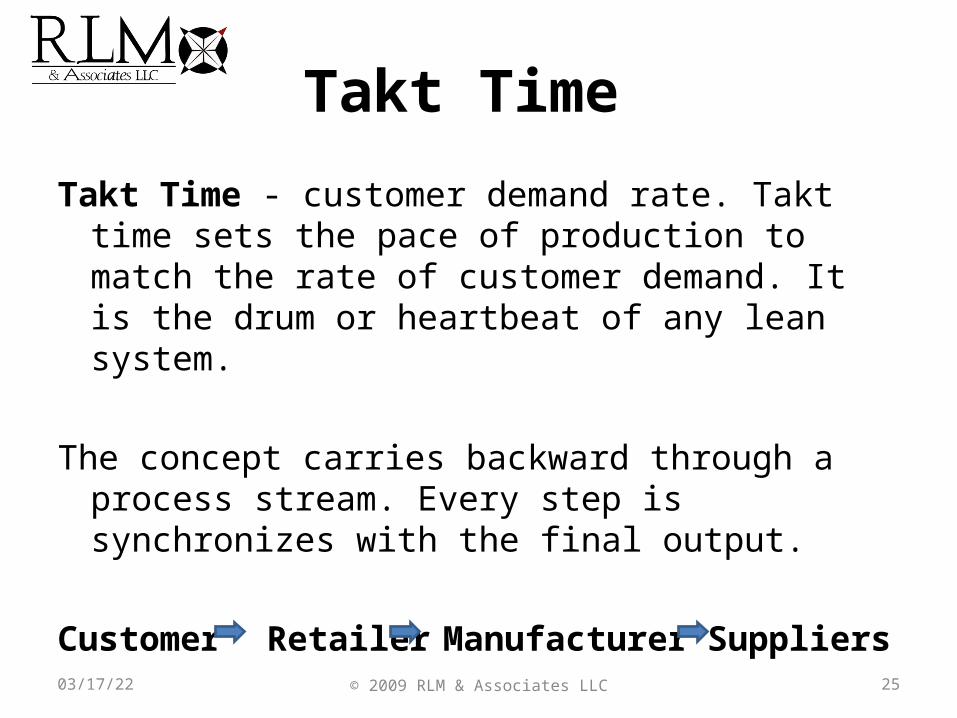
Takt Time - customer demand rate. Takt time sets the pace of production to match the rate of customer demand. It is the drum or heartbeat of any lean system.
The concept carries backward through a process stream. Every step is synchronizes with the final output.
Customer Retailer Manufacturer Suppliers
25© 2009 RLM & Associates LLC04/19/23
© 2009 RLM & Associates LLC 26
Leveling Manpower
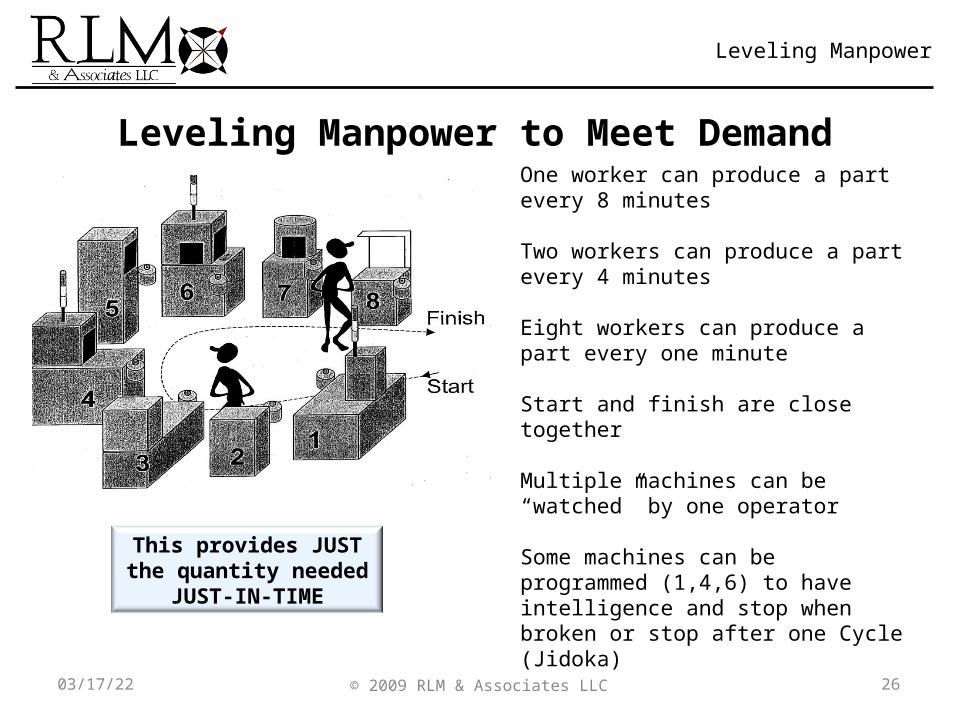
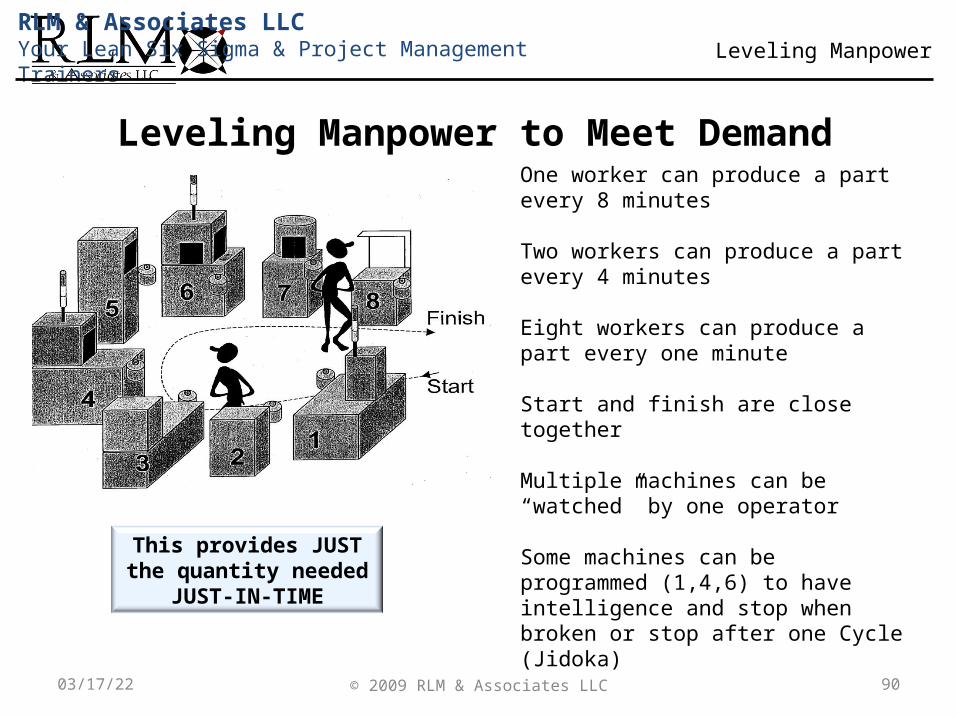
Leveling Manpower to Meet DemandOne worker can produce a part every 8 minutes
Two workers can produce a part every 4 minutes
Eight workers can produce a part every one minute
Start and finish are close together
Multiple machines can be “watched” by one operator
Some machines can be programmed (1,4,6) to have intelligence and stop when broken or stop after one Cycle (Jidoka)
This provides JUST the quantity needed
JUST-IN-TIME
04/19/23
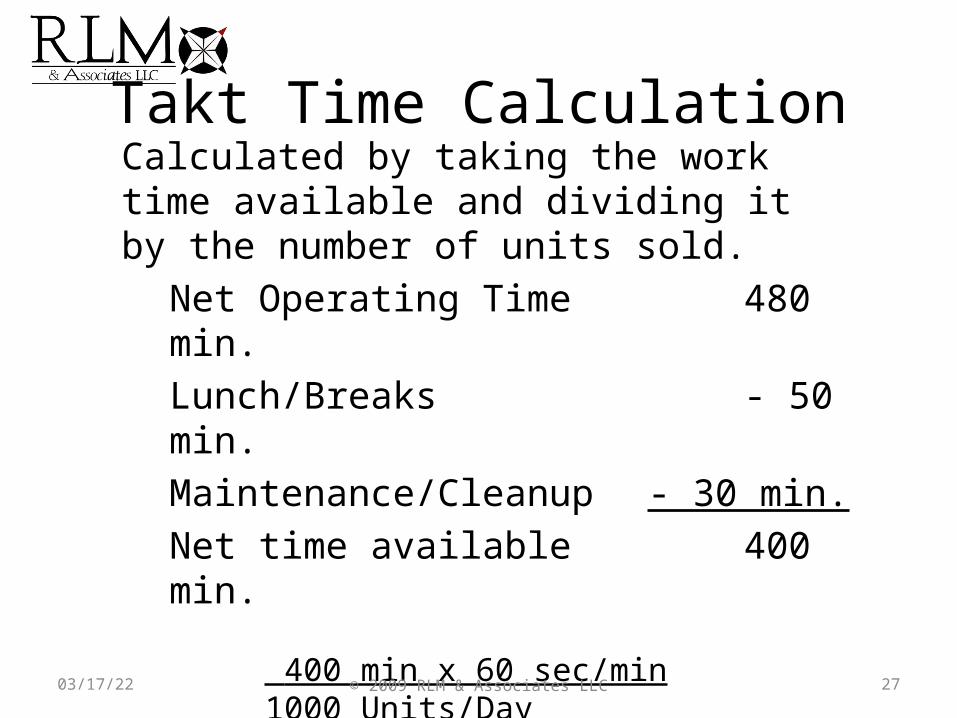
Calculated by taking the work time available and dividing it by the number of units sold.
Net Operating Time 480 min.Lunch/Breaks - 50 min.Maintenance/Cleanup - 30 min.Net time available 400 min.
400 min x 60 sec/min1000 Units/Day
Takt Time = 24 Sec./Unit
Takt Time Calculation
27© 2009 RLM & Associates LLC04/19/23
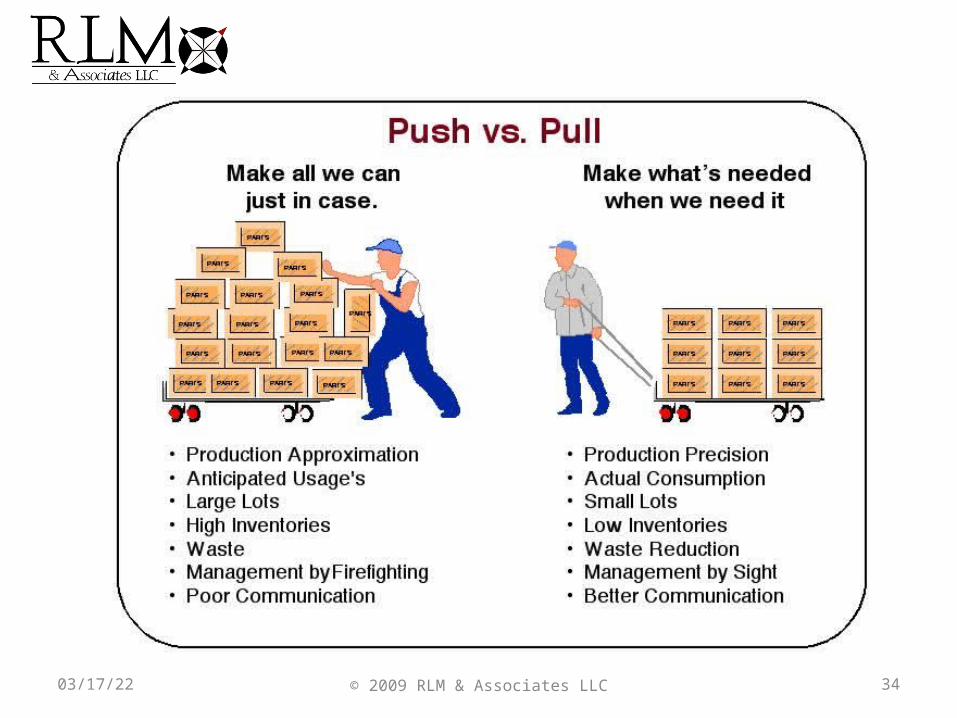
Pull versus Push Production Strategy
28© 2009 RLM & Associates LLC04/19/23
Push System
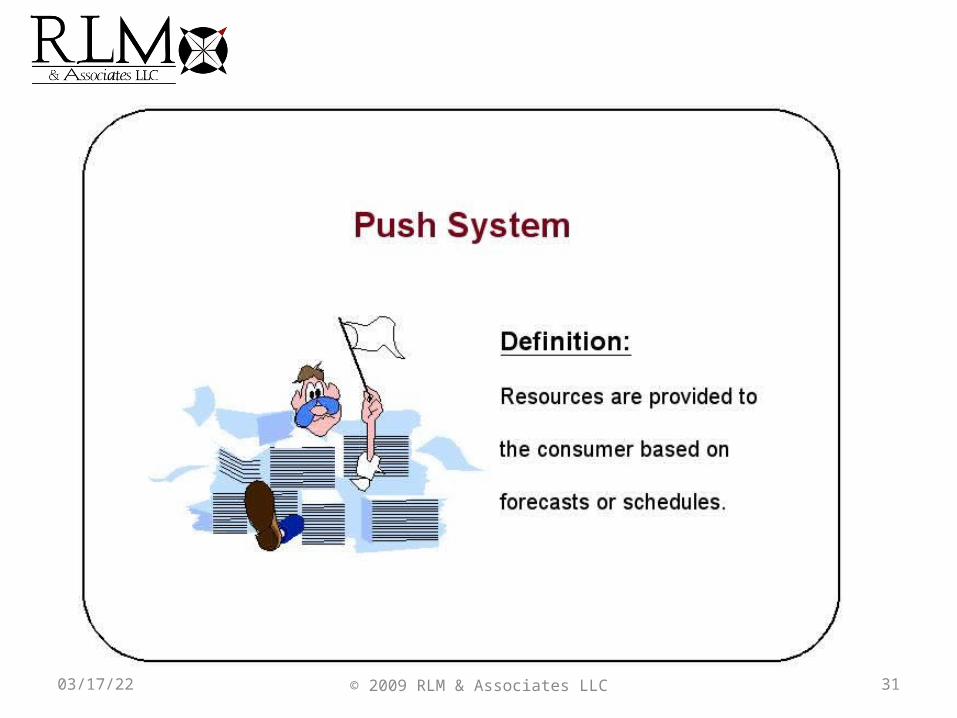
Push System – Products are provided to the consumer based on forecasts or schedules.
• Build product to forecast • Create excess inventory
Extra Inventory costsExtra floor spaceExpired productDamaged product
29© 2009 RLM & Associates LLC04/19/23
© 2009 RLM & Associates LLC 30
Large Lot Size
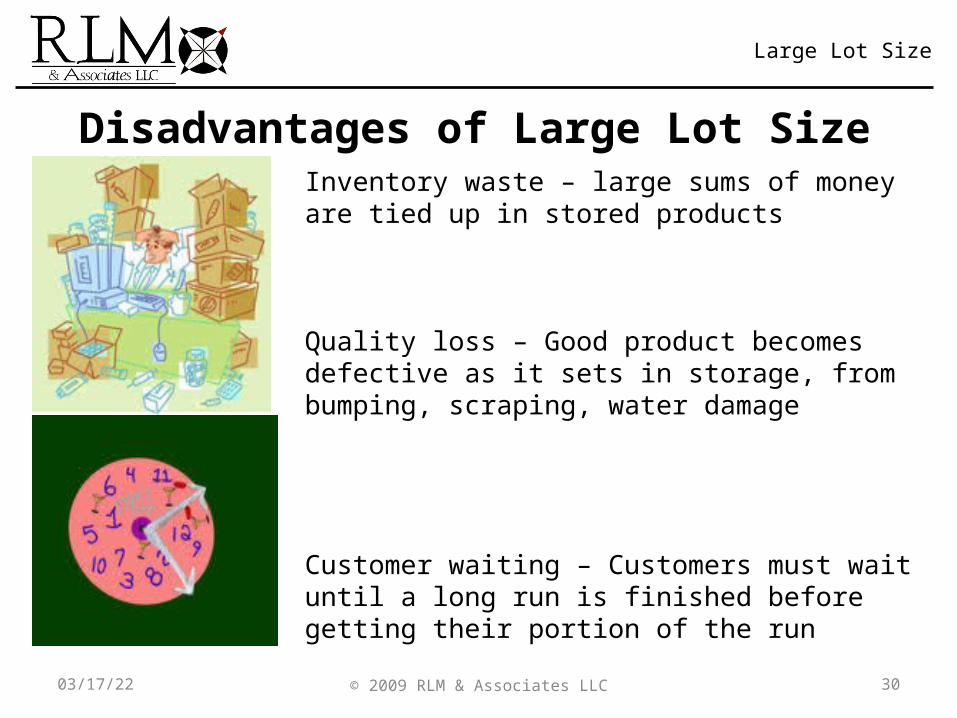
Disadvantages of Large Lot SizeInventory waste – large sums of money are tied up in stored products
Quality loss – Good product becomes defective as it sets in storage, from bumping, scraping, water damage
Customer waiting – Customers must wait until a long run is finished before getting their portion of the run
04/19/23
31© 2009 RLM & Associates LLC04/19/23
Push System
32© 2009 RLM & Associates LLC04/19/23
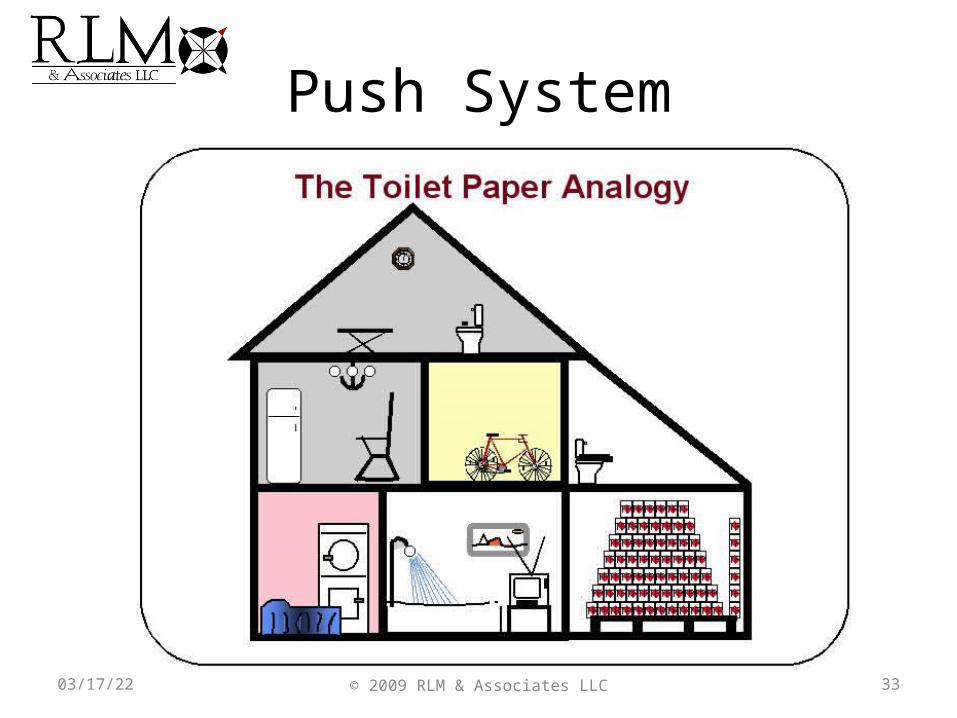
Push System
33© 2009 RLM & Associates LLC04/19/23
34© 2009 RLM & Associates LLC04/19/23
35© 2009 RLM & Associates LLC04/19/23
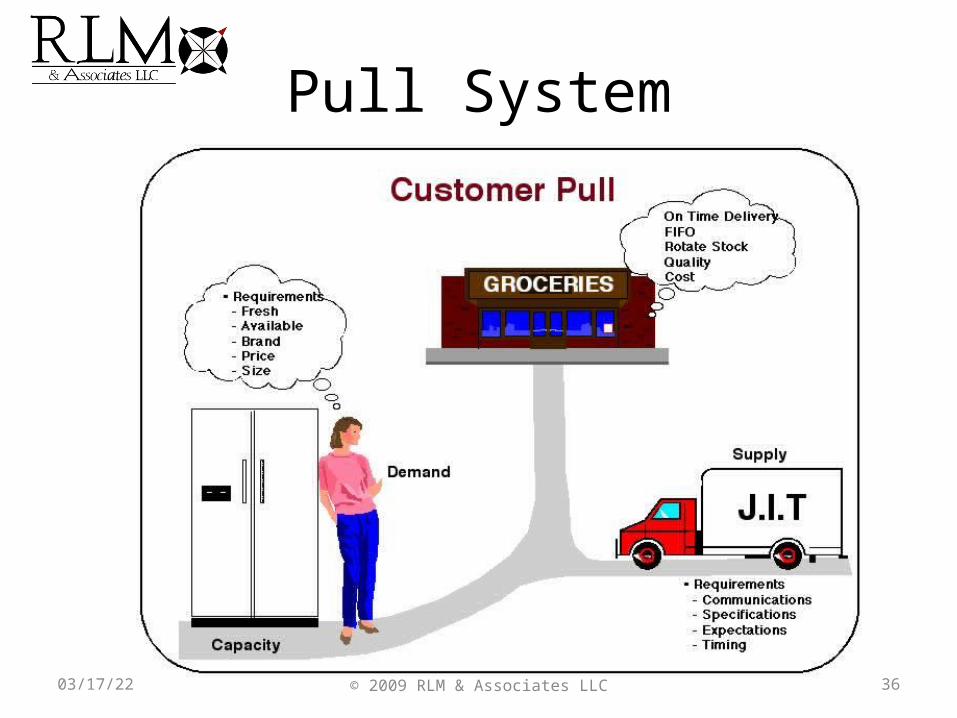
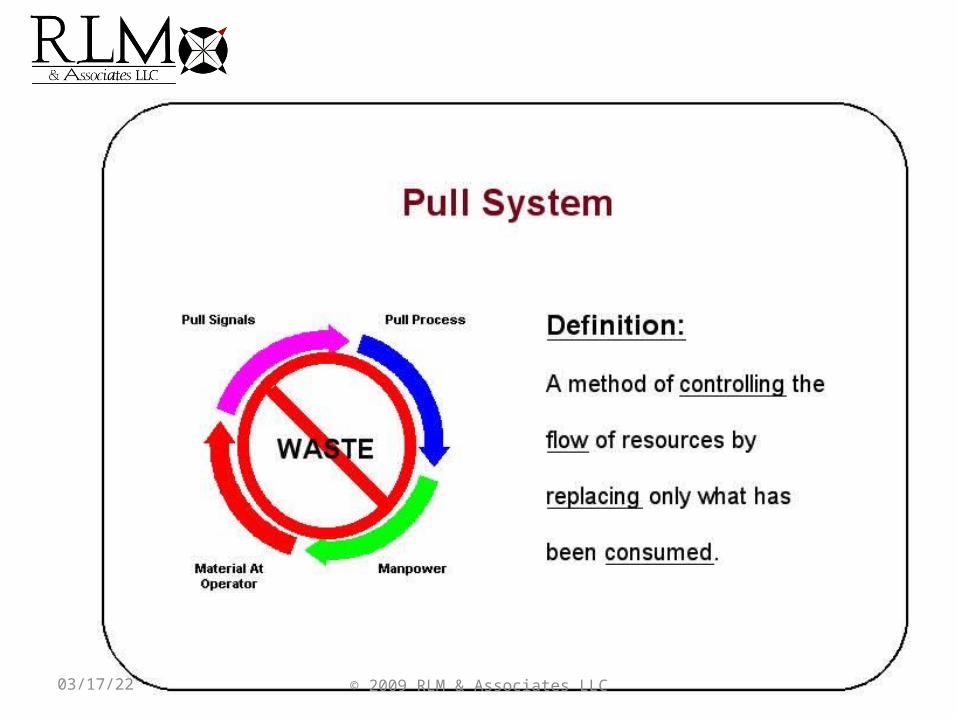
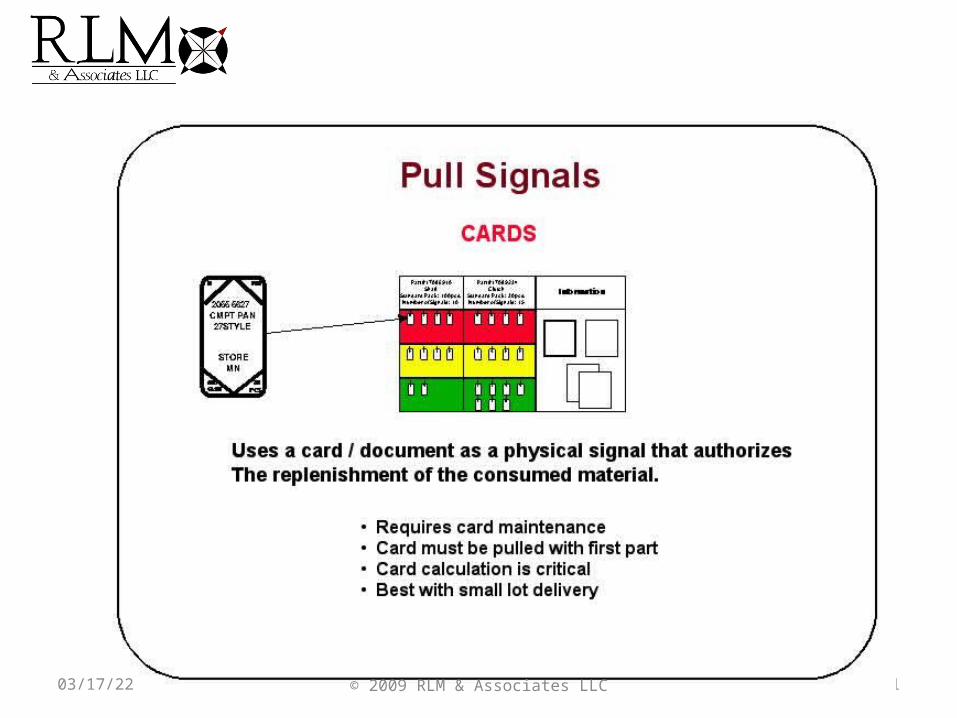
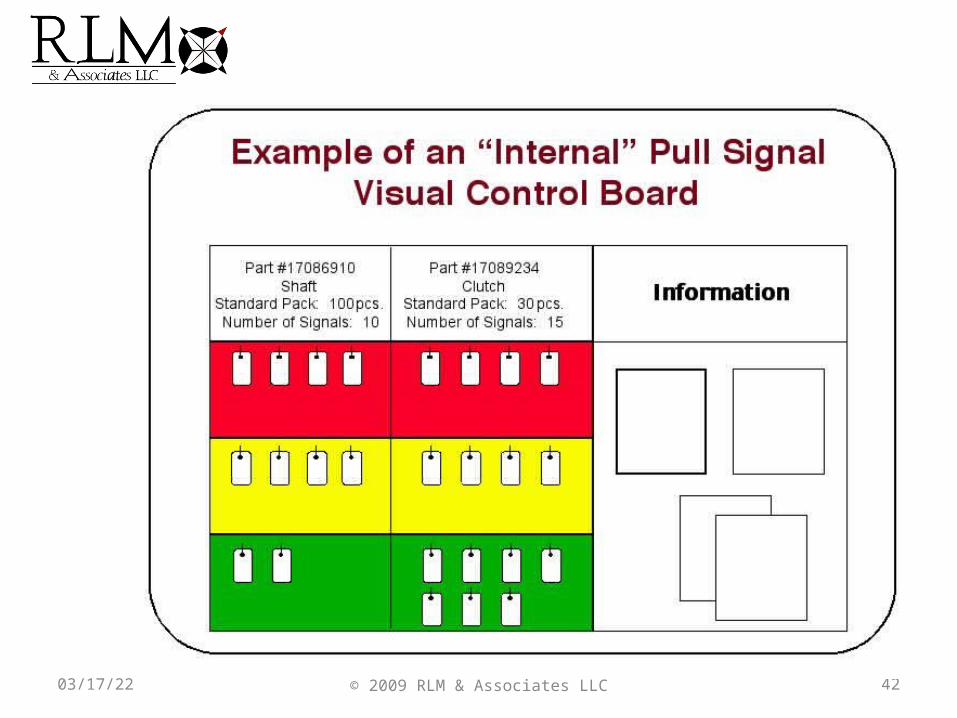
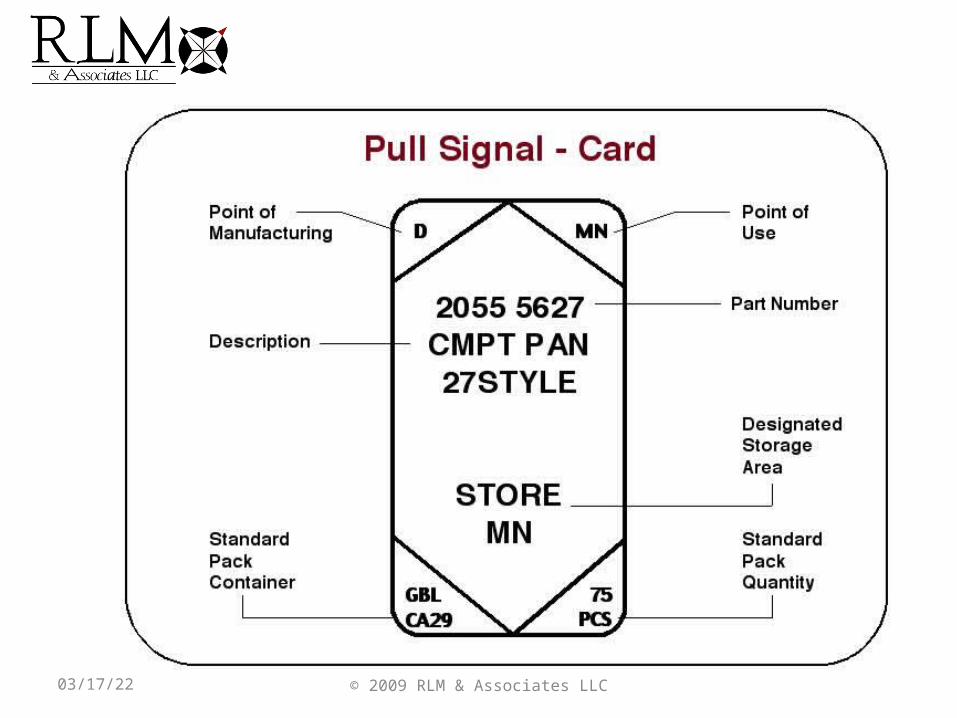
Pull System
36© 2009 RLM & Associates LLC04/19/23
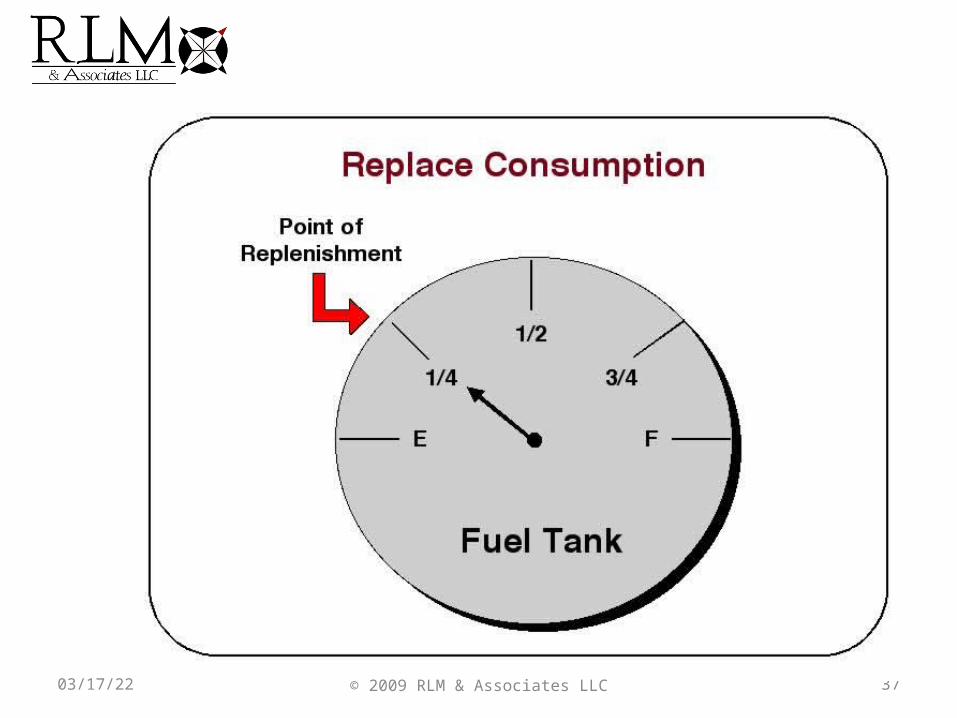
37© 2009 RLM & Associates LLC04/19/23
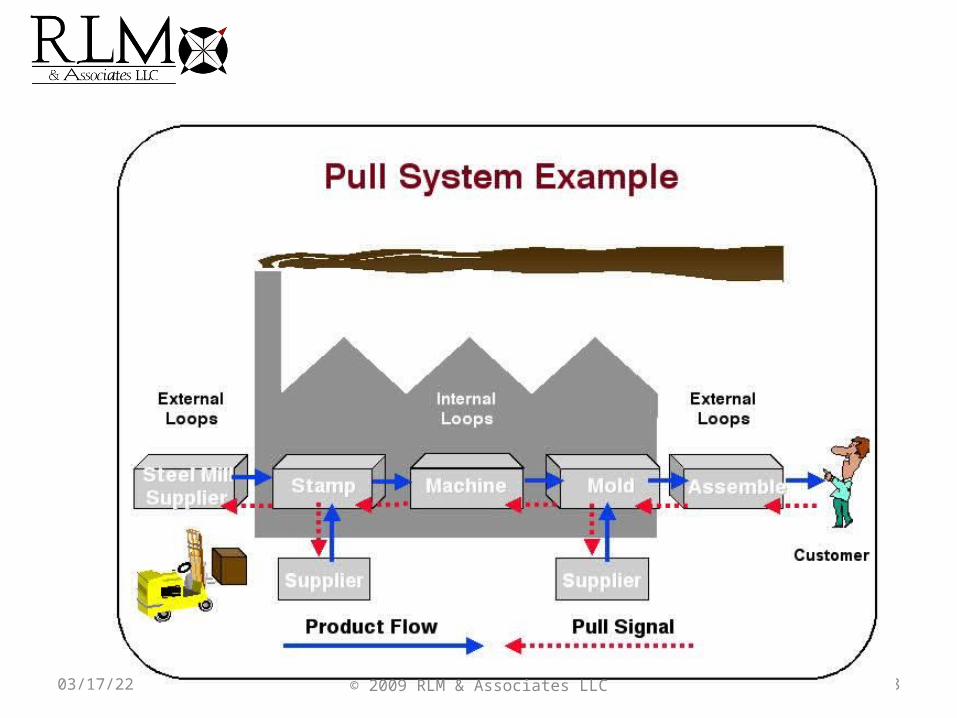
38© 2009 RLM & Associates LLC04/19/23
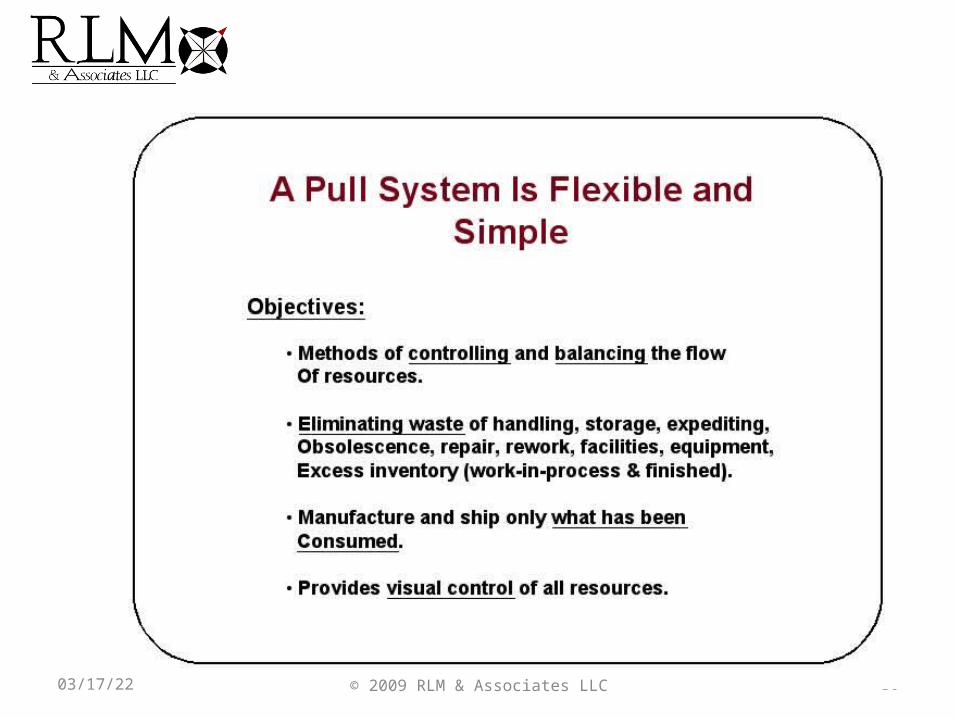
39© 2009 RLM & Associates LLC04/19/23
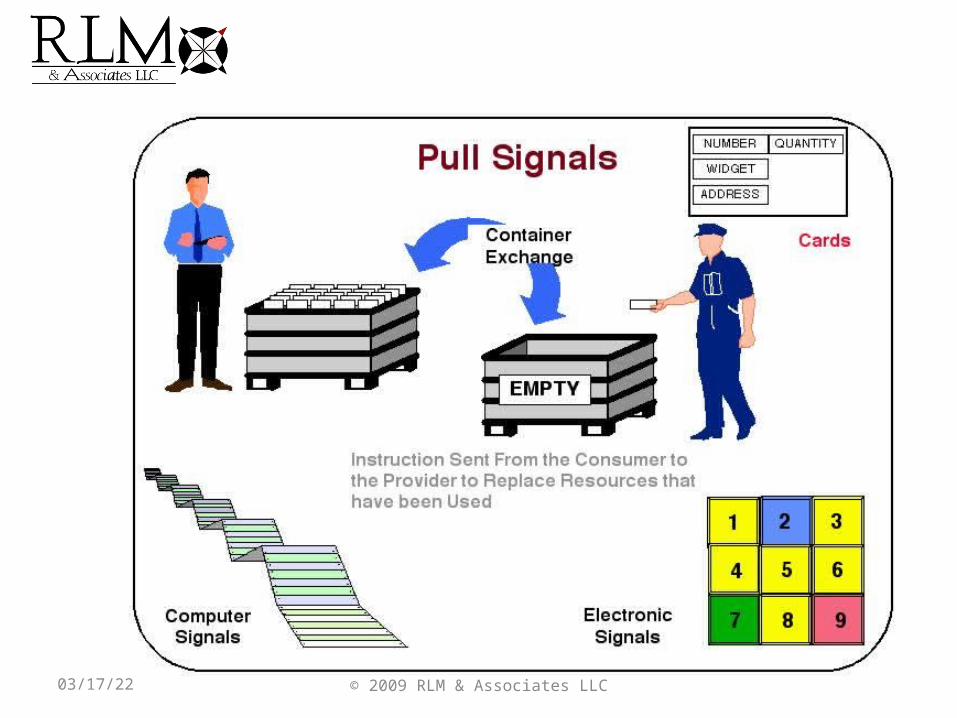
40© 2009 RLM & Associates LLC04/19/23
41© 2009 RLM & Associates LLC04/19/23
42© 2009 RLM & Associates LLC04/19/23
43© 2009 RLM & Associates LLC04/19/23
04/19/23 © 2009 RLM & Associates LLC 44
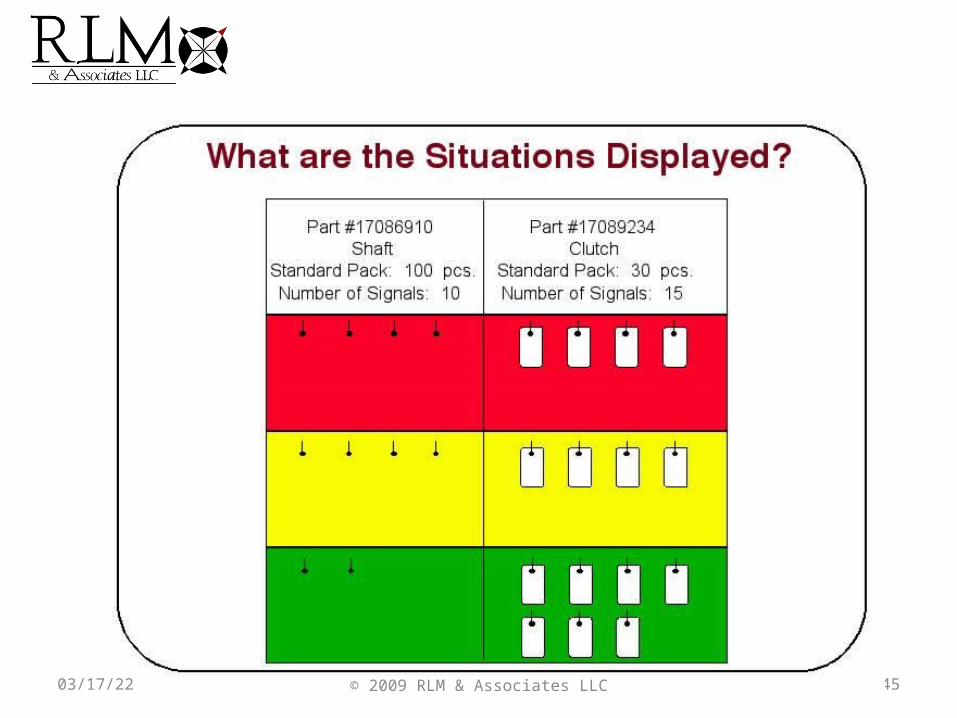
45© 2009 RLM & Associates LLC04/19/23
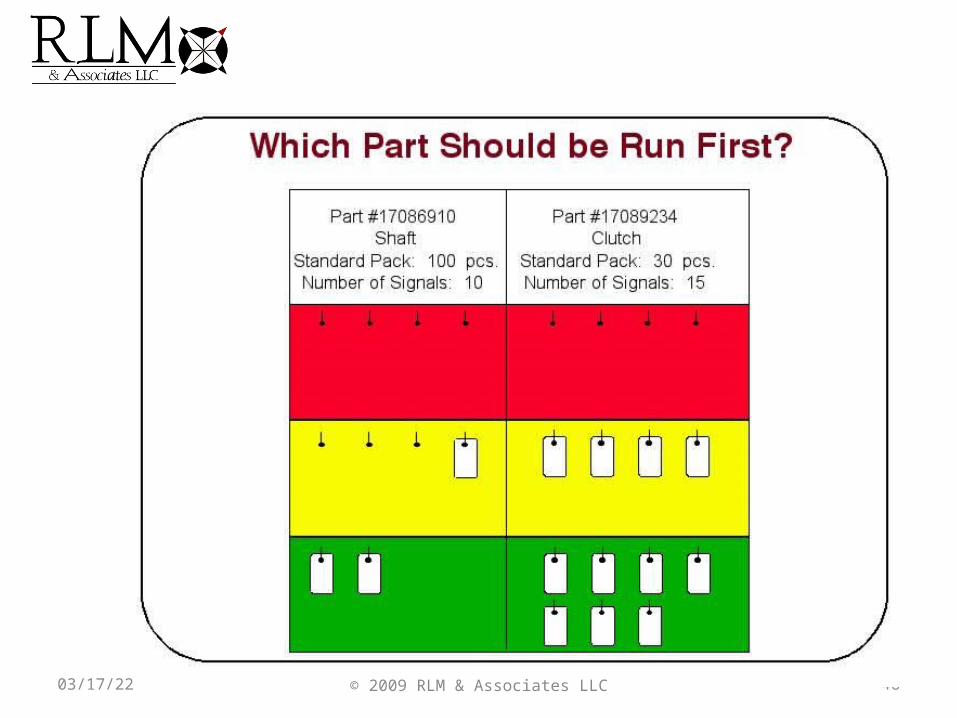
46© 2009 RLM & Associates LLC04/19/23
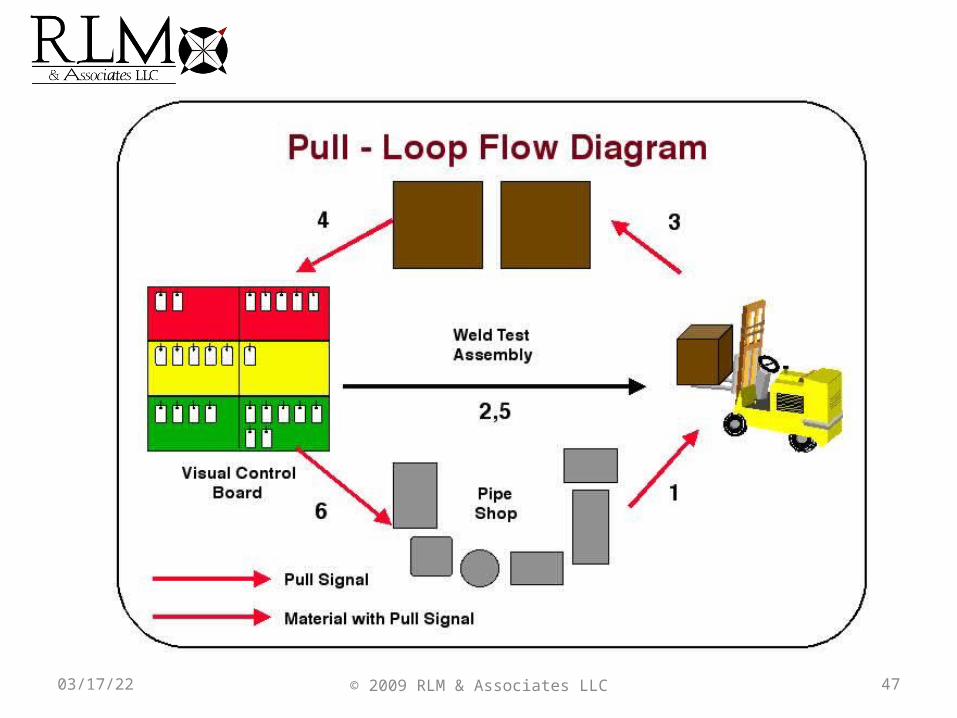
47© 2009 RLM & Associates LLC04/19/23
48© 2009 RLM & Associates LLC04/19/23
49© 2009 RLM & Associates LLC04/19/23
50© 2009 RLM & Associates LLC04/19/23
51© 2009 RLM & Associates LLC04/19/23
?
52© 2009 RLM & Associates LLC04/19/23
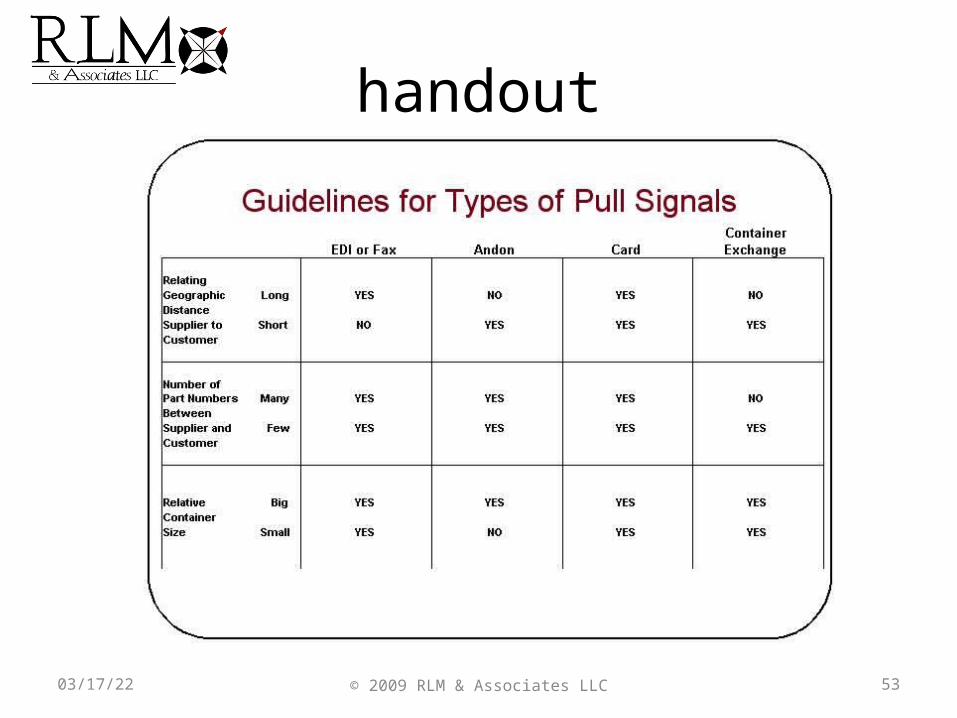
handout
53© 2009 RLM & Associates LLC04/19/23
How many pull signals• What should be considered in establishing
maximum inventory levels?– Long change over times– Long lead times– Machine downtime– Schedule increases / decreases– Large process or transfer or batch sizes– Poor quality– Long cycle times
04/19/23 © 2009 RLM & Associates LLC 54
How will the pull system change your job?• The pull system provides more time for
constructive activities that will make your job and working conditions better tomorrow because with pull you only run the parts that are needed shut down time can be spent on:– Preventive maintenance– Quality improvements– House keeping– Team meetings
04/19/23 © 2009 RLM & Associates LLC 55
• Implementation of a pull system is affected by many factors:– The process itself– Cost and availability of transportation– Relationship and logistics with supplier– Level scheduling – Containerization– Supplier and customer floor space
04/19/23 © 2009 RLM & Associates LLC 56
Benefits of a Pull System• Increases employee involvement• Allows decision making at appropriate levels• Allows manufacture of only what is needed by
customer• Improves communication with customer
through visual controls• Provides a common system for moving
material through the plant
04/19/23 © 2009 RLM & Associates LLC 57
Benefits continued• Eliminates scheduling complexities• Reduces lead time and WIP inventory• Highlights quality issues quickly• Organizes the workplace• Leads to lower unit cost• Supports continuous improvement
04/19/23 © 2009 RLM & Associates LLC 58
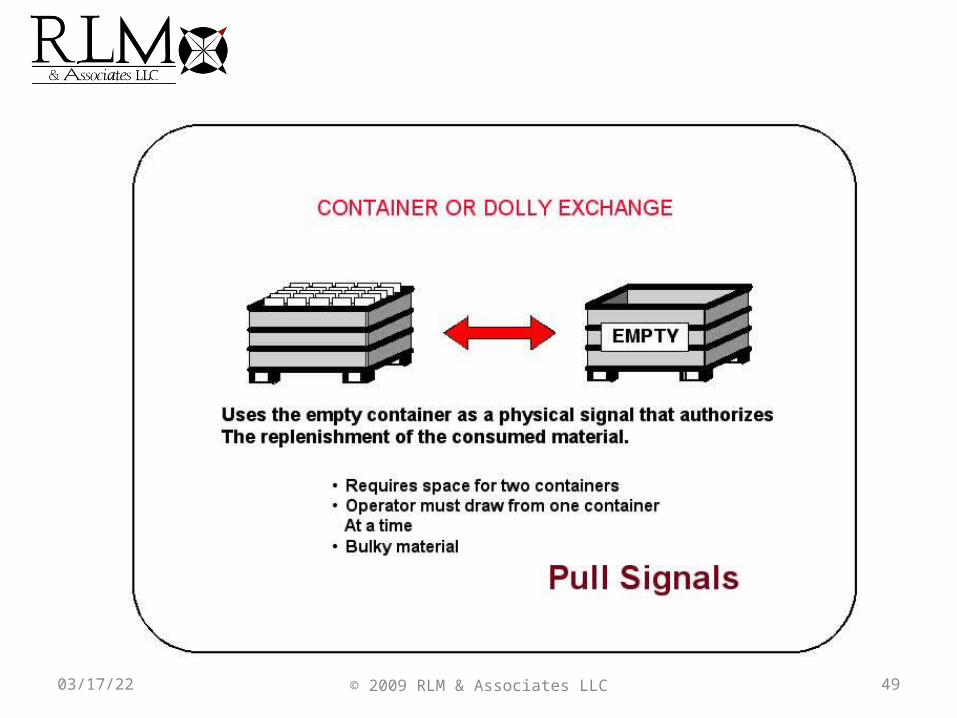
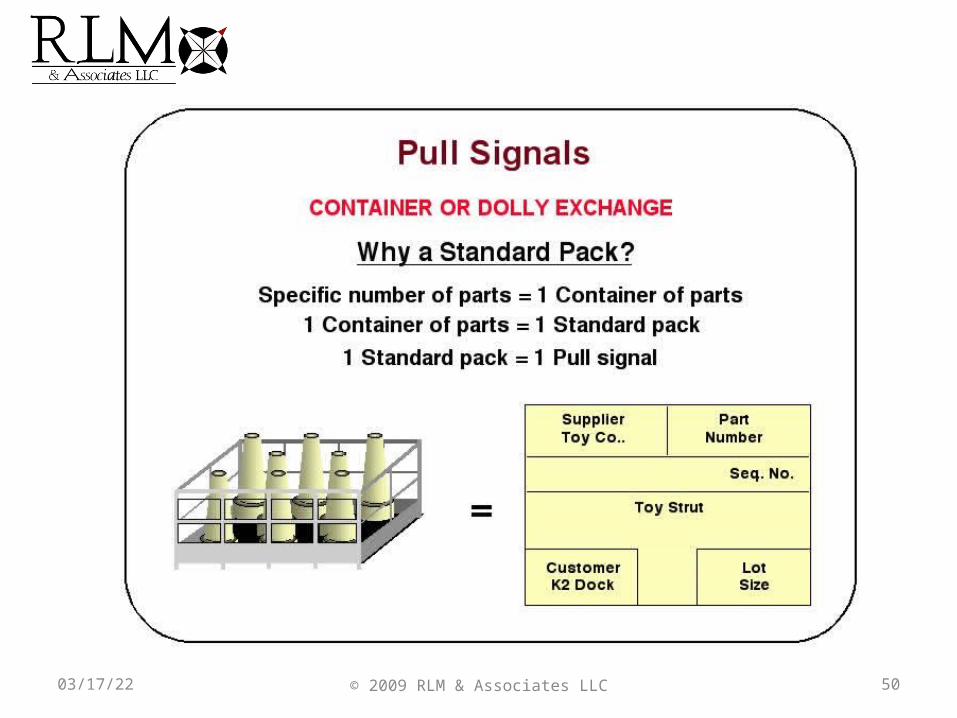
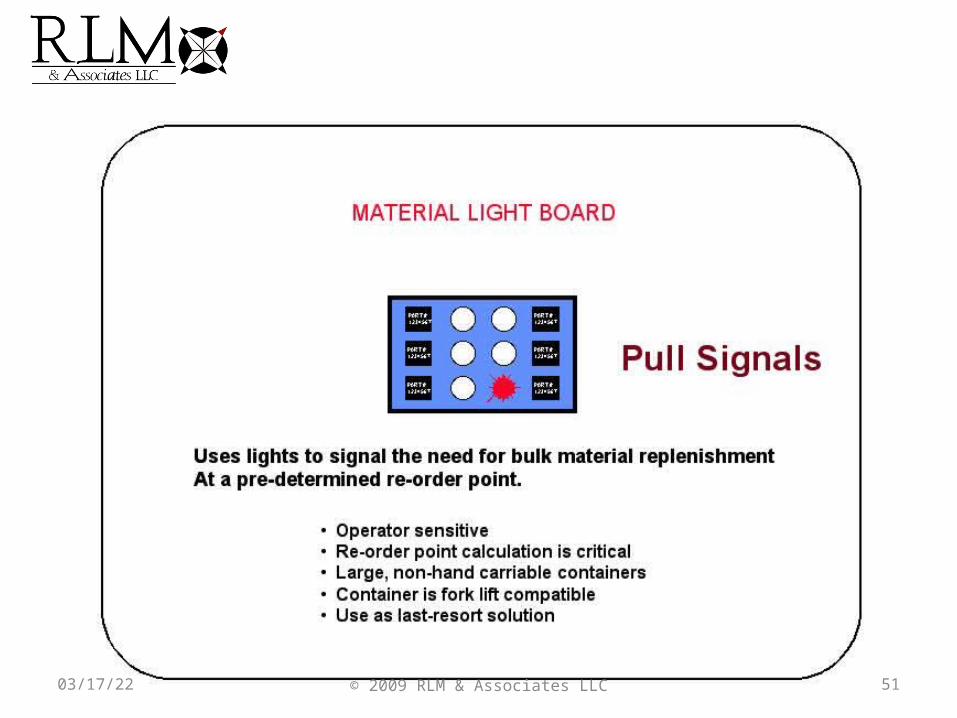
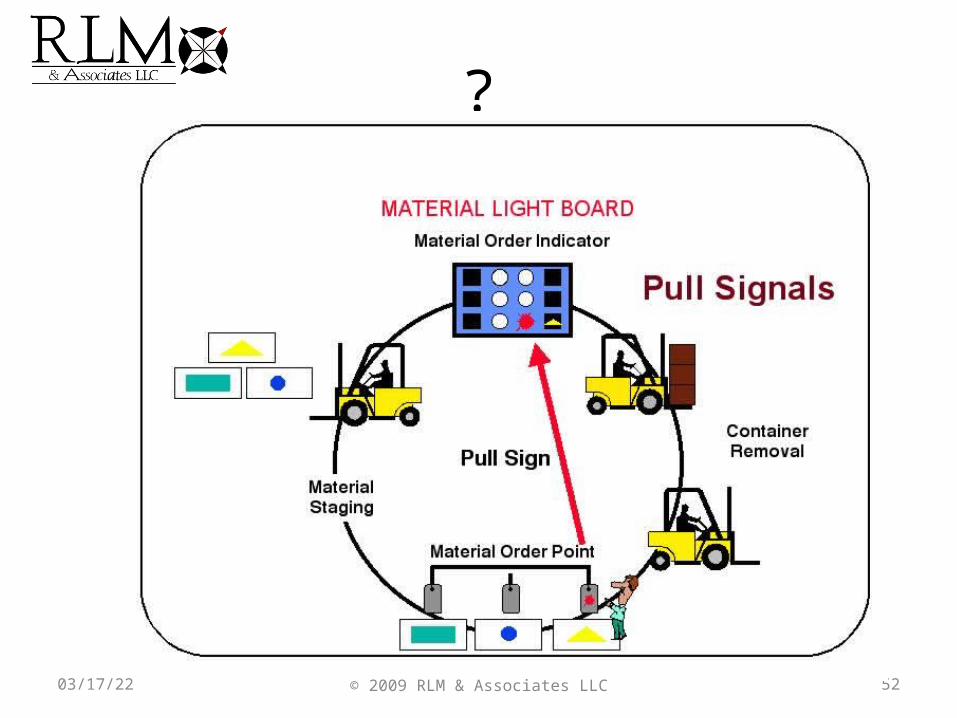
Pull System
Eliminating waste of:• Handling• Storage• Expediting• Obsolescence• Shelf life, expiration• Facilities• Excess inventory (work-in-process and finished).
59© 2009 RLM & Associates LLC04/19/23
Pull System Conclusion•Pull System is a flexible and simple method of controlling/balancing the flow of resources.
– Produce exactly what the customer wants– Minimum inventory– Small lots– Simplifies production scheduling and MRP –Management by sight/signals–The Pull takes place throughout the supply chain, not just inside your production facility
60© 2009 RLM & Associates LLC04/19/23
Pull at your company
• Identify the opportunity for Kanbans – In your department
– With your suppliers
– With your customers
61© 2009 RLM & Associates LLC04/19/23
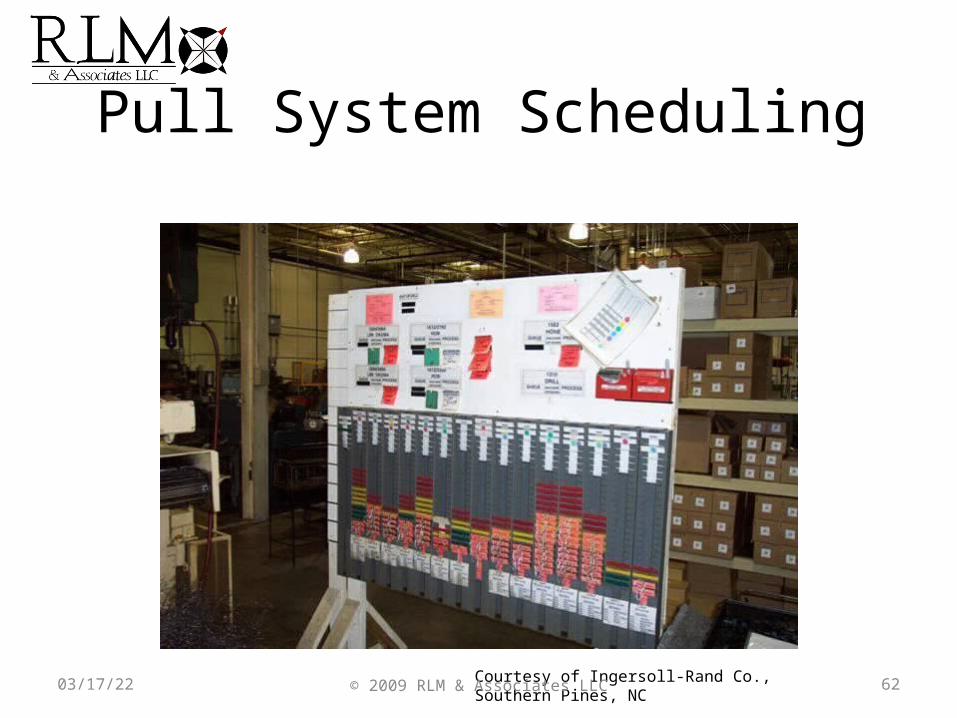
Pull System Scheduling
Courtesy of Ingersoll-Rand Co., Southern Pines, NC 62© 2009 RLM & Associates LLC04/19/23
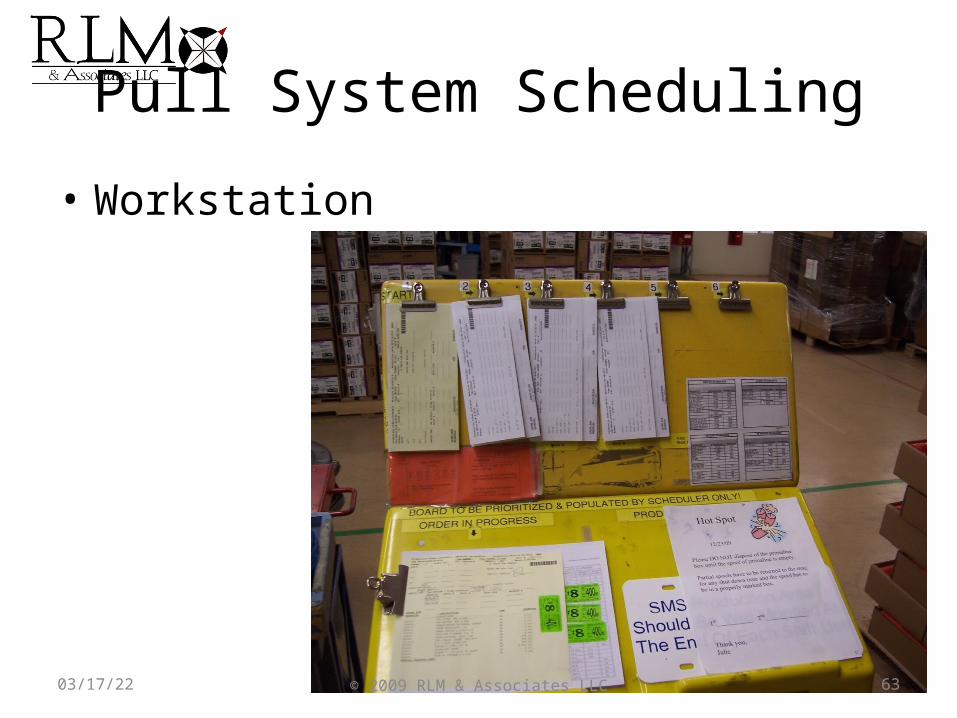
Pull System Scheduling
• Workstation
63© 2009 RLM & Associates LLC04/19/23
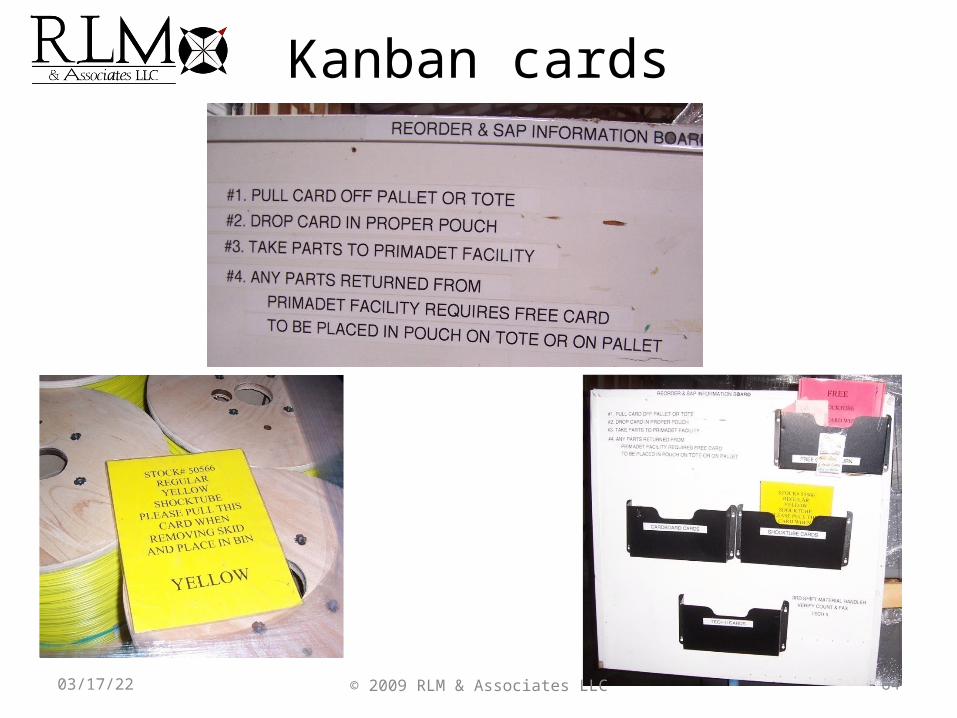
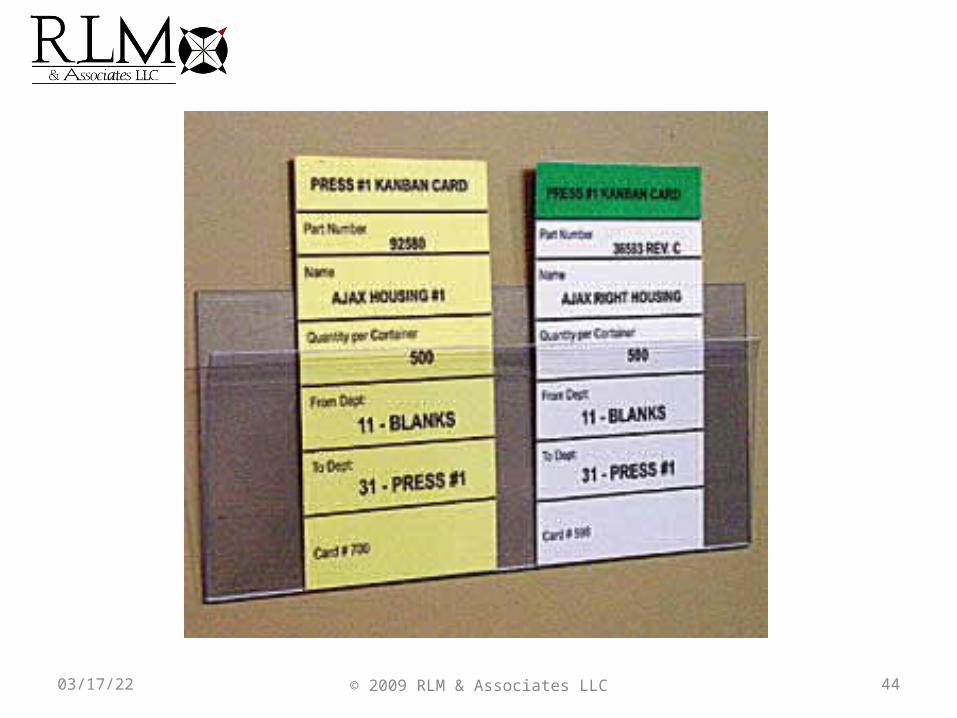
Kanban cards
64© 2009 RLM & Associates LLC04/19/23
Kanban Cards
• Production Kanban – describes how many of what item a particular operation needs to produce.
• Withdrawal Kanban – is used to pull items from a preceding operation or a supermarket.
65© 2009 RLM & Associates LLC04/19/23
Supermarket System• A stocking system in which materials are
stored by the operation that produces them until they are retrieved by the operation that needs them. When the store is full, production stops
66© 2009 RLM & Associates LLC04/19/23
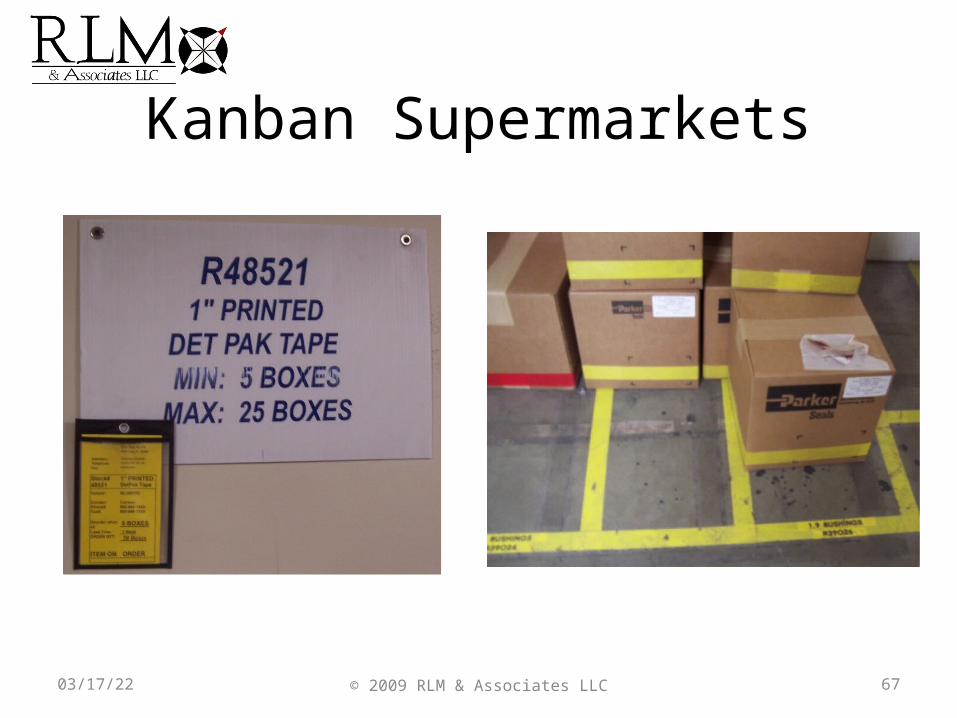
Kanban Supermarkets
67© 2009 RLM & Associates LLC04/19/23
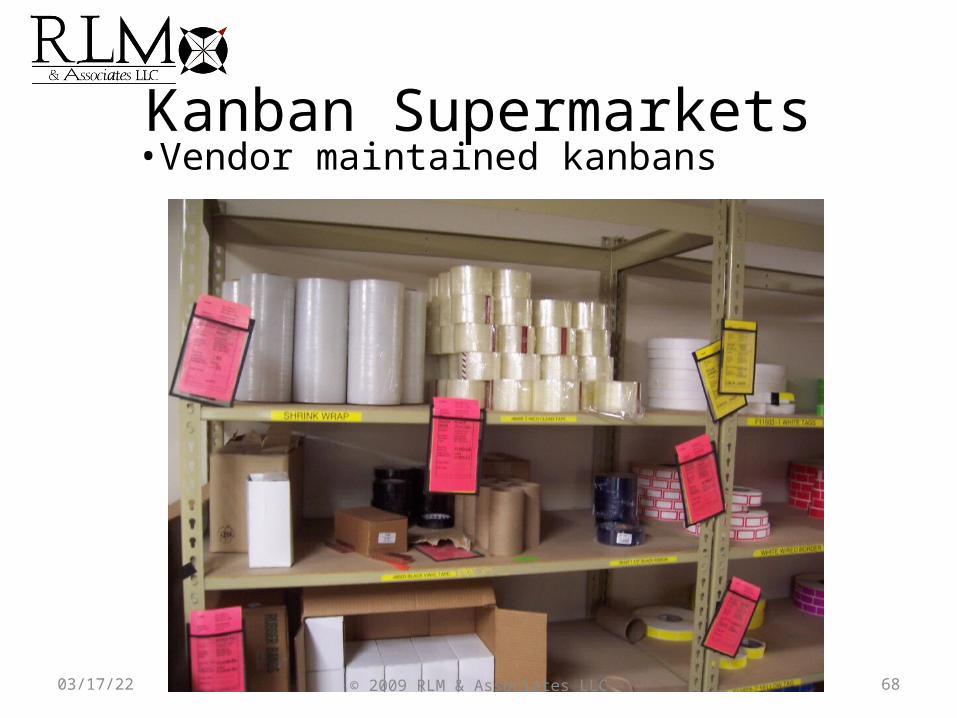
Kanban Supermarkets
68
•Vendor maintained kanbans
© 2009 RLM & Associates LLC04/19/23
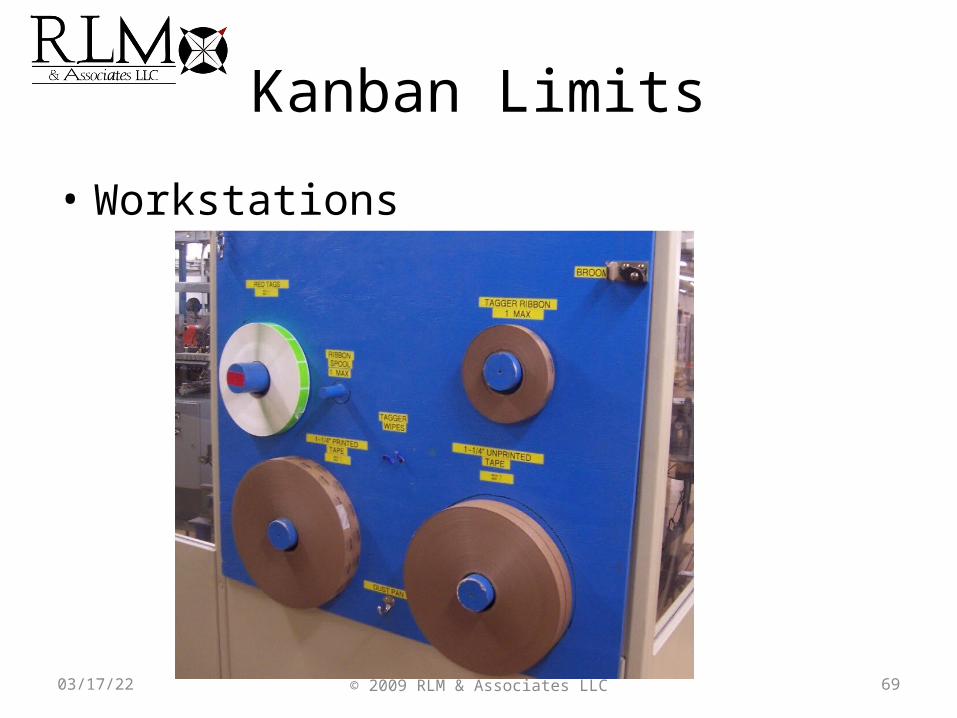
Kanban Limits
• Workstations
69© 2009 RLM & Associates LLC04/19/23
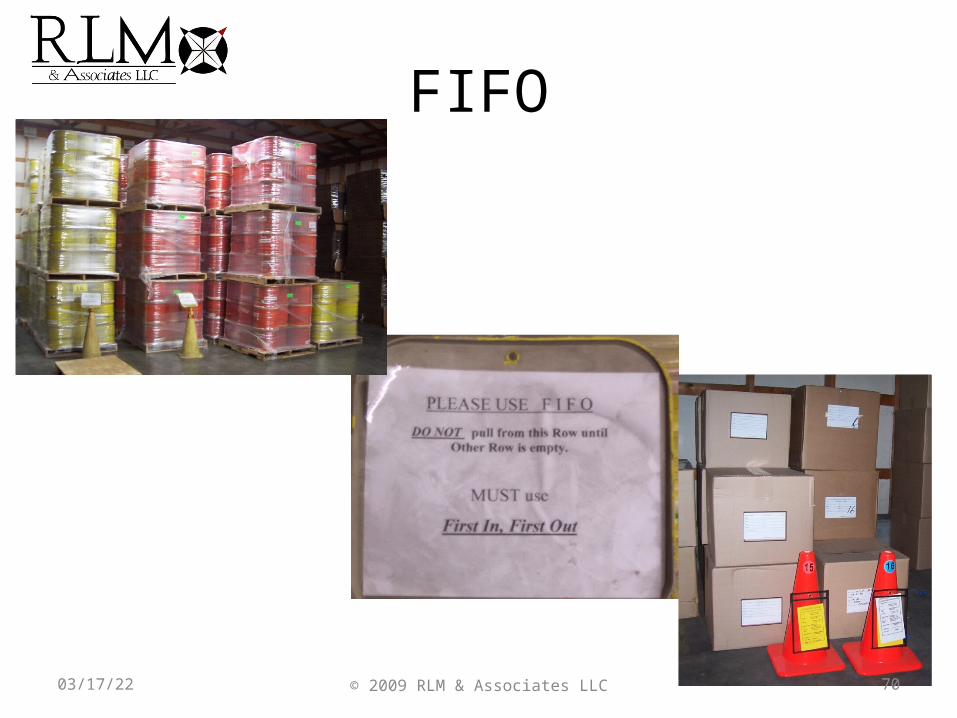
FIFO
70© 2009 RLM & Associates LLC04/19/23
© 2009 RLM & Associates LLC 71
Visual Factory
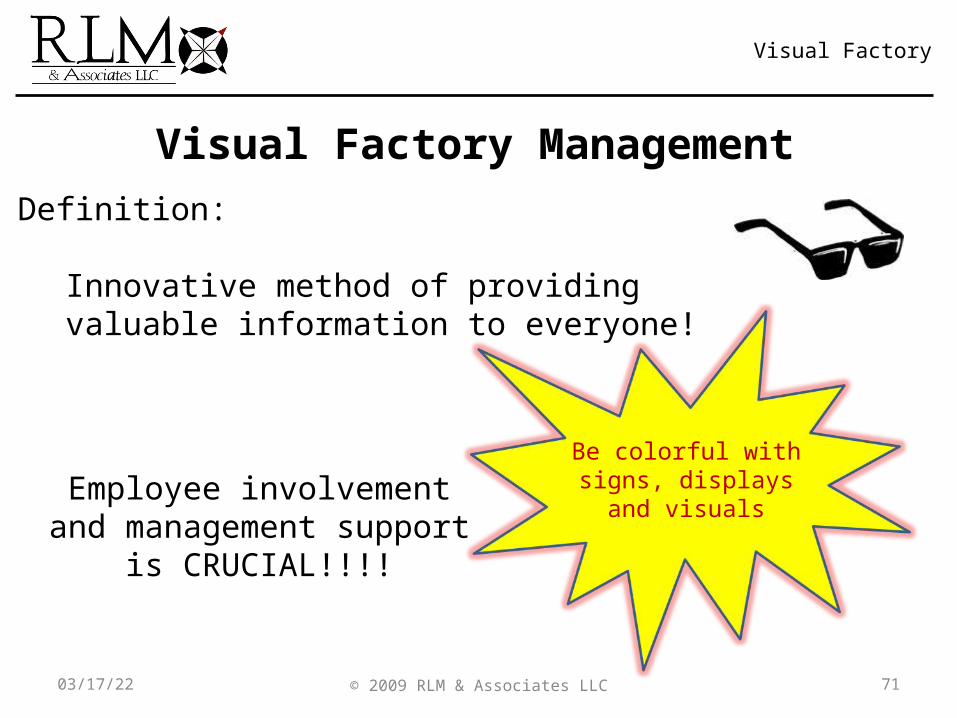
Visual Factory ManagementDefinition:
Innovative method of providing valuable information to everyone!
Be colorful with signs, displays and
visualsEmployee involvement
and management support is CRUCIAL!!!!
04/19/23
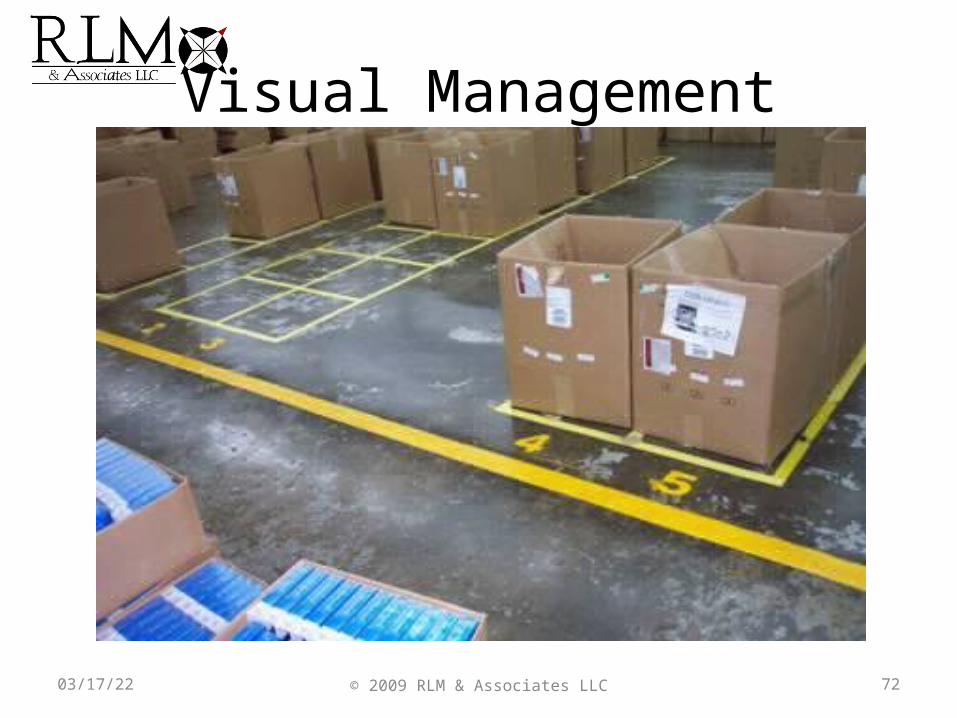
Visual Management
72© 2009 RLM & Associates LLC04/19/23
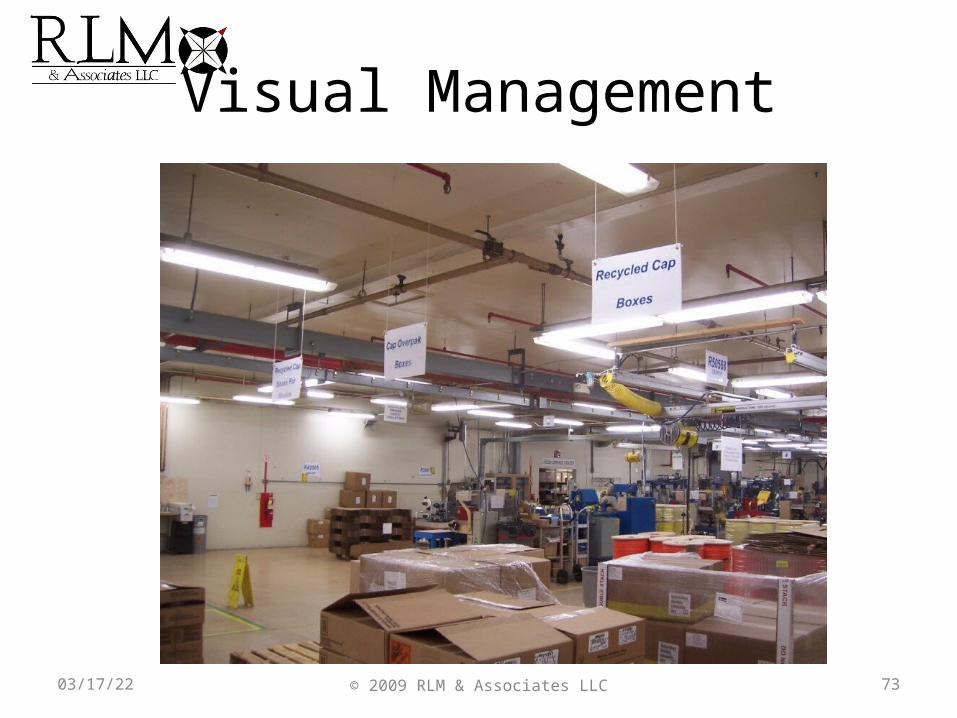
Visual Management
73© 2009 RLM & Associates LLC04/19/23
© 2009 RLM & Associates LLC 74
Visual Controls
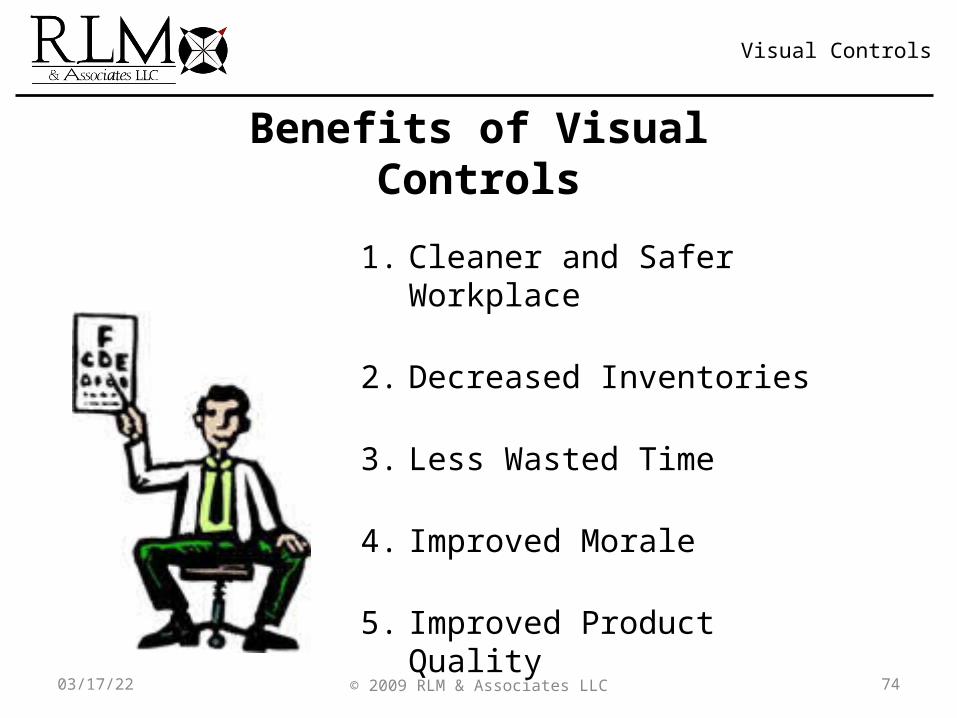
Benefits of Visual Controls
1. Cleaner and Safer Workplace
2. Decreased Inventories
3. Less Wasted Time
4. Improved Morale
5. Improved Product Quality
04/19/23
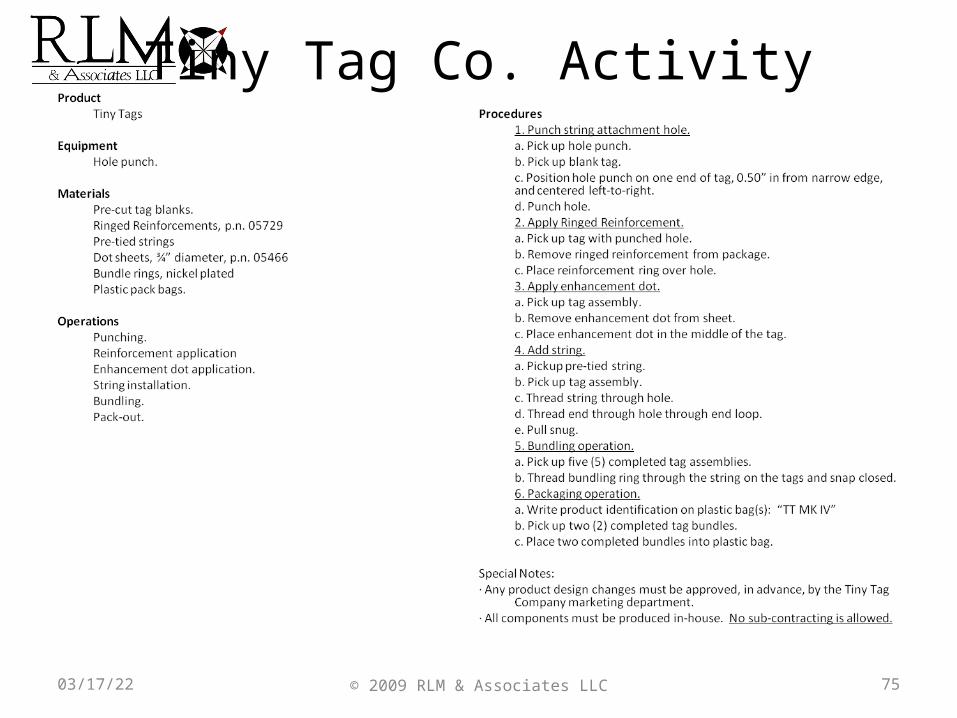
Tiny Tag Co. Activity
75© 2009 RLM & Associates LLC04/19/23
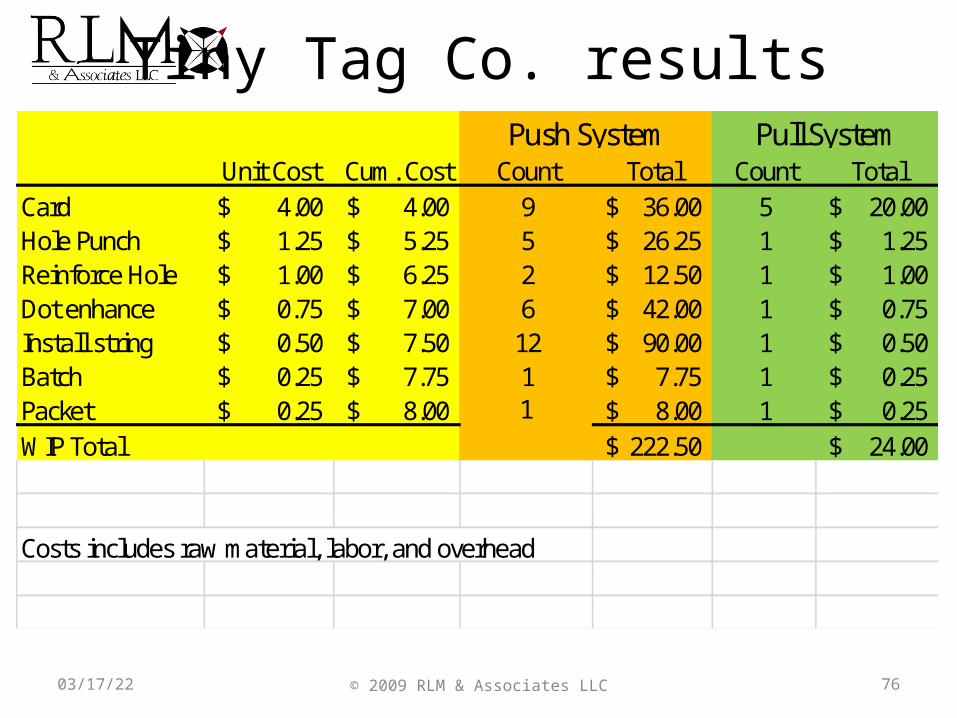
Unit Cost Cum. Cost Count Total Count TotalCard 4.00$ 4.00$ 9 36.00$ 5 20.00$ Hole Punch 1.25$ 5.25$ 5 26.25$ 1 1.25$ Reinforce Hole 1.00$ 6.25$ 2 12.50$ 1 1.00$ Dot enhance 0.75$ 7.00$ 6 42.00$ 1 0.75$ Install string 0.50$ 7.50$ 12 90.00$ 1 0.50$ Batch 0.25$ 7.75$ 1 7.75$ 1 0.25$ Packet 0.25$ 8.00$ 1 8.00$ 1 0.25$ WIP Total 222.50$ 24.00$
Costs includes raw material, labor, and overhead
Push System Pull System
Tiny Tag Co. results
76© 2009 RLM & Associates LLC04/19/23
Standard Work
04/19/23© 2009 RLM & Associates LLC77
© 2009 RLM & Associates LLC 78
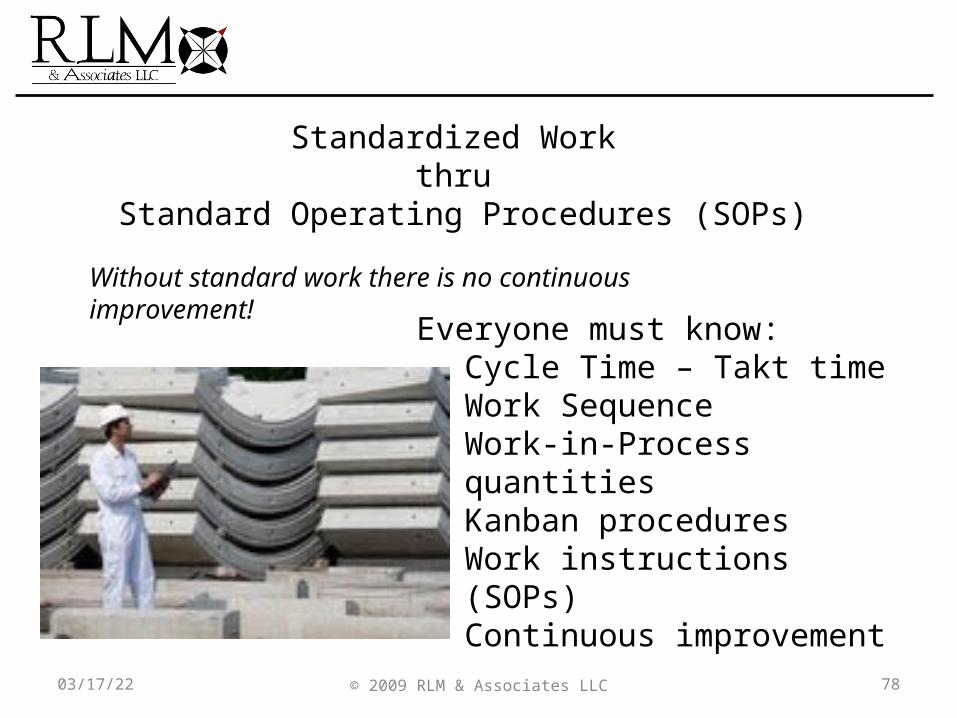
Standardized Work thru
Standard Operating Procedures (SOPs)
Everyone must know:Cycle Time – Takt timeWork SequenceWork-in-Process quantitiesKanban proceduresWork instructions (SOPs)Continuous improvement
Without standard work there is no continuous improvement!
04/19/23
© 2009 RLM & Associates LLC 79
Work Instructions
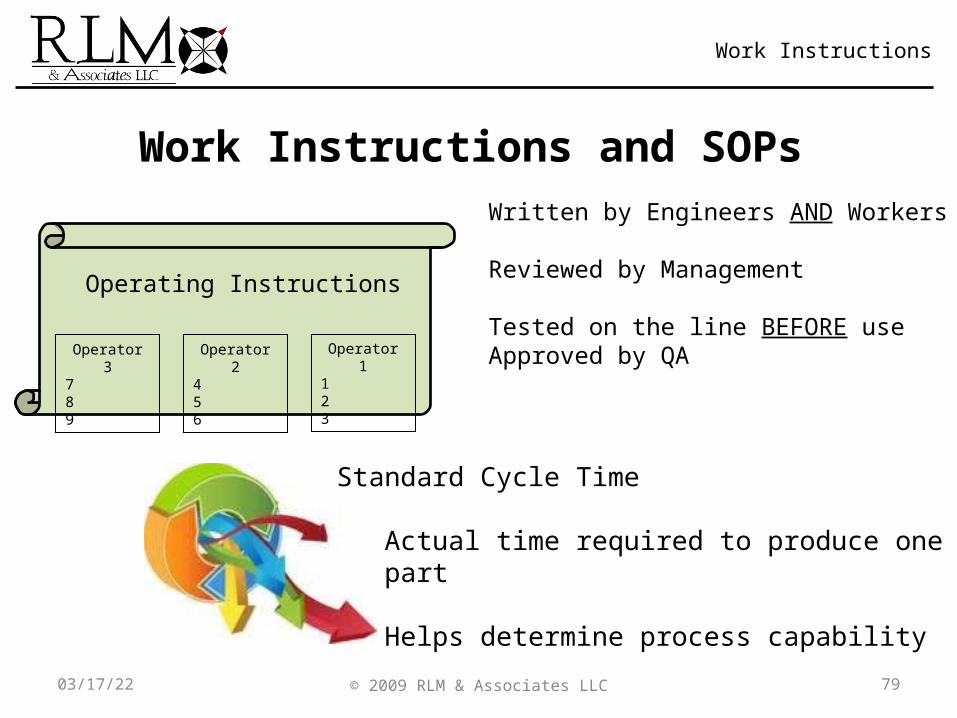
Work Instructions and SOPs
Standard Cycle Time
Actual time required to produce one part Helps determine process capability
Written by Engineers AND Workers
Reviewed by Management
Tested on the line BEFORE useApproved by QA
Operating Instructions
Operator 3789
Operator 2456
Operator 1123
04/19/23
© 2009 RLM & Associates LLC 80
SOPs
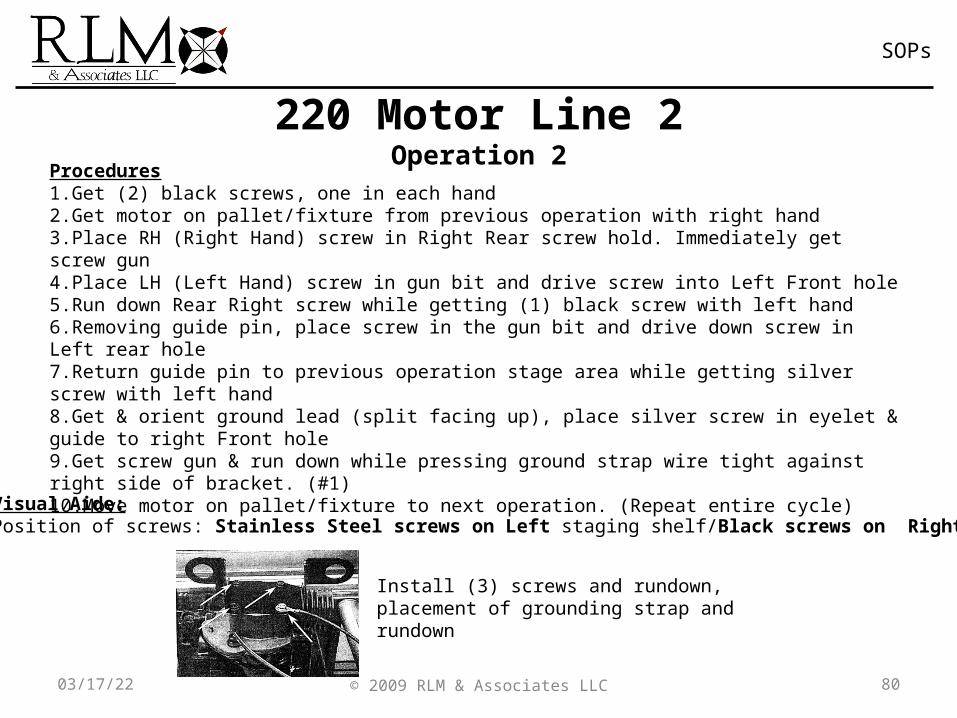
220 Motor Line 2Operation 2
Procedures1.Get (2) black screws, one in each hand2.Get motor on pallet/fixture from previous operation with right hand3.Place RH (Right Hand) screw in Right Rear screw hold. Immediately get screw gun4.Place LH (Left Hand) screw in gun bit and drive screw into Left Front hole5.Run down Rear Right screw while getting (1) black screw with left hand6.Removing guide pin, place screw in the gun bit and drive down screw in Left rear hole7.Return guide pin to previous operation stage area while getting silver screw with left hand8.Get & orient ground lead (split facing up), place silver screw in eyelet & guide to right Front hole9.Get screw gun & run down while pressing ground strap wire tight against right side of bracket. (#1)10.Move motor on pallet/fixture to next operation. (Repeat entire cycle)
Visual Aide:Position of screws: Stainless Steel screws on Left staging shelf/Black screws on Right
Install (3) screws and rundown, placement of grounding strap and rundown
04/19/23
Yellow Belt Training Wrap-upLean & Six SigmaValue Stream MappingMistake Proofing5 SSMEDTPMKaizenKanban
04/19/23© 2009 RLM & Associates LLC81
RLM & Associates LLCYour Lean Six Sigma & Project Management Trainers
© 2009 RLM & Associates LLC 82
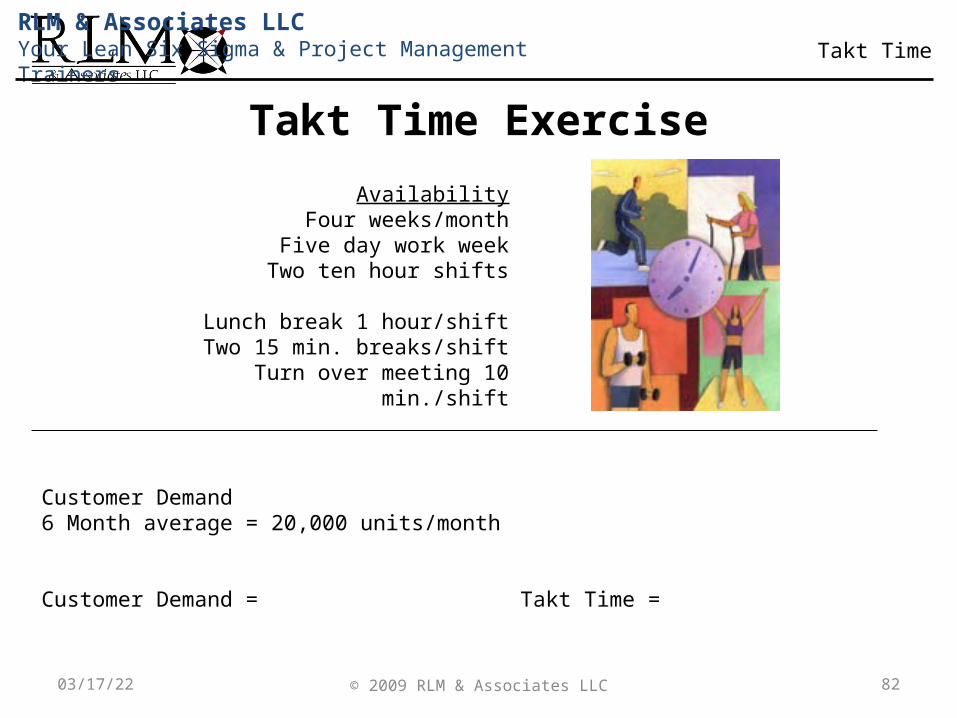
Takt Time
Takt Time Exercise
AvailabilityFour weeks/month
Five day work weekTwo ten hour shifts
Lunch break 1 hour/shiftTwo 15 min. breaks/shift
Turn over meeting 10 min./shift
Customer Demand6 Month average = 20,000 units/month
Customer Demand = Takt Time =
04/19/23
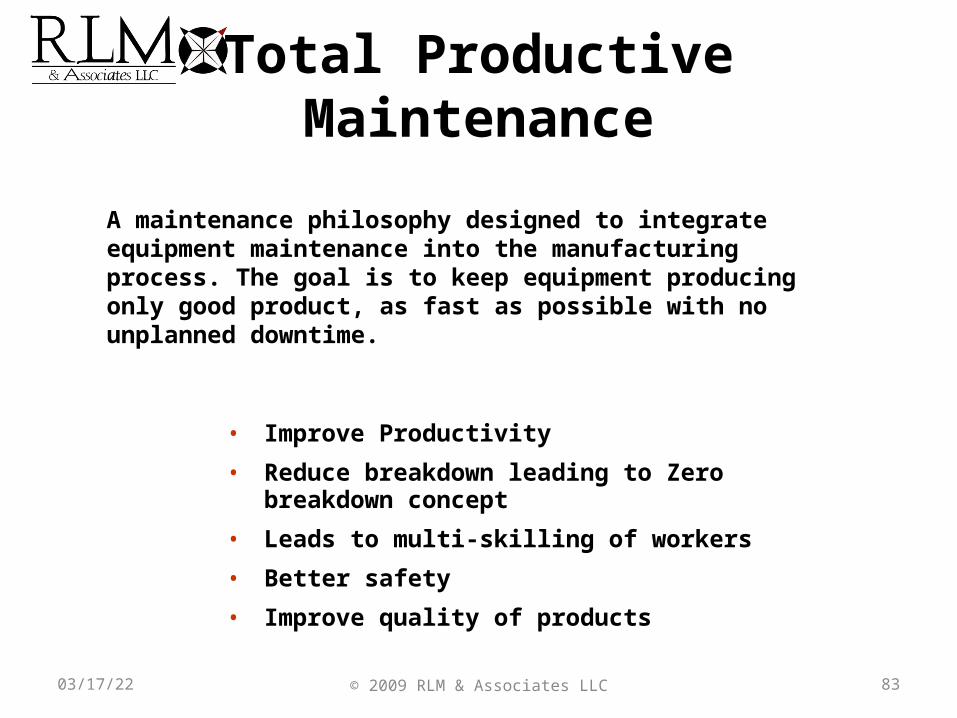
Total Productive Maintenance
A maintenance philosophy designed to integrate equipment maintenance into the manufacturing process. The goal is to keep equipment producing only good product, as fast as possible with no unplanned downtime.
• Improve Productivity
• Reduce breakdown leading to Zero breakdown concept
• Leads to multi-skilling of workers
• Better safety
• Improve quality of products
83© 2009 RLM & Associates LLC04/19/23
84
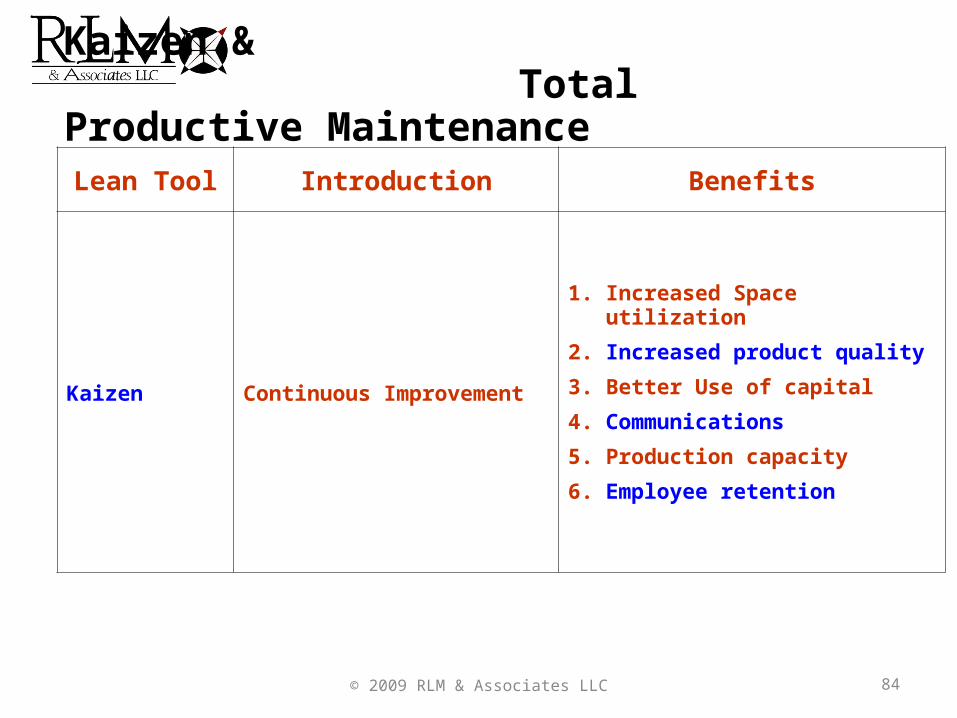
Lean Tool Introduction Benefits
Kaizen Continuous Improvement
1. Increased Space utilization
2. Increased product quality
3. Better Use of capital
4. Communications
5. Production capacity
6. Employee retention
Kaizen & Total Productive Maintenance
© 2009 RLM & Associates LLC
85
Lean Tool Introduction Benefits
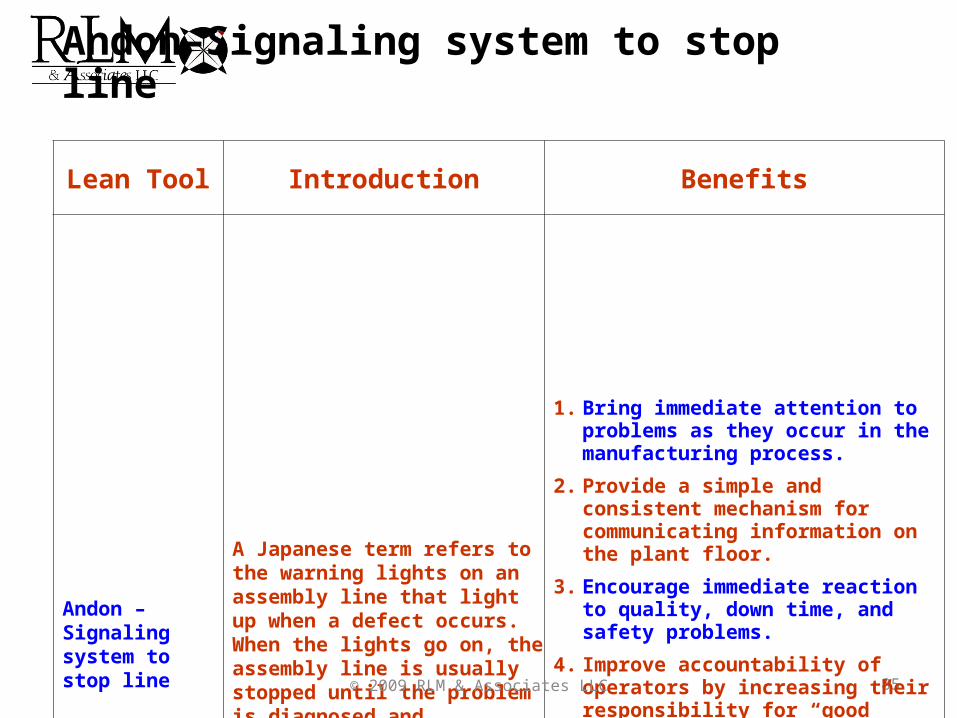
Andon – Signaling system to stop line
A Japanese term refers to the warning lights on an assembly line that light up when a defect occurs. When the lights go on, the assembly line is usually stopped until the problem is diagnosed and corrected.
1. Bring immediate attention to problems as they occur in the manufacturing process.
2. Provide a simple and consistent mechanism for communicating information on the plant floor.
3. Encourage immediate reaction to quality, down time, and safety problems.
4. Improve accountability of operators by increasing their responsibility for “good” production and empowering them to take action when problems occur.
5. Improve the ability of supervisors to quickly identify and resolve manufacturing issues.
Andon–Signaling system to stop line
© 2009 RLM & Associates LLC
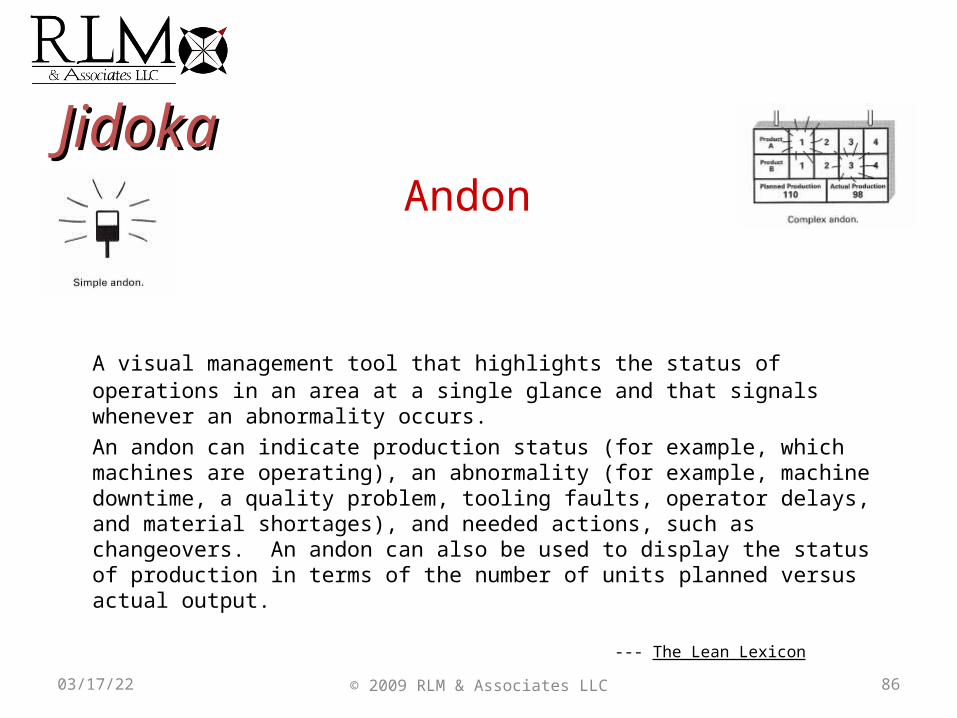
JidokaJidokaAndon
A visual management tool that highlights the status of operations in an area at a single glance and that signals whenever an abnormality occurs.
An andon can indicate production status (for example, which machines are operating), an abnormality (for example, machine downtime, a quality problem, tooling faults, operator delays, and material shortages), and needed actions, such as changeovers. An andon can also be used to display the status of production in terms of the number of units planned versus actual output.
--- The Lean Lexicon
86© 2009 RLM & Associates LLC04/19/23
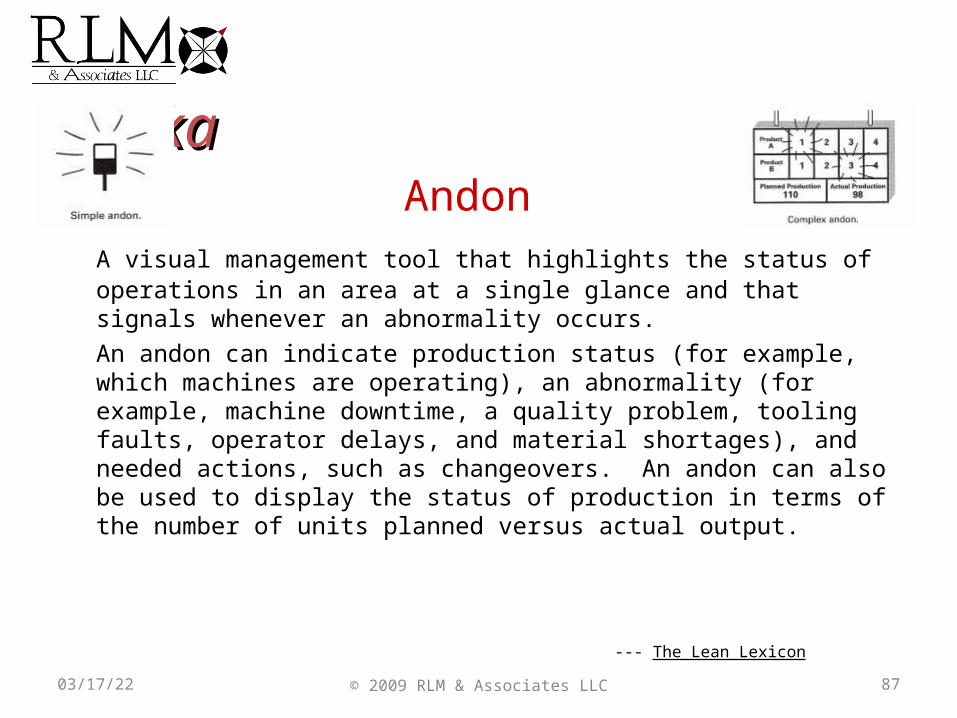
JidokaJidokaAndon
A visual management tool that highlights the status of operations in an area at a single glance and that signals whenever an abnormality occurs.
An andon can indicate production status (for example, which machines are operating), an abnormality (for example, machine downtime, a quality problem, tooling faults, operator delays, and material shortages), and needed actions, such as changeovers. An andon can also be used to display the status of production in terms of the number of units planned versus actual output.
--- The Lean Lexicon
87© 2009 RLM & Associates LLC04/19/23
RLM & Associates LLCYour Lean Six Sigma & Project Management Trainers
Lean Six Sigma DMAIC WorkshopYellow Belt Part 4
6 σ Yellow Belt
88© 2009 RLM & Associates LLC04/19/23

RLM & Associates LLCYour Lean Six Sigma & Project Management Trainers
© 2009 RLM & Associates LLC 89
Takt Time
Takt Time Exercise
AvailabilityFour weeks/month
Five day work weekTwo ten hour shifts
Lunch break 1 hour/shiftTwo 15 min. breaks/shift
Turn over meeting 10 min./shift
Customer Demand6 Month average = 20,000 units/month
Customer Demand = Takt Time =
04/19/23
RLM & Associates LLCYour Lean Six Sigma & Project Management Trainers
© 2009 RLM & Associates LLC 90
Leveling Manpower
Leveling Manpower to Meet DemandOne worker can produce a part every 8 minutes
Two workers can produce a part every 4 minutes
Eight workers can produce a part every one minute
Start and finish are close together
Multiple machines can be “watched” by one operator
Some machines can be programmed (1,4,6) to have intelligence and stop when broken or stop after one Cycle (Jidoka)
This provides JUST the quantity needed
JUST-IN-TIME
04/19/23
RLM & Associates LLCYour Lean Six Sigma & Project Management Trainers
© 2009 RLM & Associates LLC 91
Line Balancing
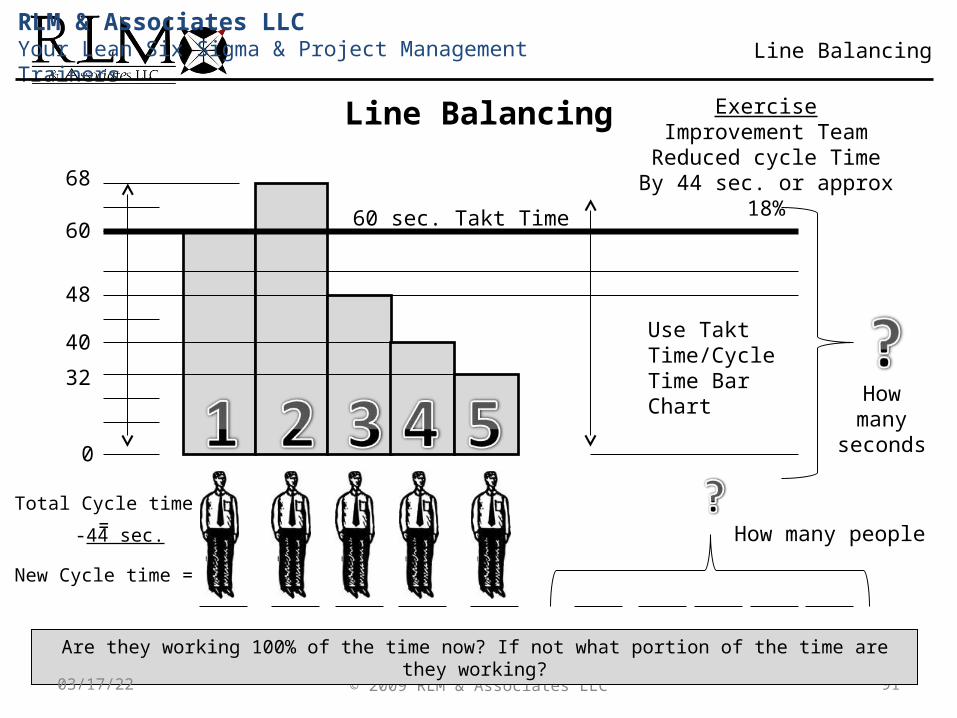
Line Balancing
60 sec. Takt Time
68
60
48
40
32
0
How many
seconds
ExerciseImprovement TeamReduced cycle Time
By 44 sec. or approx 18%
Use Takt Time/Cycle Time Bar Chart
How many people
Are they working 100% of the time now? If not what portion of the time are they working?
Total Cycle time =
-44 sec.
New Cycle time =
04/19/23
RLM & Associates LLCYour Lean Six Sigma & Project Management Trainers
© 2009 RLM & Associates LLC 92
Improve Leveling
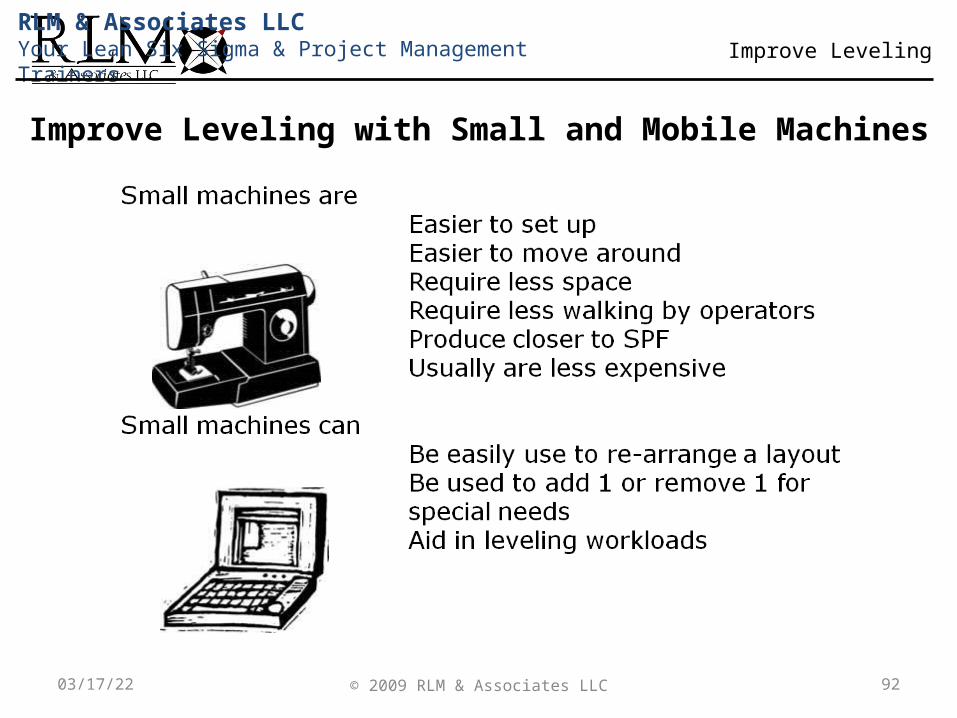
Improve Leveling with Small and Mobile Machines
04/19/23
RLM & Associates LLCYour Lean Six Sigma & Project Management Trainers
© 2009 RLM & Associates LLC 93
Cross Training
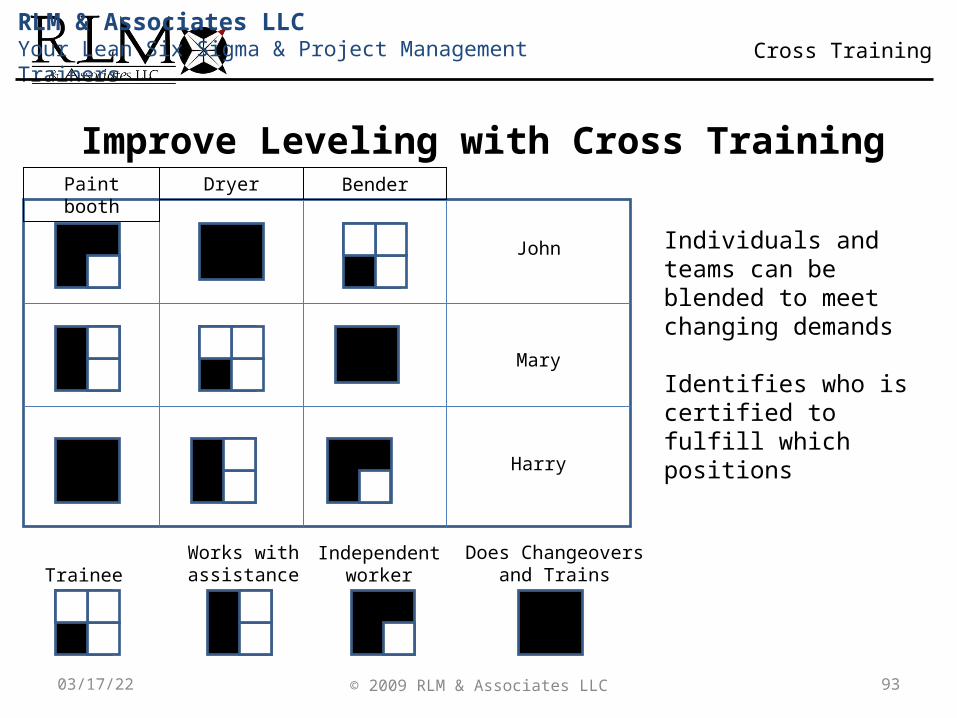
Improve Leveling with Cross Training
Individuals and teams can be blended to meet changing demands
Identifies who is certified to fulfill which positions
Paint booth Dryer Bender
John
Mary
Harry
TraineeWorks with assistance
Independent worker
Does Changeovers and Trains
04/19/23
RLM & Associates LLCYour Lean Six Sigma & Project Management Trainers
© 2009 RLM & Associates LLC 94
Level Production
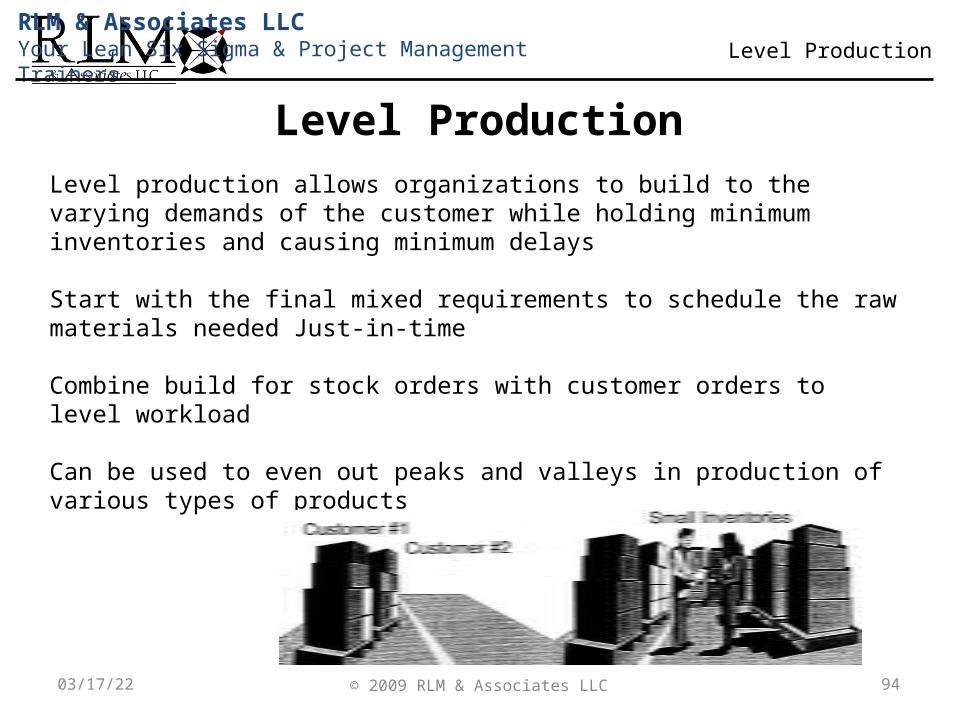
Level ProductionLevel production allows organizations to build to the varying demands of the customer while holding minimum inventories and causing minimum delays
Start with the final mixed requirements to schedule the raw materials needed Just-in-time
Combine build for stock orders with customer orders to level workload
Can be used to even out peaks and valleys in production of various types of products
04/19/23
RLM & Associates LLCYour Lean Six Sigma & Project Management Trainers
© 2009 RLM & Associates LLC 95
Level Production
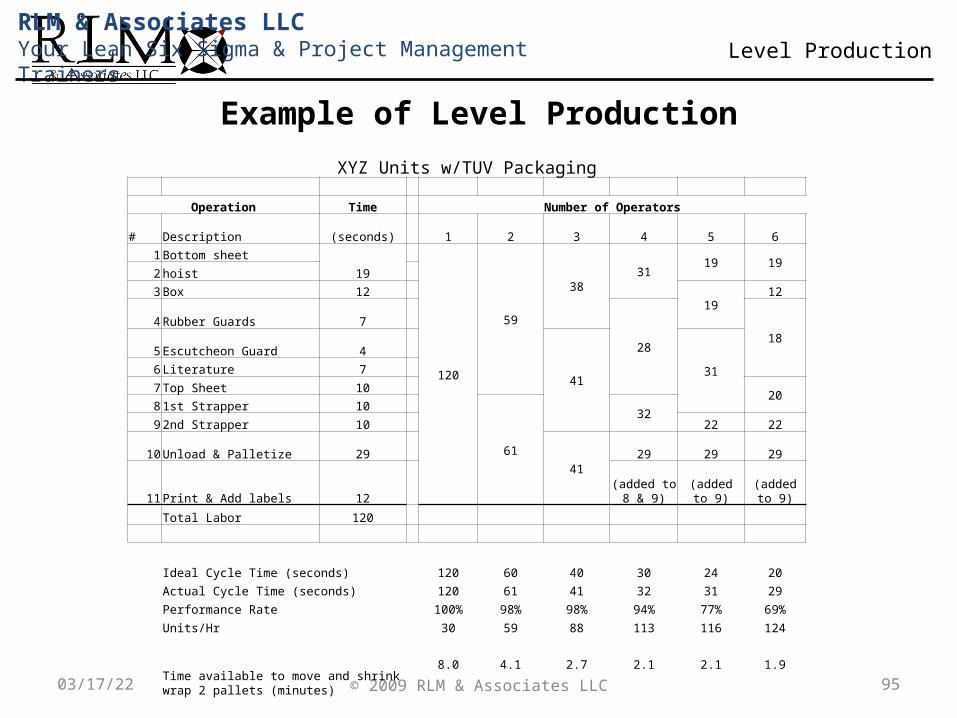
XYZ Units w/TUV Packaging
Operation Time Number of Operators
# Description (seconds) 1 2 3 4 5 6
1Bottom sheet
19
120
59
3831
19 192hoist
3Box 12 19
12
4Rubber Guards 7
2818
5Escutcheon Guard 4
41316Literature 7
7Top Sheet 10 20
81st Strapper 10
61
3292nd Strapper 10 22 22
10Unload & Palletize 29 41
29 29 29
11Print & Add labels 12 (added to
8 & 9)(added to
9)(added to
9)
Total Labor 120
Ideal Cycle Time (seconds) 120 60 40 30 24 20
Actual Cycle Time (seconds) 120 61 41 32 31 29
Performance Rate 100% 98% 98% 94% 77% 69%
Units/Hr 30 59 88 113 116 124
Time available to move and shrink wrap 2 pallets (minutes)
8.0 4.1 2.7 2.1 2.1 1.9
Example of Level Production
04/19/23