Embed Size (px)
Citation preview
Please refer to important disclosures at the end of this report
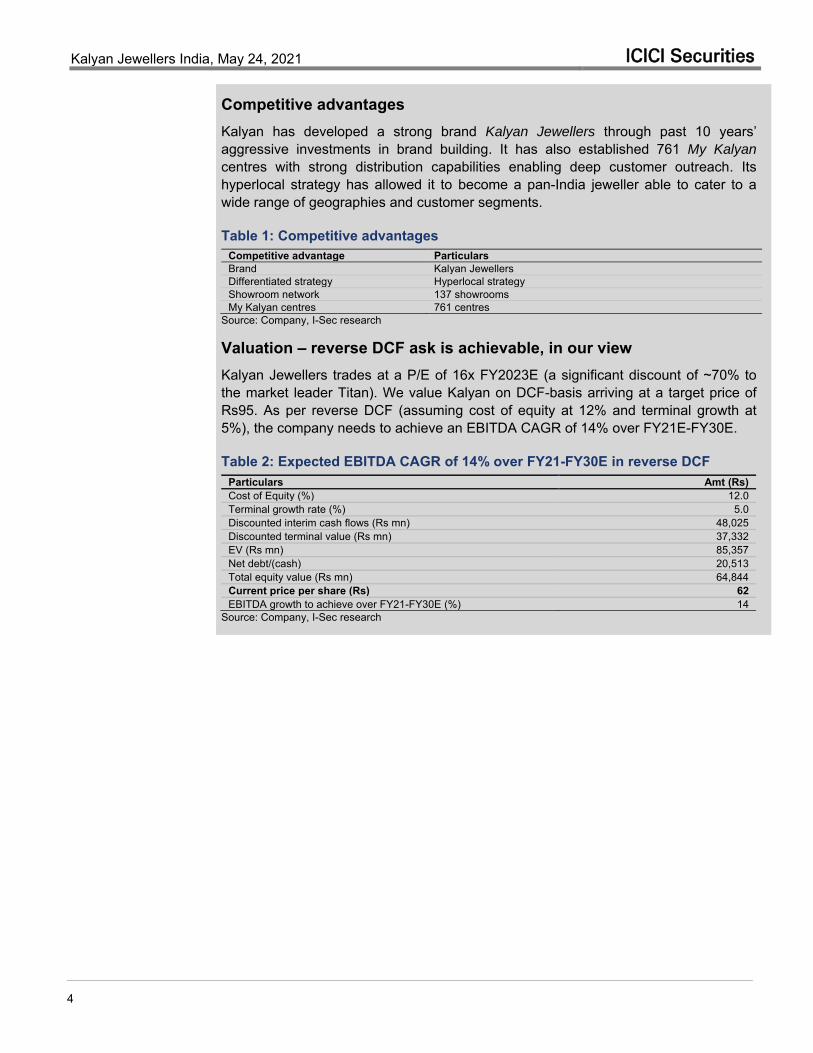
Market Cap Rs63.8bn/US$873mn Year ending Mar FY20 FY21E FY22E FY23E Reuters/Bloomberg KALN.BO/KALYANKJ IN Revenue (Rs mn) 1,01,009 85,327 99,559 1,23,437 Shares Outstanding (mn) 1,030.1 Adj Net Profit (Rs mn) 1,430 (155) 2,905 4,102 52-week Range (Rs) 87/57 Dil. Rec. EPS (Rs) 1.7 (0.1) 2.8 3.9 Free Float (%) 39.5 % Chg YoY NM NM NM 41.2 FII (%) 5.0 P/E (x) 36.3 NM 22.4 15.8 Daily Volume (US$'000) NA CEPS (Rs) 4.6 2.1 5.0 6.5 Absolute Return 3m (%) Na EV/EBITDA (x) 9.7 16.0 11.7 8.6 Absolute Return 12m (%) NA Dividend Yield (%) - - - - Sensex Return 3m (%) (0.6) RoCE (%) 8.0 4.5 6.6 8.7 Sensex Return 12m (%) 65.2 RoE (%) 6.6 (0.6) 9.0 11.2
Equity Research May 24, 2021 BSE Sensex: 50540
ICICI Securities Limited is the author and distributor of this report Initiating coverage
Consumer Staples & Discretionary
Target price Rs95 Shareholding pattern
Dec ‘20
Mar ‘21
Promoters 60.5 60.5 Institutional investors 6.5 6.5 MFs and others 1.4 1.4 FIs/Bank/Ins 0.1 0.1 FIIs 5.0 5.0 Others 33.0 33.0
Source: BSE
Price chart
40
50
60
70
80
90
25-M
ar
08-A
pr
22-A
pr
06-M
ay
20-M
ay
(Rs)
Kalyan Jewellers India BUY Store expansion is the key; initiate with BUY Rs62
INDIA
Kalyan Jewellers India (Kalyan) is a pan-India jeweller with focus on the strengths of: 1) store expansion, 2) consistent investment in brand, 3) hyperlocal strategy, and 4) My Kalyan network differentiation (in our view). Accelerated industry formalisation and new store addition of 15-20 per annum are medium-term revenue growth drivers. We forecast 20% and 36% CAGR in revenues and EBIDTA respectively, over FY21E-FY23E. We initiate coverage with a BUY rating and DCF-based target price of Rs95 per share. Key risks are (1) potentially higher competitive intensity in core South India markets, (2) execution risks in expansion, and (3) delayed economic recovery in Middle East.
Focus on expanding showroom network: Between 1st Apr’15 and 30th Jun’20, Kalyan Jewellers (Kalyan) opened 60 new showrooms (net) at an average rate of ~12 showrooms per year across multiple regions. We believe the company will continue to drive showroom expansion to capture the opportunity to gain market shares from unorganised players. The scope for nationwide expansion is seen from the fact that Titan has as many as 353 stores (vs Kalyan’s 107) across India as at FY21-end.
Creation of competitive advantages: Kalyan’s competitive advantages are: 1) strong brand {Kalyan Jewellers}, 2) pan-India retail presence with 107 showrooms across India, 3) hyperlocal strategy to cater to a wide range of geographies and customer segments, and 3) unique My Kalyan centre to drive footfalls.
Growth strategies: Key revenue growth strategies: 1) expansion of showroom network, and 2) expansion of My Kalyan network to gain market shares from unorganised players. Organised jewellery industry has increased its share from 6% of the market in 2007 to ~30% in 2020 and will continue to garner further gains from unorganised players on the back of tough regulatory and operating (access to credit) environments. We forecast EBITDA margin to expand to 8.7% in FY23E from 7.5% in FY20 driven by: 1) improvement in studded ratio, 2) operating leverage in adspends and other overheads.
Initiate with BUY: We model revenue and EBITDA CAGRs of 20% and 36% over FY21E-FY23E. We initiate coverage on the stock with a BUY rating and DCF-based target price of Rs95. Key risks: delay in showroom expansion and potentially higher competitive intensity in core South India markets.
Research Analysts:
Aniket Sethi [email protected] +91 22 2277 7632 Manoj Menon [email protected] +91 22 6637 7209 Karan Bhuwania [email protected] +91 22 6637 7351
Kalyan Jewellers India, May 24, 2021 ICICI Securities
2
TABLE OF CONTENT
Investment summary ....................................................................................................... 3
Focus on expanding showroom network ...................................................................... 5
Competitive advantages for Kalyan Jewellers .............................................................. 8
Growth strategy ............................................................................................................. 12
Revenue growth drivers ................................................................................................ 12
EBITDA margin expansion drivers ................................................................................ 15
Indian Jewellery Retail Industry ................................................................................... 17
Key trends that signify the construct of Indian jewellery market ............................. 18
Accelerated growth of Organised Jewellery Retail ....................................................... 20
Competitive Landscape ................................................................................................. 22
Peer group comparison ................................................................................................. 24
Financial performance ................................................................................................... 25
Key assumptions ........................................................................................................... 27
Valuation ......................................................................................................................... 28
DCF assumptions .......................................................................................................... 28
Relative valuation .......................................................................................................... 28
Key risks ........................................................................................................................ 29
Business and management .......................................................................................... 30
Operations ...................................................................................................................... 30
Promoters and management profile ......................................................................... 34
Financials ........................................................................................................................ 36
Index of tables and charts ............................................................................................. 38
Kalyan Jewellers India, May 24, 2021 ICICI Securities
3
Investment summary Business Kalyan Jewellers (Kalyan) designs, manufactures and sells a wide range of gold, studded and other jewellery products. Kalyan was established by founder and promoter Mr. T.S. Kalyanaraman, who has over 45 years of retail experience, of which over 25 years are in the jewellery industry. Company started its jewellery business in 1993 with a single showroom in Thrissur, Kerala. Kalyan has expanded to become a pan-India jewellery company, with 107 showrooms located across 21 states and Union Territories in India, and international presence with 30 showrooms in the Middle East. All of the showrooms are operated and managed by Kalyan.
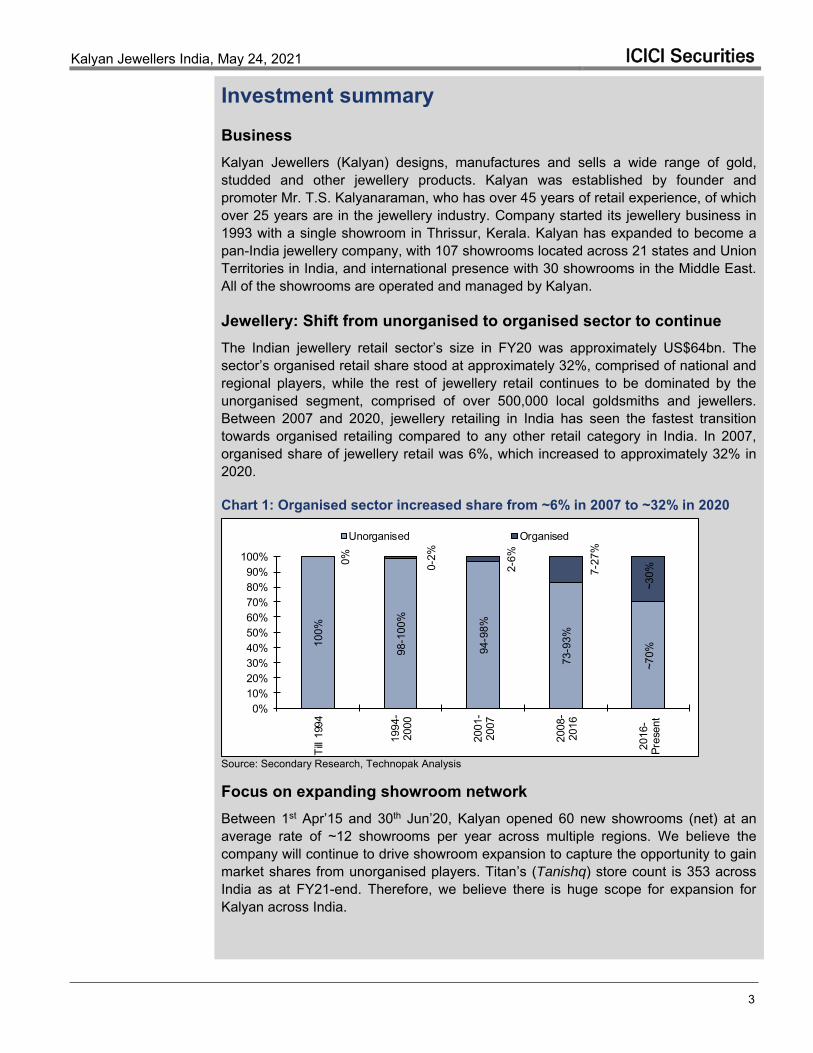
Jewellery: Shift from unorganised to organised sector to continue The Indian jewellery retail sector’s size in FY20 was approximately US$64bn. The sector’s organised retail share stood at approximately 32%, comprised of national and regional players, while the rest of jewellery retail continues to be dominated by the unorganised segment, comprised of over 500,000 local goldsmiths and jewellers. Between 2007 and 2020, jewellery retailing in India has seen the fastest transition towards organised retailing compared to any other retail category in India. In 2007, organised share of jewellery retail was 6%, which increased to approximately 32% in 2020.
Chart 1: Organised sector increased share from ~6% in 2007 to ~32% in 2020
100%
98-1
00%
94-9
8%
73-9
3%
~70%
0% 0-2%
2-6%
7-27
%
~30%
0%10%20%30%40%50%60%70%80%90%
100%
Till
1994
1994
-20
00
2001
-20
07
2008
-20
16
2016
-Pr
esen
t
Unorganised Organised
Source: Secondary Research, Technopak Analysis Focus on expanding showroom network Between 1st Apr’15 and 30th Jun’20, Kalyan opened 60 new showrooms (net) at an average rate of ~12 showrooms per year across multiple regions. We believe the company will continue to drive showroom expansion to capture the opportunity to gain market shares from unorganised players. Titan’s (Tanishq) store count is 353 across India as at FY21-end. Therefore, we believe there is huge scope for expansion for Kalyan across India.
Kalyan Jewellers India, May 24, 2021 ICICI Securities
4
Competitive advantages Kalyan has developed a strong brand Kalyan Jewellers through past 10 years’ aggressive investments in brand building. It has also established 761 My Kalyan centres with strong distribution capabilities enabling deep customer outreach. Its hyperlocal strategy has allowed it to become a pan-India jeweller able to cater to a wide range of geographies and customer segments.
Table 1: Competitive advantages Competitive advantage Particulars Brand Kalyan Jewellers Differentiated strategy Hyperlocal strategy Showroom network 137 showrooms My Kalyan centres 761 centres
Source: Company, I-Sec research Valuation – reverse DCF ask is achievable, in our view Kalyan Jewellers trades at a P/E of 16x FY2023E (a significant discount of ~70% to the market leader Titan). We value Kalyan on DCF-basis arriving at a target price of Rs95. As per reverse DCF (assuming cost of equity at 12% and terminal growth at 5%), the company needs to achieve an EBITDA CAGR of 14% over FY21E-FY30E.
Table 2: Expected EBITDA CAGR of 14% over FY21-FY30E in reverse DCF Particulars Amt (Rs) Cost of Equity (%) 12.0 Terminal growth rate (%) 5.0 Discounted interim cash flows (Rs mn) 48,025 Discounted terminal value (Rs mn) 37,332 EV (Rs mn) 85,357 Net debt/(cash) 20,513 Total equity value (Rs mn) 64,844 Current price per share (Rs) 62 EBITDA growth to achieve over FY21-FY30E (%) 14
Source: Company, I-Sec research
Kalyan Jewellers India, May 24, 2021 ICICI Securities
5
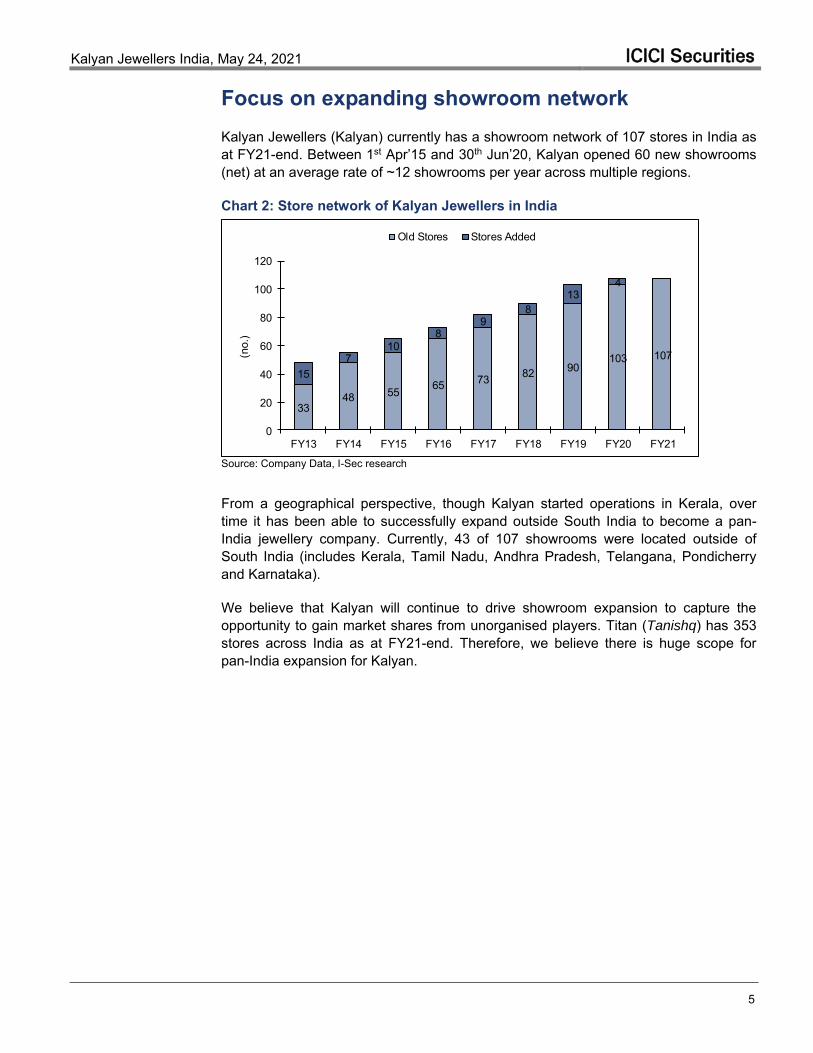
Focus on expanding showroom network Kalyan Jewellers (Kalyan) currently has a showroom network of 107 stores in India as at FY21-end. Between 1st Apr’15 and 30th Jun’20, Kalyan opened 60 new showrooms (net) at an average rate of ~12 showrooms per year across multiple regions.
Chart 2: Store network of Kalyan Jewellers in India
3348 55 65 73 82 90
103 10715
710
89
813
4
0
20
40
60
80
100
120
FY13 FY14 FY15 FY16 FY17 FY18 FY19 FY20 FY21
(no.
)Old Stores Stores Added
Source: Company Data, I-Sec research
From a geographical perspective, though Kalyan started operations in Kerala, over time it has been able to successfully expand outside South India to become a pan-India jewellery company. Currently, 43 of 107 showrooms were located outside of South India (includes Kerala, Tamil Nadu, Andhra Pradesh, Telangana, Pondicherry and Karnataka).
We believe that Kalyan will continue to drive showroom expansion to capture the opportunity to gain market shares from unorganised players. Titan (Tanishq) has 353 stores across India as at FY21-end. Therefore, we believe there is huge scope for pan-India expansion for Kalyan.
Kalyan Jewellers India, May 24, 2021 ICICI Securities
6
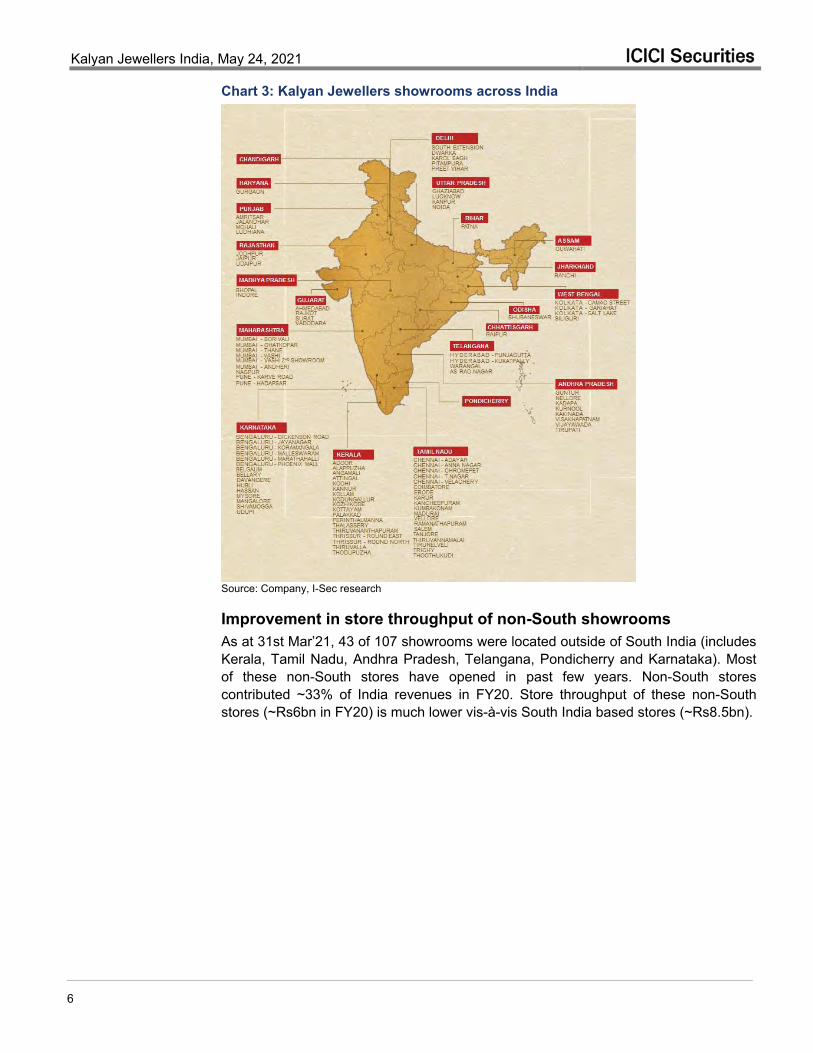
Chart 3: Kalyan Jewellers showrooms across India
Source: Company, I-Sec research
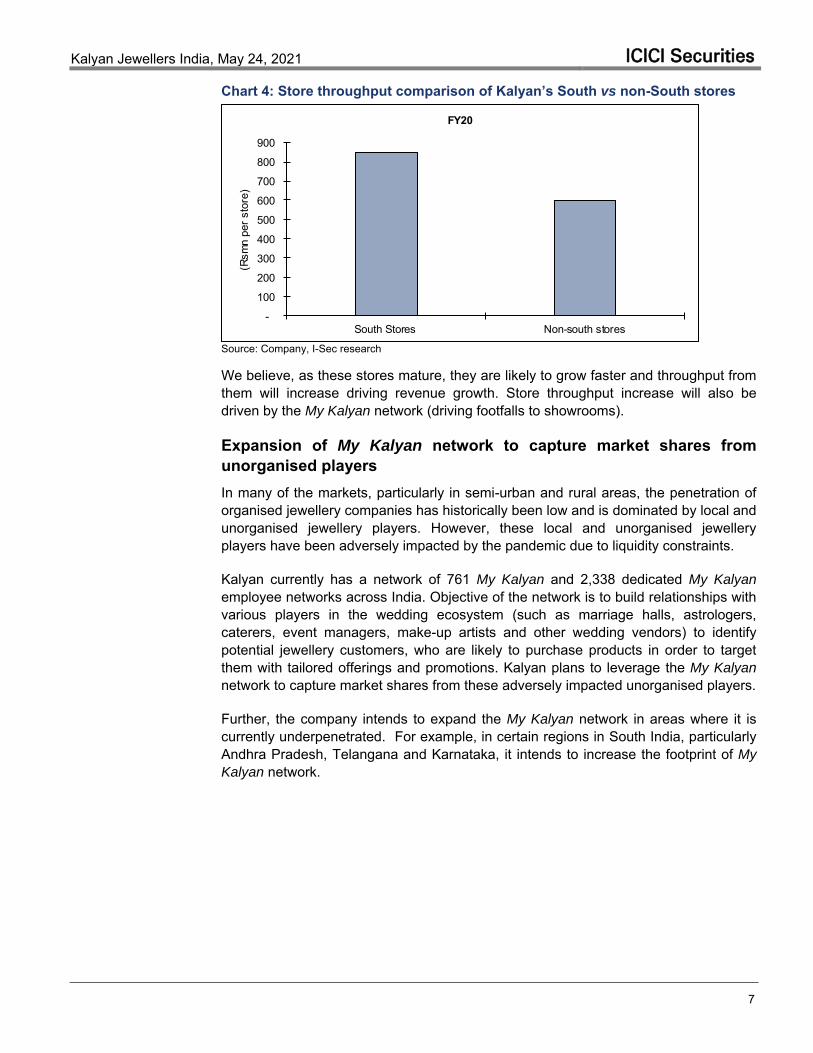
Improvement in store throughput of non-South showrooms As at 31st Mar’21, 43 of 107 showrooms were located outside of South India (includes Kerala, Tamil Nadu, Andhra Pradesh, Telangana, Pondicherry and Karnataka). Most of these non-South stores have opened in past few years. Non-South stores contributed ~33% of India revenues in FY20. Store throughput of these non-South stores (~Rs6bn in FY20) is much lower vis-à-vis South India based stores (~Rs8.5bn).
Kalyan Jewellers India, May 24, 2021 ICICI Securities
7
Chart 4: Store throughput comparison of Kalyan’s South vs non-South stores
-
100
200
300
400
500
600
700
800
900
South Stores Non-south stores
(Rsm
n pe
r sto
re)
FY20
Source: Company, I-Sec research We believe, as these stores mature, they are likely to grow faster and throughput from them will increase driving revenue growth. Store throughput increase will also be driven by the My Kalyan network (driving footfalls to showrooms).
Expansion of My Kalyan network to capture market shares from unorganised players In many of the markets, particularly in semi-urban and rural areas, the penetration of organised jewellery companies has historically been low and is dominated by local and unorganised jewellery players. However, these local and unorganised jewellery players have been adversely impacted by the pandemic due to liquidity constraints.
Kalyan currently has a network of 761 My Kalyan and 2,338 dedicated My Kalyan employee networks across India. Objective of the network is to build relationships with various players in the wedding ecosystem (such as marriage halls, astrologers, caterers, event managers, make-up artists and other wedding vendors) to identify potential jewellery customers, who are likely to purchase products in order to target them with tailored offerings and promotions. Kalyan plans to leverage the My Kalyan network to capture market shares from these adversely impacted unorganised players.
Further, the company intends to expand the My Kalyan network in areas where it is currently underpenetrated. For example, in certain regions in South India, particularly Andhra Pradesh, Telangana and Karnataka, it intends to increase the footprint of My
Kalyan network.
Kalyan Jewellers India, May 24, 2021 ICICI Securities
8
Competitive advantages for Kalyan Jewellers Kalyan Jewellers (Kalyan) has continued to strengthen its competitive advantages over the past decade.
Established and trusted brand The Indian jewelry industry has largely been unorganized and fragmented, comprising more than 500,000 local goldsmiths and jewellers. Customers have historically struggled with a lack of transparency embedded in the purchase process for jewelry, finding it difficult to verify gold purity and weight and to deconstruct the various components of jewelry prices, including differentiating between raw material costs and jeweler mark-ups or making charges.
Kalyan has built a strong brand in the Indian jewelry market that customers associate with trust and transparency. It is among the pioneers in the Indian jewelry market in: a) educating consumers about the above-mentioned industry issues; b) instituting the highest quality standards for jewelry; and c) introducing complete price transparency with their products. The initiatives, coupled with concurrent customer education and awareness campaigns, particularly through the My Kalyan network, have helped strengthen the brand by building customer trust and promoting transparency.
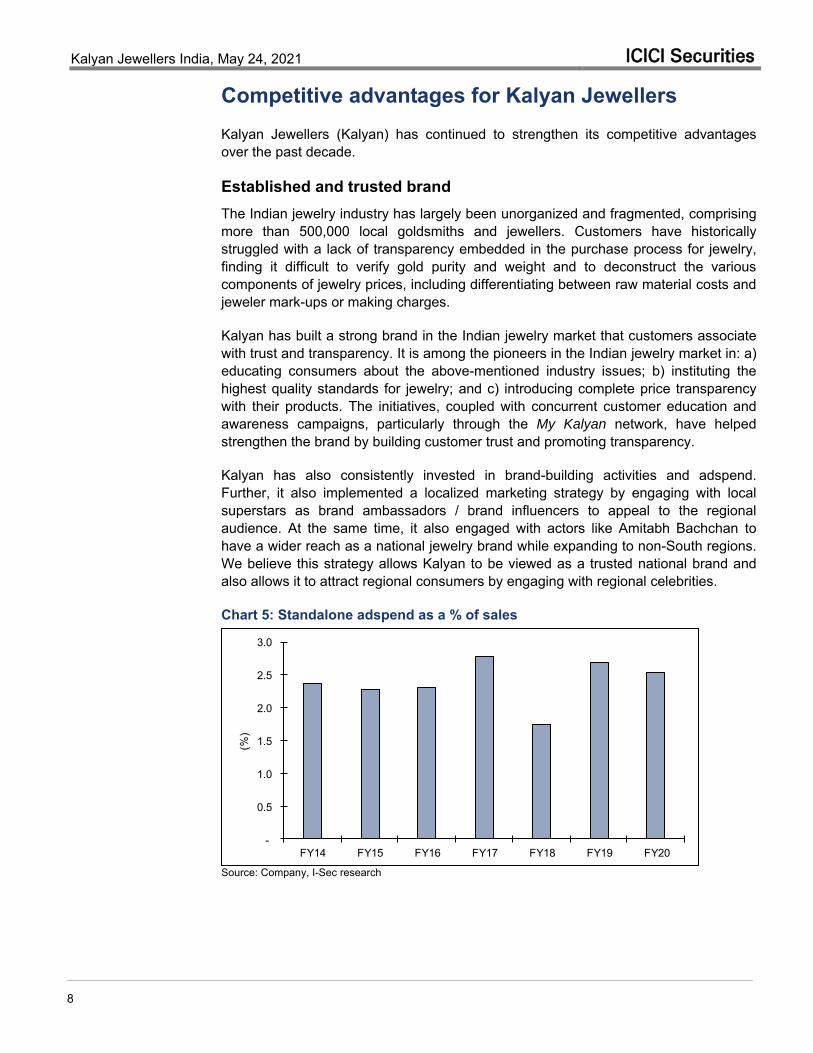
Kalyan has also consistently invested in brand-building activities and adspend. Further, it also implemented a localized marketing strategy by engaging with local superstars as brand ambassadors / brand influencers to appeal to the regional audience. At the same time, it also engaged with actors like Amitabh Bachchan to have a wider reach as a national jewelry brand while expanding to non-South regions. We believe this strategy allows Kalyan to be viewed as a trusted national brand and also allows it to attract regional consumers by engaging with regional celebrities.
Chart 5: Standalone adspend as a % of sales
-
0.5
1.0
1.5
2.0
2.5
3.0
FY14 FY15 FY16 FY17 FY18 FY19 FY20
(%)
Source: Company, I-Sec research
Kalyan Jewellers India, May 24, 2021 ICICI Securities
9
Hyperlocal strategy to cover wide range of geographies and customer segments Jewelry consumption patterns in India are highly localized with customer preferences varying significantly by region. This industry characteristic has acted as a significant barrier for jewelry brands to scale up in India as it demands: i) a nuanced understanding of local customer needs, ii) region-specific procurement and inventory models which require operating at sufficient scale to attract the best artisans, and iii) significant investments in localized and region-specific marketing campaigns to build awareness and trust with consumers. Kalyan appeals to a broad base of customers via its hyperlocal strategy by deploying the following initiatives in operations:
Localisation of product portfolio: Kalyan offers a range of jewellery products in its showrooms tailored to regional tastes and trends. Prior to entering a market, it conducts extensive research to understand local preferences as well as study the jewellery offerings of incumbent jewellers in the relevant market. It also engages third-party local artisans as contract manufacturers across markets to manufacture jewellery with localised designs in line with the preferences identified based on research. Within India, the company have 13 procurement centres across key jewellery manufacturing regions of the country that enables it to access local artisans at competitive rates.
Localisation in brand communication and marketing: Region-specific marketing efforts, including state and city-specific brand campaigns with differentiated, localised creative content and the use of various relevant brand ambassadors with national, regional and local appeal, is a core element of brand positioning. Kalyan selects regional and local creative agencies in the markets in which it operates to tailor the marketing and the medium of communication to suit local preferences.
Localisation of showroom experience for customers: Localisation strategy supported by a policy of hiring personnel for each of the showrooms with local language and cultural knowledge, as well as practice of designing showrooms to reflect local tastes and sensibilities.
Localisation through My Kalyan network: Hire My Kalyan employees from the communities the company serves, and with relevant language skills and local relationships. Through a strategy of catering to local preferences, Kalyan plans to compete with both unorganised and organised jewellers locally by establishing customer rapport.
Localisation strategy, combined with large scale of operations, allows the company to cater to a wide range of customers across geographies, age groups, socio-economic statuses and genders as well as across urban, rural and semi-urban markets, all of which greatly widens appeal and addressability to broad segments of jewellery consumers across India.
Kalyan Jewellers India, May 24, 2021 ICICI Securities
10
My Kalyan network with strong distribution capabilities enabling deep customer outreach My Kalyan customer outreach network consists of multiple smaller centres that serve as satellite locations situated in a wide radius around most showrooms. On an average, there are approximately seven My Kalyan locations per showroom. As at 30th Jun’20, Kalyan had 761 My Kalyan locations and 2,338 dedicated My Kalyan employees located across 21 states and Union Territories in India. Kalyan generally hires My Kalyan employees from the communities which it serves, and with local language skills and relationships.
My Kalyan employees build relationships with various players in the wedding ecosystem (such as marriage halls, astrologers, caterers, event managers, make-up artists and other wedding vendors) to identify potential jewellery customers, who are likely to purchase products, in order to target them with tailored offerings and promotions.
My Kalyan network has been an important tool in boosting the sales productivity of showrooms and increasing enrolment of purchase advance schemes. The network contributed ~17% of revenues in India and ~31% of the enrolment to purchase advance schemes in India in FY20. Through My Kalyan network, Kalyan has been able to enter rural and semi-urban markets in India that often have limited exposure to organised jewellery companies, hence are typically served by long-established local and unorganised jewellers.
We believe My Kalyan network provides a strategic advantage to the company, which no other jewellery company currently has. Further, we believe it will take significant investment and time to build such a network by any other jewellery company, which again provides Kalyan the first-mover advantage even if some other large jewellery company tries to replicate it. However, there were some executional issues that Kalyan faced in FY19, which according to the company has now been rectified.
Kalyan Jewellers India, May 24, 2021 ICICI Securities
11
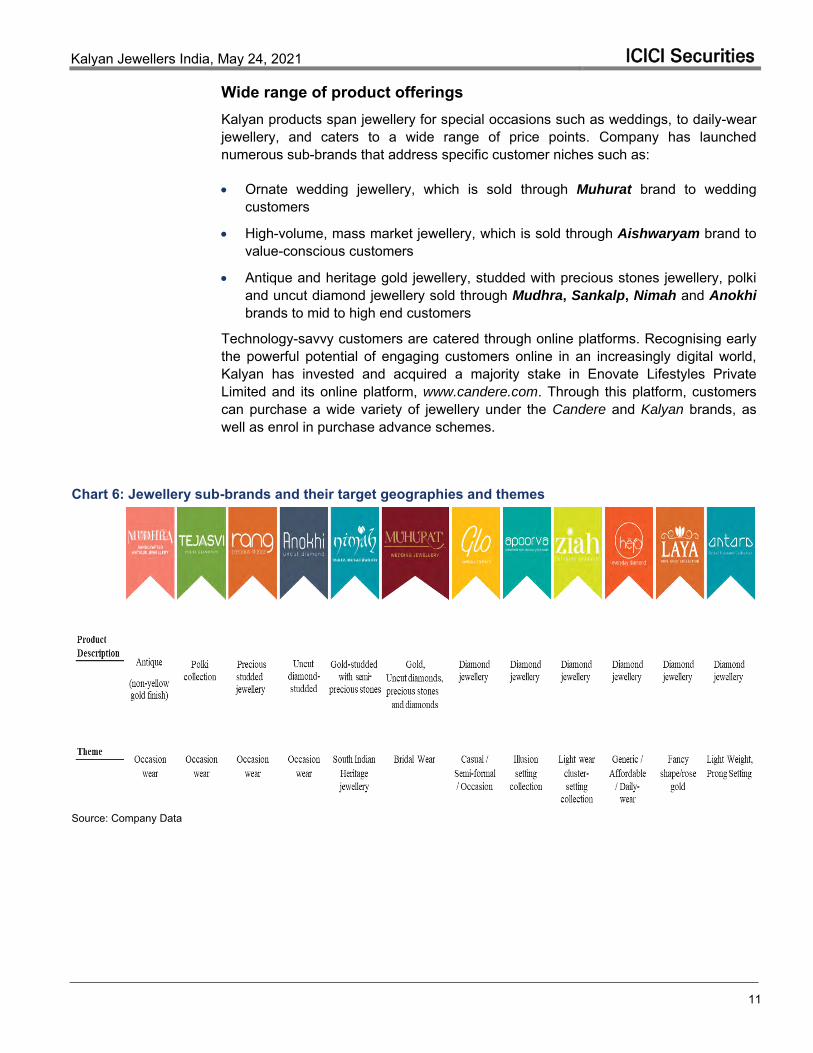
Wide range of product offerings Kalyan products span jewellery for special occasions such as weddings, to daily-wear jewellery, and caters to a wide range of price points. Company has launched numerous sub-brands that address specific customer niches such as:
Ornate wedding jewellery, which is sold through Muhurat brand to wedding customers
High-volume, mass market jewellery, which is sold through Aishwaryam brand to value-conscious customers
Antique and heritage gold jewellery, studded with precious stones jewellery, polki and uncut diamond jewellery sold through Mudhra, Sankalp, Nimah and Anokhi brands to mid to high end customers
Technology-savvy customers are catered through online platforms. Recognising early the powerful potential of engaging customers online in an increasingly digital world, Kalyan has invested and acquired a majority stake in Enovate Lifestyles Private Limited and its online platform, www.candere.com. Through this platform, customers can purchase a wide variety of jewellery under the Candere and Kalyan brands, as well as enrol in purchase advance schemes.
Chart 6: Jewellery sub-brands and their target geographies and themes
Source: Company Data
Kalyan Jewellers India, May 24, 2021 ICICI Securities
12
Growth strategy Kalyan Jewellers (Kalyan) is working on a multi-pronged growth strategy. It plans to expand its showroom network across India and widen its product offerings by introducing more sub-brands to target both specific customer niches and as well as the luxury market focused on high-end gold and studded jewellery. It also plans to focus on gaining market shares in key regions. Company aims to invest further in the My Kalyan network to expand its customer reach.
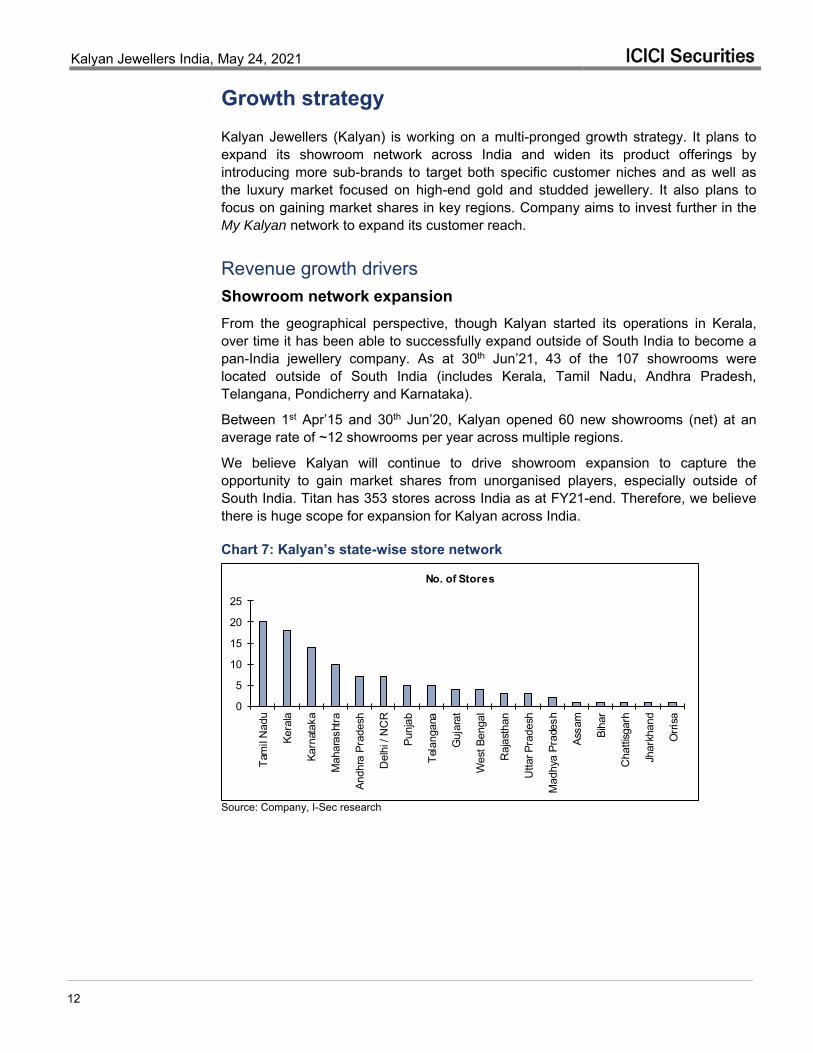
Revenue growth drivers Showroom network expansion From the geographical perspective, though Kalyan started its operations in Kerala, over time it has been able to successfully expand outside of South India to become a pan-India jewellery company. As at 30th Jun’21, 43 of the 107 showrooms were located outside of South India (includes Kerala, Tamil Nadu, Andhra Pradesh, Telangana, Pondicherry and Karnataka).
Between 1st Apr’15 and 30th Jun’20, Kalyan opened 60 new showrooms (net) at an average rate of ~12 showrooms per year across multiple regions. We believe Kalyan will continue to drive showroom expansion to capture the opportunity to gain market shares from unorganised players, especially outside of South India. Titan has 353 stores across India as at FY21-end. Therefore, we believe there is huge scope for expansion for Kalyan across India.
Chart 7: Kalyan’s state-wise store network
0
5
10
15
20
25
Tam
il N
adu
Kera
la
Karn
atak
a
Mah
aras
htra
Andh
ra P
rade
sh
Del
hi /
NC
R
Punj
ab
Tela
ngan
a
Guj
arat
Wes
t Ben
gal
Raj
asth
an
Utta
r Pra
desh
Mad
hya
Prad
esh
Assa
m
Biha
r
Cha
ttisg
arh
Jhar
khan
d
Orri
sa
No. of Stores
Source: Company, I-Sec research
Kalyan Jewellers India, May 24, 2021 ICICI Securities
13
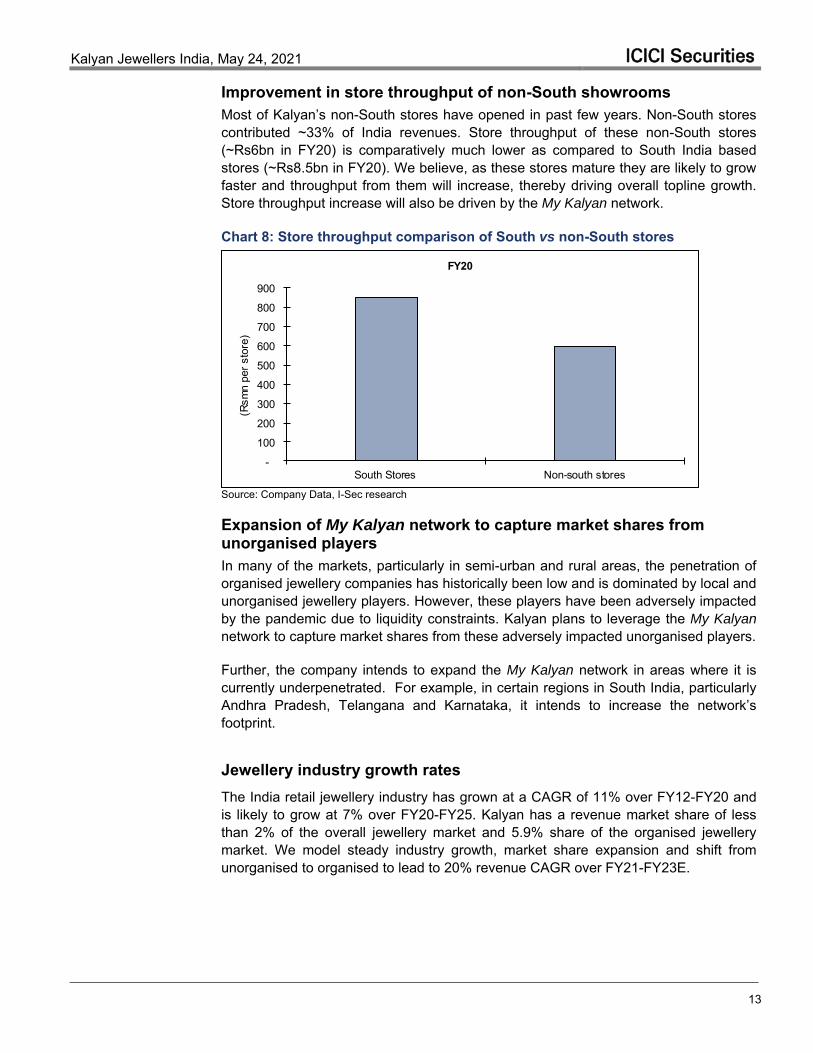
Improvement in store throughput of non-South showrooms Most of Kalyan’s non-South stores have opened in past few years. Non-South stores contributed ~33% of India revenues. Store throughput of these non-South stores (~Rs6bn in FY20) is comparatively much lower as compared to South India based stores (~Rs8.5bn in FY20). We believe, as these stores mature they are likely to grow faster and throughput from them will increase, thereby driving overall topline growth. Store throughput increase will also be driven by the My Kalyan network.
Chart 8: Store throughput comparison of South vs non-South stores
-
100
200
300
400
500
600
700
800
900
South Stores Non-south stores
(Rsm
n pe
r sto
re)
FY20
Source: Company Data, I-Sec research
Expansion of My Kalyan network to capture market shares from unorganised players In many of the markets, particularly in semi-urban and rural areas, the penetration of organised jewellery companies has historically been low and is dominated by local and unorganised jewellery players. However, these players have been adversely impacted by the pandemic due to liquidity constraints. Kalyan plans to leverage the My Kalyan network to capture market shares from these adversely impacted unorganised players.
Further, the company intends to expand the My Kalyan network in areas where it is currently underpenetrated. For example, in certain regions in South India, particularly Andhra Pradesh, Telangana and Karnataka, it intends to increase the network’s footprint.
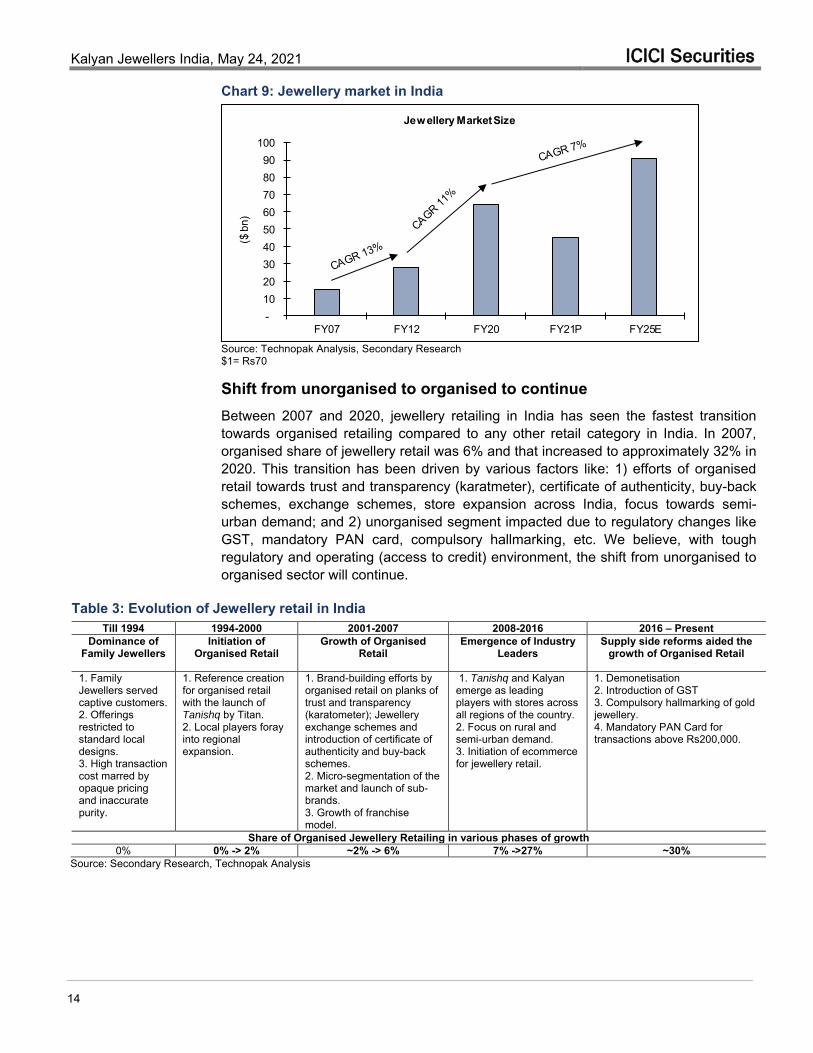
Jewellery industry growth rates The India retail jewellery industry has grown at a CAGR of 11% over FY12-FY20 and is likely to grow at 7% over FY20-FY25. Kalyan has a revenue market share of less than 2% of the overall jewellery market and 5.9% share of the organised jewellery market. We model steady industry growth, market share expansion and shift from unorganised to organised to lead to 20% revenue CAGR over FY21-FY23E.
Kalyan Jewellers India, May 24, 2021 ICICI Securities
14
Chart 9: Jewellery market in India
- 10 20 30 40 50 60 70 80 90
100
FY07 FY12 FY20 FY21P FY25E
($ b
n)
Jewellery Market Size
Source: Technopak Analysis, Secondary Research $1= Rs70 Shift from unorganised to organised to continue Between 2007 and 2020, jewellery retailing in India has seen the fastest transition towards organised retailing compared to any other retail category in India. In 2007, organised share of jewellery retail was 6% and that increased to approximately 32% in 2020. This transition has been driven by various factors like: 1) efforts of organised retail towards trust and transparency (karatmeter), certificate of authenticity, buy-back schemes, exchange schemes, store expansion across India, focus towards semi-urban demand; and 2) unorganised segment impacted due to regulatory changes like GST, mandatory PAN card, compulsory hallmarking, etc. We believe, with tough regulatory and operating (access to credit) environment, the shift from unorganised to organised sector will continue.
Table 3: Evolution of Jewellery retail in India Till 1994 1994-2000 2001-2007 2008-2016 2016 – Present
Dominance of Family Jewellers
Initiation of Organised Retail
Growth of Organised Retail
Emergence of Industry Leaders
Supply side reforms aided the growth of Organised Retail
1. Family Jewellers served captive customers. 2. Offerings restricted to standard local designs. 3. High transaction cost marred by opaque pricing and inaccurate purity.
1. Reference creation for organised retail with the launch of Tanishq by Titan. 2. Local players foray into regional expansion.
1. Brand-building efforts by organised retail on planks of trust and transparency (karatometer); Jewellery exchange schemes and introduction of certificate of authenticity and buy-back schemes. 2. Micro-segmentation of the market and launch of sub-brands. 3. Growth of franchise model.
1. Tanishq and Kalyan emerge as leading players with stores across all regions of the country. 2. Focus on rural and semi-urban demand. 3. Initiation of ecommerce for jewellery retail.
1. Demonetisation 2. Introduction of GST 3. Compulsory hallmarking of gold jewellery. 4. Mandatory PAN Card for transactions above Rs200,000.
Share of Organised Jewellery Retailing in various phases of growth 0% 0% -> 2% ~2% -> 6% 7% ->27% ~30%
Source: Secondary Research, Technopak Analysis
Kalyan Jewellers India, May 24, 2021 ICICI Securities
15
EBITDA margin expansion drivers
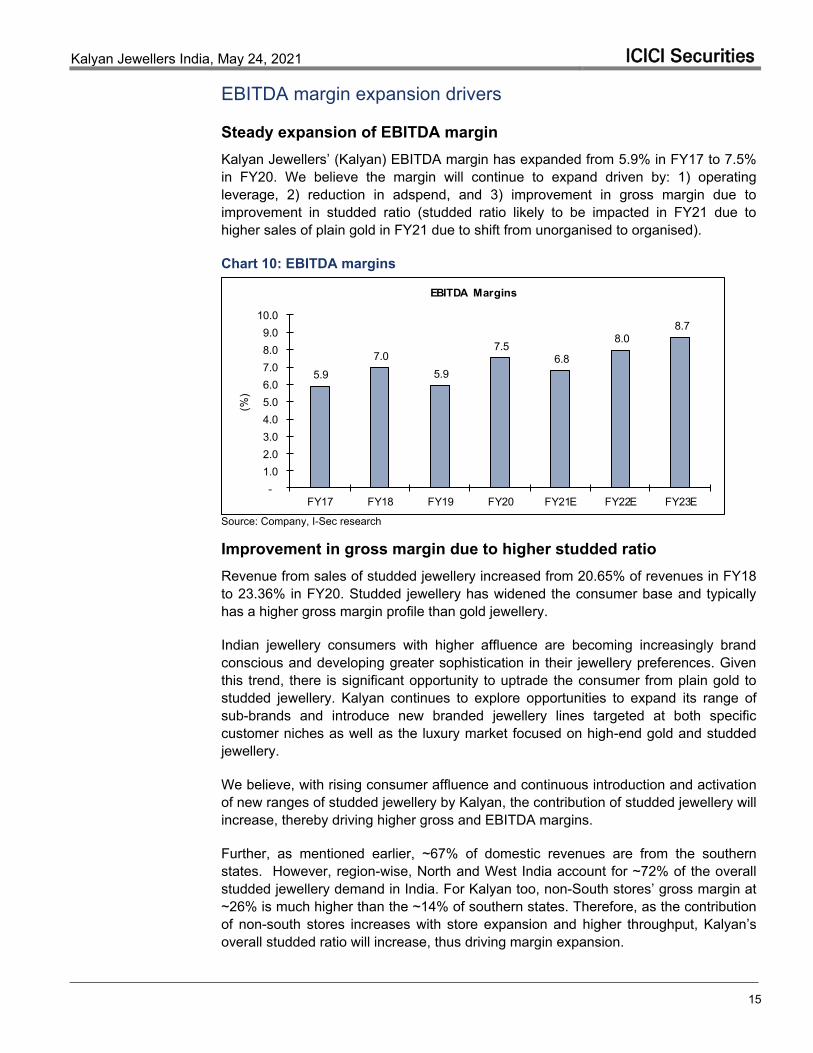
Steady expansion of EBITDA margin Kalyan Jewellers’ (Kalyan) EBITDA margin has expanded from 5.9% in FY17 to 7.5% in FY20. We believe the margin will continue to expand driven by: 1) operating leverage, 2) reduction in adspend, and 3) improvement in gross margin due to improvement in studded ratio (studded ratio likely to be impacted in FY21 due to higher sales of plain gold in FY21 due to shift from unorganised to organised).
Chart 10: EBITDA margins
5.9 7.0
5.9
7.5 6.8
8.0 8.7
- 1.0 2.0 3.0 4.0 5.0 6.0 7.0 8.0 9.0
10.0
FY17 FY18 FY19 FY20 FY21E FY22E FY23E
(%)
EBITDA Margins
Source: Company, I-Sec research Improvement in gross margin due to higher studded ratio Revenue from sales of studded jewellery increased from 20.65% of revenues in FY18 to 23.36% in FY20. Studded jewellery has widened the consumer base and typically has a higher gross margin profile than gold jewellery.
Indian jewellery consumers with higher affluence are becoming increasingly brand conscious and developing greater sophistication in their jewellery preferences. Given this trend, there is significant opportunity to uptrade the consumer from plain gold to studded jewellery. Kalyan continues to explore opportunities to expand its range of sub-brands and introduce new branded jewellery lines targeted at both specific customer niches as well as the luxury market focused on high-end gold and studded jewellery.
We believe, with rising consumer affluence and continuous introduction and activation of new ranges of studded jewellery by Kalyan, the contribution of studded jewellery will increase, thereby driving higher gross and EBITDA margins.
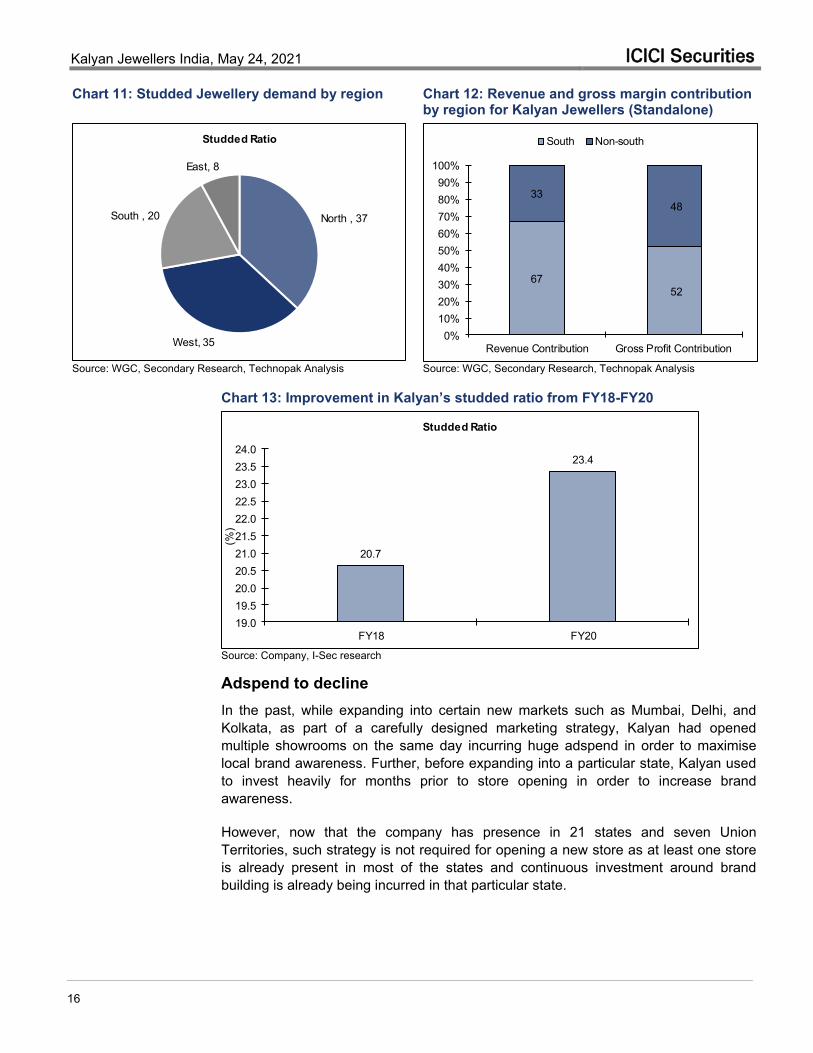
Further, as mentioned earlier, ~67% of domestic revenues are from the southern states. However, region-wise, North and West India account for ~72% of the overall studded jewellery demand in India. For Kalyan too, non-South stores’ gross margin at ~26% is much higher than the ~14% of southern states. Therefore, as the contribution of non-south stores increases with store expansion and higher throughput, Kalyan’s overall studded ratio will increase, thus driving margin expansion.
Kalyan Jewellers India, May 24, 2021 ICICI Securities
16
Chart 11: Studded Jewellery demand by region Chart 12: Revenue and gross margin contribution by region for Kalyan Jewellers (Standalone)
North , 37
West, 35
South , 20
East, 8
Studded Ratio
6752
3348
0%10%20%30%40%50%60%70%80%90%
100%
Revenue Contribution Gross Profit Contribution
South Non-south
Source: WGC, Secondary Research, Technopak Analysis
Source: WGC, Secondary Research, Technopak Analysis
Chart 13: Improvement in Kalyan’s studded ratio from FY18-FY20
20.7
23.4
19.019.520.020.521.021.522.022.523.023.524.0
FY18 FY20
(%)
Studded Ratio
Source: Company, I-Sec research Adspend to decline In the past, while expanding into certain new markets such as Mumbai, Delhi, and Kolkata, as part of a carefully designed marketing strategy, Kalyan had opened multiple showrooms on the same day incurring huge adspend in order to maximise local brand awareness. Further, before expanding into a particular state, Kalyan used to invest heavily for months prior to store opening in order to increase brand awareness.
However, now that the company has presence in 21 states and seven Union Territories, such strategy is not required for opening a new store as at least one store is already present in most of the states and continuous investment around brand building is already being incurred in that particular state.
Kalyan Jewellers India, May 24, 2021 ICICI Securities
17
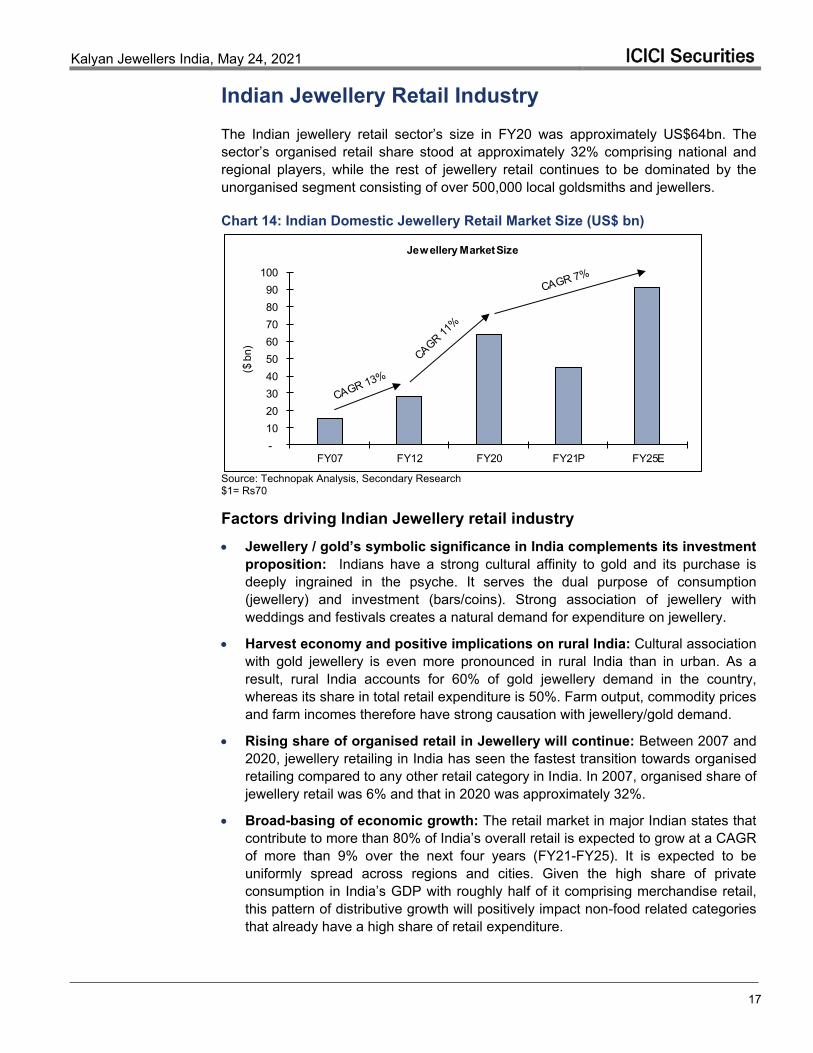
Indian Jewellery Retail Industry The Indian jewellery retail sector’s size in FY20 was approximately US$64bn. The sector’s organised retail share stood at approximately 32% comprising national and regional players, while the rest of jewellery retail continues to be dominated by the unorganised segment consisting of over 500,000 local goldsmiths and jewellers.
Chart 14: Indian Domestic Jewellery Retail Market Size (US$ bn)
- 10 20 30 40 50 60 70 80 90
100
FY07 FY12 FY20 FY21P FY25E
($ b
n)Jewellery Market Size
Source: Technopak Analysis, Secondary Research $1= Rs70 Factors driving Indian Jewellery retail industry Jewellery / gold’s symbolic significance in India complements its investment
proposition: Indians have a strong cultural affinity to gold and its purchase is deeply ingrained in the psyche. It serves the dual purpose of consumption (jewellery) and investment (bars/coins). Strong association of jewellery with weddings and festivals creates a natural demand for expenditure on jewellery.
Harvest economy and positive implications on rural India: Cultural association with gold jewellery is even more pronounced in rural India than in urban. As a result, rural India accounts for 60% of gold jewellery demand in the country, whereas its share in total retail expenditure is 50%. Farm output, commodity prices and farm incomes therefore have strong causation with jewellery/gold demand.
Rising share of organised retail in Jewellery will continue: Between 2007 and 2020, jewellery retailing in India has seen the fastest transition towards organised retailing compared to any other retail category in India. In 2007, organised share of jewellery retail was 6% and that in 2020 was approximately 32%.
Broad-basing of economic growth: The retail market in major Indian states that contribute to more than 80% of India’s overall retail is expected to grow at a CAGR of more than 9% over the next four years (FY21-FY25). It is expected to be uniformly spread across regions and cities. Given the high share of private consumption in India’s GDP with roughly half of it comprising merchandise retail, this pattern of distributive growth will positively impact non-food related categories that already have a high share of retail expenditure.
Kalyan Jewellers India, May 24, 2021 ICICI Securities
18
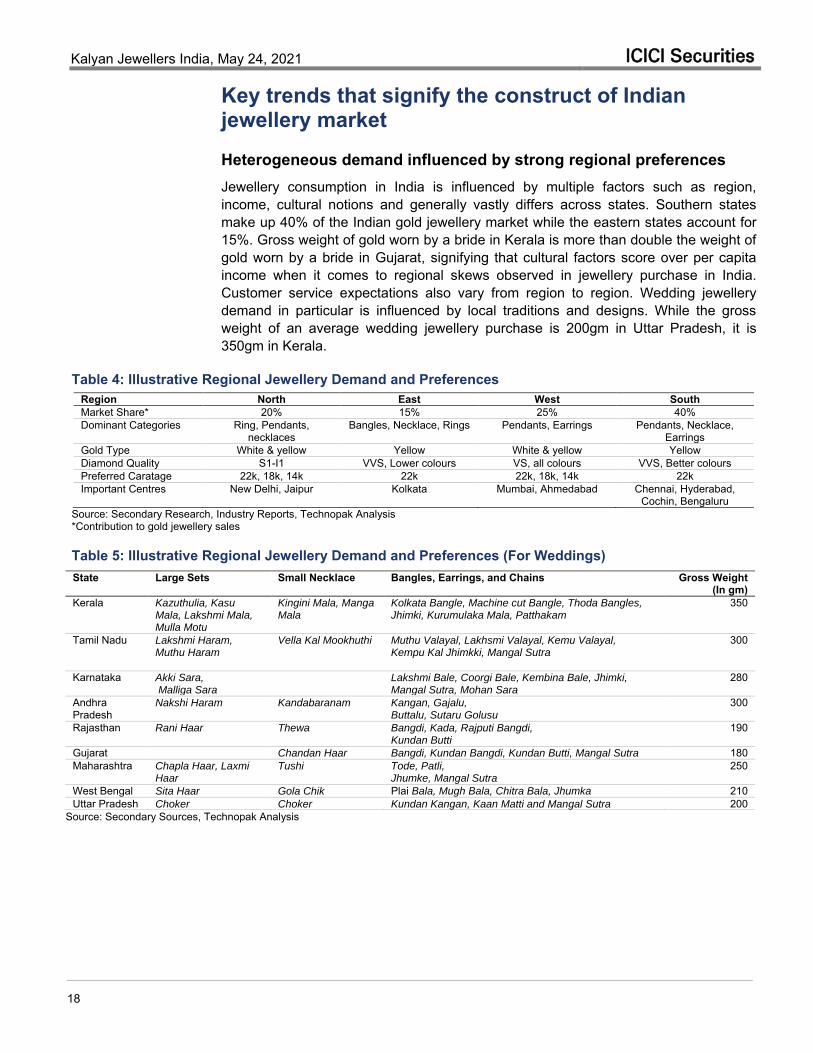
Key trends that signify the construct of Indian jewellery market Heterogeneous demand influenced by strong regional preferences Jewellery consumption in India is influenced by multiple factors such as region, income, cultural notions and generally vastly differs across states. Southern states make up 40% of the Indian gold jewellery market while the eastern states account for 15%. Gross weight of gold worn by a bride in Kerala is more than double the weight of gold worn by a bride in Gujarat, signifying that cultural factors score over per capita income when it comes to regional skews observed in jewellery purchase in India. Customer service expectations also vary from region to region. Wedding jewellery demand in particular is influenced by local traditions and designs. While the gross weight of an average wedding jewellery purchase is 200gm in Uttar Pradesh, it is 350gm in Kerala.
Table 4: Illustrative Regional Jewellery Demand and Preferences Region North East West South Market Share* 20% 15% 25% 40% Dominant Categories Ring, Pendants,
necklaces Bangles, Necklace, Rings Pendants, Earrings Pendants, Necklace,
Earrings Gold Type White & yellow Yellow White & yellow Yellow Diamond Quality S1-I1 VVS, Lower colours VS, all colours VVS, Better colours Preferred Caratage 22k, 18k, 14k 22k 22k, 18k, 14k 22k Important Centres New Delhi, Jaipur Kolkata Mumbai, Ahmedabad Chennai, Hyderabad,
Cochin, Bengaluru Source: Secondary Research, Industry Reports, Technopak Analysis *Contribution to gold jewellery sales
Table 5: Illustrative Regional Jewellery Demand and Preferences (For Weddings)
Source: Secondary Sources, Technopak Analysis
State Large Sets Small Necklace Bangles, Earrings, and Chains Gross Weight (In gm)
Kerala Kazuthulia, Kasu Mala, Lakshmi Mala, Mulla Motu
Kingini Mala, Manga Mala
Kolkata Bangle, Machine cut Bangle, Thoda Bangles, Jhimki, Kurumulaka Mala, Patthakam
350
Tamil Nadu
Lakshmi Haram, Muthu Haram
Vella Kal Mookhuthi
Muthu Valayal, Lakhsmi Valayal, Kemu Valayal, Kempu Kal Jhimkki, Mangal Sutra
300
Karnataka
Akki Sara, Malliga Sara
Lakshmi Bale, Coorgi Bale, Kembina Bale, Jhimki, Mangal Sutra, Mohan Sara
280
Andhra Pradesh
Nakshi Haram Kandabaranam Kangan, Gajalu, Buttalu, Sutaru Golusu
300
Rajasthan Rani Haar Thewa
Bangdi, Kada, Rajputi Bangdi, Kundan Butti
190
Gujarat Chandan Haar Bangdi, Kundan Bangdi, Kundan Butti, Mangal Sutra 180 Maharashtra
Chapla Haar, Laxmi Haar
Tushi Tode, Patli, Jhumke, Mangal Sutra
250
West Bengal Sita Haar Gola Chik Plai Bala, Mugh Bala, Chitra Bala, Jhumka 210 Uttar Pradesh Choker Choker Kundan Kangan, Kaan Matti and Mangal Sutra 200
Kalyan Jewellers India, May 24, 2021 ICICI Securities
19
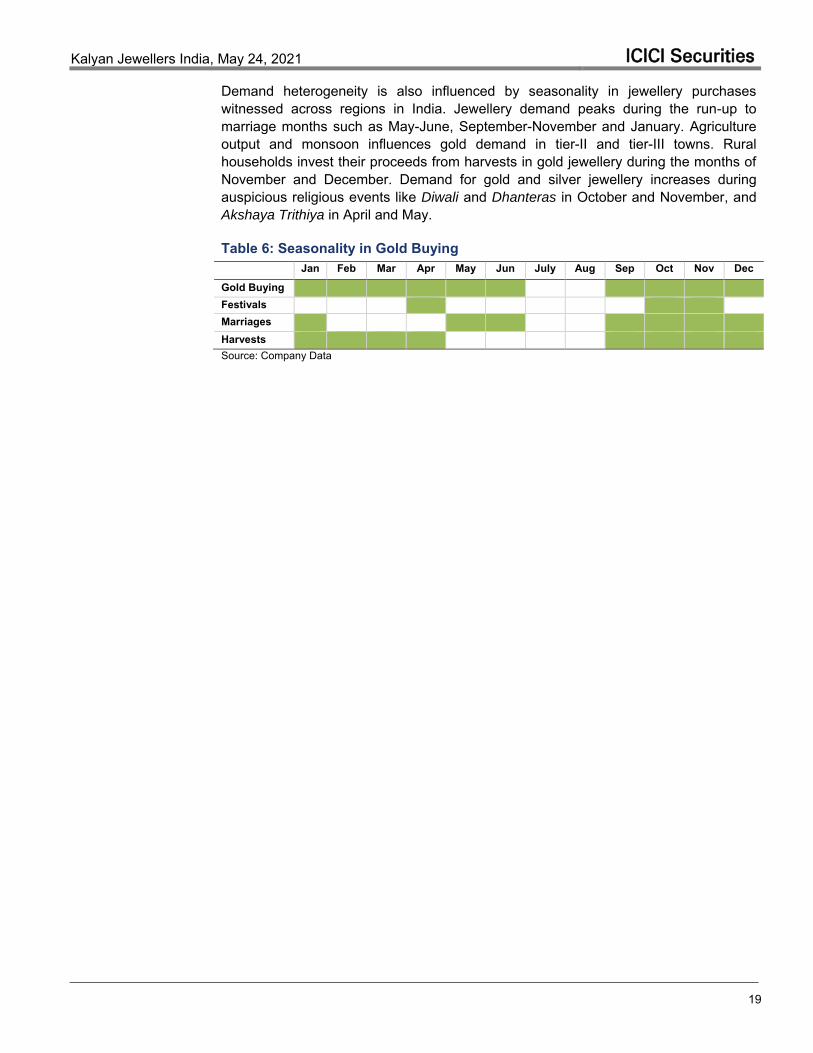
Demand heterogeneity is also influenced by seasonality in jewellery purchases witnessed across regions in India. Jewellery demand peaks during the run-up to marriage months such as May-June, September-November and January. Agriculture output and monsoon influences gold demand in tier-II and tier-III towns. Rural households invest their proceeds from harvests in gold jewellery during the months of November and December. Demand for gold and silver jewellery increases during auspicious religious events like Diwali and Dhanteras in October and November, and Akshaya Trithiya in April and May.
Table 6: Seasonality in Gold Buying Jan Feb Mar Apr May Jun July Aug Sep Oct Nov Dec
Gold Buying
Festivals Marriages
Harvests Source: Company Data
Kalyan Jewellers India, May 24, 2021 ICICI Securities
20
Accelerated growth of Organised Jewellery Retail
Demand-side factors
Urbanisation and migration: Rapid urbanisation have led to new arrivals and formation of new households in metros, cities and towns. Migrating consumers’ association with their family jewellers has thus been disrupted and they rely on trusted brands that can offer transparency, purity and designs.
India Demographics: India has more than 65% of its population under 35 years of age and more than 229mn women aged 20-49 years. Though gold-based wedding and daily jewellery continue to remain the main component of their demand, these consumers are influenced by global trends too and seek studded jewellery, better designs and triggers for purchases that average out through the year (for instance gifting).
Price transparency and product quality: Indian jewellery consumers are becoming increasingly brand conscious and developing greater sophistication in their jewellery preferences. Players like Tanishq and Kalyan were among the pioneers in the Indian jewellery market in adhering to the highest quality standards for jewellery and introducing price transparency in their products.
Service expectations: Jewellery represents an asset with lifetime ownership and tacitly acts as an investment asset. Therefore, consumers now expect jewellery purchases to be amply supported by after-sales service like product buyback at fair market price, transparency in billing and product customisation, among others. Such demands necessitate services to accompany product retailing and organised players are better placed to bundle them to address this need.
Impact of promotional campaigns and sustained brand-building effort: Organised jewellery retailing has been on a sustained brand-building trajectory since year 2000. Jewellery retailers now adopt a multi-pronged marketing approach that leverages social media, print, television, PR and radio. Organised retailers have successfully used this approach to educate customers about purity, transparency and trust to build their brands and that has helped them capture the growing incremental demand.
Retailing experience: Organised jewellery retailing today signifies readymade ornaments, wide product range that offers designs and selection, and a superior showroom experience that harmonises well with the changing expectations of the consumers. Ability to offer a better retailing experience has therefore shifted jewellery consumption demand in its favour.
Response to covid: Given greater awareness of safety and security, consumer desire for safer shopping experience with more space, hygienic conditions, well-trained store personnel and robust systems/processes that ensure a safe retail experience will also benefit organised jewellers. Consumers will continue to avoid going to crowded areas where many unorganised players typically have their outlets.
Kalyan Jewellers India, May 24, 2021 ICICI Securities
21
Supply-side factors Demonetisation: This led to the adoption of plastic/digital money in the jewellery
sector. The adoption of cashless transactions has brought in further transparency into the sector. Demonetisation helped organised players to further penetrate the wedding market and the high-value jewellery segment by capturing market share from unorganised players whose business was predominantly based on cash.
Goods and Services Tax (GST): With effect from 1st Jul’17, the GST brought in greater transparency in the jewellery market by enforcing tax compliance. It favours organised players that can manage prescribed processes.
Compulsory hallmarking of Gold Jewellery: Under-caratage has been a longstanding challenge for jewellery retailing in India and had provided an unfair advantage to many unorganised jewellery retailers who were not required to disclosure purity standards. Compulsory hallmarking, which will take effect from 2021, puts additional costs and process requirements on unorganised players and aims to address this issue. It will lead to a further shift of business from the unorganised to the organised jewellery segment.
Mandatory Permanent Account Number (PAN) Card: Transactions above Rs200,000 with effect from 1st Jan’16 for jewellery purchases. As per government estimates, jewellery was a major destination for undisclosed income in India. The PAN card requirement makes it compulsory to establish the identity of the buyer, which makes it difficult for unorganised retailers to operate.
Immunity to covid: The future impact of the covid crisis would depend on how immune businesses are to it. Companies that have a strong system (balance sheet strength, reliable promoters and a good product/service proposition) would continue to thrive, resulting in further consolidation of the market with these stronger players and increase in market share for them.
Kalyan Jewellers India, May 24, 2021 ICICI Securities
22
Competitive Landscape Brand Tanishq (Titan Company Limited) is the leader in the Indian Jewellery market with 3.9% share of the overall jewellery market and 12.5% of the organised sector in FY19. Kalyan Jewellers (Kalyan) had 1.8% share of the overall jewellery market and 5.9% of the organised.
Retailers in the Indian Jewellery Market Leading organised jewellery retailers have had a diversified growth trajectory till date. Players like Tanishq (Titan) and Kalyan have expanded well beyond their geographies of origin to open a large number of stores across multiple different towns and regions unlike many other organised jewellers that have remained largely focused on certain cities, states and regions.
There are players focused on one region, such as Thangamayil and Khazana in South India, PC Chandra in East India and PN Gadgil in West India, among others. A few multi-regional players such as TBZ, Malabar, Joyalukkas, PC Jeweller and Senco Gold are largely focused on certain regions, but have expanded and opened stores in other regions, although to a limited degree. Furthermore, only a handful, such as Titan and Kalyan, have established true pan-India businesses with diversified footprint across the country.
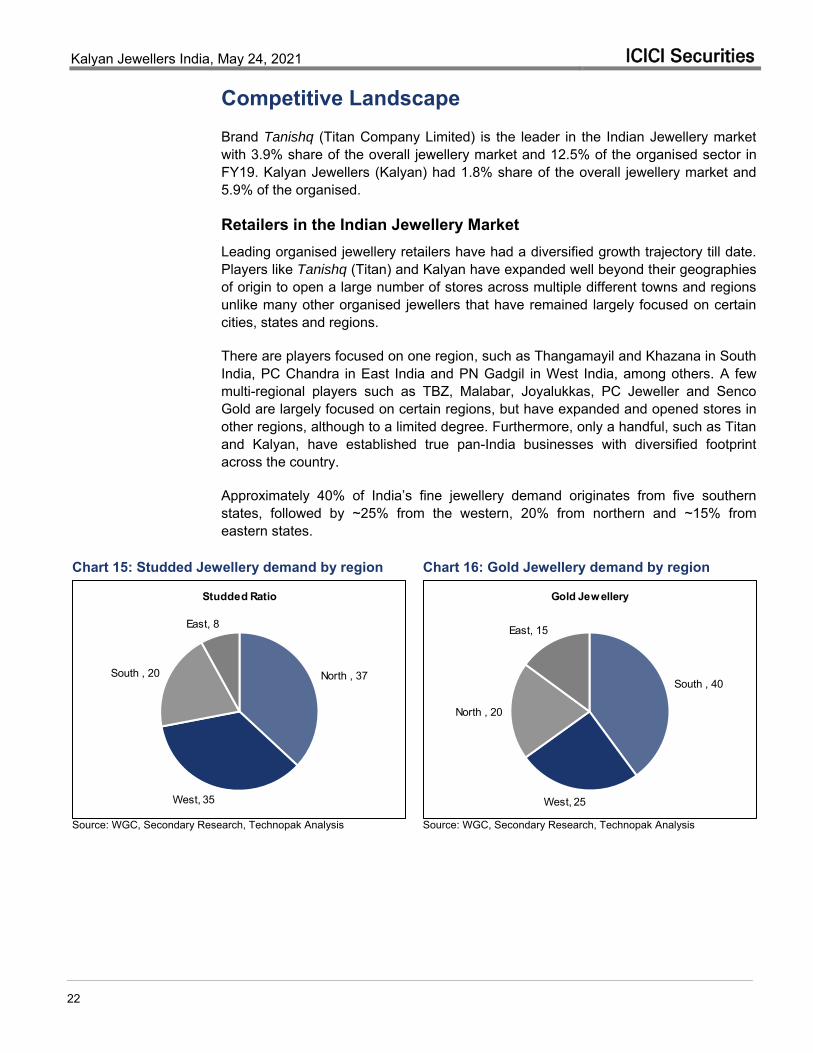
Approximately 40% of India’s fine jewellery demand originates from five southern states, followed by ~25% from the western, 20% from northern and ~15% from eastern states.
Chart 15: Studded Jewellery demand by region Chart 16: Gold Jewellery demand by region
North , 37
West, 35
South , 20
East, 8
Studded Ratio
South , 40
West, 25
North , 20
East, 15
Gold Jewellery
Source: WGC, Secondary Research, Technopak Analysis
Source: WGC, Secondary Research, Technopak Analysis
Kalyan Jewellers India, May 24, 2021 ICICI Securities
23
Organised Players: Four types of organised jewellery retail chains have emerged in India Entities with corporate lineage that have succeeded in creating a national footprint of jewellery retail stores across different regions of India. These players started with focus on metros and tier-I cities and gradually increased their presence in tier-II and tier-III cities with a mid to premium price positioning. Products offer uniform design across regions and are focused on daily and fashion wear. Tanishq by Titan is the key player in this space.
Retail chains founded by entrepreneurs operating in regional markets, which have been able to over time establish pan-India businesses. These players have traversed the journey of institutionalising their companies and professionalising their management teams, and have successfully scaled across multiple regions within India despite starting as local jewellers. Kalyan is the key player in this category.
Local jewellers that have widened their retail footprints across a specific region and whose growth is largely attributed to their focus on catering to jewellery preferences and / or price segments in a specific region. Some of these retail chains do face the challenge of growing beyond their core region to de-risk their regional dependence and, for this reason, few leading regional chains have successfully initiated expansion into other regions.
Players that have ventured into gold jewellery through online retail. These are companies that typically target high disposable income groups as their key customers. They largely focus on designer jewellery and studded jewellery, which have higher margins. These names established their brand value by online retail and have now opened retail/experience stores in metros and tier-I cities. Players like Caratlane and Bluestone are the major players in the space.
Local Players: There are two types of ‘local players’. First are destination stores of family jewellers that cater to demand in a city or a town. They have a strong focus on bridal wear and address a captive customer base from within the city and from neighbouring suburbs and towns. Second, are neighbourhood stores that cater to a restricted cluster within a city or a town. These jewellers address demand for daily wear and undertake higher share of customisation orders, but offer limited range.
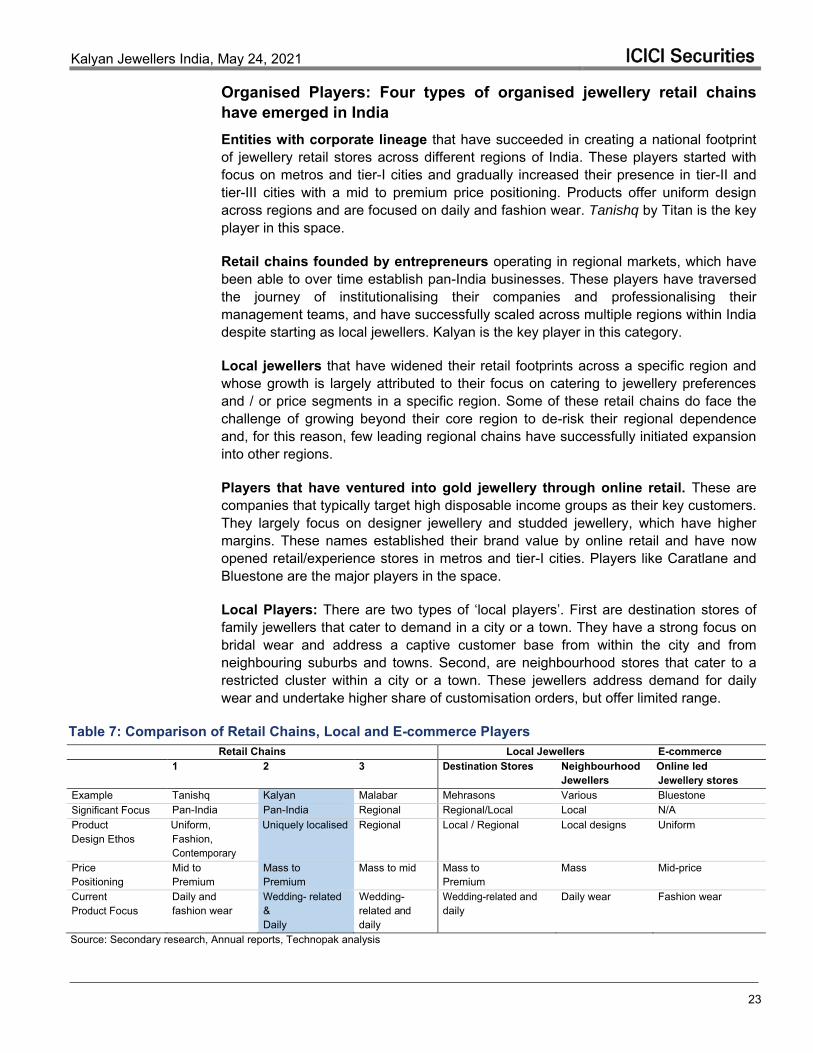
Table 7: Comparison of Retail Chains, Local and E-commerce Players Retail Chains Local Jewellers E-commerce
1 2 3 Destination Stores Neighbourhood Jewellers
Online led Jewellery stores
Example Tanishq Kalyan Malabar Mehrasons Various Bluestone Significant Focus Pan-India Pan-India Regional Regional/Local Local N/A Product Design Ethos
Uniform, Fashion, Contemporary
Uniquely localised Regional Local / Regional Local designs Uniform
Price Positioning
Mid to Premium
Mass to Premium
Mass to mid Mass to Premium
Mass Mid-price
Current Product Focus
Daily and fashion wear
Wedding- related & Daily
Wedding- related and daily
Wedding-related and daily
Daily wear Fashion wear
Source: Secondary research, Annual reports, Technopak analysis
Kalyan Jewellers India, May 24, 2021 ICICI Securities
24
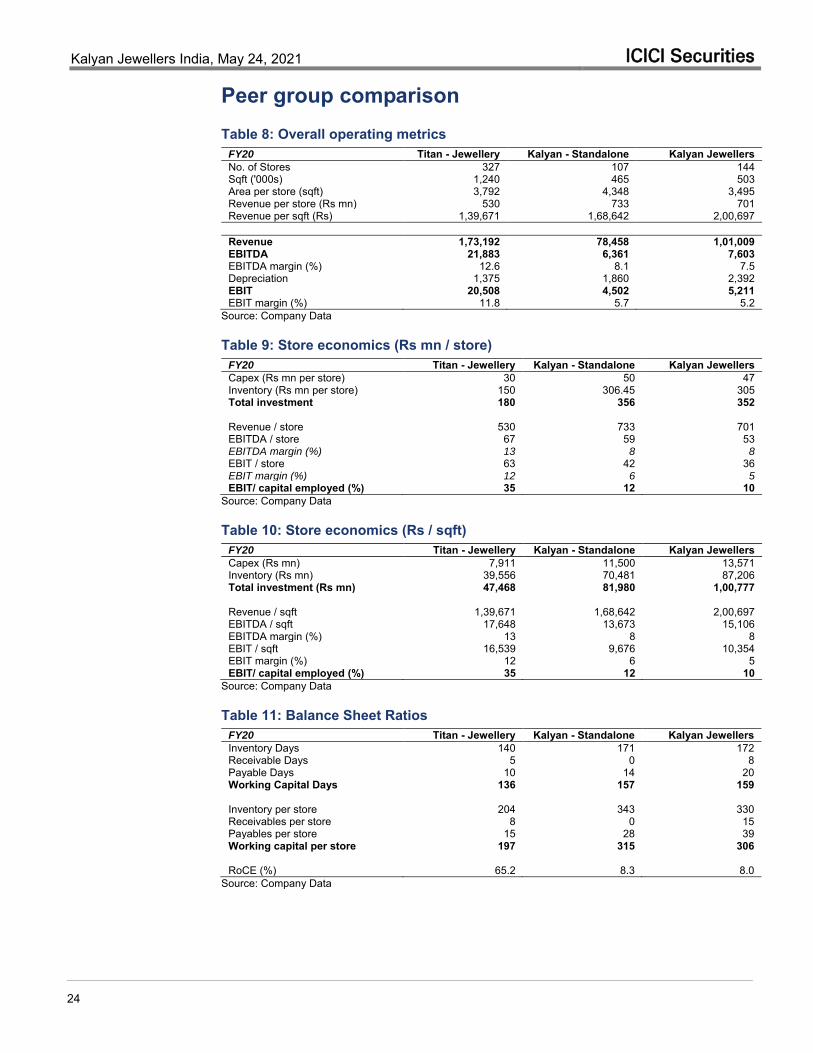
Peer group comparison Table 8: Overall operating metrics
FY20 Titan - Jewellery Kalyan - Standalone Kalyan Jewellers No. of Stores 327 107 144 Sqft ('000s) 1,240 465 503 Area per store (sqft) 3,792 4,348 3,495 Revenue per store (Rs mn) 530 733 701 Revenue per sqft (Rs) 1,39,671 1,68,642 2,00,697
Revenue 1,73,192 78,458 1,01,009 EBITDA 21,883 6,361 7,603 EBITDA margin (%) 12.6 8.1 7.5 Depreciation 1,375 1,860 2,392 EBIT 20,508 4,502 5,211 EBIT margin (%) 11.8 5.7 5.2
Source: Company Data
Table 9: Store economics (Rs mn / store) FY20 Titan - Jewellery Kalyan - Standalone Kalyan Jewellers Capex (Rs mn per store) 30 50 47 Inventory (Rs mn per store) 150 306.45 305 Total investment 180 356 352 Revenue / store 530 733 701 EBITDA / store 67 59 53 EBITDA margin (%) 13 8 8 EBIT / store 63 42 36 EBIT margin (%) 12 6 5 EBIT/ capital employed (%) 35 12 10
Source: Company Data
Table 10: Store economics (Rs / sqft) FY20 Titan - Jewellery Kalyan - Standalone Kalyan Jewellers Capex (Rs mn) 7,911 11,500 13,571 Inventory (Rs mn) 39,556 70,481 87,206 Total investment (Rs mn) 47,468 81,980 1,00,777 Revenue / sqft 1,39,671 1,68,642 2,00,697 EBITDA / sqft 17,648 13,673 15,106 EBITDA margin (%) 13 8 8 EBIT / sqft 16,539 9,676 10,354 EBIT margin (%) 12 6 5 EBIT/ capital employed (%) 35 12 10
Source: Company Data
Table 11: Balance Sheet Ratios FY20 Titan - Jewellery Kalyan - Standalone Kalyan Jewellers Inventory Days 140 171 172 Receivable Days 5 0 8 Payable Days 10 14 20 Working Capital Days 136 157 159 Inventory per store 204 343 330 Receivables per store 8 0 15 Payables per store 15 28 39 Working capital per store 197 315 306 RoCE (%) 65.2 8.3 8.0
Source: Company Data
Kalyan Jewellers India, May 24, 2021 ICICI Securities
25
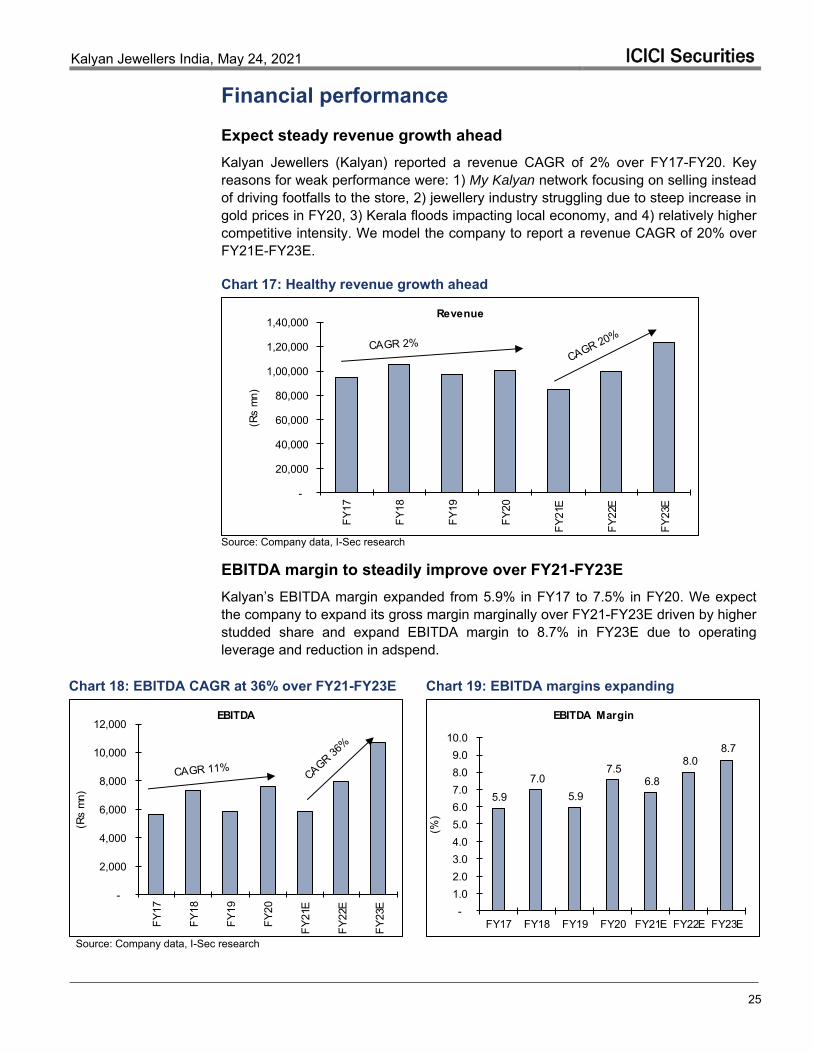
Financial performance Expect steady revenue growth ahead Kalyan Jewellers (Kalyan) reported a revenue CAGR of 2% over FY17-FY20. Key reasons for weak performance were: 1) My Kalyan network focusing on selling instead of driving footfalls to the store, 2) jewellery industry struggling due to steep increase in gold prices in FY20, 3) Kerala floods impacting local economy, and 4) relatively higher competitive intensity. We model the company to report a revenue CAGR of 20% over FY21E-FY23E.
Chart 17: Healthy revenue growth ahead
-
20,000
40,000
60,000
80,000
1,00,000
1,20,000
1,40,000
FY17
FY18
FY19
FY20
FY21
E
FY22
E
FY23
E
(Rs
mn)
Revenue
Source: Company data, I-Sec research EBITDA margin to steadily improve over FY21-FY23E Kalyan’s EBITDA margin expanded from 5.9% in FY17 to 7.5% in FY20. We expect the company to expand its gross margin marginally over FY21-FY23E driven by higher studded share and expand EBITDA margin to 8.7% in FY23E due to operating leverage and reduction in adspend.
Chart 18: EBITDA CAGR at 36% over FY21-FY23E Chart 19: EBITDA margins expanding
-
2,000
4,000
6,000
8,000
10,000
12,000
FY17
FY18
FY19
FY20
FY21
E
FY22
E
FY23
E
(Rs
mn)
EBITDA
5.9 7.0
5.9
7.5 6.8
8.0 8.7
- 1.0 2.0 3.0 4.0 5.0 6.0 7.0 8.0 9.0
10.0
FY17 FY18 FY19 FY20 FY21E FY22E FY23E
(%)
EBITDA Margin
Source: Company data, I-Sec research
Kalyan Jewellers India, May 24, 2021 ICICI Securities
26
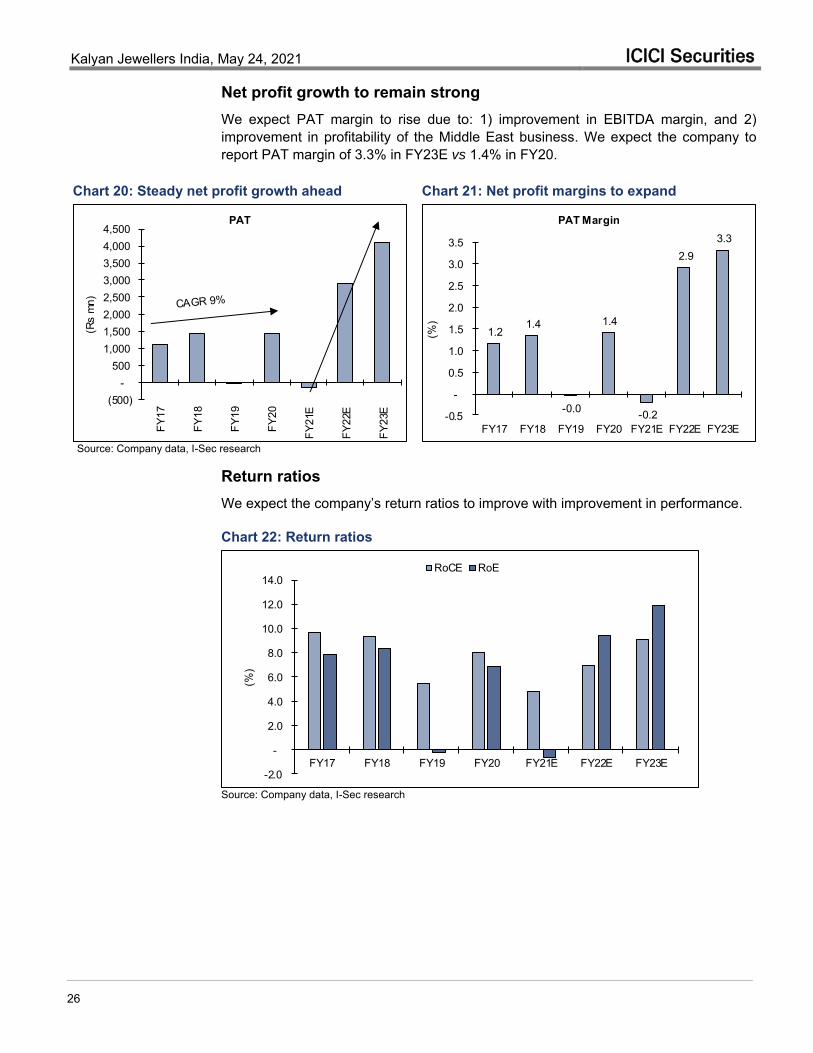
Net profit growth to remain strong We expect PAT margin to rise due to: 1) improvement in EBITDA margin, and 2) improvement in profitability of the Middle East business. We expect the company to report PAT margin of 3.3% in FY23E vs 1.4% in FY20.
Chart 20: Steady net profit growth ahead Chart 21: Net profit margins to expand
(500) -
500 1,000 1,500 2,000 2,500 3,000 3,500 4,000 4,500
FY17
FY18
FY19
FY20
FY21
E
FY22
E
FY23
E
(Rs
mn)
PAT
1.2 1.4
-0.0
1.4
-0.2
2.9 3.3
-0.5
-
0.5
1.0
1.5
2.0
2.5
3.0
3.5
FY17 FY18 FY19 FY20 FY21E FY22E FY23E(%
)
PAT Margin
Source: Company data, I-Sec research
Return ratios We expect the company’s return ratios to improve with improvement in performance.
Chart 22: Return ratios
-2.0
-
2.0
4.0
6.0
8.0
10.0
12.0
14.0
FY17 FY18 FY19 FY20 FY21E FY22E FY23E
(%)
RoCE RoE
Source: Company data, I-Sec research
Kalyan Jewellers India, May 24, 2021 ICICI Securities
27
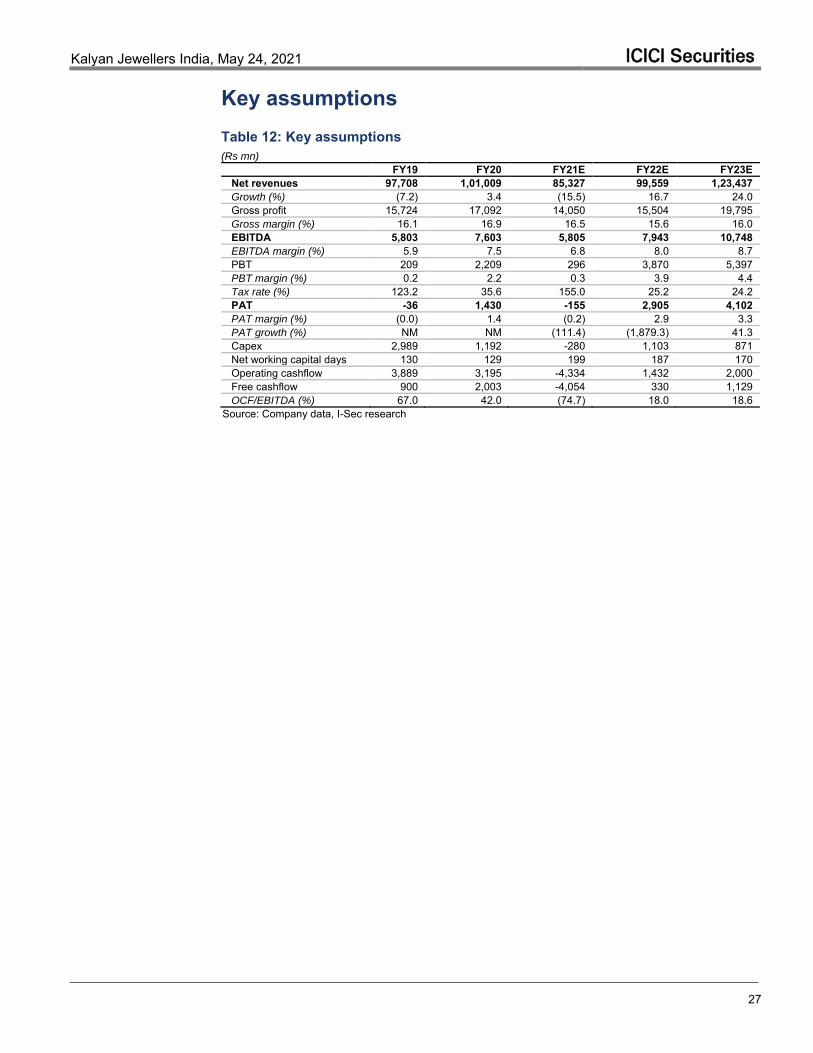
Key assumptions Table 12: Key assumptions (Rs mn)
FY19 FY20 FY21E FY22E FY23E Net revenues 97,708 1,01,009 85,327 99,559 1,23,437 Growth (%) (7.2) 3.4 (15.5) 16.7 24.0 Gross profit 15,724 17,092 14,050 15,504 19,795 Gross margin (%) 16.1 16.9 16.5 15.6 16.0 EBITDA 5,803 7,603 5,805 7,943 10,748 EBITDA margin (%) 5.9 7.5 6.8 8.0 8.7 PBT 209 2,209 296 3,870 5,397 PBT margin (%) 0.2 2.2 0.3 3.9 4.4 Tax rate (%) 123.2 35.6 155.0 25.2 24.2 PAT -36 1,430 -155 2,905 4,102 PAT margin (%) (0.0) 1.4 (0.2) 2.9 3.3 PAT growth (%) NM NM (111.4) (1,879.3) 41.3 Capex 2,989 1,192 -280 1,103 871 Net working capital days 130 129 199 187 170 Operating cashflow 3,889 3,195 -4,334 1,432 2,000 Free cashflow 900 2,003 -4,054 330 1,129 OCF/EBITDA (%) 67.0 42.0 (74.7) 18.0 18.6
Source: Company data, I-Sec research
Kalyan Jewellers India, May 24, 2021 ICICI Securities
28
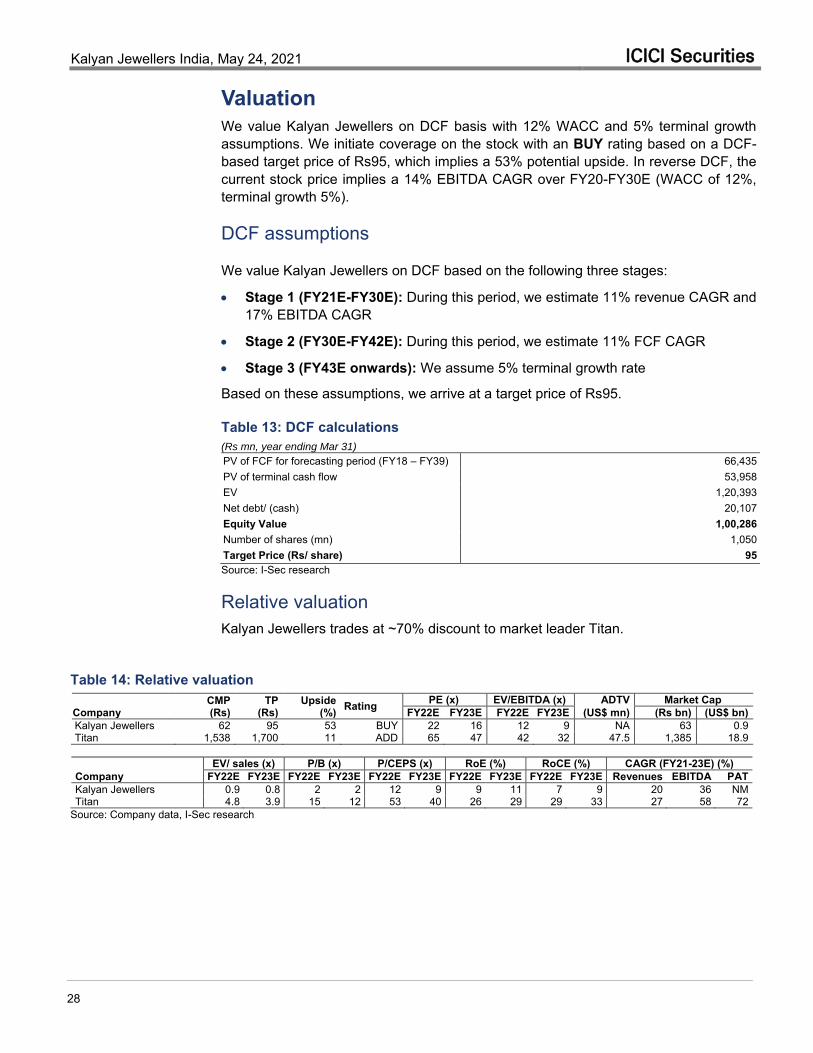
Valuation We value Kalyan Jewellers on DCF basis with 12% WACC and 5% terminal growth assumptions. We initiate coverage on the stock with an BUY rating based on a DCF-based target price of Rs95, which implies a 53% potential upside. In reverse DCF, the current stock price implies a 14% EBITDA CAGR over FY20-FY30E (WACC of 12%, terminal growth 5%).
DCF assumptions
We value Kalyan Jewellers on DCF based on the following three stages:
Stage 1 (FY21E-FY30E): During this period, we estimate 11% revenue CAGR and 17% EBITDA CAGR
Stage 2 (FY30E-FY42E): During this period, we estimate 11% FCF CAGR
Stage 3 (FY43E onwards): We assume 5% terminal growth rate
Based on these assumptions, we arrive at a target price of Rs95.
Table 13: DCF calculations (Rs mn, year ending Mar 31)
PV of FCF for forecasting period (FY18 – FY39) 66,435 PV of terminal cash flow 53,958 EV 1,20,393 Net debt/ (cash) 20,107 Equity Value 1,00,286 Number of shares (mn) 1,050 Target Price (Rs/ share) 95 Source: I-Sec research
Relative valuation Kalyan Jewellers trades at ~70% discount to market leader Titan.
Table 14: Relative valuation
Company CMP
(Rs) TP
(Rs) Upside
(%) Rating PE (x) EV/EBITDA (x) ADTV Market Cap FY22E FY23E FY22E FY23E (US$ mn) (Rs bn) (US$ bn)
Kalyan Jewellers 62 95 53 BUY 22 16 12 9 NA 63 0.9 Titan 1,538 1,700 11 ADD 65 47 42 32 47.5 1,385 18.9
EV/ sales (x) P/B (x) P/CEPS (x) RoE (%) RoCE (%) CAGR (FY21-23E) (%) Company FY22E FY23E FY22E FY23E FY22E FY23E FY22E FY23E FY22E FY23E Revenues EBITDA PAT Kalyan Jewellers 0.9 0.8 2 2 12 9 9 11 7 9 20 36 NM Titan 4.8 3.9 15 12 53 40 26 29 29 33 27 58 72
Source: Company data, I-Sec research
Kalyan Jewellers India, May 24, 2021 ICICI Securities
29
Key risks
Brand: Kalyan operates all its stores under a single brand Kalyan Jewellers. Any negative publicity tarnishing the brand image could impact operations and profitability of the business.
Steep rise in competitive pressures: Steep rise in competitive pressures by peers in a short timeframe can hurt Kalyan’s earnings.
Delays in store expansion network: Any delay in store expansion plans, or inability to renew leases of existing stores, can impact the operations and profitability of the business.
Metal gold loan regulations: Metal gold loans are subject to RBI guidelines. If there is an adverse change in regulations governing such loans, or a ban, the company will not be able to avail of these lower-interest borrowings, which may therefore impact profitability.
Fluctuation in prices, or non-availability, of gold: Any steep fluctuations in gold prices can lead to a volatile demand environment and could hit the company’s profitability.
Slowdown or higher competition in South India: Company generates ~52% of its revenues from South India. Slowdown and/or increase in competition in the region will adversely affect the company’ earnings growth.
Seasonality: Sales in certain regions have historically exhibited certain seasonal fluctuations, reflecting higher sales volumes and profit margins during festive periods and other occasions. Any particular event effecting demand during the peak season could impact the company’s profitability.
Kalyan Jewellers India, May 24, 2021 ICICI Securities
30
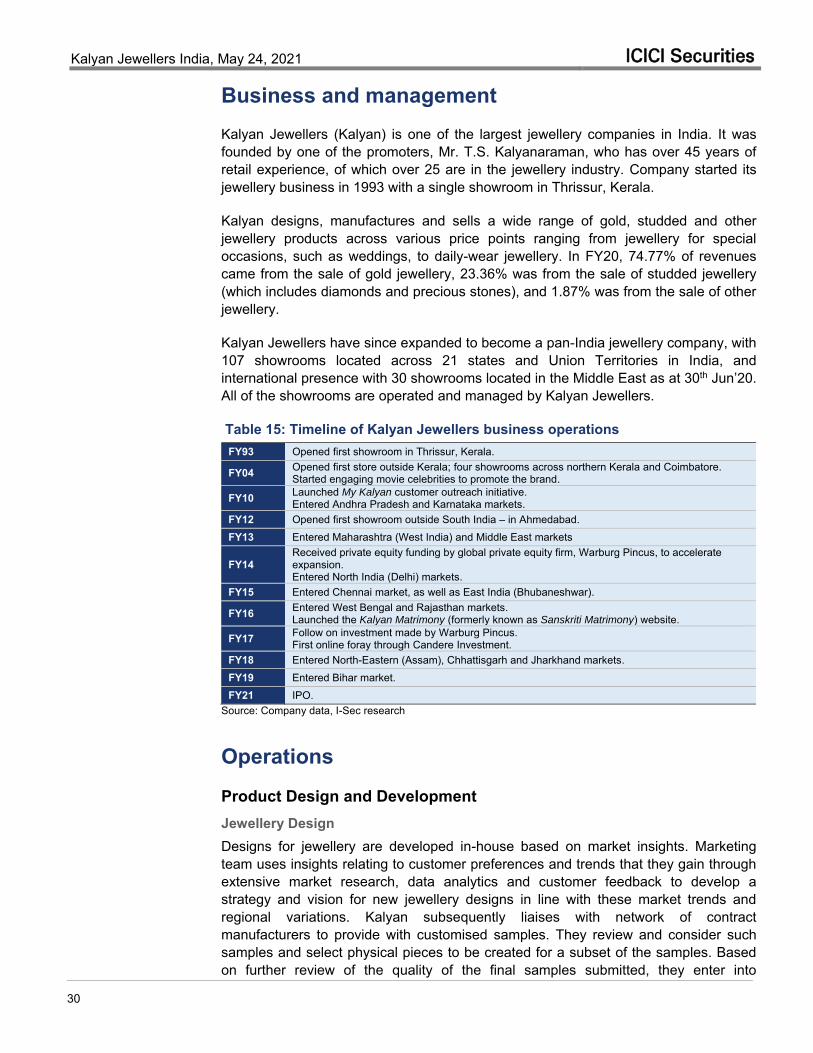
Business and management Kalyan Jewellers (Kalyan) is one of the largest jewellery companies in India. It was founded by one of the promoters, Mr. T.S. Kalyanaraman, who has over 45 years of retail experience, of which over 25 are in the jewellery industry. Company started its jewellery business in 1993 with a single showroom in Thrissur, Kerala.
Kalyan designs, manufactures and sells a wide range of gold, studded and other jewellery products across various price points ranging from jewellery for special occasions, such as weddings, to daily-wear jewellery. In FY20, 74.77% of revenues came from the sale of gold jewellery, 23.36% was from the sale of studded jewellery (which includes diamonds and precious stones), and 1.87% was from the sale of other jewellery.
Kalyan Jewellers have since expanded to become a pan-India jewellery company, with 107 showrooms located across 21 states and Union Territories in India, and international presence with 30 showrooms located in the Middle East as at 30th Jun’20. All of the showrooms are operated and managed by Kalyan Jewellers.
Table 15: Timeline of Kalyan Jewellers business operations FY93 Opened first showroom in Thrissur, Kerala.
FY04 Opened first store outside Kerala; four showrooms across northern Kerala and Coimbatore. Started engaging movie celebrities to promote the brand.
FY10 Launched My Kalyan customer outreach initiative. Entered Andhra Pradesh and Karnataka markets.
FY12 Opened first showroom outside South India – in Ahmedabad. FY13 Entered Maharashtra (West India) and Middle East markets
FY14 Received private equity funding by global private equity firm, Warburg Pincus, to accelerate expansion. Entered North India (Delhi) markets.
FY15 Entered Chennai market, as well as East India (Bhubaneshwar).
FY16 Entered West Bengal and Rajasthan markets. Launched the Kalyan Matrimony (formerly known as Sanskriti Matrimony) website.
FY17 Follow on investment made by Warburg Pincus. First online foray through Candere Investment.
FY18 Entered North-Eastern (Assam), Chhattisgarh and Jharkhand markets. FY19 Entered Bihar market. FY21 IPO.
Source: Company data, I-Sec research
Operations Product Design and Development Jewellery Design Designs for jewellery are developed in-house based on market insights. Marketing team uses insights relating to customer preferences and trends that they gain through extensive market research, data analytics and customer feedback to develop a strategy and vision for new jewellery designs in line with these market trends and regional variations. Kalyan subsequently liaises with network of contract manufacturers to provide with customised samples. They review and consider such samples and select physical pieces to be created for a subset of the samples. Based on further review of the quality of the final samples submitted, they enter into
Kalyan Jewellers India, May 24, 2021 ICICI Securities
31
agreements and/or production orders with these contract manufacturers to manufacture designs as agents, while control of the entire manufacturing process remains with Kalyan.
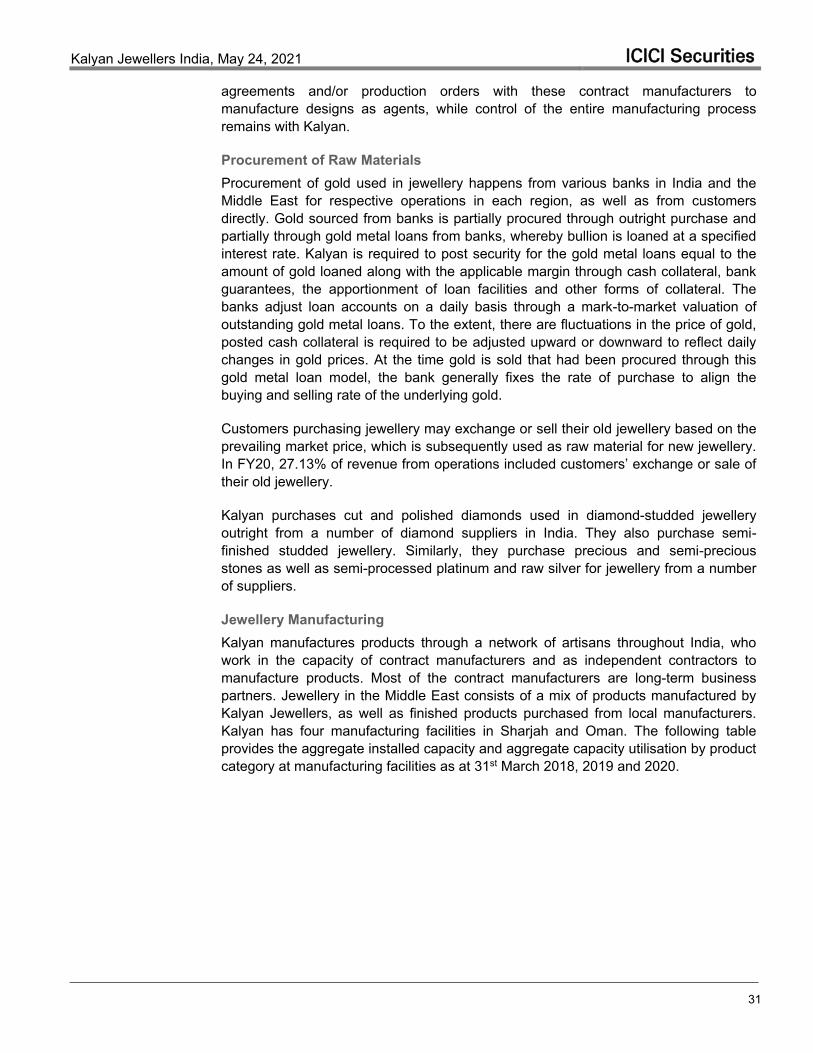
Procurement of Raw Materials Procurement of gold used in jewellery happens from various banks in India and the Middle East for respective operations in each region, as well as from customers directly. Gold sourced from banks is partially procured through outright purchase and partially through gold metal loans from banks, whereby bullion is loaned at a specified interest rate. Kalyan is required to post security for the gold metal loans equal to the amount of gold loaned along with the applicable margin through cash collateral, bank guarantees, the apportionment of loan facilities and other forms of collateral. The banks adjust loan accounts on a daily basis through a mark-to-market valuation of outstanding gold metal loans. To the extent, there are fluctuations in the price of gold, posted cash collateral is required to be adjusted upward or downward to reflect daily changes in gold prices. At the time gold is sold that had been procured through this gold metal loan model, the bank generally fixes the rate of purchase to align the buying and selling rate of the underlying gold.
Customers purchasing jewellery may exchange or sell their old jewellery based on the prevailing market price, which is subsequently used as raw material for new jewellery. In FY20, 27.13% of revenue from operations included customers’ exchange or sale of their old jewellery.
Kalyan purchases cut and polished diamonds used in diamond-studded jewellery outright from a number of diamond suppliers in India. They also purchase semi-finished studded jewellery. Similarly, they purchase precious and semi-precious stones as well as semi-processed platinum and raw silver for jewellery from a number of suppliers.
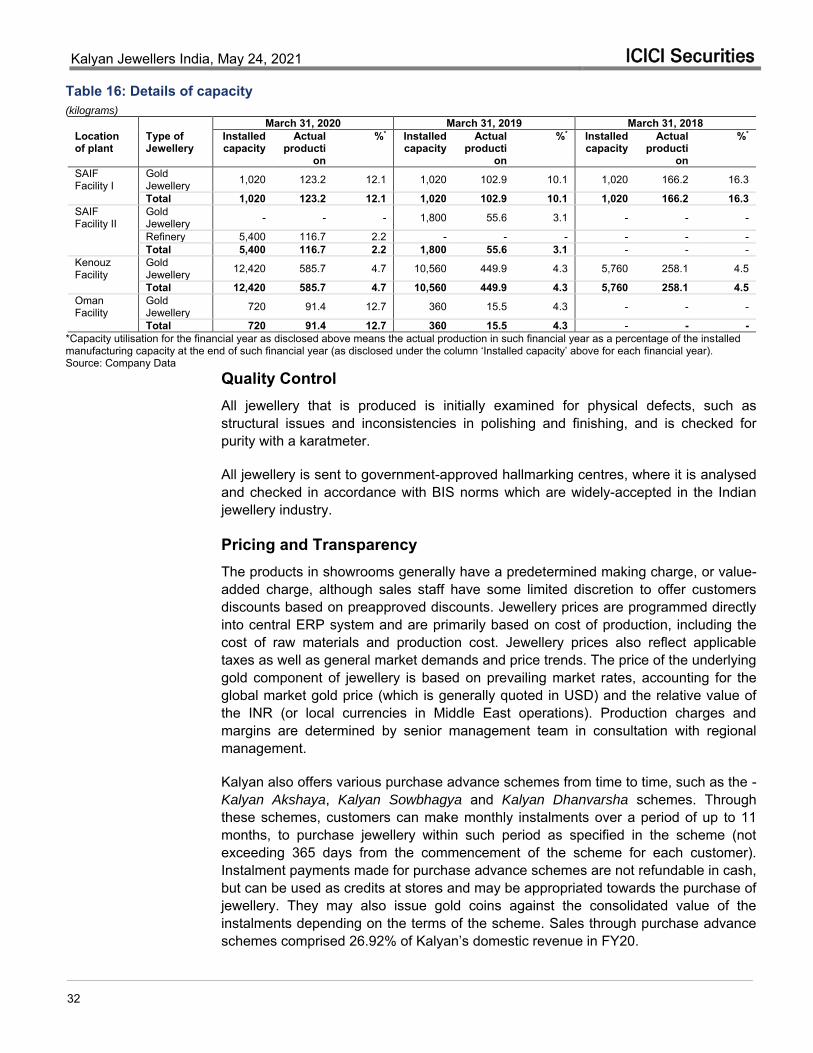
Jewellery Manufacturing Kalyan manufactures products through a network of artisans throughout India, who work in the capacity of contract manufacturers and as independent contractors to manufacture products. Most of the contract manufacturers are long-term business partners. Jewellery in the Middle East consists of a mix of products manufactured by Kalyan Jewellers, as well as finished products purchased from local manufacturers. Kalyan has four manufacturing facilities in Sharjah and Oman. The following table provides the aggregate installed capacity and aggregate capacity utilisation by product category at manufacturing facilities as at 31st March 2018, 2019 and 2020.
Kalyan Jewellers India, May 24, 2021 ICICI Securities
32
Table 16: Details of capacity (kilograms)
March 31, 2020 March 31, 2019 March 31, 2018 Location of plant
Type of Jewellery
Installed capacity
Actual producti
on
%* Installed capacity
Actual producti
on
%* Installed capacity
Actual producti
on
%*
SAIF Facility I
Gold Jewellery 1,020 123.2 12.1 1,020 102.9 10.1 1,020 166.2 16.3
Total 1,020 123.2 12.1 1,020 102.9 10.1 1,020 166.2 16.3 SAIF Facility II
Gold Jewellery - - - 1,800 55.6 3.1 - - -
Refinery 5,400 116.7 2.2 - - - - - - Total 5,400 116.7 2.2 1,800 55.6 3.1 - - -
Kenouz Facility
Gold Jewellery 12,420 585.7 4.7 10,560 449.9 4.3 5,760 258.1 4.5
Total 12,420 585.7 4.7 10,560 449.9 4.3 5,760 258.1 4.5 Oman Facility
Gold Jewellery 720 91.4 12.7 360 15.5 4.3 - - -
Total 720 91.4 12.7 360 15.5 4.3 - - - *Capacity utilisation for the financial year as disclosed above means the actual production in such financial year as a percentage of the installed manufacturing capacity at the end of such financial year (as disclosed under the column ‘Installed capacity’ above for each financial year). Source: Company Data
Quality Control All jewellery that is produced is initially examined for physical defects, such as structural issues and inconsistencies in polishing and finishing, and is checked for purity with a karatmeter.
All jewellery is sent to government-approved hallmarking centres, where it is analysed and checked in accordance with BIS norms which are widely-accepted in the Indian jewellery industry.
Pricing and Transparency The products in showrooms generally have a predetermined making charge, or value-added charge, although sales staff have some limited discretion to offer customers discounts based on preapproved discounts. Jewellery prices are programmed directly into central ERP system and are primarily based on cost of production, including the cost of raw materials and production cost. Jewellery prices also reflect applicable taxes as well as general market demands and price trends. The price of the underlying gold component of jewellery is based on prevailing market rates, accounting for the global market gold price (which is generally quoted in USD) and the relative value of the INR (or local currencies in Middle East operations). Production charges and margins are determined by senior management team in consultation with regional management.
Kalyan also offers various purchase advance schemes from time to time, such as the - Kalyan Akshaya, Kalyan Sowbhagya and Kalyan Dhanvarsha schemes. Through these schemes, customers can make monthly instalments over a period of up to 11 months, to purchase jewellery within such period as specified in the scheme (not exceeding 365 days from the commencement of the scheme for each customer). Instalment payments made for purchase advance schemes are not refundable in cash, but can be used as credits at stores and may be appropriated towards the purchase of jewellery. They may also issue gold coins against the consolidated value of the instalments depending on the terms of the scheme. Sales through purchase advance schemes comprised 26.92% of Kalyan’s domestic revenue in FY20.
Kalyan Jewellers India, May 24, 2021 ICICI Securities
33
Kalyan also runs a few priority programmes, under the name Kalyan Priority
Programme, through which members / subscribers on payment of a non-refundable membership fee may avail certain benefits in the form of discounts, when they purchase jewellery within a stipulated period of time.
Gold Hedging Kalyan generally uses various techniques to hedge its gold inventory to protect from gold price fluctuations, including the use of gold metal loans, as well as forward contracts and options on Indian and international commodity exchanges.
Gold metal loans provide a natural hedge to any fluctuations in the price of gold. At the time of selling gold that is procured through gold metal loans, the rate of purchase can be fixed to align the buying and selling rate of the underlying gold. For gold purchased from customers as well as from regulated banks, forward contracts and options can be maintained to protect against fluctuations in the price of gold. The CEO of the company is responsible for managing and monitoring hedging policies and portfolio.
Brand Ambassadors Kalyan Jewellers works with regional and national celebrities as well as local influencers throughout India who serve as brand ambassadors to promote the brand.
National Brand Ambassadors: Amitabh Bachchan, Katrina Kaif, Jaya Bachchan, Shweta Nanda Bachchan
Regional Brand Ambassadors: Prabhu Ganesan (Tamil), Nagarjuna Akkineni (Telugu), Shiva Rajkumar (Kannada), Manju Warrier (Malayalam).
Regional Influencers: Pooja Sawant (Marathi), Wamiqa Gabbi (Punjabi), Ritabhari Chakraborthy (Bengali), Kinjal Rajpriya (Gujarati).
Kalyan Jewellers India, May 24, 2021 ICICI Securities
34
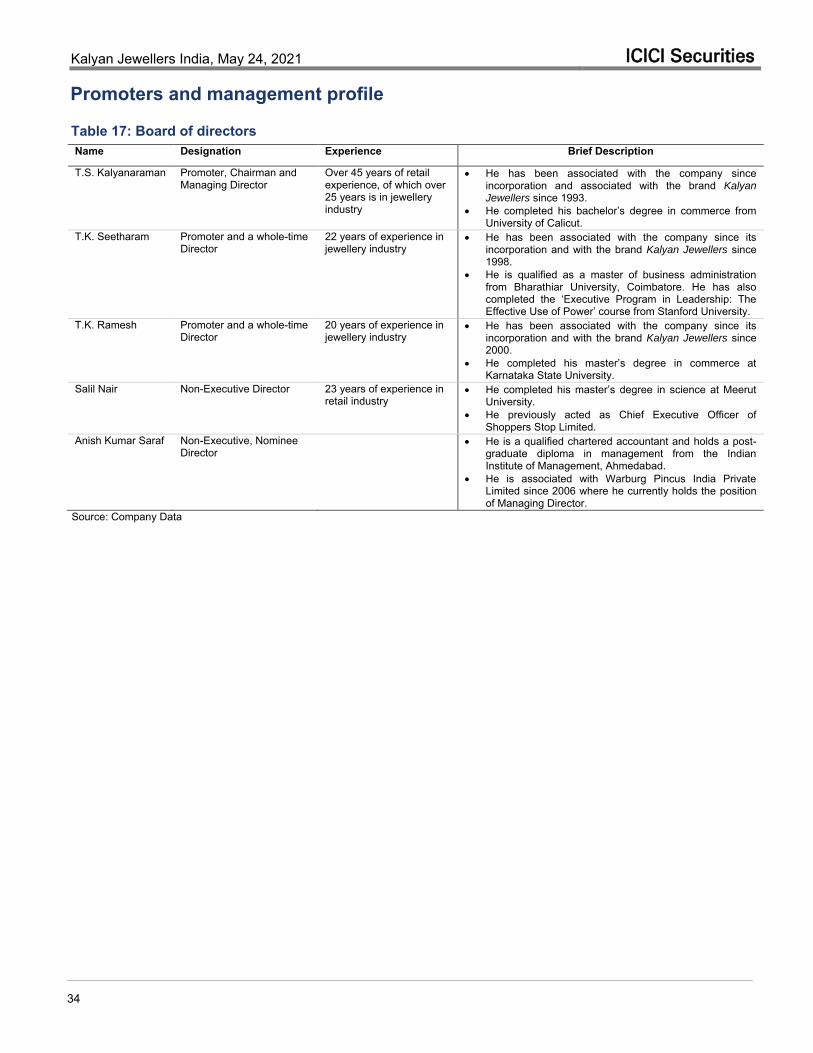
Promoters and management profile
Table 17: Board of directors Name Designation Experience Brief Description
T.S. Kalyanaraman Promoter, Chairman and Managing Director
Over 45 years of retail experience, of which over 25 years is in jewellery industry
He has been associated with the company since incorporation and associated with the brand Kalyan Jewellers since 1993.
He completed his bachelor’s degree in commerce from University of Calicut.
T.K. Seetharam Promoter and a whole-time Director
22 years of experience in jewellery industry
He has been associated with the company since its incorporation and with the brand Kalyan Jewellers since 1998.
He is qualified as a master of business administration from Bharathiar University, Coimbatore. He has also completed the ‘Executive Program in Leadership: The Effective Use of Power’ course from Stanford University.
T.K. Ramesh Promoter and a whole-time Director
20 years of experience in jewellery industry
He has been associated with the company since its incorporation and with the brand Kalyan Jewellers since 2000.
He completed his master’s degree in commerce at Karnataka State University.
Salil Nair Non-Executive Director 23 years of experience in retail industry
He completed his master’s degree in science at Meerut University.
He previously acted as Chief Executive Officer of Shoppers Stop Limited.
Anish Kumar Saraf Non-Executive, Nominee Director
He is a qualified chartered accountant and holds a post-graduate diploma in management from the Indian Institute of Management, Ahmedabad.
He is associated with Warburg Pincus India Private Limited since 2006 where he currently holds the position of Managing Director.
Source: Company Data
Kalyan Jewellers India, May 24, 2021 ICICI Securities
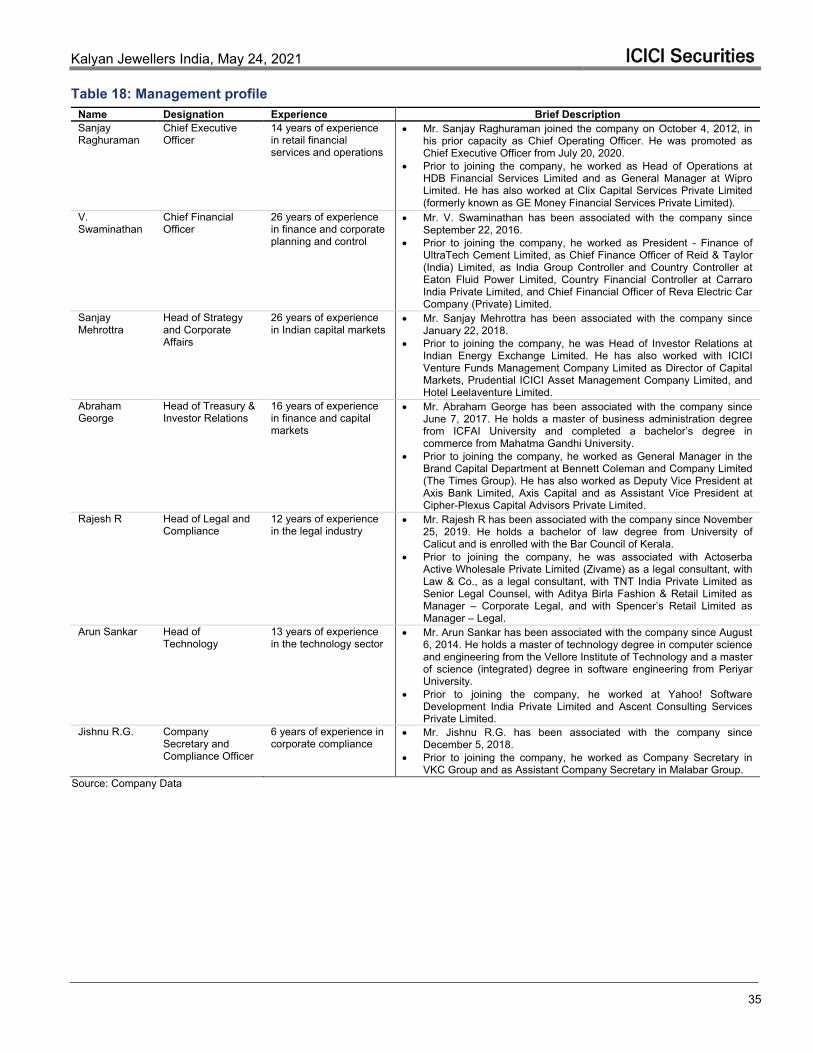
35
Table 18: Management profile Name Designation Experience Brief Description Sanjay Raghuraman
Chief Executive Officer
14 years of experience in retail financial services and operations
Mr. Sanjay Raghuraman joined the company on October 4, 2012, in his prior capacity as Chief Operating Officer. He was promoted as Chief Executive Officer from July 20, 2020.
Prior to joining the company, he worked as Head of Operations at HDB Financial Services Limited and as General Manager at Wipro Limited. He has also worked at Clix Capital Services Private Limited (formerly known as GE Money Financial Services Private Limited).
V. Swaminathan
Chief Financial Officer
26 years of experience in finance and corporate planning and control
Mr. V. Swaminathan has been associated with the company since September 22, 2016.
Prior to joining the company, he worked as President - Finance of UltraTech Cement Limited, as Chief Finance Officer of Reid & Taylor (India) Limited, as India Group Controller and Country Controller at Eaton Fluid Power Limited, Country Financial Controller at Carraro India Private Limited, and Chief Financial Officer of Reva Electric Car Company (Private) Limited.
Sanjay Mehrottra
Head of Strategy and Corporate Affairs
26 years of experience in Indian capital markets
Mr. Sanjay Mehrottra has been associated with the company since January 22, 2018.
Prior to joining the company, he was Head of Investor Relations at Indian Energy Exchange Limited. He has also worked with ICICI Venture Funds Management Company Limited as Director of Capital Markets, Prudential ICICI Asset Management Company Limited, and Hotel Leelaventure Limited.
Abraham George
Head of Treasury & Investor Relations
16 years of experience in finance and capital markets
Mr. Abraham George has been associated with the company since June 7, 2017. He holds a master of business administration degree from ICFAI University and completed a bachelor’s degree in commerce from Mahatma Gandhi University.
Prior to joining the company, he worked as General Manager in the Brand Capital Department at Bennett Coleman and Company Limited (The Times Group). He has also worked as Deputy Vice President at Axis Bank Limited, Axis Capital and as Assistant Vice President at Cipher-Plexus Capital Advisors Private Limited.
Rajesh R Head of Legal and Compliance
12 years of experience in the legal industry
Mr. Rajesh R has been associated with the company since November 25, 2019. He holds a bachelor of law degree from University of Calicut and is enrolled with the Bar Council of Kerala.
Prior to joining the company, he was associated with Actoserba Active Wholesale Private Limited (Zivame) as a legal consultant, with Law & Co., as a legal consultant, with TNT India Private Limited as Senior Legal Counsel, with Aditya Birla Fashion & Retail Limited as Manager – Corporate Legal, and with Spencer’s Retail Limited as Manager – Legal.
Arun Sankar Head of Technology
13 years of experience in the technology sector
Mr. Arun Sankar has been associated with the company since August 6, 2014. He holds a master of technology degree in computer science and engineering from the Vellore Institute of Technology and a master of science (integrated) degree in software engineering from Periyar University.
Prior to joining the company, he worked at Yahoo! Software Development India Private Limited and Ascent Consulting Services Private Limited.
Jishnu R.G. Company Secretary and Compliance Officer
6 years of experience in corporate compliance
Mr. Jishnu R.G. has been associated with the company since December 5, 2018.
Prior to joining the company, he worked as Company Secretary in VKC Group and as Assistant Company Secretary in Malabar Group.
Source: Company Data
Kalyan Jewellers India, May 24, 2021 ICICI Securities
36
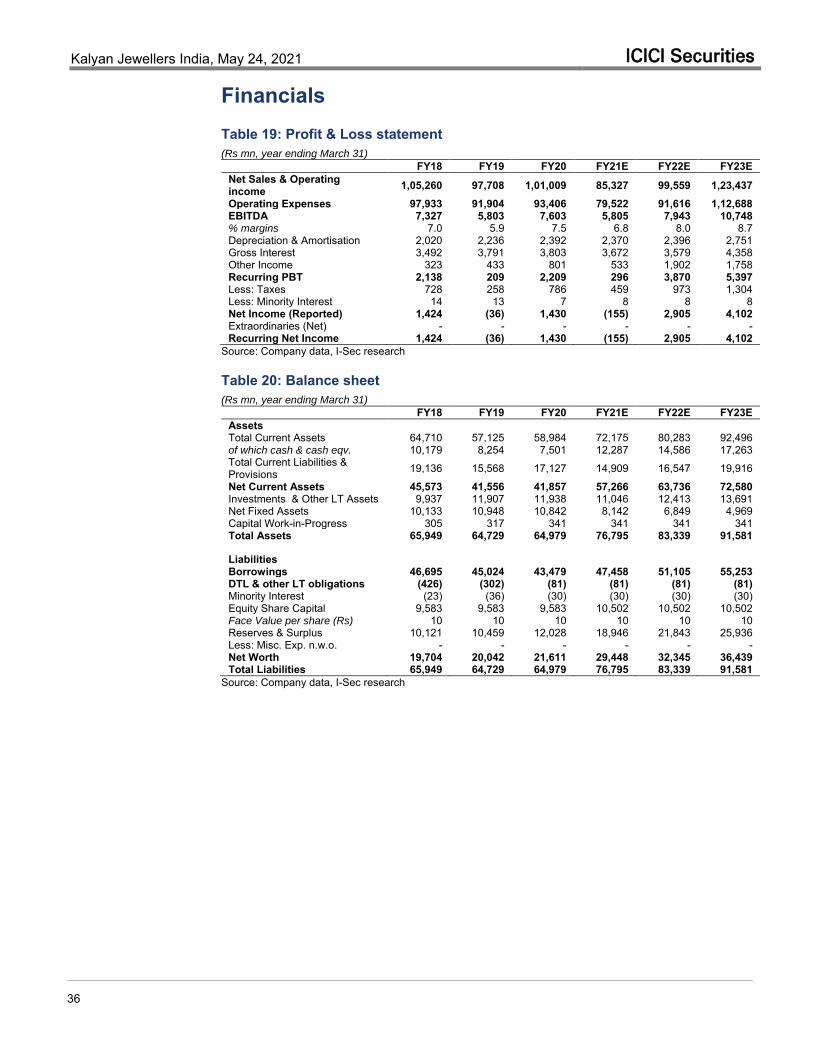
Financials Table 19: Profit & Loss statement (Rs mn, year ending March 31)
FY18 FY19 FY20 FY21E FY22E FY23E Net Sales & Operating income 1,05,260 97,708 1,01,009 85,327 99,559 1,23,437 Operating Expenses 97,933 91,904 93,406 79,522 91,616 1,12,688 EBITDA 7,327 5,803 7,603 5,805 7,943 10,748 % margins 7.0 5.9 7.5 6.8 8.0 8.7 Depreciation & Amortisation 2,020 2,236 2,392 2,370 2,396 2,751 Gross Interest 3,492 3,791 3,803 3,672 3,579 4,358 Other Income 323 433 801 533 1,902 1,758 Recurring PBT 2,138 209 2,209 296 3,870 5,397 Less: Taxes 728 258 786 459 973 1,304 Less: Minority Interest 14 13 7 8 8 8 Net Income (Reported) 1,424 (36) 1,430 (155) 2,905 4,102 Extraordinaries (Net) - - - - - - Recurring Net Income 1,424 (36) 1,430 (155) 2,905 4,102
Source: Company data, I-Sec research
Table 20: Balance sheet (Rs mn, year ending March 31)
FY18 FY19 FY20 FY21E FY22E FY23E Assets Total Current Assets 64,710 57,125 58,984 72,175 80,283 92,496 of which cash & cash eqv. 10,179 8,254 7,501 12,287 14,586 17,263 Total Current Liabilities & Provisions 19,136 15,568 17,127 14,909 16,547 19,916
Net Current Assets 45,573 41,556 41,857 57,266 63,736 72,580 Investments & Other LT Assets 9,937 11,907 11,938 11,046 12,413 13,691 Net Fixed Assets 10,133 10,948 10,842 8,142 6,849 4,969 Capital Work-in-Progress 305 317 341 341 341 341 Total Assets 65,949 64,729 64,979 76,795 83,339 91,581
Liabilities Borrowings 46,695 45,024 43,479 47,458 51,105 55,253 DTL & other LT obligations (426) (302) (81) (81) (81) (81) Minority Interest (23) (36) (30) (30) (30) (30) Equity Share Capital 9,583 9,583 9,583 10,502 10,502 10,502 Face Value per share (Rs) 10 10 10 10 10 10 Reserves & Surplus 10,121 10,459 12,028 18,946 21,843 25,936 Less: Misc. Exp. n.w.o. - - - - - - Net Worth 19,704 20,042 21,611 29,448 32,345 36,439 Total Liabilities 65,949 64,729 64,979 76,795 83,339 91,581
Source: Company data, I-Sec research
Kalyan Jewellers India, May 24, 2021 ICICI Securities
37
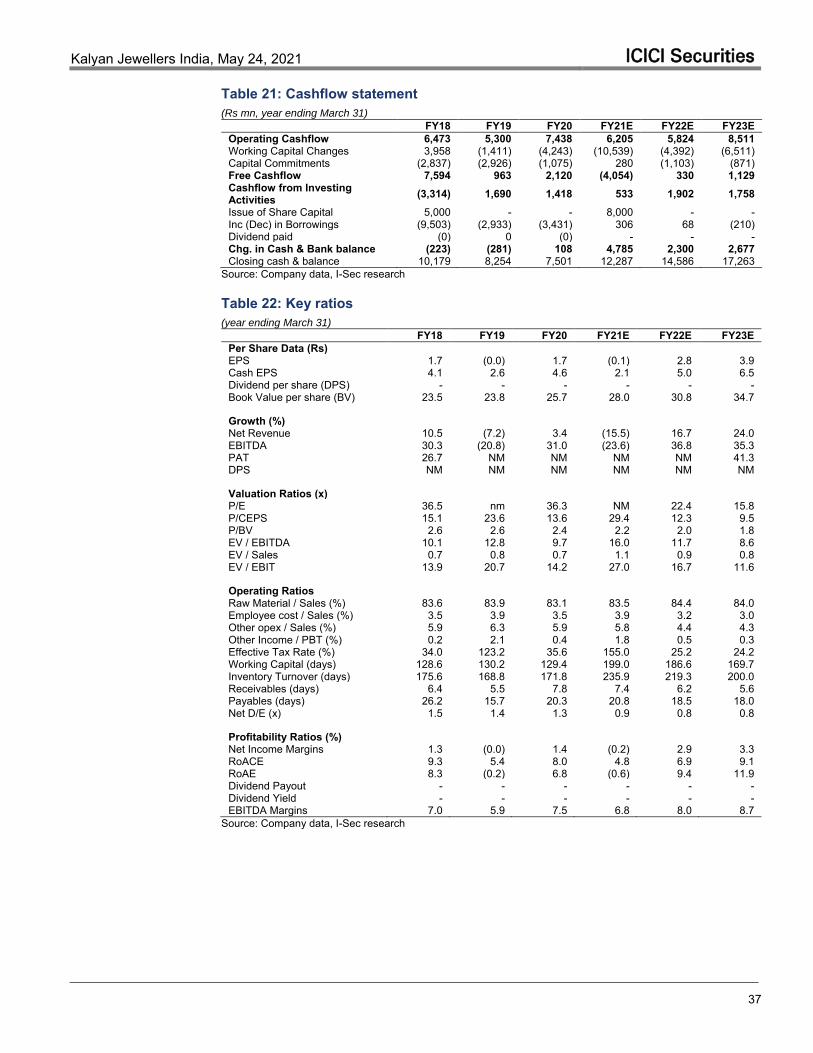
Table 21: Cashflow statement (Rs mn, year ending March 31)
FY18 FY19 FY20 FY21E FY22E FY23E Operating Cashflow 6,473 5,300 7,438 6,205 5,824 8,511 Working Capital Changes 3,958 (1,411) (4,243) (10,539) (4,392) (6,511) Capital Commitments (2,837) (2,926) (1,075) 280 (1,103) (871) Free Cashflow 7,594 963 2,120 (4,054) 330 1,129 Cashflow from Investing Activities (3,314) 1,690 1,418 533 1,902 1,758 Issue of Share Capital 5,000 - - 8,000 - - Inc (Dec) in Borrowings (9,503) (2,933) (3,431) 306 68 (210) Dividend paid (0) 0 (0) - - - Chg. in Cash & Bank balance (223) (281) 108 4,785 2,300 2,677 Closing cash & balance 10,179 8,254 7,501 12,287 14,586 17,263
Source: Company data, I-Sec research
Table 22: Key ratios (year ending March 31)
FY18 FY19 FY20 FY21E FY22E FY23E Per Share Data (Rs) EPS 1.7 (0.0) 1.7 (0.1) 2.8 3.9 Cash EPS 4.1 2.6 4.6 2.1 5.0 6.5 Dividend per share (DPS) - - - - - - Book Value per share (BV) 23.5 23.8 25.7 28.0 30.8 34.7
Growth (%) Net Revenue 10.5 (7.2) 3.4 (15.5) 16.7 24.0 EBITDA 30.3 (20.8) 31.0 (23.6) 36.8 35.3 PAT 26.7 NM NM NM NM 41.3 DPS NM NM NM NM NM NM
Valuation Ratios (x) P/E 36.5 nm 36.3 NM 22.4 15.8 P/CEPS 15.1 23.6 13.6 29.4 12.3 9.5 P/BV 2.6 2.6 2.4 2.2 2.0 1.8 EV / EBITDA 10.1 12.8 9.7 16.0 11.7 8.6 EV / Sales 0.7 0.8 0.7 1.1 0.9 0.8 EV / EBIT 13.9 20.7 14.2 27.0 16.7 11.6
Operating Ratios Raw Material / Sales (%) 83.6 83.9 83.1 83.5 84.4 84.0 Employee cost / Sales (%) 3.5 3.9 3.5 3.9 3.2 3.0 Other opex / Sales (%) 5.9 6.3 5.9 5.8 4.4 4.3 Other Income / PBT (%) 0.2 2.1 0.4 1.8 0.5 0.3 Effective Tax Rate (%) 34.0 123.2 35.6 155.0 25.2 24.2 Working Capital (days) 128.6 130.2 129.4 199.0 186.6 169.7 Inventory Turnover (days) 175.6 168.8 171.8 235.9 219.3 200.0 Receivables (days) 6.4 5.5 7.8 7.4 6.2 5.6 Payables (days) 26.2 15.7 20.3 20.8 18.5 18.0 Net D/E (x) 1.5 1.4 1.3 0.9 0.8 0.8
Profitability Ratios (%) Net Income Margins 1.3 (0.0) 1.4 (0.2) 2.9 3.3 RoACE 9.3 5.4 8.0 4.8 6.9 9.1 RoAE 8.3 (0.2) 6.8 (0.6) 9.4 11.9 Dividend Payout - - - - - - Dividend Yield - - - - - - EBITDA Margins 7.0 5.9 7.5 6.8 8.0 8.7
Source: Company data, I-Sec research
Kalyan Jewellers India, May 24, 2021 ICICI Securities
38
Index of tables and charts Tables Table 1: Competitive advantages ......................................................................................... 4 Table 2: Expected EBITDA CAGR of 14% over FY21-FY30E in reverse DCF .................... 4 Table 3: Evolution of Jewellery retail in India ...................................................................... 14 Table 4: Illustrative Regional Jewellery Demand and Preferences .................................... 18 Table 5: Illustrative Regional Jewellery Demand and Preferences (For Weddings) .......... 18 Table 6: Seasonality in Gold Buying ................................................................................... 19 Table 7: Comparison of Retail Chains, Local and E-commerce Players ............................ 23 Table 8: Overall operating metrics ...................................................................................... 24 Table 9: Store economics (Rs mn / store) .......................................................................... 24 Table 10: Store economics (Rs / sqft) ................................................................................ 24 Table 11: Balance Sheet Ratios ......................................................................................... 24 Table 12: Key assumptions ................................................................................................. 27 Table 13: DCF calculations ................................................................................................. 28 Table 14: Relative valuation ................................................................................................ 28 Table 15: Timeline of Kalyan Jewellers business operations ............................................. 30 Table 16: Details of capacity ............................................................................................... 32 Table 17: Board of directors ................................................................................................ 34 Table 18: Management profile ............................................................................................ 35 Table 19: Profit & Loss statement ....................................................................................... 36 Table 20: Balance sheet ..................................................................................................... 36 Table 21: Cashflow statement ............................................................................................ 37 Table 22: Key ratios ............................................................................................................ 37 Charts Chart 1: Organised sector increased share from ~6% in 2007 to ~32% in 2020 ................. 3 Chart 2: Store network of Kalyan Jewellers in India ............................................................. 5 Chart 3: Kalyan Jewellers showrooms across India ............................................................. 6 Chart 4: Store throughput comparison of Kalyan’s South vs non-South stores ................... 7 Chart 5: Standalone adspend as a % of sales ...................................................................... 8 Chart 6: Jewellery sub-brands and their target geographies and themes .......................... 11 Chart 7: Kalyan’s state-wise store network ......................................................................... 12 Chart 8: Store throughput comparison of South vs non-South stores ................................ 13 Chart 9: Jewellery market in India ...................................................................................... 14 Chart 10: EBITDA margins ................................................................................................. 15 Chart 11: Studded Jewellery demand by region ................................................................. 16 Chart 12: Revenue and gross margin contribution by region for Kalyan Jewellers
(Standalone) .................................................................................................................. 16 Chart 13: Improvement in Kalyan’s studded ratio from FY18-FY20 ................................... 16 Chart 14: Indian Domestic Jewellery Retail Market Size (US$ bn) .................................... 17 Chart 15: Studded Jewellery demand by region ................................................................. 22 Chart 16: Gold Jewellery demand by region ....................................................................... 22 Chart 17: Healthy revenue growth ahead ........................................................................... 25 Chart 18: EBITDA CAGR at 36% over FY21-FY23E ......................................................... 25 Chart 19: EBITDA margins expanding ................................................................................ 25 Chart 20: Steady net profit growth ahead ........................................................................... 26 Chart 21: Net profit margins to expand ............................................................................... 26 Chart 22: Return ratios ........................................................................................................ 26
Kalyan Jewellers India, May 24, 2021 ICICI Securities
39
This report may be distributed in Singapore by ICICI Securities, Inc. (Singapore branch). Any recipients of this report in Singapore should contact ICICI Securities,
Inc. (Singapore branch) in respect of any matters arising from, or in connection with, this report. The contact details of ICICI Securities, Inc. (Singapore branch) are
as follows: Address: 10 Collyer Quay, #40-92 Ocean Financial Tower, Singapore - 049315, Tel: +65 6232 2451 and email: [email protected],
"In case of eligible investors based in Japan, charges for brokerage services on execution of transactions do not in substance constitute charge for research reports
and no charges are levied for providing research reports to such investors."
New I-Sec investment ratings (all ratings based on absolute return; All ratings and target price refers to 12-month performance horizon, unless mentioned otherwise)
BUY: >15% return; ADD: 5% to 15% return; HOLD: Negative 5% to Positive 5% return; REDUCE: Negative 5% to Negative 15% return; SELL: < negative 15% return
ANALYST CERTIFICATION I/We, Aniket Sethi, MBA, B. Tech; Manoj Menon, MBA, CMA; Karan Bhuwania, MBA; authors and the names subscribed to this report, hereby certify that all of the views expressed in this research report accurately reflect our views about the subject issuer(s) or securities. We also certify that no part of our compensation was, is, or will be directly or indirectly related to the specific recommendation(s) or view(s) in this report. Analysts are not registered as research analysts by FINRA and are not associated persons of the ICICI Securities Inc. It is also confirmed that above mentioned Analysts of this report have not received any compensation from the companies mentioned in the report in the preceding twelve months and do not serve as an officer, director or employee of the companies mentioned in the report. Terms & conditions and other disclosures: ICICI Securities Limited (ICICI Securities) is a full-service, integrated investment banking and is, inter alia, engaged in the business of stock brokering and distribution of financial products. ICICI Securities is Sebi registered stock broker, merchant banker, investment adviser, portfolio manager and Research Analyst. ICICI Securities is registered with Insurance Regulatory Development Authority of India Limited (IRDAI) as a composite corporate agent and with PFRDA as a Point of Presence. ICICI Securities Limited Research Analyst SEBI Registration Number – INH000000990. ICICI Securities Limited SEBI Registration is INZ000183631 for stock broker. ICICI Securities is a subsidiary of ICICI Bank which is India’s largest private sector bank and has its various subsidiaries engaged in businesses of housing finance, asset management, life insurance, general insurance, venture capital fund management, etc. (“associates”), the details in respect of which are available on www.icicibank.com. ICICI Securities is one of the leading merchant bankers/ underwriters of securities and participate in virtually all securities trading markets in India. We and our associates might have investment banking and other business relationship with a significant percentage of companies covered by our Investment Research Department. ICICI Securities and its analysts, persons reporting to analysts and their relatives are generally prohibited from maintaining a financial interest in the securities or derivatives of any companies that the analysts cover. Recommendation in reports based on technical and derivative analysis centre on studying charts of a stock's price movement, outstanding positions, trading volume etc as opposed to focusing on a company's fundamentals and, as such, may not match with the recommendation in fundamental reports. Investors may visit icicidirect.com to view the Fundamental and Technical Research Reports. Our proprietary trading and investment businesses may make investment decisions that are inconsistent with the recommendations expressed herein. ICICI Securities Limited has two independent equity research groups: Institutional Research and Retail Research. This report has been prepared by the Institutional Research. The views and opinions expressed in this document may or may not match or may be contrary with the views, estimates, rating, and target price of the Retail Research. The information and opinions in this report have been prepared by ICICI Securities and are subject to change without any notice. The report and information contained herein is strictly confidential and meant solely for the selected recipient and may not be altered in any way, transmitted to, copied or distributed, in part or in whole, to any other person or to the media or reproduced in any form, without prior written consent of ICICI Securities. While we would endeavour to update the information herein on a reasonable basis, ICICI Securities is under no obligation to update or keep the information current. Also, there may be regulatory, compliance or other reasons that may prevent ICICI Securities from doing so. Non-rated securities indicate that rating on a particular security has been suspended temporarily and such suspension is in compliance with applicable regulations and/or ICICI Securities policies, in circumstances where ICICI Securities might be acting in an advisory capacity to this company, or in certain other circumstances. This report is based on information obtained from public sources and sources believed to be reliable, but no independent verification has been made nor is its accuracy or completeness guaranteed. This report and information herein is solely for informational purpose and shall not be used or considered as an offer document or solicitation of offer to buy or sell or subscribe for securities or other financial instruments. Though disseminated to all the customers simultaneously, not all customers may receive this report at the same time. ICICI Securities will not treat recipients as customers by virtue of their receiving this report. Nothing in this report constitutes investment, legal, accounting and tax advice or a representation that any investment or strategy is suitable or appropriate to your specific circumstances. The securities discussed and opinions expressed in this report may not be suitable for all investors, who must make their own investment decisions, based on their own investment objectives, financial positions and needs of specific recipient. This may not be taken in substitution for the exercise of independent judgment by any recipient. The recipient should independently evaluate the investment risks. The value and return on investment may vary because of changes in interest rates, foreign exchange rates or any other reason. ICICI Securities accepts no liabilities whatsoever for any loss or damage of any kind arising out of the use of this report. Past performance is not necessarily a guide to future performance. Investors are advised to see Risk Disclosure Document to understand the risks associated before investing in the securities markets. Actual results may differ materially from those set forth in projections. Forward-looking statements are not predictions and may be subject to change without notice. ICICI Securities or its associates might have managed or co-managed public offering of securities for the subject company or might have been mandated by the subject company for any other assignment in the past twelve months. ICICI Securities or its associates might have received any compensation from the companies mentioned in the report during the period preceding twelve months from the date of this report for services in respect of managing or co-managing public offerings, corporate finance, investment banking or merchant banking, brokerage services or other advisory service in a merger or specific transaction. ICICI Securities or its associates might have received any compensation for products or services other than investment banking or merchant banking or brokerage services from the companies mentioned in the report in the past twelve months. ICICI Securities encourages independence in research report preparation and strives to minimize conflict in preparation of research report. ICICI Securities or its associates or its analysts did not receive any compensation or other benefits from the companies mentioned in the report or third party in connection with preparation of the research report. Accordingly, neither ICICI Securities nor Research Analysts and their relatives have any material conflict of interest at the time of publication of this report. Compensation of our Research Analysts is not based on any specific merchant banking, investment banking or brokerage service transactions. ICICI Securities or its subsidiaries collectively or Research Analysts or their relatives do not own 1% or more of the equity securities of the Company mentioned in the report as of the last day of the month preceding the publication of the research report. Since associates of ICICI Securities and ICICI Securities as an entity are engaged in various financial service businesses, they might have financial interests or beneficial ownership in various companies including the subject company/companies mentioned in this report. ICICI Securities may have issued other reports that are inconsistent with and reach different conclusion from the information presented in this report. Neither the Research Analysts nor ICICI Securities have been engaged in market making activity for the companies mentioned in the report. We submit that no material disciplinary action has been taken on ICICI Securities by any Regulatory Authority impacting Equity Research Analysis activities. This report is not directed or intended for distribution to, or use by, any person or entity who is a citizen or resident of or located in any locality, state, country or other jurisdiction, where such distribution, publication, availability or use would be contrary to law, regulation or which would subject ICICI Securities and affiliates to any registration or licensing requirement within such jurisdiction. The securities described herein may or may not be eligible for sale in all jurisdictions or to certain category of investors. Persons in whose possession this document may come are required to inform themselves of and to observe such restriction. This report has not been prepared by ICICI Securities, Inc. However, ICICI Securities, Inc. has reviewed the report and, in so far as it includes current or historical information, it is believed to be reliable, although its accuracy and completeness cannot be guaranteed.