Embed Size (px)
Citation preview
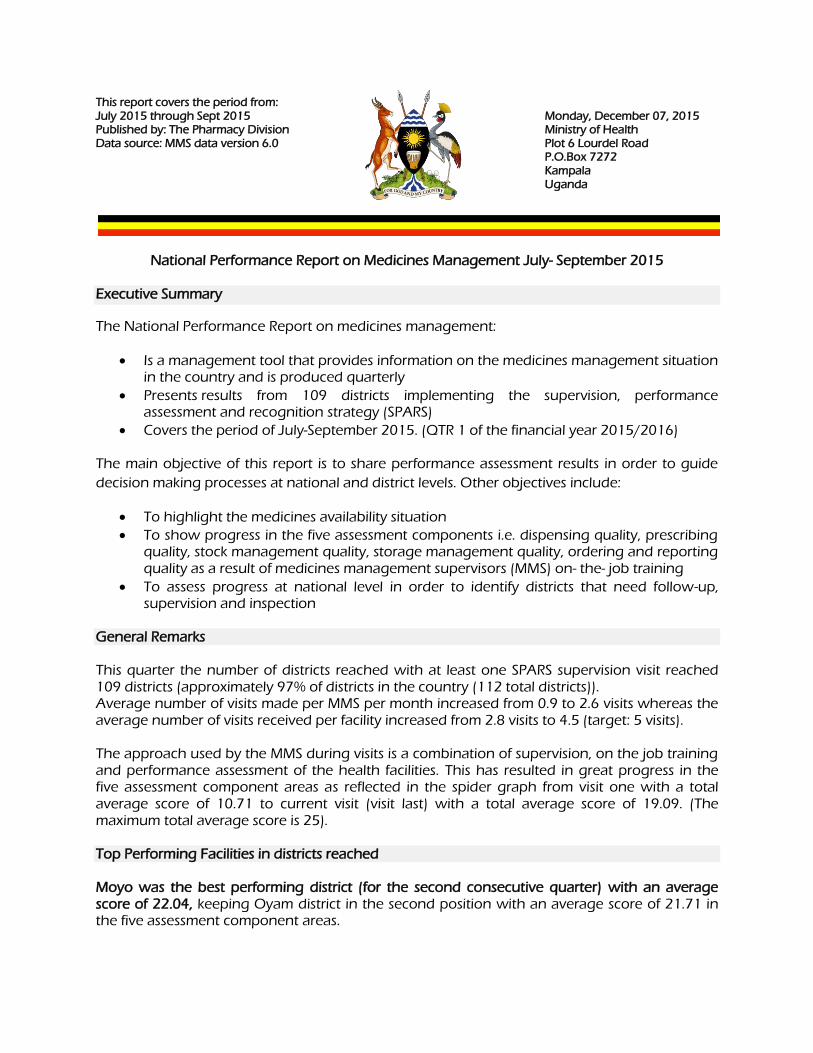
This report covers the period from: July 2015 through Sept 2015 Monday, December 07, 2015 Published by: The Pharmacy Division Ministry of Health Data source: MMS data version 6.0 Plot 6 Lourdel Road P.O.Box 7272 Kampala Uganda
National Performance Report on Medicines Management July- September 2015
Executive Summary
The National Performance Report on medicines management:
Is a management tool that provides information on the medicines management situation in the country and is produced quarterly
Presents results from 109 districts implementing the supervision, performance assessment and recognition strategy (SPARS)
Covers the period of July-September 2015. (QTR 1 of the financial year 2015/2016)
The main objective of this report is to share performance assessment results in order to guide
decision making processes at national and district levels. Other objectives include:
To highlight the medicines availability situation
To show progress in the five assessment components i.e. dispensing quality, prescribing quality, stock management quality, storage management quality, ordering and reporting quality as a result of medicines management supervisors (MMS) on- the- job training
To assess progress at national level in order to identify districts that need follow-up, supervision and inspection
General Remarks This quarter the number of districts reached with at least one SPARS supervision visit reached 109 districts (approximately 97% of districts in the country (112 total districts)). Average number of visits made per MMS per month increased from 0.9 to 2.6 visits whereas the average number of visits received per facility increased from 2.8 visits to 4.5 (target: 5 visits). The approach used by the MMS during visits is a combination of supervision, on the job training and performance assessment of the health facilities. This has resulted in great progress in the five assessment component areas as reflected in the spider graph from visit one with a total average score of 10.71 to current visit (visit last) with a total average score of 19.09. (The maximum total average score is 25). Top Performing Facilities in districts reached Moyo was the best performing district (for the second consecutive quarter) with an average score of 22.04, keeping Oyam district in the second position with an average score of 21.71 in the five assessment component areas.

Top performing facilities (average scores above 23.0)
Hospitals Health Centre 4 Health Centre 3 Health Centre 2
Ibanda Anyeke St. Claire Orungo Belameling
Maracha Kigandalo Agulurude St. Moritz
Kagadi Bufumbo Lefori Kibaire
76% (83/109) of the districts scored above the 50% mark (12.5 out of 25 total average score). However, five districts were at the bottom of the league table with average scores below 10 out of 25. (Adjumani, Kibuku, Kanungu, Ntoroko and Rubirizi). See Page 2 the district league table. Availability of the six tracer medicines on the day of visit- Trends
Availability of the six tracer medicines on the day of visit has been relatively high, with overall availability of 79% in July-September 2015. Depo-provera was least available in Hospitals, followed by Measles vaccine and SP in HC2s. Average stock out days for facilities that were stocked out for at least one day Amoxicillin had the highest average number of stock out days in the three months (19 days).This was more pronounced in HC4, HC3 and HC2. Stock and Storage Management Stock management indicators specifically the correct use of the stock book (25%) and correct filling of the stock card (46%) remain poor. The implementation of a good stock and storage system that tracks movements, issues and provides the basis for quantification is important to ensuring EMHS availability and reduces wastage at the facility. A multi-component strategy is therefore required to improve utility of the tools (stock book and stock cards) at health facility level. Ordering, distribution and reporting Average lead time is still within the recommended time period (<60 days)- 36 days. Facilities stock management is based on a maximum stock level of 6 months and a minimum of 2 months. With a bi-monthly ordering and delivery cycle it is important for the facility to receive the next supplies no later than 2 month (60 days) after the last order has been received and a new order given.
92%100%100%
85% 87% 88% 88% 84% 84% 84% 86% 86% 85% 84% 87% 85% 86% 82% 77% 81% 81% 79%
Availability of 6 tracer medicines on the day of visit (100% target)

Prescribing Quality Adherence to treatment guidelines for cough/cold, URTI, ARTI management is still poor (43%). Most prescribers still include antibiotics as part of the treatment for this condition. This wastage of antibiotics could be contributing stock outs at facility level and needs to be innovatively addressed with strategies targeting all levels of prescribers in the health care system. Please note that the drastic drop in some graphs for the last visits is a result of limited number of visits (at higher visit numbers) in the quarter. There is more information available in the report. Please share widely. For any clarifications, suggestions and enquiries in the report. Please contact 0759 800084, Belinda Blick (Technical Advisor Strategic Information Pharmacy Division)

Performance Report on SPARS
This report covers from:
July 2015 through September 2015
Version No. 2
07 December 2015
Region District Sub District Level Owner-
ship IP MB MMS Facility
ALL ALL ALL ALL ALL ALL ALL ALL ALL
SPARS Performance Report
Published by:The Pharmacy DivisionData source: MMS data version 1.0
Ministry of HealthPlot 6 Lourdel RoadP.O.Box 7272KampalaUganda
Acknowledgement
This report was made with Technical Assistance from the USAID/ Uganda Health Supply Chain Program
Questions or clarifications?
Send an email to [email protected]
Content of this report
1. Overview
2. District League Table
3. Progress on SPARS indicators
4. Availability of medicines (Last Visit)
5. Stock Management
6. Store Conditions
7. Ordering and Reporting
8. Dispensing Quality
9. Prescribing Quality
10. Top score Facilities
SPARS Performance Report
Published by:The Pharmacy DivisionData source: MMS data version 1.0
Ministry of HealthPlot 6 Lourdel RoadP.O.Box 7272KampalaUganda

1. Overview
Tota
l to
date
SPARS have started in: 109 districts in Uganda by 07-12-2015
Number of active MMS: 290 Visits performed: 12700
Facilities that have started SPARS supervision: 2797
Average number of visits done per facility: 4.5
Facilities GPP certified: 0 Facilities GFP certified: 0
Visit number Visit 1 Visit 2 Visit 3 Visit 4 Visit 5 Visit Last
Total score average 10.71 14.09 16.02 17.38 18.49 19.09
Number of visits 2366 1932 1729 1517 1301 1230
Perio
d
Fact Box Visits made from: July 2015 to September 2015
Visits performed in this Period: 1218
Average visits/Medicines Management Supervisor/month: 2.6
Facilities certified in Good Pharmacy Practice (GPP) : 0
Facilities certified in Good Financial Practice (GFP) : 0
SPARS Performance Report Page 1
Published by:The Pharmacy DivisionData source: MMS data version 1.0
Ministry of HealthPlot 6 Lourdel RoadP.O.Box 7272KampalaUganda

2. District League tableTotal scores from last visit. Note: N - Total Visits, S - Score
SPARS Performance Report Page 2
Published by:The Pharmacy DivisionData source: MMS data version 1.0
Ministry of HealthPlot 6 Lourdel RoadP.O.Box 7272KampalaUganda
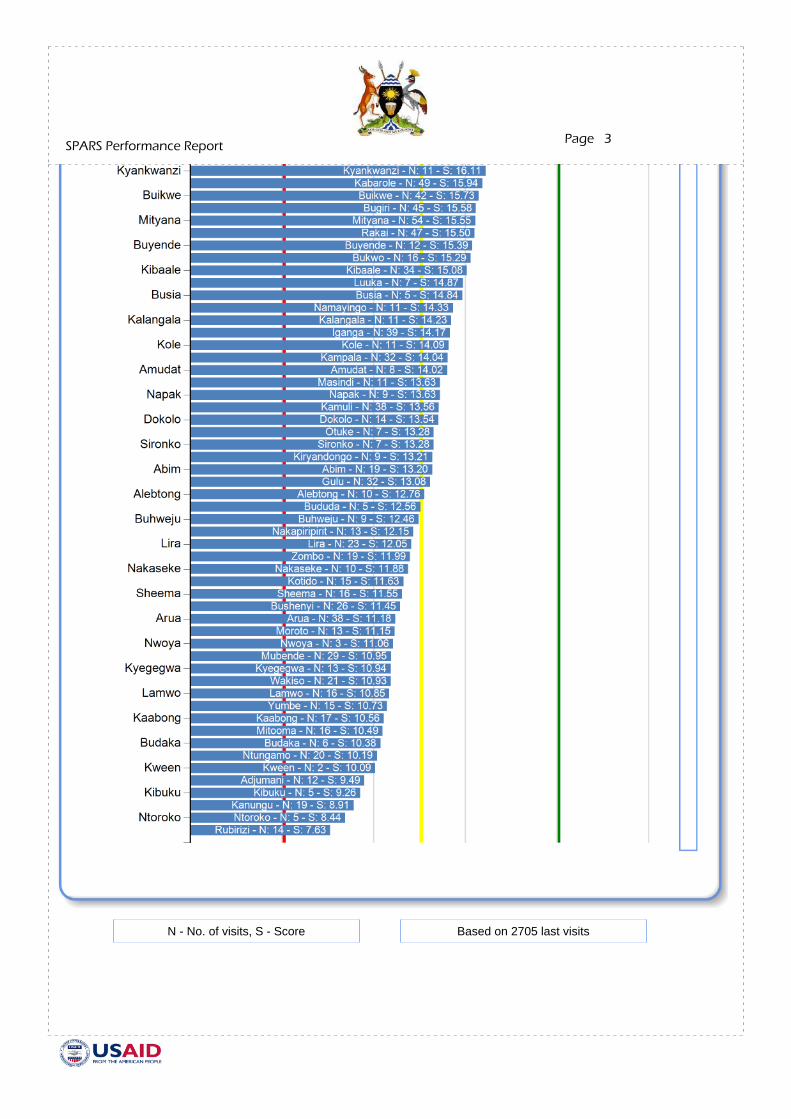
N - No. of visits, S - Score Based on 2705 last visits
SPARS Performance Report Page 3
Published by:The Pharmacy DivisionData source: MMS data version 1.0
Ministry of HealthPlot 6 Lourdel RoadP.O.Box 7272KampalaUganda
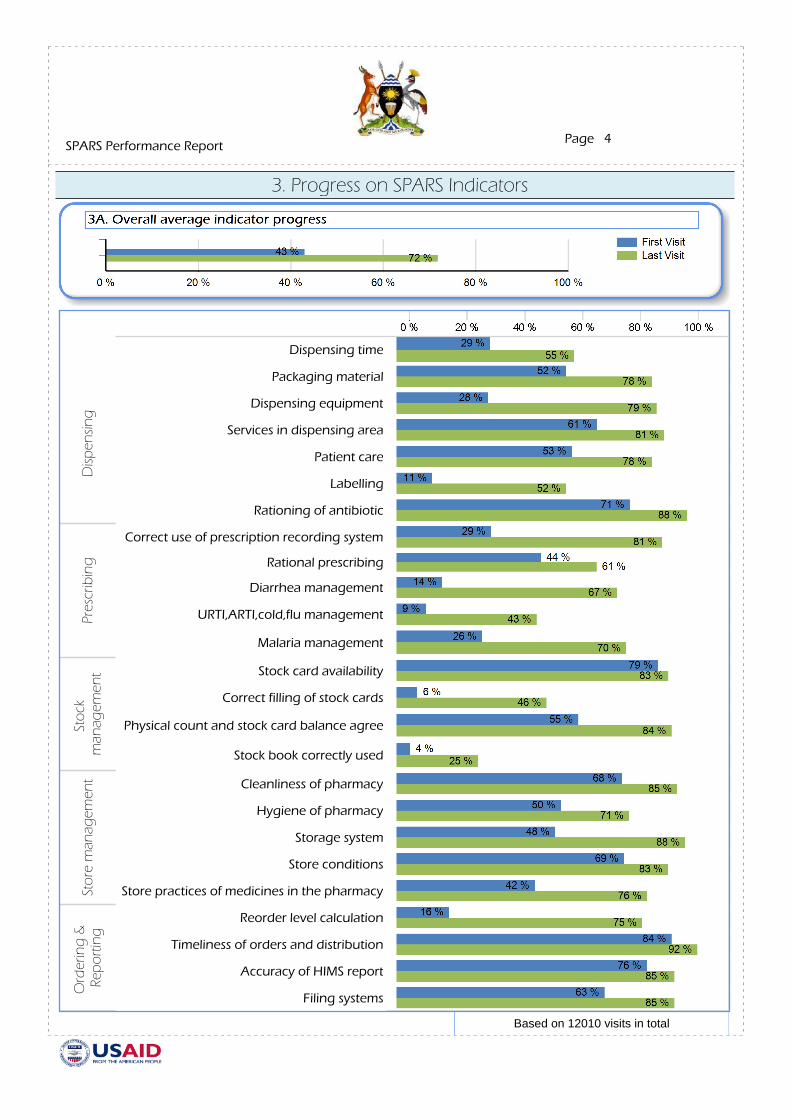
3. Progress on SPARS Indicators
Dispensing time
Disp
ensin
g
Packaging material
Dispensing equipment
Services in dispensing area
Patient care
Labelling
Rationing of antibiotic
Pres
crib
ing
Correct use of prescription recording system
Rational prescribing
Diarrhea management
URTI,ARTI,cold,flu management
Malaria management
Stoc
k m
anag
emen
t Stock card availability
Correct filling of stock cards
Physical count and stock card balance agree
Stock book correctly used
Stor
e m
anag
emen
t Cleanliness of pharmacy
Hygiene of pharmacy
Storage system
Store conditions
Store practices of medicines in the pharmacy
Ord
erin
g &
Re
port
ing
Reorder level calculation
Timeliness of orders and distribution
Accuracy of HIMS report
Filing systems
Based on 12010 visits in total
SPARS Performance Report Page 4
Published by:The Pharmacy DivisionData source: MMS data version 1.0
Ministry of HealthPlot 6 Lourdel RoadP.O.Box 7272KampalaUganda
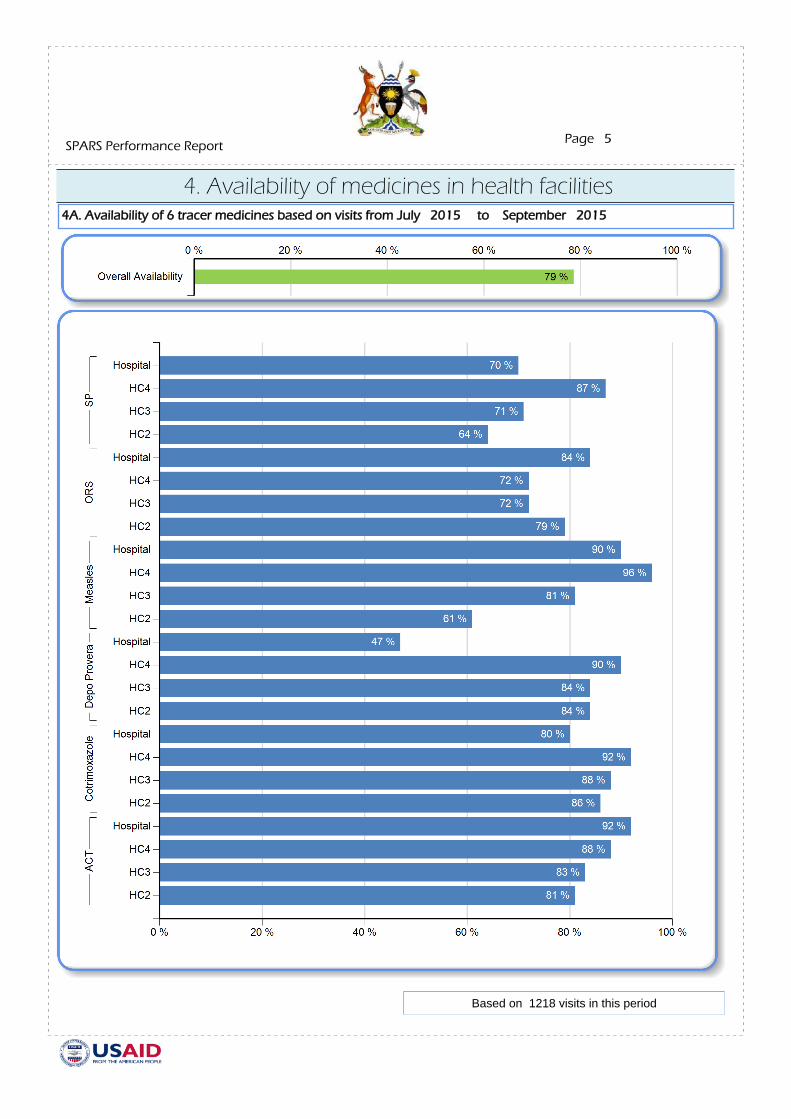
4. Availability of medicines in health facilities4A. Availability of 6 tracer medicines based on visits from July 2015 to September 2015
Based on 1218 visits in this period
SPARS Performance Report Page 5
Published by:The Pharmacy DivisionData source: MMS data version 1.0
Ministry of HealthPlot 6 Lourdel RoadP.O.Box 7272KampalaUganda

4B. Availability of 8 other medicines based on visits from July 2015 to September 2015
Based on 1218 visits in this period
SPARS Performance Report Page 6
Published by:The Pharmacy DivisionData source: MMS data version 1.0
Ministry of HealthPlot 6 Lourdel RoadP.O.Box 7272KampalaUganda

4C. Stock out days for 9 selected EMHS (Last Visit)
Amoxicillin (T) 1032 RDT kits 946
1st line TB 341
Artemisinin Combination Theraphy 1047
Depo Provera 755
Measle vaccine 587
Gloves 873
Oral Rehydration Salt 922
Cotrimoxazole 1023
Description: Average stock out days over the previous 3 months for facilities that have been out of stock at least 1 day.
.= Number of visits with observed stock out
(T) .= MoH Tracer Medicine
Based on last 1218 visits in this period
SPARS Performance Report Page 7
Published by:The Pharmacy DivisionData source: MMS data version 1.0
Ministry of HealthPlot 6 Lourdel RoadP.O.Box 7272KampalaUganda

5. Stock Management
5B. Appropriate use of stock card system for basket of 15 EMHS
5A. Stock card availability for selected medicines
Based on 1218 visits in this period Based on 12010 visits in total
Based on 1218 visits in this period Based on 12010 visits in total
SPARS Performance Report Page 8
Published by:The Pharmacy DivisionData source: MMS data version 1.0
Ministry of HealthPlot 6 Lourdel RoadP.O.Box 7272KampalaUganda

6. Store Conditions6A.Storage handling
Based on 1218 visits in this period Based on 12010 visits in total
Based on 1218 visits Based on 12010 visits
6B. Handling of expired drugs
Based on 12010 total visits
SPARS Performance Report Page 9
Published by:The Pharmacy DivisionData source: MMS data version 1.0
Ministry of HealthPlot 6 Lourdel RoadP.O.Box 7272KampalaUganda

Visitis to 50 HC4
7. Ordering, distribution and reporting from Health Facilities7A. Order calculations - Is the facility calculating the right quantity to order?
7B. Knowledge and application of VEN (Vital, Essential and Necessary)
Based on visits to 1156 different facilities Based on visits to 11396 different facilities
Based on 1218 visits in this period
and 25 Hospitals
SPARS Performance Report Page 10
Published by:The Pharmacy DivisionData source: MMS data version 1.0
Ministry of HealthPlot 6 Lourdel RoadP.O.Box 7272KampalaUganda

7D. Average lead time for HC4 and hospitals
National Medical Store Health Facility
36 days
Based on 1218 visits in this periodBased on 48 visits in this period
Based on 1218 visits in this period
SPARS Performance Report Page 11
Published by:The Pharmacy DivisionData source: MMS data version 1.0
Ministry of HealthPlot 6 Lourdel RoadP.O.Box 7272KampalaUganda

8. Dispensing Quality
Based on 12010 visits in total Based on 12010 visits in total
Based on 12010 visits in total
Based on 1218 visits in this period Based on 12010 visits in total
SPARS Performance Report Page 12
Published by:The Pharmacy DivisionData source: MMS data version 1.0
Ministry of HealthPlot 6 Lourdel RoadP.O.Box 7272KampalaUganda

9. Prescribing Quality
Based on 12010 visits in total
Based on 12010 visits in total Based on 12010 visits in total
Based on 12010 visits in total Based on 12010 visits in total
SPARS Performance Report Page 13
Published by:The Pharmacy DivisionData source: MMS data version 1.0
Ministry of HealthPlot 6 Lourdel RoadP.O.Box 7272KampalaUganda

10.Top facilities
Based on visits to 88 Hospitals Based on visits to 166 HC4
Based on visits to 974 HC3 Based on visits to 1464 HC2
SPARS Performance Report Page 14
Published by:The Pharmacy DivisionData source: MMS data version 1.0
Ministry of HealthPlot 6 Lourdel RoadP.O.Box 7272KampalaUganda